emplacement of the youngest flood lava on mars: a short, turbulent story
TRANSCRIPT
Icarus 205 (2010) 230–243
Contents lists available at ScienceDirect
Icarus
journal homepage: www.elsevier .com/ locate/ icarus
Emplacement of the youngest flood lava on Mars: A short, turbulent story
W.L. Jaeger a,*, L.P. Keszthelyi a, J.A. Skinner Jr. a, M.P. Milazzo a, A.S. McEwen b, T.N. Titus a, M.R. Rosiek a,D.M. Galuszka a, E. Howington-Kraus a, R.L. Kirk a, the HiRISE Teama US Geological Survey, 2255 N. Gemini Dr., Flagstaff, AZ 86001, United Statesb Lunar and Planetary Laboratory, University of Arizona, Tucson, AZ 85721, United States
a r t i c l e i n f o a b s t r a c t
Article history:Received 14 November 2008Revised 12 August 2009Accepted 2 September 2009Available online 29 September 2009
Keywords:Geological processesMars, SurfaceVolcanism
0019-1035/$ - see front matter � 2009 Published bydoi:10.1016/j.icarus.2009.09.011
* Corresponding author. Address: US Geological SuProgram, 2255 N. Gemini Dr., Flagstaff, AZ 86001, Un
E-mail address: [email protected] (W.L. Jaeger).
Recently acquired data from the High Resolution Imaging Science Experiment (HiRISE), Context (CTX)imager, and Compact Reconnaissance Imaging Spectrometer for Mars (CRISM) onboard the Mars Recon-naissance Orbiter (MRO) spacecraft were used to investigate the emplacement of the youngest flood-lavaflow on Mars. Careful mapping finds that the Athabasca Valles flood lava is the product of a single erup-tion, and it covers 250,000 km2 of western Elysium Planitia with an estimated 5000–7500 km3 of mafic orultramafic lava. Calculations utilizing topographic data enhanced with MRO observations to refine thedimensions of the channel system show that this flood lava was emplaced turbulently over a period ofonly a few to several weeks. This is the first well-documented example of a turbulently emplaced floodlava anywhere in the Solar System. However, MRO data suggest that this same process may have operatedin a number of martian channel systems. The magnitude and dynamics of these lava floods are similar tothe aqueous floods that are generally believed to have eroded the channels, raising the intriguing possi-bility that mechanical erosion by lava could have played a role in their incision.
� 2009 Published by Elsevier Inc.
1. Introduction
Flood lavas are very fluid lava flows that travel long distancesand spread out to cover broad areas (e.g., Richthofen, 1868; Geikie,1880; Washington, 1922; Tyrrell, 1937). They do not build tall vol-canoes by repeatedly erupting from a central vent. Instead, floodlavas issue from vast fissure systems and inundate the pre-existinglandscape, often leveling it by infilling basins and other low-lyingterrain.
The notion that flood lavas may be emplaced turbulently haswaxed and waned in the scientific literature over the past few dec-ades. The first quantitative study of flood-lava emplacement wasconducted by Shaw and Swanson (1970). Looking specifically atthe Roza Member of the Wanapum Basalt within the Columbia Riv-er Basalt Group (CRBG), they concluded from fluid dynamic calcu-lations that the 30-m-thick flow was emplaced as a turbulent floodover a period of weeks. They estimated the flux of lava to be of or-der 106 m3/s, which is comparable to the estimated flux of the cat-astrophic water floods that later carved the Channeled Scablandinto the CRBG (e.g., Baker, 1973). This paradigm was widely ac-cepted as the archetypal flood-lava emplacement mechanism formore than two decades (e.g., Hooper, 1982; Huppert and Sparks,1985; Reidel and Fecht, 1987; Reidel and Tolan, 1992). By exten-
Elsevier Inc.
rvey, Astrogeology Researchited States.
sion, the idea of turbulent lava flows was also applied to extrater-restrial lavas. For example, Hulme (1973) suggested that sinuousrilles on the Moon were carved by turbulent lava flows eruptedat high rates, and Komatsu et al. (1992) suggested a similar process(though one involving exotic lava compositions) for the formationof canali on Venus.
A paradigm shift away from turbulent emplacement began totake place in the mid 1990s, when the ‘‘inflation” process was doc-umented in active Hawaiian lava flows (Hon et al., 1994). By thisprocess, the solidified crust that floats on a molten sheet of lavais gradually lifted, as the molten layer thickens due to the contin-ued influx of fluid lava. Following the Hon et al. (1994) study,researchers identified features diagnostic of inflation in the sameCRBG unit that Shaw and Swanson (1970) had previously investi-gated (Self et al., 1996, 1997; Thordarson and Self, 1998). Fromthe thickness of the inflated (slowly lifted) crust, the eruptionduration was determined to be about a decade, corresponding toan average eruption rate in the range of 103–104 m3/s (e.g., Selfet al., 1997; Thordarson and Self, 1998). Subsequently, inflatedsheet flows were found to be common throughout the CRBG andin other flood lava provinces (Self et al., 1998). Therefore, the slowprocess of inflation was deemed the ‘‘standard way of emplacinglong lava flows” (i.e. the SWELL hypothesis) (Self et al., 1998).
Although the most detailed work on flood lavas is still thatderived from studies of terrestrial flows, an abundance of high-quality spacecraft data has spawned investigations of similarfeatures on other rocky bodies throughout the Solar System. To
W.L. Jaeger et al. / Icarus 205 (2010) 230–243 231
date, flood lavas in various stages of preservation have beenidentified on the Moon, Venus, Mars, the jovian moon Io, and(tentatively) Mercury (e.g., BVSP, 1981; Head and Coffin, 1997;Keszthelyi et al., 2006; Wilson and Head, 2008). Collectively,these extraterrestrial flood lavas show more diversity than is re-ported for Earth alone. For example, some flood lavas on Io ap-pear to be fed by lava tubes at rates of order 102 m3/s, whichis at least an order of magnitude slower than their terrestrialcounterparts (e.g., Keszthelyi et al., 2006). In contrast, manymartian flood lavas have physical characteristics suggestive ofrapidly emplaced sheet flows such as a surface of rafted platesand pressure ridges (Keszthelyi et al., 2000) that appear morpho-logically similar to pack ice (Murray et al., 2005). Preliminarymodeling by Keszthelyi et al. (2000, 2004) estimated the averageeruption rate for these ‘‘platy-ridged” martian flood lavas to beof order 104 m3/s, with surges to 105 m3/s, thus advancing theidea of rapid laminar emplacement.
While the discovery of platy-ridged lavas on Mars hasgreatly enhanced our understanding of the process of flood vol-canism, the quantitative modeling was limited by the inabilityto determine: (a) the dimensions of individual lava flows and(b) the details of the flow dynamics. These problems can nowbe addressed with the suite of instruments onboard the MarsReconnaissance Orbiter (MRO) spacecraft. In particular, the HighResolution Imaging Science Experiment (HiRISE) camera andthe Context (CTX) imager, allow the martian flood lavas to beinvestigated in an unprecedented combination of detail andbreadth.
Fig. 1. Location map of selected geographic features in Elysium Planitia. The basemap isdata. Key features referred to in the text, as well as other major landforms, are labeledheavily cratered southern highlands from the smoother northern lowlands, fluctuates wPlanitia. The smooth plains of Elysium Planitia are covered by lavas that erupted from teruption inundated Athabasca Valles (upper middle), the most pristine outflow channel sin Gusev crater (lower right), is employed to study this lava flow. Corinto crater lies jus
2. The Athabasca Valles flood lava
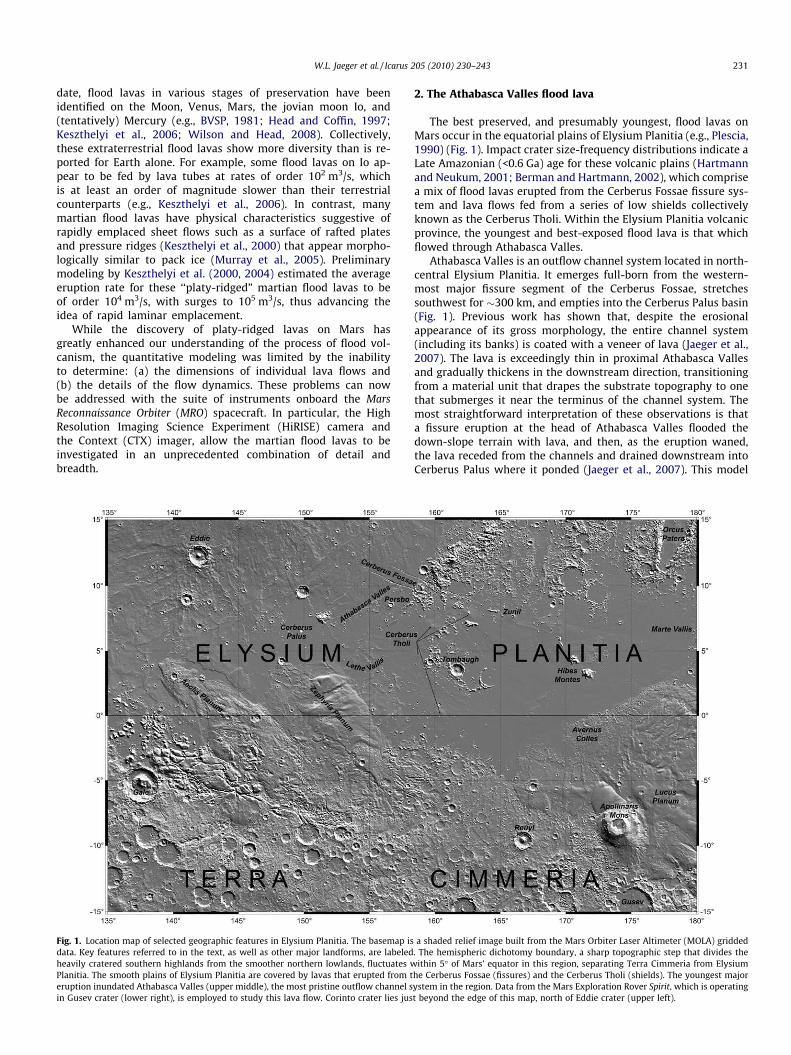
The best preserved, and presumably youngest, flood lavas onMars occur in the equatorial plains of Elysium Planitia (e.g., Plescia,1990) (Fig. 1). Impact crater size-frequency distributions indicate aLate Amazonian (<0.6 Ga) age for these volcanic plains (Hartmannand Neukum, 2001; Berman and Hartmann, 2002), which comprisea mix of flood lavas erupted from the Cerberus Fossae fissure sys-tem and lava flows fed from a series of low shields collectivelyknown as the Cerberus Tholi. Within the Elysium Planitia volcanicprovince, the youngest and best-exposed flood lava is that whichflowed through Athabasca Valles.
Athabasca Valles is an outflow channel system located in north-central Elysium Planitia. It emerges full-born from the western-most major fissure segment of the Cerberus Fossae, stretchessouthwest for �300 km, and empties into the Cerberus Palus basin(Fig. 1). Previous work has shown that, despite the erosionalappearance of its gross morphology, the entire channel system(including its banks) is coated with a veneer of lava (Jaeger et al.,2007). The lava is exceedingly thin in proximal Athabasca Vallesand gradually thickens in the downstream direction, transitioningfrom a material unit that drapes the substrate topography to onethat submerges it near the terminus of the channel system. Themost straightforward interpretation of these observations is thata fissure eruption at the head of Athabasca Valles flooded thedown-slope terrain with lava, and then, as the eruption waned,the lava receded from the channels and drained downstream intoCerberus Palus where it ponded (Jaeger et al., 2007). This model
a shaded relief image built from the Mars Orbiter Laser Altimeter (MOLA) gridded. The hemispheric dichotomy boundary, a sharp topographic step that divides theithin 5� of Mars’ equator in this region, separating Terra Cimmeria from Elysium
he Cerberus Fossae (fissures) and the Cerberus Tholi (shields). The youngest majorystem in the region. Data from the Mars Exploration Rover Spirit, which is operatingt beyond the edge of this map, north of Eddie crater (upper left).
232 W.L. Jaeger et al. / Icarus 205 (2010) 230–243
is concordant with all of the available data, including the superpo-sition and crosscutting relationships seen in the rootless cones(pseudocraters) that pepper the floor of Athabasca Valles (Jaegeret al., 2007, 2008). Thus, the flood lava that now occupies Athaba-sca Valles deflated, rather than inflated, in its proximal reaches be-fore solidifying. This emplacement style differs markedly from theSWELL hypothesis.
The emplacement of this flood lava occurred in a geological in-stant, producing a material unit with a specific lithology at a dis-tinct time horizon (i.e., a lithochronostratigraphic unit). Theconvention in terrestrial geology is to name such units by theirlocality and lithology (e.g., Wanapum Basalt). In this case, the obvi-ous locality is ‘‘Athabasca Valles”. The lithology, however, is moreelusive because of limited compositional information (see Sec-tion 2.2). All that can be said with certainty is that it is a flood lava.Therefore, we will refer to this unit herein as the Athabasca Vallesflood lava, with geologic map symbol abbreviation Aav, where ‘‘A”denotes that it is Amazonian in age (see Section 2.1) and ‘‘av” refersto Athabasca Valles.
2.1. Absolute and relative age relationships of Aav
The lava that coats the surface of Athabasca Valles is so youngthat there is a dearth of large impact craters with which to dateits surface. The craters that do exist are small (where crater pro-duction functions are least certain and target strength can havethe greatest effect), and those in the 10–100 m diameter rangeare dominated by secondaries from the rayed-crater Zunil (McE-wen et al., 2005). Berman and Hartmann (2002) derived an ageof <20 Ma for Aav, incorporating some of the uncertainties in smallcrater production rates. More recently, Murray et al. (2005) ob-tained a model age of 5 ± 2 Ma for the same unit; however, theyalso suggested that adjacent surfaces on this single flow show astatistically significant age difference of �1 Ma, raising questionsabout the adequacy of their reported uncertainties, especiallythose pertaining to the effect of target strength on the formationof small craters.
More robust, but looser, constraints on the absolute age of Aavcan be derived from larger impacts in the region. As noted above,the superposition of Zunil secondaries on Aav makes it incontro-vertible that Aav was emplaced prior to the Zunil impact event.Kreslavsky (2008) provided the most complete age estimate forZunil, including new results on the current cratering rate and theeffects of atmospheric breakup, resulting in a model age of�500 ka. In contrast, Aav has a more cryptic relationship with sec-ondaries from Corinto crater (16.9�N, 141.7�E) (McEwen et al., thisissue), which has a Hartmann-function crater age between 10 and100 Ma (unpublished data from McEwen et al.). In Thermal Emis-sion Imaging System nighttime IR data, wispy rays radial to Corintoextend across the Aav margin in Cerberus Palus. Higher resolutionvisible images confirm that these rays contain elevated concentra-tions of small, irregular (presumably secondary) craters. However,the small crater density within individual rays markedly decreaseswhere they cross onto Aav surfaces (cf. Mars Orbiter Camera imageM04-04121, CTX image P19_008463_1870_XN_07N212W andHiRISE observations PSP_007448_1845 and ESP_012788_1860).This is likely to be merely a target strength effect wherein theyoung lava surface is relatively resistant to small impacts, but itis also possible that the small craters observed on Aav are unre-lated to Corinto and that their spatial association with the night-time IR rays is coincidental. Thus, the absolute age of Aav is>0.5 Ma, based on the superposition of Zunil secondaries, andprobably >10 Ma, based on the tentative superposition of Corintosecondaries.
While remarkably pristine in morphology, the surface of theAthabasca Valles flood lava has been modified by a variety of geo-
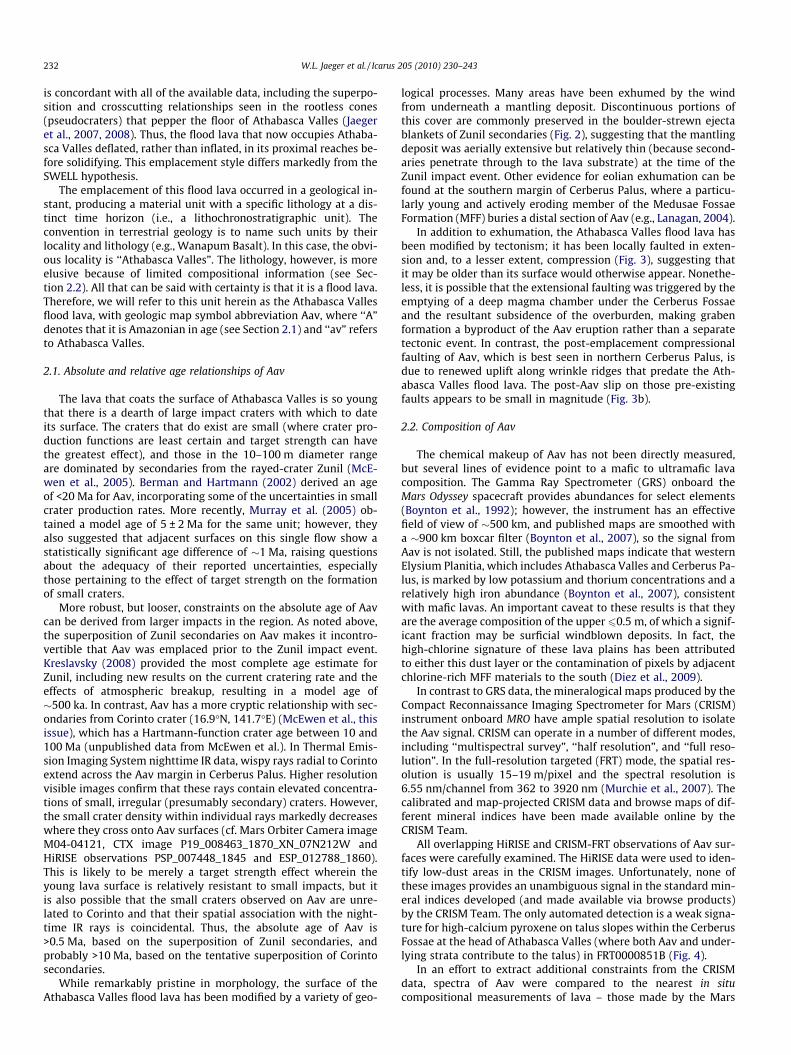
logical processes. Many areas have been exhumed by the windfrom underneath a mantling deposit. Discontinuous portions ofthis cover are commonly preserved in the boulder-strewn ejectablankets of Zunil secondaries (Fig. 2), suggesting that the mantlingdeposit was aerially extensive but relatively thin (because second-aries penetrate through to the lava substrate) at the time of theZunil impact event. Other evidence for eolian exhumation can befound at the southern margin of Cerberus Palus, where a particu-larly young and actively eroding member of the Medusae FossaeFormation (MFF) buries a distal section of Aav (e.g., Lanagan, 2004).
In addition to exhumation, the Athabasca Valles flood lava hasbeen modified by tectonism; it has been locally faulted in exten-sion and, to a lesser extent, compression (Fig. 3), suggesting thatit may be older than its surface would otherwise appear. Nonethe-less, it is possible that the extensional faulting was triggered by theemptying of a deep magma chamber under the Cerberus Fossaeand the resultant subsidence of the overburden, making grabenformation a byproduct of the Aav eruption rather than a separatetectonic event. In contrast, the post-emplacement compressionalfaulting of Aav, which is best seen in northern Cerberus Palus, isdue to renewed uplift along wrinkle ridges that predate the Ath-abasca Valles flood lava. The post-Aav slip on those pre-existingfaults appears to be small in magnitude (Fig. 3b).
2.2. Composition of Aav
The chemical makeup of Aav has not been directly measured,but several lines of evidence point to a mafic to ultramafic lavacomposition. The Gamma Ray Spectrometer (GRS) onboard theMars Odyssey spacecraft provides abundances for select elements(Boynton et al., 1992); however, the instrument has an effectivefield of view of �500 km, and published maps are smoothed witha �900 km boxcar filter (Boynton et al., 2007), so the signal fromAav is not isolated. Still, the published maps indicate that westernElysium Planitia, which includes Athabasca Valles and Cerberus Pa-lus, is marked by low potassium and thorium concentrations and arelatively high iron abundance (Boynton et al., 2007), consistentwith mafic lavas. An important caveat to these results is that theyare the average composition of the upper 60.5 m, of which a signif-icant fraction may be surficial windblown deposits. In fact, thehigh-chlorine signature of these lava plains has been attributedto either this dust layer or the contamination of pixels by adjacentchlorine-rich MFF materials to the south (Diez et al., 2009).
In contrast to GRS data, the mineralogical maps produced by theCompact Reconnaissance Imaging Spectrometer for Mars (CRISM)instrument onboard MRO have ample spatial resolution to isolatethe Aav signal. CRISM can operate in a number of different modes,including ‘‘multispectral survey”, ‘‘half resolution”, and ‘‘full reso-lution”. In the full-resolution targeted (FRT) mode, the spatial res-olution is usually 15–19 m/pixel and the spectral resolution is6.55 nm/channel from 362 to 3920 nm (Murchie et al., 2007). Thecalibrated and map-projected CRISM data and browse maps of dif-ferent mineral indices have been made available online by theCRISM Team.
All overlapping HiRISE and CRISM-FRT observations of Aav sur-faces were carefully examined. The HiRISE data were used to iden-tify low-dust areas in the CRISM images. Unfortunately, none ofthese images provides an unambiguous signal in the standard min-eral indices developed (and made available via browse products)by the CRISM Team. The only automated detection is a weak signa-ture for high-calcium pyroxene on talus slopes within the CerberusFossae at the head of Athabasca Valles (where both Aav and under-lying strata contribute to the talus) in FRT0000851B (Fig. 4).
In an effort to extract additional constraints from the CRISMdata, spectra of Aav were compared to the nearest in situcompositional measurements of lava – those made by the Mars
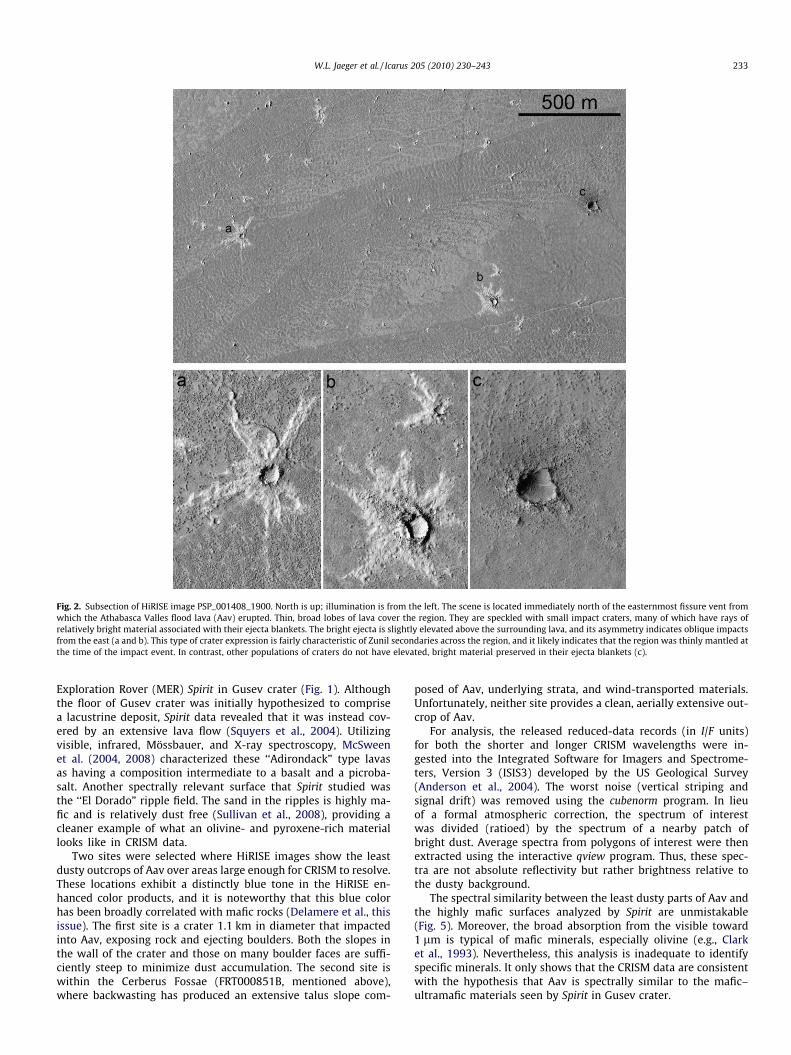
Fig. 2. Subsection of HiRISE image PSP_001408_1900. North is up; illumination is from the left. The scene is located immediately north of the easternmost fissure vent fromwhich the Athabasca Valles flood lava (Aav) erupted. Thin, broad lobes of lava cover the region. They are speckled with small impact craters, many of which have rays ofrelatively bright material associated with their ejecta blankets. The bright ejecta is slightly elevated above the surrounding lava, and its asymmetry indicates oblique impactsfrom the east (a and b). This type of crater expression is fairly characteristic of Zunil secondaries across the region, and it likely indicates that the region was thinly mantled atthe time of the impact event. In contrast, other populations of craters do not have elevated, bright material preserved in their ejecta blankets (c).
W.L. Jaeger et al. / Icarus 205 (2010) 230–243 233
Exploration Rover (MER) Spirit in Gusev crater (Fig. 1). Althoughthe floor of Gusev crater was initially hypothesized to comprisea lacustrine deposit, Spirit data revealed that it was instead cov-ered by an extensive lava flow (Squyers et al., 2004). Utilizingvisible, infrared, Mössbauer, and X-ray spectroscopy, McSweenet al. (2004, 2008) characterized these ‘‘Adirondack” type lavasas having a composition intermediate to a basalt and a picroba-salt. Another spectrally relevant surface that Spirit studied wasthe ‘‘El Dorado” ripple field. The sand in the ripples is highly ma-fic and is relatively dust free (Sullivan et al., 2008), providing acleaner example of what an olivine- and pyroxene-rich materiallooks like in CRISM data.
Two sites were selected where HiRISE images show the leastdusty outcrops of Aav over areas large enough for CRISM to resolve.These locations exhibit a distinctly blue tone in the HiRISE en-hanced color products, and it is noteworthy that this blue colorhas been broadly correlated with mafic rocks (Delamere et al., thisissue). The first site is a crater 1.1 km in diameter that impactedinto Aav, exposing rock and ejecting boulders. Both the slopes inthe wall of the crater and those on many boulder faces are suffi-ciently steep to minimize dust accumulation. The second site iswithin the Cerberus Fossae (FRT000851B, mentioned above),where backwasting has produced an extensive talus slope com-
posed of Aav, underlying strata, and wind-transported materials.Unfortunately, neither site provides a clean, aerially extensive out-crop of Aav.
For analysis, the released reduced-data records (in I/F units)for both the shorter and longer CRISM wavelengths were in-gested into the Integrated Software for Imagers and Spectrome-ters, Version 3 (ISIS3) developed by the US Geological Survey(Anderson et al., 2004). The worst noise (vertical striping andsignal drift) was removed using the cubenorm program. In lieuof a formal atmospheric correction, the spectrum of interestwas divided (ratioed) by the spectrum of a nearby patch ofbright dust. Average spectra from polygons of interest were thenextracted using the interactive qview program. Thus, these spec-tra are not absolute reflectivity but rather brightness relative tothe dusty background.
The spectral similarity between the least dusty parts of Aav andthe highly mafic surfaces analyzed by Spirit are unmistakable(Fig. 5). Moreover, the broad absorption from the visible toward1 lm is typical of mafic minerals, especially olivine (e.g., Clarket al., 1993). Nevertheless, this analysis is inadequate to identifyspecific minerals. It only shows that the CRISM data are consistentwith the hypothesis that Aav is spectrally similar to the mafic–ultramafic materials seen by Spirit in Gusev crater.
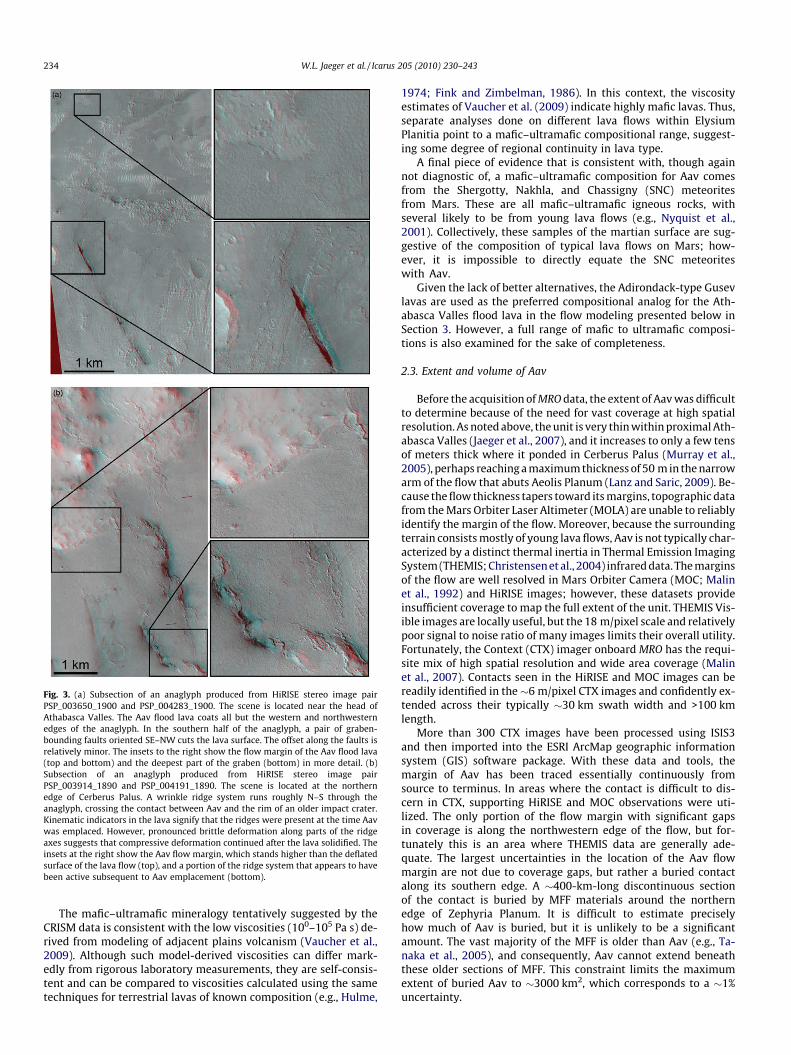
Fig. 3. (a) Subsection of an anaglyph produced from HiRISE stereo image pairPSP_003650_1900 and PSP_004283_1900. The scene is located near the head ofAthabasca Valles. The Aav flood lava coats all but the western and northwesternedges of the anaglyph. In the southern half of the anaglyph, a pair of graben-bounding faults oriented SE–NW cuts the lava surface. The offset along the faults isrelatively minor. The insets to the right show the flow margin of the Aav flood lava(top and bottom) and the deepest part of the graben (bottom) in more detail. (b)Subsection of an anaglyph produced from HiRISE stereo image pairPSP_003914_1890 and PSP_004191_1890. The scene is located at the northernedge of Cerberus Palus. A wrinkle ridge system runs roughly N–S through theanaglyph, crossing the contact between Aav and the rim of an older impact crater.Kinematic indicators in the lava signify that the ridges were present at the time Aavwas emplaced. However, pronounced brittle deformation along parts of the ridgeaxes suggests that compressive deformation continued after the lava solidified. Theinsets at the right show the Aav flow margin, which stands higher than the deflatedsurface of the lava flow (top), and a portion of the ridge system that appears to havebeen active subsequent to Aav emplacement (bottom).
234 W.L. Jaeger et al. / Icarus 205 (2010) 230–243
The mafic–ultramafic mineralogy tentatively suggested by theCRISM data is consistent with the low viscosities (100–105 Pa s) de-rived from modeling of adjacent plains volcanism (Vaucher et al.,2009). Although such model-derived viscosities can differ mark-edly from rigorous laboratory measurements, they are self-consis-tent and can be compared to viscosities calculated using the sametechniques for terrestrial lavas of known composition (e.g., Hulme,
1974; Fink and Zimbelman, 1986). In this context, the viscosityestimates of Vaucher et al. (2009) indicate highly mafic lavas. Thus,separate analyses done on different lava flows within ElysiumPlanitia point to a mafic–ultramafic compositional range, suggest-ing some degree of regional continuity in lava type.
A final piece of evidence that is consistent with, though againnot diagnostic of, a mafic–ultramafic composition for Aav comesfrom the Shergotty, Nakhla, and Chassigny (SNC) meteoritesfrom Mars. These are all mafic–ultramafic igneous rocks, withseveral likely to be from young lava flows (e.g., Nyquist et al.,2001). Collectively, these samples of the martian surface are sug-gestive of the composition of typical lava flows on Mars; how-ever, it is impossible to directly equate the SNC meteoriteswith Aav.
Given the lack of better alternatives, the Adirondack-type Gusevlavas are used as the preferred compositional analog for the Ath-abasca Valles flood lava in the flow modeling presented below inSection 3. However, a full range of mafic to ultramafic composi-tions is also examined for the sake of completeness.
2.3. Extent and volume of Aav
Before the acquisition of MRO data, the extent of Aav was difficultto determine because of the need for vast coverage at high spatialresolution. As noted above, the unit is very thin within proximal Ath-abasca Valles (Jaeger et al., 2007), and it increases to only a few tensof meters thick where it ponded in Cerberus Palus (Murray et al.,2005), perhaps reaching a maximum thickness of 50 m in the narrowarm of the flow that abuts Aeolis Planum (Lanz and Saric, 2009). Be-cause the flow thickness tapers toward its margins, topographic datafrom the Mars Orbiter Laser Altimeter (MOLA) are unable to reliablyidentify the margin of the flow. Moreover, because the surroundingterrain consists mostly of young lava flows, Aav is not typically char-acterized by a distinct thermal inertia in Thermal Emission ImagingSystem (THEMIS; Christensen et al., 2004) infrared data. The marginsof the flow are well resolved in Mars Orbiter Camera (MOC; Malinet al., 1992) and HiRISE images; however, these datasets provideinsufficient coverage to map the full extent of the unit. THEMIS Vis-ible images are locally useful, but the 18 m/pixel scale and relativelypoor signal to noise ratio of many images limits their overall utility.Fortunately, the Context (CTX) imager onboard MRO has the requi-site mix of high spatial resolution and wide area coverage (Malinet al., 2007). Contacts seen in the HiRISE and MOC images can bereadily identified in the�6 m/pixel CTX images and confidently ex-tended across their typically �30 km swath width and >100 kmlength.
More than 300 CTX images have been processed using ISIS3and then imported into the ESRI ArcMap geographic informationsystem (GIS) software package. With these data and tools, themargin of Aav has been traced essentially continuously fromsource to terminus. In areas where the contact is difficult to dis-cern in CTX, supporting HiRISE and MOC observations were uti-lized. The only portion of the flow margin with significant gapsin coverage is along the northwestern edge of the flow, but for-tunately this is an area where THEMIS data are generally ade-quate. The largest uncertainties in the location of the Aav flowmargin are not due to coverage gaps, but rather a buried contactalong its southern edge. A �400-km-long discontinuous sectionof the contact is buried by MFF materials around the northernedge of Zephyria Planum. It is difficult to estimate preciselyhow much of Aav is buried, but it is unlikely to be a significantamount. The vast majority of the MFF is older than Aav (e.g., Ta-naka et al., 2005), and consequently, Aav cannot extend beneaththese older sections of MFF. This constraint limits the maximumextent of buried Aav to �3000 km2, which corresponds to a �1%uncertainty.
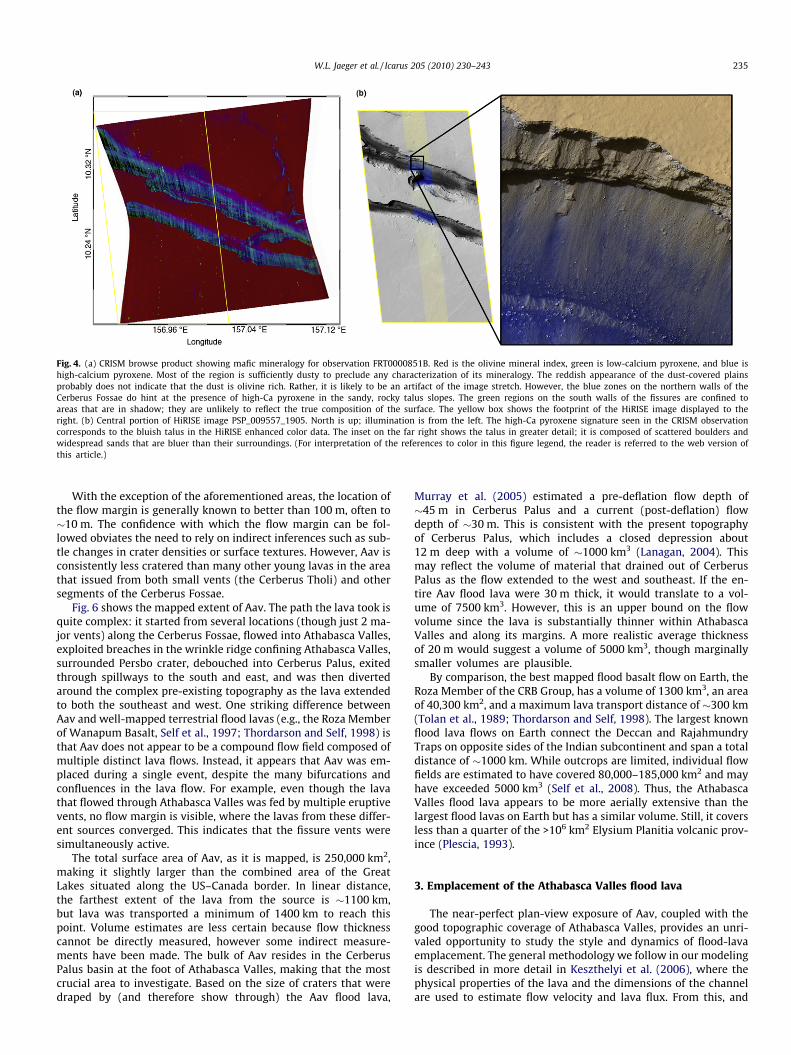
Fig. 4. (a) CRISM browse product showing mafic mineralogy for observation FRT0000851B. Red is the olivine mineral index, green is low-calcium pyroxene, and blue ishigh-calcium pyroxene. Most of the region is sufficiently dusty to preclude any characterization of its mineralogy. The reddish appearance of the dust-covered plainsprobably does not indicate that the dust is olivine rich. Rather, it is likely to be an artifact of the image stretch. However, the blue zones on the northern walls of theCerberus Fossae do hint at the presence of high-Ca pyroxene in the sandy, rocky talus slopes. The green regions on the south walls of the fissures are confined toareas that are in shadow; they are unlikely to reflect the true composition of the surface. The yellow box shows the footprint of the HiRISE image displayed to theright. (b) Central portion of HiRISE image PSP_009557_1905. North is up; illumination is from the left. The high-Ca pyroxene signature seen in the CRISM observationcorresponds to the bluish talus in the HiRISE enhanced color data. The inset on the far right shows the talus in greater detail; it is composed of scattered boulders andwidespread sands that are bluer than their surroundings. (For interpretation of the references to color in this figure legend, the reader is referred to the web version ofthis article.)
W.L. Jaeger et al. / Icarus 205 (2010) 230–243 235
With the exception of the aforementioned areas, the location ofthe flow margin is generally known to better than 100 m, often to�10 m. The confidence with which the flow margin can be fol-lowed obviates the need to rely on indirect inferences such as sub-tle changes in crater densities or surface textures. However, Aav isconsistently less cratered than many other young lavas in the areathat issued from both small vents (the Cerberus Tholi) and othersegments of the Cerberus Fossae.
Fig. 6 shows the mapped extent of Aav. The path the lava took isquite complex: it started from several locations (though just 2 ma-jor vents) along the Cerberus Fossae, flowed into Athabasca Valles,exploited breaches in the wrinkle ridge confining Athabasca Valles,surrounded Persbo crater, debouched into Cerberus Palus, exitedthrough spillways to the south and east, and was then divertedaround the complex pre-existing topography as the lava extendedto both the southeast and west. One striking difference betweenAav and well-mapped terrestrial flood lavas (e.g., the Roza Memberof Wanapum Basalt, Self et al., 1997; Thordarson and Self, 1998) isthat Aav does not appear to be a compound flow field composed ofmultiple distinct lava flows. Instead, it appears that Aav was em-placed during a single event, despite the many bifurcations andconfluences in the lava flow. For example, even though the lavathat flowed through Athabasca Valles was fed by multiple eruptivevents, no flow margin is visible, where the lavas from these differ-ent sources converged. This indicates that the fissure vents weresimultaneously active.
The total surface area of Aav, as it is mapped, is 250,000 km2,making it slightly larger than the combined area of the GreatLakes situated along the US–Canada border. In linear distance,the farthest extent of the lava from the source is �1100 km,but lava was transported a minimum of 1400 km to reach thispoint. Volume estimates are less certain because flow thicknesscannot be directly measured, however some indirect measure-ments have been made. The bulk of Aav resides in the CerberusPalus basin at the foot of Athabasca Valles, making that the mostcrucial area to investigate. Based on the size of craters that weredraped by (and therefore show through) the Aav flood lava,
Murray et al. (2005) estimated a pre-deflation flow depth of�45 m in Cerberus Palus and a current (post-deflation) flowdepth of �30 m. This is consistent with the present topographyof Cerberus Palus, which includes a closed depression about12 m deep with a volume of �1000 km3 (Lanagan, 2004). Thismay reflect the volume of material that drained out of CerberusPalus as the flow extended to the west and southeast. If the en-tire Aav flood lava were 30 m thick, it would translate to a vol-ume of 7500 km3. However, this is an upper bound on the flowvolume since the lava is substantially thinner within AthabascaValles and along its margins. A more realistic average thicknessof 20 m would suggest a volume of 5000 km3, though marginallysmaller volumes are plausible.
By comparison, the best mapped flood basalt flow on Earth, theRoza Member of the CRB Group, has a volume of 1300 km3, an areaof 40,300 km2, and a maximum lava transport distance of �300 km(Tolan et al., 1989; Thordarson and Self, 1998). The largest knownflood lava flows on Earth connect the Deccan and RajahmundryTraps on opposite sides of the Indian subcontinent and span a totaldistance of �1000 km. While outcrops are limited, individual flowfields are estimated to have covered 80,000–185,000 km2 and mayhave exceeded 5000 km3 (Self et al., 2008). Thus, the AthabascaValles flood lava appears to be more aerially extensive than thelargest flood lavas on Earth but has a similar volume. Still, it coversless than a quarter of the >106 km2 Elysium Planitia volcanic prov-ince (Plescia, 1993).
3. Emplacement of the Athabasca Valles flood lava
The near-perfect plan-view exposure of Aav, coupled with thegood topographic coverage of Athabasca Valles, provides an unri-valed opportunity to study the style and dynamics of flood-lavaemplacement. The general methodology we follow in our modelingis described in more detail in Keszthelyi et al. (2006), where thephysical properties of the lava and the dimensions of the channelare used to estimate flow velocity and lava flux. From this, and
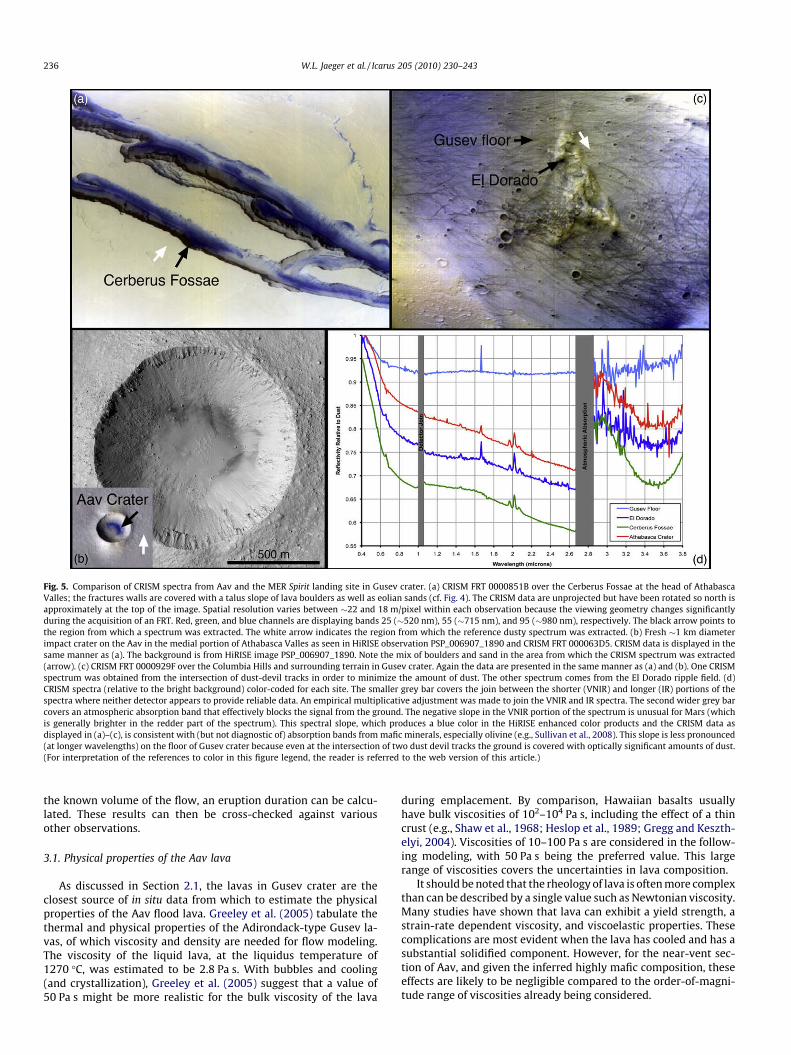
Fig. 5. Comparison of CRISM spectra from Aav and the MER Spirit landing site in Gusev crater. (a) CRISM FRT 0000851B over the Cerberus Fossae at the head of AthabascaValles; the fractures walls are covered with a talus slope of lava boulders as well as eolian sands (cf. Fig. 4). The CRISM data are unprojected but have been rotated so north isapproximately at the top of the image. Spatial resolution varies between �22 and 18 m/pixel within each observation because the viewing geometry changes significantlyduring the acquisition of an FRT. Red, green, and blue channels are displaying bands 25 (�520 nm), 55 (�715 nm), and 95 (�980 nm), respectively. The black arrow points tothe region from which a spectrum was extracted. The white arrow indicates the region from which the reference dusty spectrum was extracted. (b) Fresh �1 km diameterimpact crater on the Aav in the medial portion of Athabasca Valles as seen in HiRISE observation PSP_006907_1890 and CRISM FRT 000063D5. CRISM data is displayed in thesame manner as (a). The background is from HiRISE image PSP_006907_1890. Note the mix of boulders and sand in the area from which the CRISM spectrum was extracted(arrow). (c) CRISM FRT 0000929F over the Columbia Hills and surrounding terrain in Gusev crater. Again the data are presented in the same manner as (a) and (b). One CRISMspectrum was obtained from the intersection of dust-devil tracks in order to minimize the amount of dust. The other spectrum comes from the El Dorado ripple field. (d)CRISM spectra (relative to the bright background) color-coded for each site. The smaller grey bar covers the join between the shorter (VNIR) and longer (IR) portions of thespectra where neither detector appears to provide reliable data. An empirical multiplicative adjustment was made to join the VNIR and IR spectra. The second wider grey barcovers an atmospheric absorption band that effectively blocks the signal from the ground. The negative slope in the VNIR portion of the spectrum is unusual for Mars (whichis generally brighter in the redder part of the spectrum). This spectral slope, which produces a blue color in the HiRISE enhanced color products and the CRISM data asdisplayed in (a)–(c), is consistent with (but not diagnostic of) absorption bands from mafic minerals, especially olivine (e.g., Sullivan et al., 2008). This slope is less pronounced(at longer wavelengths) on the floor of Gusev crater because even at the intersection of two dust devil tracks the ground is covered with optically significant amounts of dust.(For interpretation of the references to color in this figure legend, the reader is referred to the web version of this article.)
236 W.L. Jaeger et al. / Icarus 205 (2010) 230–243
the known volume of the flow, an eruption duration can be calcu-lated. These results can then be cross-checked against variousother observations.
3.1. Physical properties of the Aav lava
As discussed in Section 2.1, the lavas in Gusev crater are theclosest source of in situ data from which to estimate the physicalproperties of the Aav flood lava. Greeley et al. (2005) tabulate thethermal and physical properties of the Adirondack-type Gusev la-vas, of which viscosity and density are needed for flow modeling.The viscosity of the liquid lava, at the liquidus temperature of1270 �C, was estimated to be 2.8 Pa s. With bubbles and cooling(and crystallization), Greeley et al. (2005) suggest that a value of50 Pa s might be more realistic for the bulk viscosity of the lava
during emplacement. By comparison, Hawaiian basalts usuallyhave bulk viscosities of 102–104 Pa s, including the effect of a thincrust (e.g., Shaw et al., 1968; Heslop et al., 1989; Gregg and Keszth-elyi, 2004). Viscosities of 10–100 Pa s are considered in the follow-ing modeling, with 50 Pa s being the preferred value. This largerange of viscosities covers the uncertainties in lava composition.
It should be noted that the rheology of lava is often more complexthan can be described by a single value such as Newtonian viscosity.Many studies have shown that lava can exhibit a yield strength, astrain-rate dependent viscosity, and viscoelastic properties. Thesecomplications are most evident when the lava has cooled and has asubstantial solidified component. However, for the near-vent sec-tion of Aav, and given the inferred highly mafic composition, theseeffects are likely to be negligible compared to the order-of-magni-tude range of viscosities already being considered.
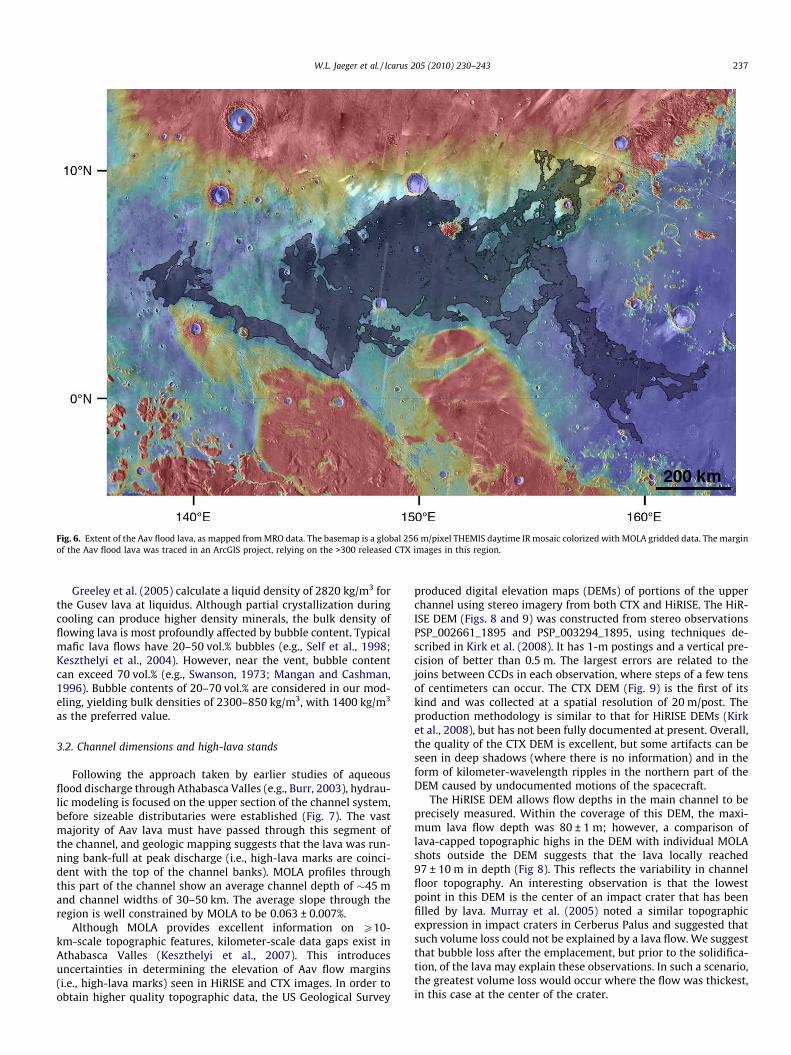
Fig. 6. Extent of the Aav flood lava, as mapped from MRO data. The basemap is a global 256 m/pixel THEMIS daytime IR mosaic colorized with MOLA gridded data. The marginof the Aav flood lava was traced in an ArcGIS project, relying on the >300 released CTX images in this region.
W.L. Jaeger et al. / Icarus 205 (2010) 230–243 237
Greeley et al. (2005) calculate a liquid density of 2820 kg/m3 forthe Gusev lava at liquidus. Although partial crystallization duringcooling can produce higher density minerals, the bulk density offlowing lava is most profoundly affected by bubble content. Typicalmafic lava flows have 20–50 vol.% bubbles (e.g., Self et al., 1998;Keszthelyi et al., 2004). However, near the vent, bubble contentcan exceed 70 vol.% (e.g., Swanson, 1973; Mangan and Cashman,1996). Bubble contents of 20–70 vol.% are considered in our mod-eling, yielding bulk densities of 2300–850 kg/m3, with 1400 kg/m3
as the preferred value.
3.2. Channel dimensions and high-lava stands
Following the approach taken by earlier studies of aqueousflood discharge through Athabasca Valles (e.g., Burr, 2003), hydrau-lic modeling is focused on the upper section of the channel system,before sizeable distributaries were established (Fig. 7). The vastmajority of Aav lava must have passed through this segment ofthe channel, and geologic mapping suggests that the lava was run-ning bank-full at peak discharge (i.e., high-lava marks are coinci-dent with the top of the channel banks). MOLA profiles throughthis part of the channel show an average channel depth of �45 mand channel widths of 30–50 km. The average slope through theregion is well constrained by MOLA to be 0.063 ± 0.007%.
Although MOLA provides excellent information on P10-km-scale topographic features, kilometer-scale data gaps exist inAthabasca Valles (Keszthelyi et al., 2007). This introducesuncertainties in determining the elevation of Aav flow margins(i.e., high-lava marks) seen in HiRISE and CTX images. In order toobtain higher quality topographic data, the US Geological Survey
produced digital elevation maps (DEMs) of portions of the upperchannel using stereo imagery from both CTX and HiRISE. The HiR-ISE DEM (Figs. 8 and 9) was constructed from stereo observationsPSP_002661_1895 and PSP_003294_1895, using techniques de-scribed in Kirk et al. (2008). It has 1-m postings and a vertical pre-cision of better than 0.5 m. The largest errors are related to thejoins between CCDs in each observation, where steps of a few tensof centimeters can occur. The CTX DEM (Fig. 9) is the first of itskind and was collected at a spatial resolution of 20 m/post. Theproduction methodology is similar to that for HiRISE DEMs (Kirket al., 2008), but has not been fully documented at present. Overall,the quality of the CTX DEM is excellent, but some artifacts can beseen in deep shadows (where there is no information) and in theform of kilometer-wavelength ripples in the northern part of theDEM caused by undocumented motions of the spacecraft.
The HiRISE DEM allows flow depths in the main channel to beprecisely measured. Within the coverage of this DEM, the maxi-mum lava flow depth was 80 ± 1 m; however, a comparison oflava-capped topographic highs in the DEM with individual MOLAshots outside the DEM suggests that the lava locally reached97 ± 10 m in depth (Fig 8). This reflects the variability in channelfloor topography. An interesting observation is that the lowestpoint in this DEM is the center of an impact crater that has beenfilled by lava. Murray et al. (2005) noted a similar topographicexpression in impact craters in Cerberus Palus and suggested thatsuch volume loss could not be explained by a lava flow. We suggestthat bubble loss after the emplacement, but prior to the solidifica-tion, of the lava may explain these observations. In such a scenario,the greatest volume loss would occur where the flow was thickest,in this case at the center of the crater.
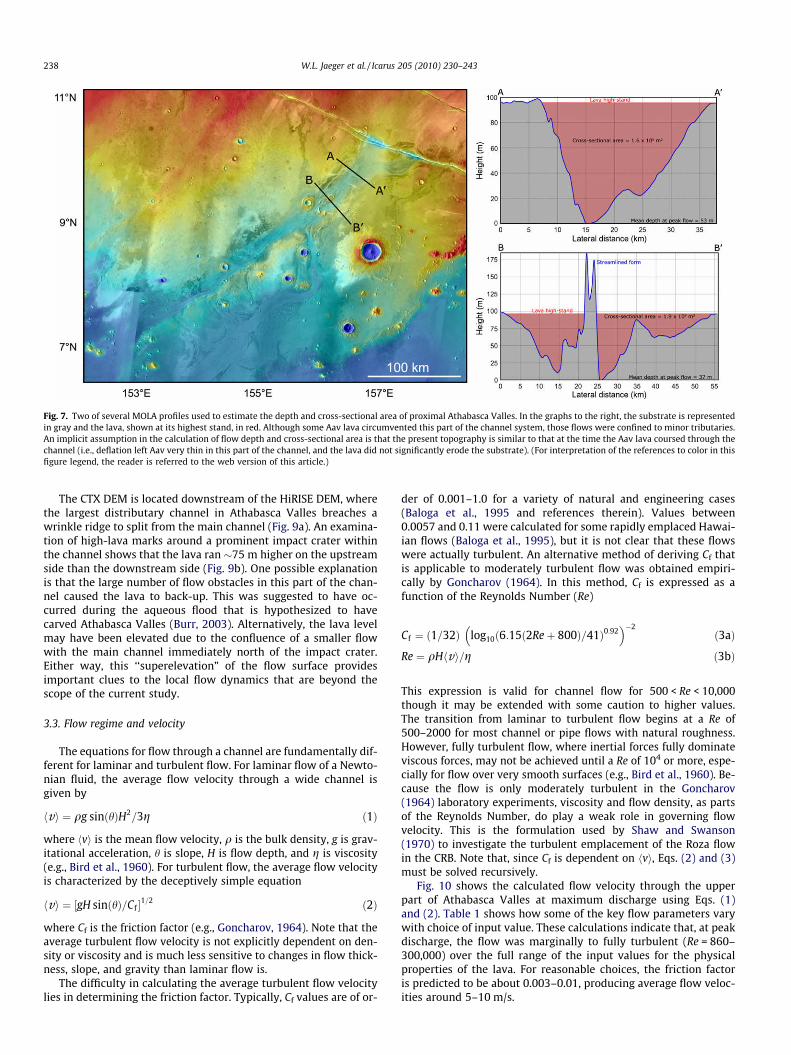
Fig. 7. Two of several MOLA profiles used to estimate the depth and cross-sectional area of proximal Athabasca Valles. In the graphs to the right, the substrate is representedin gray and the lava, shown at its highest stand, in red. Although some Aav lava circumvented this part of the channel system, those flows were confined to minor tributaries.An implicit assumption in the calculation of flow depth and cross-sectional area is that the present topography is similar to that at the time the Aav lava coursed through thechannel (i.e., deflation left Aav very thin in this part of the channel, and the lava did not significantly erode the substrate). (For interpretation of the references to color in thisfigure legend, the reader is referred to the web version of this article.)
238 W.L. Jaeger et al. / Icarus 205 (2010) 230–243
The CTX DEM is located downstream of the HiRISE DEM, wherethe largest distributary channel in Athabasca Valles breaches awrinkle ridge to split from the main channel (Fig. 9a). An examina-tion of high-lava marks around a prominent impact crater withinthe channel shows that the lava ran �75 m higher on the upstreamside than the downstream side (Fig. 9b). One possible explanationis that the large number of flow obstacles in this part of the chan-nel caused the lava to back-up. This was suggested to have oc-curred during the aqueous flood that is hypothesized to havecarved Athabasca Valles (Burr, 2003). Alternatively, the lava levelmay have been elevated due to the confluence of a smaller flowwith the main channel immediately north of the impact crater.Either way, this ‘‘superelevation” of the flow surface providesimportant clues to the local flow dynamics that are beyond thescope of the current study.
3.3. Flow regime and velocity
The equations for flow through a channel are fundamentally dif-ferent for laminar and turbulent flow. For laminar flow of a Newto-nian fluid, the average flow velocity through a wide channel isgiven by
hvi ¼ qg sinðhÞH2=3g ð1Þ
where hvi is the mean flow velocity, q is the bulk density, g is grav-itational acceleration, h is slope, H is flow depth, and g is viscosity(e.g., Bird et al., 1960). For turbulent flow, the average flow velocityis characterized by the deceptively simple equation
hvi ¼ gH sinðhÞ=Cf½ �1=2 ð2Þ
where Cf is the friction factor (e.g., Goncharov, 1964). Note that theaverage turbulent flow velocity is not explicitly dependent on den-sity or viscosity and is much less sensitive to changes in flow thick-ness, slope, and gravity than laminar flow is.
The difficulty in calculating the average turbulent flow velocitylies in determining the friction factor. Typically, Cf values are of or-
der of 0.001–1.0 for a variety of natural and engineering cases(Baloga et al., 1995 and references therein). Values between0.0057 and 0.11 were calculated for some rapidly emplaced Hawai-ian flows (Baloga et al., 1995), but it is not clear that these flowswere actually turbulent. An alternative method of deriving Cf thatis applicable to moderately turbulent flow was obtained empiri-cally by Goncharov (1964). In this method, Cf is expressed as afunction of the Reynolds Number (Re)
Cf ¼ ð1=32Þ log10ð6:15ð2Reþ 800Þ=41Þ0:92� ��2
ð3aÞ
Re ¼ qHhvi=g ð3bÞ
This expression is valid for channel flow for 500 < Re < 10,000though it may be extended with some caution to higher values.The transition from laminar to turbulent flow begins at a Re of500–2000 for most channel or pipe flows with natural roughness.However, fully turbulent flow, where inertial forces fully dominateviscous forces, may not be achieved until a Re of 104 or more, espe-cially for flow over very smooth surfaces (e.g., Bird et al., 1960). Be-cause the flow is only moderately turbulent in the Goncharov(1964) laboratory experiments, viscosity and flow density, as partsof the Reynolds Number, do play a weak role in governing flowvelocity. This is the formulation used by Shaw and Swanson(1970) to investigate the turbulent emplacement of the Roza flowin the CRB. Note that, since Cf is dependent on hvi, Eqs. (2) and (3)must be solved recursively.
Fig. 10 shows the calculated flow velocity through the upperpart of Athabasca Valles at maximum discharge using Eqs. (1)and (2). Table 1 shows how some of the key flow parameters varywith choice of input value. These calculations indicate that, at peakdischarge, the flow was marginally to fully turbulent (Re = 860–300,000) over the full range of the input values for the physicalproperties of the lava. For reasonable choices, the friction factoris predicted to be about 0.003–0.01, producing average flow veloc-ities around 5–10 m/s.
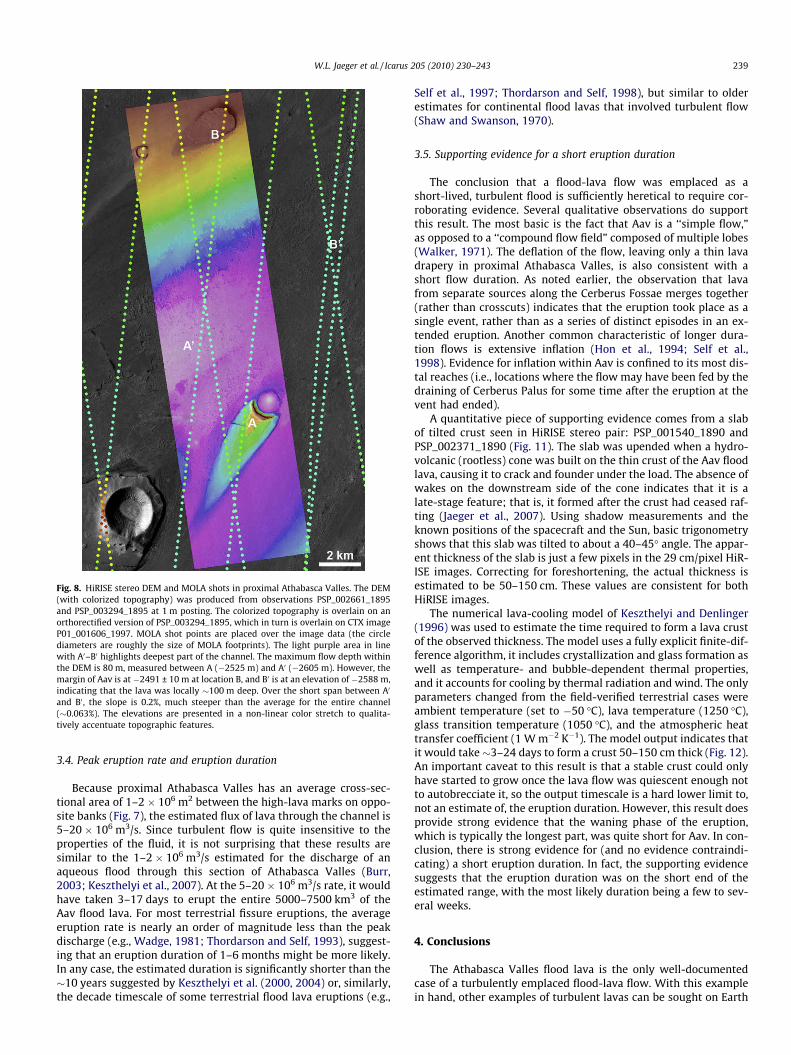
Fig. 8. HiRISE stereo DEM and MOLA shots in proximal Athabasca Valles. The DEM(with colorized topography) was produced from observations PSP_002661_1895and PSP_003294_1895 at 1 m posting. The colorized topography is overlain on anorthorectified version of PSP_003294_1895, which in turn is overlain on CTX imageP01_001606_1997. MOLA shot points are placed over the image data (the circlediameters are roughly the size of MOLA footprints). The light purple area in linewith A0–B0 highlights deepest part of the channel. The maximum flow depth withinthe DEM is 80 m, measured between A (�2525 m) and A0 (�2605 m). However, themargin of Aav is at �2491 ± 10 m at location B, and B0 is at an elevation of �2588 m,indicating that the lava was locally �100 m deep. Over the short span between A0
and B0 , the slope is 0.2%, much steeper than the average for the entire channel(�0.063%). The elevations are presented in a non-linear color stretch to qualita-tively accentuate topographic features.
W.L. Jaeger et al. / Icarus 205 (2010) 230–243 239
3.4. Peak eruption rate and eruption duration
Because proximal Athabasca Valles has an average cross-sec-tional area of 1–2 � 106 m2 between the high-lava marks on oppo-site banks (Fig. 7), the estimated flux of lava through the channel is5–20 � 106 m3/s. Since turbulent flow is quite insensitive to theproperties of the fluid, it is not surprising that these results aresimilar to the 1–2 � 106 m3/s estimated for the discharge of anaqueous flood through this section of Athabasca Valles (Burr,2003; Keszthelyi et al., 2007). At the 5–20 � 106 m3/s rate, it wouldhave taken 3–17 days to erupt the entire 5000–7500 km3 of theAav flood lava. For most terrestrial fissure eruptions, the averageeruption rate is nearly an order of magnitude less than the peakdischarge (e.g., Wadge, 1981; Thordarson and Self, 1993), suggest-ing that an eruption duration of 1–6 months might be more likely.In any case, the estimated duration is significantly shorter than the�10 years suggested by Keszthelyi et al. (2000, 2004) or, similarly,the decade timescale of some terrestrial flood lava eruptions (e.g.,
Self et al., 1997; Thordarson and Self, 1998), but similar to olderestimates for continental flood lavas that involved turbulent flow(Shaw and Swanson, 1970).
3.5. Supporting evidence for a short eruption duration
The conclusion that a flood-lava flow was emplaced as ashort-lived, turbulent flood is sufficiently heretical to require cor-roborating evidence. Several qualitative observations do supportthis result. The most basic is the fact that Aav is a ‘‘simple flow,”as opposed to a ‘‘compound flow field” composed of multiple lobes(Walker, 1971). The deflation of the flow, leaving only a thin lavadrapery in proximal Athabasca Valles, is also consistent with ashort flow duration. As noted earlier, the observation that lavafrom separate sources along the Cerberus Fossae merges together(rather than crosscuts) indicates that the eruption took place as asingle event, rather than as a series of distinct episodes in an ex-tended eruption. Another common characteristic of longer dura-tion flows is extensive inflation (Hon et al., 1994; Self et al.,1998). Evidence for inflation within Aav is confined to its most dis-tal reaches (i.e., locations where the flow may have been fed by thedraining of Cerberus Palus for some time after the eruption at thevent had ended).
A quantitative piece of supporting evidence comes from a slabof tilted crust seen in HiRISE stereo pair: PSP_001540_1890 andPSP_002371_1890 (Fig. 11). The slab was upended when a hydro-volcanic (rootless) cone was built on the thin crust of the Aav floodlava, causing it to crack and founder under the load. The absence ofwakes on the downstream side of the cone indicates that it is alate-stage feature; that is, it formed after the crust had ceased raf-ting (Jaeger et al., 2007). Using shadow measurements and theknown positions of the spacecraft and the Sun, basic trigonometryshows that this slab was tilted to about a 40–45� angle. The appar-ent thickness of the slab is just a few pixels in the 29 cm/pixel HiR-ISE images. Correcting for foreshortening, the actual thickness isestimated to be 50–150 cm. These values are consistent for bothHiRISE images.
The numerical lava-cooling model of Keszthelyi and Denlinger(1996) was used to estimate the time required to form a lava crustof the observed thickness. The model uses a fully explicit finite-dif-ference algorithm, it includes crystallization and glass formation aswell as temperature- and bubble-dependent thermal properties,and it accounts for cooling by thermal radiation and wind. The onlyparameters changed from the field-verified terrestrial cases wereambient temperature (set to �50 �C), lava temperature (1250 �C),glass transition temperature (1050 �C), and the atmospheric heattransfer coefficient (1 W m�2 K�1). The model output indicates thatit would take�3–24 days to form a crust 50–150 cm thick (Fig. 12).An important caveat to this result is that a stable crust could onlyhave started to grow once the lava flow was quiescent enough notto autobrecciate it, so the output timescale is a hard lower limit to,not an estimate of, the eruption duration. However, this result doesprovide strong evidence that the waning phase of the eruption,which is typically the longest part, was quite short for Aav. In con-clusion, there is strong evidence for (and no evidence contraindi-cating) a short eruption duration. In fact, the supporting evidencesuggests that the eruption duration was on the short end of theestimated range, with the most likely duration being a few to sev-eral weeks.
4. Conclusions
The Athabasca Valles flood lava is the only well-documentedcase of a turbulently emplaced flood-lava flow. With this examplein hand, other examples of turbulent lavas can be sought on Earth
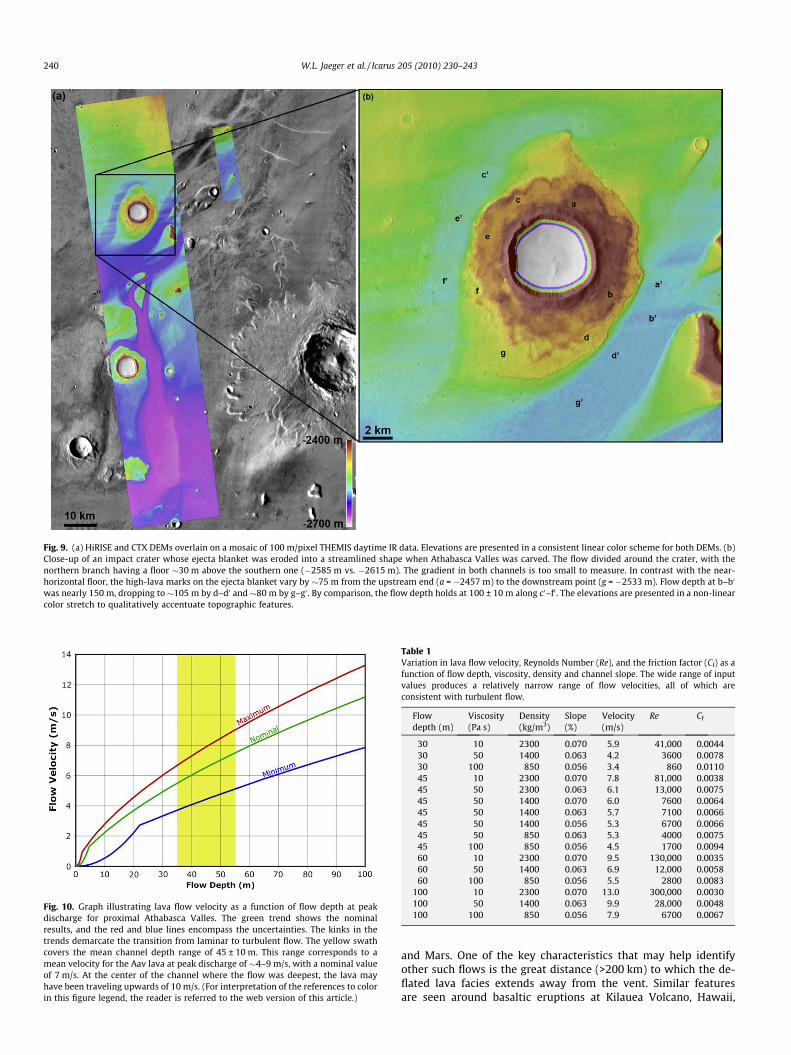
Fig. 9. (a) HiRISE and CTX DEMs overlain on a mosaic of 100 m/pixel THEMIS daytime IR data. Elevations are presented in a consistent linear color scheme for both DEMs. (b)Close-up of an impact crater whose ejecta blanket was eroded into a streamlined shape when Athabasca Valles was carved. The flow divided around the crater, with thenorthern branch having a floor �30 m above the southern one (�2585 m vs. �2615 m). The gradient in both channels is too small to measure. In contrast with the near-horizontal floor, the high-lava marks on the ejecta blanket vary by �75 m from the upstream end (a = �2457 m) to the downstream point (g = �2533 m). Flow depth at b–b0
was nearly 150 m, dropping to �105 m by d–d0 and �80 m by g–g0 . By comparison, the flow depth holds at 100 ± 10 m along c0–f0 . The elevations are presented in a non-linearcolor stretch to qualitatively accentuate topographic features.
Fig. 10. Graph illustrating lava flow velocity as a function of flow depth at peakdischarge for proximal Athabasca Valles. The green trend shows the nominalresults, and the red and blue lines encompass the uncertainties. The kinks in thetrends demarcate the transition from laminar to turbulent flow. The yellow swathcovers the mean channel depth range of 45 ± 10 m. This range corresponds to amean velocity for the Aav lava at peak discharge of �4–9 m/s, with a nominal valueof 7 m/s. At the center of the channel where the flow was deepest, the lava mayhave been traveling upwards of 10 m/s. (For interpretation of the references to colorin this figure legend, the reader is referred to the web version of this article.)
Table 1Variation in lava flow velocity, Reynolds Number (Re), and the friction factor (Cf) as afunction of flow depth, viscosity, density and channel slope. The wide range of inputvalues produces a relatively narrow range of flow velocities, all of which areconsistent with turbulent flow.
Flowdepth (m)
Viscosity(Pa s)
Density(kg/m3)
Slope(%)
Velocity(m/s)
Re Cf
30 10 2300 0.070 5.9 41,000 0.004430 50 1400 0.063 4.2 3600 0.007830 100 850 0.056 3.4 860 0.011045 10 2300 0.070 7.8 81,000 0.003845 50 2300 0.063 6.1 13,000 0.007545 50 1400 0.070 6.0 7600 0.006445 50 1400 0.063 5.7 7100 0.006645 50 1400 0.056 5.3 6700 0.006645 50 850 0.063 5.3 4000 0.007545 100 850 0.056 4.5 1700 0.009460 10 2300 0.070 9.5 130,000 0.003560 50 1400 0.063 6.9 12,000 0.005860 100 850 0.056 5.5 2800 0.0083
100 10 2300 0.070 13.0 300,000 0.0030100 50 1400 0.063 9.9 28,000 0.0048100 100 850 0.056 7.9 6700 0.0067
240 W.L. Jaeger et al. / Icarus 205 (2010) 230–243
and Mars. One of the key characteristics that may help identifyother such flows is the great distance (>200 km) to which the de-flated lava facies extends away from the vent. Similar featuresare seen around basaltic eruptions at Kilauea Volcano, Hawaii,
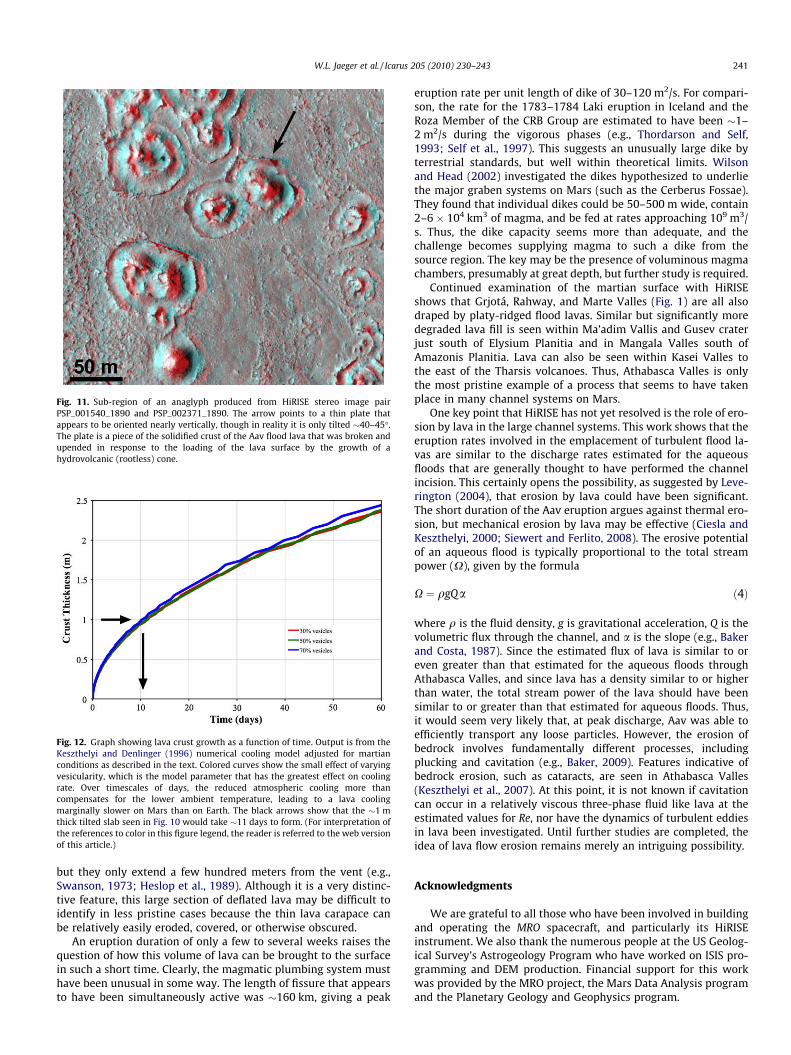
Fig. 11. Sub-region of an anaglyph produced from HiRISE stereo image pairPSP_001540_1890 and PSP_002371_1890. The arrow points to a thin plate thatappears to be oriented nearly vertically, though in reality it is only tilted �40–45�.The plate is a piece of the solidified crust of the Aav flood lava that was broken andupended in response to the loading of the lava surface by the growth of ahydrovolcanic (rootless) cone.
Fig. 12. Graph showing lava crust growth as a function of time. Output is from theKeszthelyi and Denlinger (1996) numerical cooling model adjusted for martianconditions as described in the text. Colored curves show the small effect of varyingvesicularity, which is the model parameter that has the greatest effect on coolingrate. Over timescales of days, the reduced atmospheric cooling more thancompensates for the lower ambient temperature, leading to a lava coolingmarginally slower on Mars than on Earth. The black arrows show that the �1 mthick tilted slab seen in Fig. 10 would take �11 days to form. (For interpretation ofthe references to color in this figure legend, the reader is referred to the web versionof this article.)
W.L. Jaeger et al. / Icarus 205 (2010) 230–243 241
but they only extend a few hundred meters from the vent (e.g.,Swanson, 1973; Heslop et al., 1989). Although it is a very distinc-tive feature, this large section of deflated lava may be difficult toidentify in less pristine cases because the thin lava carapace canbe relatively easily eroded, covered, or otherwise obscured.
An eruption duration of only a few to several weeks raises thequestion of how this volume of lava can be brought to the surfacein such a short time. Clearly, the magmatic plumbing system musthave been unusual in some way. The length of fissure that appearsto have been simultaneously active was �160 km, giving a peak
eruption rate per unit length of dike of 30–120 m2/s. For compari-son, the rate for the 1783–1784 Laki eruption in Iceland and theRoza Member of the CRB Group are estimated to have been �1–2 m2/s during the vigorous phases (e.g., Thordarson and Self,1993; Self et al., 1997). This suggests an unusually large dike byterrestrial standards, but well within theoretical limits. Wilsonand Head (2002) investigated the dikes hypothesized to underliethe major graben systems on Mars (such as the Cerberus Fossae).They found that individual dikes could be 50–500 m wide, contain2–6 � 104 km3 of magma, and be fed at rates approaching 109 m3/s. Thus, the dike capacity seems more than adequate, and thechallenge becomes supplying magma to such a dike from thesource region. The key may be the presence of voluminous magmachambers, presumably at great depth, but further study is required.
Continued examination of the martian surface with HiRISEshows that Grjotá, Rahway, and Marte Valles (Fig. 1) are all alsodraped by platy-ridged flood lavas. Similar but significantly moredegraded lava fill is seen within Ma’adim Vallis and Gusev craterjust south of Elysium Planitia and in Mangala Valles south ofAmazonis Planitia. Lava can also be seen within Kasei Valles tothe east of the Tharsis volcanoes. Thus, Athabasca Valles is onlythe most pristine example of a process that seems to have takenplace in many channel systems on Mars.
One key point that HiRISE has not yet resolved is the role of ero-sion by lava in the large channel systems. This work shows that theeruption rates involved in the emplacement of turbulent flood la-vas are similar to the discharge rates estimated for the aqueousfloods that are generally thought to have performed the channelincision. This certainly opens the possibility, as suggested by Leve-rington (2004), that erosion by lava could have been significant.The short duration of the Aav eruption argues against thermal ero-sion, but mechanical erosion by lava may be effective (Ciesla andKeszthelyi, 2000; Siewert and Ferlito, 2008). The erosive potentialof an aqueous flood is typically proportional to the total streampower (X), given by the formula
X ¼ qgQa ð4Þ
where q is the fluid density, g is gravitational acceleration, Q is thevolumetric flux through the channel, and a is the slope (e.g., Bakerand Costa, 1987). Since the estimated flux of lava is similar to oreven greater than that estimated for the aqueous floods throughAthabasca Valles, and since lava has a density similar to or higherthan water, the total stream power of the lava should have beensimilar to or greater than that estimated for aqueous floods. Thus,it would seem very likely that, at peak discharge, Aav was able toefficiently transport any loose particles. However, the erosion ofbedrock involves fundamentally different processes, includingplucking and cavitation (e.g., Baker, 2009). Features indicative ofbedrock erosion, such as cataracts, are seen in Athabasca Valles(Keszthelyi et al., 2007). At this point, it is not known if cavitationcan occur in a relatively viscous three-phase fluid like lava at theestimated values for Re, nor have the dynamics of turbulent eddiesin lava been investigated. Until further studies are completed, theidea of lava flow erosion remains merely an intriguing possibility.
Acknowledgments
We are grateful to all those who have been involved in buildingand operating the MRO spacecraft, and particularly its HiRISEinstrument. We also thank the numerous people at the US Geolog-ical Survey’s Astrogeology Program who have worked on ISIS pro-gramming and DEM production. Financial support for this workwas provided by the MRO project, the Mars Data Analysis programand the Planetary Geology and Geophysics program.
242 W.L. Jaeger et al. / Icarus 205 (2010) 230–243
References
Anderson, J.A., Sides, S.C., Soltesz, D.L., Sucharski, T.L., Becker, K.J., 2004.Modernization of the integrated software for imagers and spectrometers.Lunar. Planet. Sci. Conf. XXXV (Abstract #2039).
Baker, V.R., 1973. Paleohydrology and Sedimentology of Lake Missoula Flooding inEastern Washington. Geol. Soc. Am. Spec. Pap. 144, 79 pp.
Baker, V.R., 2009. The channeled scabland: A retrospective. Ann. Rev. Earth Planet.Sci. 37, 6.1–6.19.
Baker, V.R., Costa, J.E., 1987. Flood power. In: Mayer, L., Nach, D. (Eds.), CatastrophicFlooding. Allen and Unwin, London, pp. 1–24.
Baloga, S., Spudis, P.D., Guest, J.E., 1995. The dynamics of rapidly emplacedterrestrial lava flows and implications for planetary volcanism. J. Geophys. Res.100, 24509–24519.
Berman, D.C., Hartmann, W.K., 2002. Recent fluvial, volcanic, and tectonic activityon the Cerberus Plains of Mars. Icarus 159, 1–17.
Bird, R.B., Stewart, W.E., Lightfoot, E.N., 1960. Transport Phenomena. Wiley, New York.Boynton, W.V., and 19 colleagues, 1992. Science applications of the Mars Observer
Gamma Ray Spectrometer. J. Geophys. Res. 97, 7681–7698.Boynton, W.V., and 27 colleagues, 2007. Concentrations of H, Si, Cl, K, Fe, and Th in
the low- and mid-latitude regions of Mars. J. Geophys. Res. 112. doi:10.1029/2007JE002887.
Burr, D.M., 2003. Hydraulic modeling of Athabasca Vallis, Mars. Hydrol. Sci. J. 48,655–664.
Basaltic Volcanism Study Project, 1981. Basaltic Volcanism on the TerrestrialPlanets. Pergamon Press, Inc., New York.
Christensen, P.R., and 10 colleagues, 2004. The Thermal Emission Imaging System(THEMIS) for the Mars 2001 odyssey mission. Space Sci. Rev. 110, 85–130.
Ciesla, F.J., Keszthelyi, L., 2000. A simple model for lava flow quarrying: Mechanicalerosion of the substrate. Lunar. Planet. Sci. Conf. XXXI (Abstract #1647).
Clark, R.N., Swayze, G.A., Gallagher, A.J., King, T.V.V., Calvin, W.M., 1993. The USGeological Survey Digital Spectral Library: Version 1: 0.3 to 3.0 microns. USGeol. Surv. Open File Rep. 93-592, 1340 pp. <http://speclab.cr.usgs.gov>.
Delamere, W.A., and 16 colleagues, 2009. Color imaging of Mars by the HighResolution Imaging Science Experiment (HiRISE). Icarus 205, 38–52.
Diez, B., Feldman, W.C., Mangold, N., Baratoux, D., Maurice, S., Gasnault, O., d’Uston,L., Costard, F., 2009. Contribution of Mars Odyssey GRS at Central ElysiumPlanitia. Icarus 200, 19–29.
Fink, J.H., Zimbelman, J.R., 1986. Rheology of the 1983 Royal Gardens basalt flows,Kilauea Volcano, Hawaii. Bull. Volcanol. 48, 87–96.
Geikie, A., 1880. The lava-fields of North-western Europe. Nature 23, 3–5.Goncharov, V.N., 1964. Dynamics of Channel Flow. Translated from Russian by Israel
Program Science Translation. US Department of Commerce, Office of TechnicalServices, Washington, DC.
Greeley, R., Foing, B.H., McSween, H.Y., Neukum, G., Pinet, P., van Kan, M., Werner,S.C., Williams, D.A., Zegers, T.E., 2005. Fluid lava flows in Gusev crater, Mars. J.Geophys. Res. 110. doi:10.1029/2005JE02401.
Gregg, T.K.P., Keszthelyi, L.P., 2004. The emplacement of pahoehoe toes: Fieldobservations and comparison to laboratory simulations. Bull. Volcanol. 66, 381–391.
Hartmann, W.K., Neukum, G., 2001. Cratering chronology and the evolution of Mars.Space Sci. Rev. 96, 165–194.
Head III, J.W., Coffin, M.F., 1997. Large igneous provinces: A planetary perspective.In: Mahoney, J.J., Coffin, M.F. (Eds.), Large Igneous Provinces: Continental,Oceanic, and Planetary Flood Volcanism. American Geophysical Union,Washington, DC, pp. 411–438.
Heslop, S.E., Wilson, L., Pinkerton, H., Head, J.W., 1989. Dynamics of a confined lavaflow on Kilauea Volcano, Hawaii. Bull. Volcanol. 51, 415–432.
Hon, K., Kauahikaua, J., Denlinger, R., Mackay, K., 1994. Observations andmeasurements of active lava flows on Kilauea Volcano, Hawaii. Geol. Soc. Am.Bull. 106, 351–370.
Hooper, P.R., 1982. The Columbia River basalts. Science 215, 1463–1468.Hulme, G., 1973. Turbulent lava flows and the formation of lunar sinuous rilles.
Modern Geol. 4, 107–117.Hulme, G., 1974. The interpretation of lava flow morphology. Geophys. J. R. Astron.
Soc. 39, 361–383.Huppert, H.E., Sparks, R.S.J., 1985. Komatiites I: Eruption and flow. J. Petrol. 26, 694–725.Jaeger, W.L., Keszthelyi, L.P., McEwen, A.S., Dundas, C.M., Russel, P.S., 2007. HiRISE
observations of Athabasca Valles, Mars: A lava-draped channel system. Science317, 1709–1711.
Jaeger, W.L., Keszthelyi, L.P., McEwen, A.S., Titus, T.N., Dundas, C.M., Russell, P.S.,2008. Response to Comment on ‘‘Athabasca Valles, Mars: A lava-draped channelsystem”. Science 320, 1588.
Keszthelyi, L., Denlinger, R., 1996. The initial cooling of pahoehoe lava flows. Bull.Volcanol. 58, 5–18.
Keszthelyi, L., McEwen, A.S., Thordarson, Th., 2000. Terrestrial analogs and thermalmodels for martian flood lavas. J. Geophys. Res. 105, 15027–15050.
Keszthelyi, L., Thordarson, Th., McEwen, A., Haack, H., Guilbaud, M.-N., Self, S., Rossi,M., 2004. Icelandic analogs to martian flood lavas. Geochem. Geophys. Geosyst.5. doi:10.1029/2004GC000758.
Keszthelyi, L., Self, S., Thordarson, Th., 2006. Flood lavas on Earth, Io, and Mars. J.Geol. Soc. London 163, 253–264.
Keszthelyi, L.P., Denlinger, R.P., O’Connell, D.R.H., Burr, D.M., 2007. Initial insightsfrom 2.5D hydraulic modeling of floods in Athabasca Valles, Mars. Geophys. Res.Lett. 34. doi:10.1029/2007GL031776.
Kirk, R.L., and 18 colleagues, 2008. Ultrahigh resolution topographic mapping ofMars with MRO HiRISE stereo images: Meter-scale slopes of candidate Phoenixlanding sites. J. Geophys. Res. 113. doi:10.1029/2007JE003000.
Komatsu, G., Kargel, J.S., Baker, V.R., 1992. Canali-type channels on Venus: Somegenetic constraints. Geophys. Res. Lett. 19, 1415–1418.
Kreslavsky, M., 2008. Young populations of small craters on Mars: A case study.European Planetary Science Conference Abstracts, vol. 3, EPSC2008-A-00237.
Lanagan, P.D., 2004. Geologic History of the Cerberus Plains. Ph.D. Dissertation,University of Arizona, Tucson, 142 pp.
Lanz, J.K., Saric, M.B., 2009. Cone fields in SW Elysium Planitia: Hydrothermalventing on Mars? J. Geophys. Res. 114. doi:10.1029/2008JE003209.
Leverington, D.W., 2004. Volcanic rilles, streamlined islands, and the origin ofoutflow channels on Mars. J. Geophys. Res. 109. doi:10.1029/2004JE002311.
Malin, M.C., Danielson, G.E., Ingersoll, A.P., Masursky, H., Veverka, J., Ravine,M.A., Soulanille, T.A., 1992. Mars observer camera. J. Geophys. Res. 97,7699–7718.
Malin, M.C., and 13 colleagues, 2007. Context camera investigation on board theMars Reconnaissance Orbiter. J. Geophys. Res. 112. doi:10.1029/2006JE002808.
Mangan, M.T., Cashman, K.V., 1996. The structure of basaltic scoria and reticuliteand inferences for vesiculation, foam formation, and fragmentation in lavafountains. J. Volcanol. Geotherm. Res. 73, 1–18.
McEwen, A.S., Preblich, B.S., Turtle, E.P., Artemieva, N.A., Golombek, M.P., Hurst, M.,Kirk, R.L., Burr, D.M., Christensen, P.R., 2005. The rayed crater Zunil andinterpretations of small impact craters on Mars. Icarus 176, 351–381.
McEwen, A.S., and 69 colleagues, 2009. The High Resolution Imaging ScienceExperiment (HiRISE) during MRO’s primary science phase (PSP). Icarus 205,2–37.
McSween, H.Y., and 34 colleagues, 2004. Basaltic rocks analyzed by the Spirit roverin Gusev crater. Science 305, 842–845.
McSween, H.Y., and 14 colleagues, 2008. Mineralogy of volcanic rocks in Gusevcrater, Mars: Reconciling Mössbauer, Alpha Particle X-Ray Spectrometer, andMiniature Thermal Emission Spectrometer spectra. J. Geophys. Res. 113.doi:10.1029/2007JE002970.
Murchie, S., and 49 colleagues, 2007. Compact Reconnaissance ImagingSpectrometer for Mars (CRISM) on Mars Reconnaissance Orbiter (MRO). J.Geophys. Res. 112. doi:10.1029/2006JE002682.
Murray, J.B., and 11 colleagues, and the HRSC Co-Investigator Team, 2005. Evidencefrom the Mars Express High Resolution Stereo Camera for a frozen sea close toMars’ equator. Nature 434, 352–256.
Nyquist, L.E., Bogard, D.D., Shih, C.Y., Greshake, A., Stöffler, D., Eugster, O., 2001. Agesand geologic histories of martian meteorites. Space Sci. Rev. 96, 105–164.
Plescia, J.B., 1990. Recent flood lavas in the Elysium region of Mars. Icarus 88, 465–490.
Plescia, J.B., 1993. An assessment of volatile release from recent volcanism inElysium, Mars. Icarus 104, 20–32.
Reidel, S.P., Fecht, K.R., 1987. The Huntzinger flow: Evidence of surface mixing of theColumbia River basalt and its petrogenetic implications. Geol. Soc. Am. Bull. 98,664–677.
Reidel, S.P., Tolan, T.L., 1992. Eruption and emplacement of flood basalt: An examplefrom the large-volume Teepee Butte Member, Columbia River Basalt Group.Geol. Soc. Am. Bull. 104, 1650–1671.
Richthofen, F., 1868. The Natural System of Volcanic Rocks. Towne and BaconPrinters, San Francisco.
Self, S., Thordarson, Th., Keszthelyi, L., Walker, G.P.L., Hon, K., Murphy, M.T., Long, P.,Finnemore, S., 1996. A new model for the emplacement of Columbia Riverbasalts as large inflated pahoehoe flow fields. Geophys. Res. Lett. 23, 2689–2692.
Self, S., Thordarson, Th., Keszthelyi, L., 1997. Emplacement of continental floodbasalt lava flows. In: Mahoney, J.J., Coffin, M.F. (Eds.), Large Igneous Provinces:Continental, Oceanic, and Planetary Flood Volcanism. American GeophysicalUnion, Washington, DC, pp. 381–410.
Self, S., Keszthelyi, L., Thordarson, Th., 1998. The importance of pahoehoe. Ann. Rev.Earth Planet. Sci. 26, 81–110.
Self, S., Jay, A.E., Widdowson, M., Keszthelyi, L.P., 2008. Correlation of the Deccanand Rajahmundry Trap lavas: Are these the longest and largest lava flows onEarth? J. Volcanol. Geotherm. Res. 172, 3–19.
Shaw, H.R., Swanson, D.A., 1970. Eruption and flow rates of flood basalt. In: Gilmore,E.H., Stradling, D.F. (Eds.), Proceedings of the Second Columbia River BasaltSymposium. East. Wash. State Coll. Press, Cheney, pp. 271–299.
Shaw, H.R., Wright, T.L., Peck, D.L., Okamura, R., 1968. The viscosity of basalticmagma: An analysis of field measurements in Makaopuhi lava lake, Hawaii. Am.J. Sci. 226, 225–264.
Siewert, J., Ferlito, C., 2008. Mechanical erosion by flowing lava. Contemporary Phys.49, 43–54.
Squyers, S.W., and 49 colleagues, 2004. The Spirit rover’s Athena scienceinvestigation at Gusev crater, Mars. Science 305, 794–799.
Sullivan, R., and 10 colleagues, 2008. Wind-driven particle mobility on Mars:Insights from Mars Exploration Rover observations at ‘‘El Dorado” andsurroundings at Gusev crater. J. Geophys. Res. 113. doi:10.1029/2008JE003101.
Swanson, D.A., 1973. Pahoehoe flows from the 1969–1971 Mauna Ulu eruption,Kilauea Volcano, Hawaii. Geol. Soc. Am. Bull. 84, 615–626.
Tanaka, K.L., Skinner Jr., J.A., Hare, T.M., 2005. Geologic map of the northern plains ofMars. USGS Scientific Investigations Map (SIM) 2888, scale 1:15,000,000.
Thordarson, Th., Self, S., 1993. The Laki (Skaftár Fires) and Grímsvötn eruptions in1783–1785. Bull. Volcanol. 55, 233–263.

W.L. Jaeger et al. / Icarus 205 (2010) 230–243 243
Thordarson, Th., Self, S., 1998. The Roza Member, Columbia River Basalt Group: Agigantic pahoehoe lava flow field formed by endogenous processes? J. Geophys.Res. 103, 27411–27445.
Tolan, T.L., Reidel, S.P., Beeson, M.H., Anderson, J.L., Fecht, K.R., Swanson, D., 1989.Revisions to the estimates of the areal extent and volume of the Columbia RiverFlood Basalt Province. In: Reidel, S.P., Hooper, P.R. (Eds.), Volcanism andTectonism in the Columbia River Flood-Basalt Province. Geological Society ofAmerica, Boulder, pp. 1–20 (Spec. Pap. 239).
Tyrrell, G.W., 1937. Flood basalts and fissure eruption. Bull. Volcanol. 1, 87–111.Vaucher, J., Baratoux, D., Toplis, M.J., Pinet, P., Mangold, N., Kurita, K., 2009. The
morphologies of volcanic landforms at Central Elysium Planitia: Evidence forrecent and fluid lavas on Mars. Icarus 200, 39–51.
Wadge, G., 1981. The variation of magma discharge during basaltic eruptions. J.Volcanol. Geotherm. Res. 11, 139–168.
Walker, G.P.L., 1971. Compound and simple lava flows and flood basalts. Bull.Volcanol. 35, 579–590.
Washington, H.S., 1922. Deccan traps and the other plateau basalts. Geol. Soc. Am.Bull. 33, 765–804.
Wilson, L., Head, J.W., 2002. Tharsis-radial graben systems as the surfacemanifestation of plume-related dike intrusion complexes: Models andimplications. J. Geophys. Res. 107. doi:10.1029/2001JE001593.
Wilson, L., Head, J.W., 2008. Volcanism on Mercury: A new model for the history ofmagma ascent and eruption. Geophys. Res. Lett. 35. doi:10.1029/2008GL035620.