empirical contributions ten-year outcomes of …goranlab.com/pdf/r20.pdf · empirical contributions...
TRANSCRIPT
EMPIRICAL CONTRIBUTIONS
Ten-Year Outcomes of Behavioral Family-Based Treatmentfor Childhood Obesity
Leonard H. Epstein, Alice Valoski, Rena R. Wing, and James McCurley
We report 10-year treatment outcomes for obese children in 4 randomized treatment studies. At 10years, 34% decreased percentage overweight by 20% or more, and 30% were not obese. Significanteffects were observed when parents and children were targeted and reinforced for weight loss incomparison with nontargeted controls and for children given lifestyle or aerobic exercise incomparison with a calisthenics control. Thirty-four percent of the variance in change in percentageoverweight was predicted from sex, baseline percentage overweight, self-monitoring weight, mealseaten at home, and family and friends' support for eating and exercise. Results show long-termchanges in children depend on the treatment, and evidence converges on the importance of thefamily and other sources of support for eating and activity change.
Key words: child, obesity, diet, exercise, parenting, interaction
Obesity is a widespread child problem (Gortmaker, Dietz,Sobol, & Wehler, 1987), which increases the risk of adultobesity (Abraham, Collins, & Nordsieck, 1971; Abraham &Nordsieck, 1960; Charney, Goodman, McBride, Lyon, & Pratt,1976; Stark, Atkins, Wolff, & Douglas, 1981) and morbidityand mortality (Must, Jacques, Dallal, Bajema, & Dietz, 1992;Nieto, Szklo, & Comstock, 1992). The resistance of adultobesity to long-term change (Brownell, Marlatt, Lichenstein,& Wilson, 1986) suggests that an increased effort ought to bedirected to developing effective treatments for obese children.
Research supports the efficacy of behavioral treatments forobese children (Epstein, 1990; Epstein & Wing, 1987). Behav-ioral treatments are superior to no treatment (Epstein, Wing,Koeske, & Valoski, 1984; Israel, Stolmaker, Sharp, Silverman,& Simon, 1984; Kirschenbaum, Harris, & Tomarken, 1984)and to attention placebo controls (Epstein, Wing, Steranchak,Dickson, & Michelson, 1980; Epstein, Wing, Woodall, et al.,1985). Five-year follow-up studies have demonstrated thatincluding parents as active participants in habit change andweight loss (Epstein, Valoski, Wing, & McCurley, 1990;Epstein, Wing, Koeske, & Valoski, 1987), providing lifestyleexercise (Epstein, Wing, Koeske, & Valoski, 1985), and non-
Leonard H. Epstein, Alice Valoski, Rena R. Wing, and JamesMcCurley, University of Pittsburgh School of Medicine.
This research was supported by Grants HD MH 12520, HD 16411,HD 19532, and HD 20829 awarded to Leonard H. Epstein.
We express appreciation to the staff members who assisted in theimplementation of treatment and data management in the fourstudies, as well as the families who served as subjects in the studies.The staff who assisted in the collection of 10-year outcome includeJeffery Smith, Marion Kunkle, and Lynne Rifugiato. We also expressappreciation to Marsha Marcus and Debby Muoio for comments on anearlier version of this article.
Correspondence concerning this article should be addressed toLeonard H. Epstein, who is now at the Department of Psychology,University at Buffalo, Park Hall, Buffalo, New York 14260.
obese parent weight status (Epstein, Wing, Valoski, & Good-ing, 1987) influence child weight control.
There is a paucity of other data on long-term treatment inobese children. Nuutinen and Knip (1992) reported a 5-yearfollow-up of obese children who participated in a weight-control program. They found no significant differences be-tween standard and experimental treatments, which bothshowed equivalent improvements from baseline. In contrast,we have demonstrated the influence of parent participation onchild weight regulation over a 10-year interval (Epstein,Valoski, et al., 1990). Weight change did not differentiallyinfluence growth over the 10 years of observation (Epstein,Valoski, & McCurley, 1993).
The main goal of this article is the presentation of the10-year outcome for obese children treated in four randomizedstudies. The 10-year outcome results for the first study in thisseries have been presented (Epstein, Valoski, et al., 1990). Atfollow-up, the average child was 20 years of age, and thisprovided an evaluation of treatment effects from childhoodinto young adulthood. Because variables other than treatmentmay influence the change in the percentage overweight over 10years, we attempted to assess several important variables thatinfluence weight, such as smoking (Noppa & Bengston, 1980),joining other weight-control programs, eating disorders (Malo-ney, McGuire, Daniels, & Specker, 1989), and psychiatricproblems (Black, Goldstein, & Mason, 1992).
The secondary goal of this article is to identify variablesassociated with long-term weight regulation and to extend theresearch on predictors of 5-year changes in percentage over-weight (Epstein, Valoski, & McCurley, 1992). The variablesincluded ones that were manipulated during treatment or wereconceptually related to the treatments that were studied, suchas adherence to weight regulatory behaviors, energy andmacronutrient intake, and activity levels, and ones that reflectenvironmental, familial, and peer influences.
Health Psychology, 1994, Vol. 13, No. 5,373-383Copyright 1994 by the American Psychological Association, Inc., and the Division of Health Psydiology/0278-6133/947$3.00
373

374 EPSTEIN, VALOSKI, WING, AND McCURLEY
Method
Subjects
Subjects were participants in one of four weight-control studies atthe University of Pittsburgh. Entrance criteria for the treatmentprograms included: a child of 6-12 years of age, 20%-100% overweightfor age, sex, and height, no current psychiatric diagnosis or treatment,no learning disability, and one parent willing to participate in treat-ment with the child. Parents or children with current psychologicalproblems were referred for treatment before entrance in the study.Parents or children could have had psychiatric problems that had beensuccessfully treated or were in remission when they entered treatment.
Families that participated in Study 1 were intact, and families whoparticipated in the exercise studies (2 and 4) could not have a medicalproblem that limited exercise. With the exception of one group, atleast one parent was obese, which may increase the risk that an obesechild will become an obese adult (Charney et al., 1976). The exceptionwas in Study 3, where the obesity status of the parents was anindependent variable. Socioeconomic status of the families at entrywas 45.2 ± 12.0, within the range of middle-class Social Strata IV(Hollingshead, 1975). One hundred eighty-five families were originallyrandomized, and data from 158 families (85%) were available at the10-year follow-up. Five-year growth (Epstein, McCurley, Valoski, &Wing, 1990) and changes in percentage overweight (Epstein, McCur-ley, Wing, & Valoski, 1990) for these studies and 10-year height andweight results from Study 1 have been reported (Epstein, Valoski, etal., 1990).
Characteristics of Treatment
The basic treatment package for all groups included weekly treat-ment meetings for 8-12 weeks, with monthly meetings continuing for6-12 months from the start of the program. All families were alsoprovided the Traffic Light Diet to help reduce caloric intake andimprove nutrient density, with intake for most nutrients exceeding theminimum goals for the RDA (Epstein, Valoski, Koeske, & Wing, 1986;Valoski & Epstein, 1990). Food diaries were reviewed weekly, andbehavior modification techniques were used to encourage a balanceddiet within the 900-1,200 calorie range.
The diet was continued until a participant was within 10% of thegoal weight for height. The parent or child was then instructed toincrease the caloric intake by 100 kcal/day up until the child began togain weight. Participants remained on the intake that did not result inimmediate weight gain, and energy intake was adjusted to maintaingrowth. Parents were taught how to calculate goal weight for height asthe child grew.
The variables manipulated in each study are presented in Table 1. InStudy 1, children were randomized to one of three groups: Both theparent and child were targeted for weight loss, only the child wastargeted for losing weight, or there was a nonspecific target (Epstein,Valoski, et al., 1990; Epstein, Wing, Koeske, Andrasik, & Ossip, 1981;Epstein, Wing, Koeske, & Valoski, 1987). Targeting involved contin-gency management for habit and weight change, with the contingen-cies for the parent-and-child group arranged so that both the parentand child had to change habits and lose weight. Thus, contingenciesrequired cooperative and joint change in both parents and children.
Study 2 randomized families to regimes of diet and lifestyle exerciseor diet alone or to a no-treatment control (Epstein, Wing, et al., 1984).The exercise program increased energy expenditure by the equivalentof 4 miles (6.4 km) of walking per day, or 2,800 kcal per week for a 150Ib. person. The diet alone group was given information on lowexpenditure calisthenics and stretching but were not reinforced for anyexercise changes. Contingencies in this study were oriented towardchild weight change, with no requirement for joint parent and child
behavior or weight change. The no-treatment control group wastreated after 6 months, and no long-term data on these children areavailable.
Study 3 assessed the effects of parental weight status (two nonobeseparents vs. at least one obese parent) and child self-control on childweight loss (Epstein, Wing, Koeske, & Valoski, 1986; Epstein, Wing,Valoski, & Gooding, 1987). Contingencies were oriented toward childweight change, with no requirement for joint parent and child behavioror weight change. This is consistent with the emphasis in treatment onchild self-control and the fact that targeting weight change was notpossible for the group with two nonobese parents. The child self-control treatment showed no short- or long-term effects, and theresults have been collapsed across this variable.
In Study 4, children were randomized to one of three groups,aerobic exercise, lifestyle exercise, and a calisthenics control group.The groups were similar in exercise time, goal setting, and feedback,but the control group required considerably less caloric expenditurethan the isocaloric aerobic or lifestyle groups. The exercise-expenditure goal was the equivalent of 9 miles (14.5 km) per week tofacilitate adherence (Epstein, Koeske, & Wing, 1984). Parents andchildren had reciprocal reinforcement contingencies, in which theywere instructed to independently support the behavior change of eachother.
These studies were approved by the University of PittsburghInstitutional Review Board, and informed consent for follow-up wasobtained from parents and children.
Measurement
Height and weight. Ten-year follow-up data were collected in oneof three ways. Most of the subjects (127 of 158, or 80%) were weighedand measured in our office with a balance scale and laboratory-constructed height board. After 10 years some participants had movedfrom the area, and it was necessary to obtain height and weightinformation in other ways. Measurements for 3 subjects (2%) wereobtained from their physician. In the other 28 cases (18%), self-reportof height and weight was used. Families were paid for participation infollow-up as follows: $100 each to parent and child for coming to ouroffice and being measured, $50 each to parent and child for a doctorreport, and $25 each for a self-report.
Given that self-report can underestimate the degree of obesity,researchers have recommended adjusting self-reported height andweight with sample-specific equations (Bowman & DeLuca, 1992;Charney et al., 1976). We used equations based on a data set thatincluded over 1,000 pairs of measured and self-reported data.1 Thecorrelations between the estimated and measured height and weightwere as follows: rs = .991 and .993 for height and rs = .996 and .998 forweight, for girls and boys, respectively, and rs = .977 and .952 forheight and rs = .996 and .992 for weight, for women and men,respectively. In 7 subjects, 5-year data were not available. To maximizethe number of cases available for repeated measures analysis, 5-yeardata points for these subjects were extrapolated from graphs of thebaseline, 6-month, 1-, 2-, 3- and 10-year data.
Percentage overweight was calculated for children less than 19 yearsof age on the basis of child sex and height (Jelliffe, 1966).2 For children19 years or older and all parents, percentage overweight was calculatedwith adult standards (Metropolitan Life Insurance Company, 1983).This measure provides a dependent variable for assessing weightchange in relation to height change that has served as the basis forinitial reports of treatment outcome for this and almost all otherreports of behavioral treatment of childhood obesity (Epstein & Wing,1987).
Another way to evaluate weight for height is the body mass index(BMI; Weight -i- Height2 [kg H- m2]). There is a reliable pattern in BMIduring development; namely, BMI increases up to approximately 6

TEN-YEAR OBESITY OUTCOMES 375
Table 1Differences in Treatment Protocols Across Groups
Condition Target Contract Goal Amount of exercise
Study 1Parent-childChildNonspecific
Study 2Diet and informationDiet and lifestyle
Study 3Family history+Family history-
Study 4Diet and aerobicDiet and lifestyleDiet and calisthenics
P,CCNS
P,CP,C
P,CC
P,CP,CP,C
P + CCP + C
CC
CC
P/CP/CP/C
H,E,WH,E,WA
H,E,WH, E, Ex, W
H,E,Ex,WH,E,Ex,W
H,E(ExH,E,ExH,E,Ex
SDSDSD
NS1400-2800
300-750300-750
300-900300-900
NS
Note. Information was a control condition in which only information about exercise was given, butexercising was not reinforced. Lifestyle, aerobic, and calisthenics were exercise regimens. Family history+indicates at least one obese parent; family history— indicates no obese parent. P = parent and C = child;P + C indicates conjoint contingencies for parent and child; P/C indicates reciprocal contingencies forparent and child. H = habits; E = eating; W = weight; A = attendance; and Ex = exercise. SD =self-determined; figures for Amount of exercise indicate calorie expenditure. NS = not specified.
months of age, decreases through about age 7, and then increasesthroughout the remainder of development (Hammer, Kraemer, Wil-son, Ritter, & Dornbusch, 1991). Normal changes in BMI duringdevelopment are quite marked. The average BMI increases approxi-mately 27.5% (from 16.72 to 23.07) for a boy from age 10 to age 20 andabout 20.7% (from 17.00 to 21.46) for a girl over the same period(Must, Dallal, & Dietz, 1991). These developmental changes can betaken into account in interpreting long-term changes by comparingBMI values to the average BMI at that age. In addition to evaluatingchanges in percentage overweight, we also evaluated changes in BMIreferenced to the 50th percentile of BMI for a child's age and sex(Must et al., 1991), which we labeled percentage overBMI. Thecorrelation between 10-year changes in percentage overweight andchanges in percentage overBMI (BMI change) was .96 (df= 158, p <.001).
Additional dependent measures included the percentage of childrenwho showed at least 20% increase or decrease in weight over 10 yearsand the percentage of children who were not overweight (i.e., less than20% overweight) at 10 years.
Demographic variables, weight, and medical history. At 10 yearsrespondents completed questionnaires that assessed variables thatcould influence weight, such as tobacco use (Noppa & Bengston,1980), use of drugs that influence weight (e.g., appetite suppressantsand oral contraceptives; Bradley, 1985), pregnancy (Forster, Bloom,Sorensen, Jeffery, & Prineas, 1986), long periods of inactivity, andparticipation in other weight-control programs. Interviews at the10-year follow-up were used to complete any details.
Information about participation in other weight-control programswas collected retrospectively on a yearly basis, including the type ofprogram (e.g., other diets, exercise programs, or weight control undera doctor's care), duration of participation, amount of weight lossduring the program, and amount of weight loss that was maintained.Psychiatric problems were assessed as a part of the collection ofmedical history information. Attempts were made to confirm specificpsychiatric diagnoses with the treating professionals. Decisions aboutthe severity of the problems were guided by the Diagnostic andStatistical Manual of Mental Disorders (rev. 3rd ed.; American Psychiat-ric Association, 1987). The interviews focused on the medical history,and no attempts were made to do clinical interviews that might provideinformation on subjects who did not report but may have had a
psychiatric problem. Adult binge eating disorder was not assessed,because most of the work in this area began after the initiation of the10-year follow-up investigations. Although the prevalence of thisdisorder is low in the general population, it is quite high in obese adultswho seek treatment (Spitzer et al., 1992; Spitzer et al., 1993). It is notknown if the prevalence is high in obese adults who seek treatment fortheir children. Completed medical history questionnaires were avail-able for 37 boys and 100 girls (87% of the sample). All estimates of theproportion of children with psychiatric problems were based on thesample of 137 children who provided medical history forms.
Measurement of diet and activity. Dietary intake was assessed with amodified version of the Food Frequency Questionnaire (Willett,Reynolds, Cottrell-Hoehner, Sampson, & Browne, 1987; Willett et al.,1985) and was analyzed with Nutritionist III (N-Squared Computing,Salem, OR) software adapted for food frequency use. The FoodFrequency Questionnaire has been widely used and validated over a1-year interval, and it provides information on energy intake andpercentage of macronutrients (fats, carbohydrates, and protein). Afterthe questionnaire was completed, a registered dietician (Alice Valoski)interviewed each child to fill in any details.
Caloric expenditure of regular activities was estimated with thePaffenbarger Index (Paffenbarger, Hyde, Wing, & Hsieh, 1986). ThePaffenbarger Index is a widely used estimate of activity, which relatesto fitness (Siconolfi, Lasater, Snow, & Carelton, 1985) and a variety ofhealth outcomes (Paffenbarger et al., 1986; Paffenbarger, Wing, &Hyde, 1978).
Program adherence. Subjects indicated how often they used pro-gram techniques, such as the diet, self-monitoring, and stimulus-control methods, and how useful they found them. The questionnaire
'The equations to adjust reported weight and height were asfollows: girls weight, Yo = 2.472 + 1.006Xc, boys weight, YB = 0.373+ 1.016XB; girls height, Yo = 2.860 + .9491.006Xo; boys height, YB =2.642 + 0.952XB; mothers weight, YM = 1.513 + 0.999XM; fathersweight, YF = 4.589 + 0.987XF; mothers height, YM = 2.803 + .953XM;fathers height, YF = 2.316 + 0.955XF.
2 The 5-year data presented in Figure 1 present data from the 151measured cases.

376 EPSTEIN, VALOSKI, WING, AND McCURLEY
used for this purpose and the influence of these variables on 5-yearoutcomes have been reported (Epstein et al., 1992).
Environmental support for eating and exercise change. Sallis, Gross-man, Pinski, Patterson, and Nader (1987) developed and validatedscales on young adults that assess support for changing eating andexercise behavior. The scales measure the degree of support by familymembers, friends, and persons with whom they have lived over the lastyear.
Environmental assessment. Aspects of the environments that caninfluence weight control were assessed. The variables were: (a)subjects' current living situation, including where they live and thenumber of persons with whom they live; (b) subjects' meal pattern andthe weight of people with whom they regularly eat; (c) the exercisepattern of the people with whom they regularly exercise; and (d)subjects' perception of the general activity level of their family,roommates, and any people with whom they eat or exercise. Activityperception was assessed with items from the Framingham OffspringStudy (Hubert, Baker, Garrison, & Castelli, 1987; Siconolfi et al.,1985).
Each of the self-report measures provided estimates of intake andactivity over the previous year. Increasingly remote intervals increasememory confounds, and information beyond 1 year was consideredless useful for understanding variables that influence current weight.
Analytic Procedures
The data were combined across the four studies to increase powerfor the between-groups comparisons and to provide a database forassessing correlational relations. This database was used to addressseveral issues. First, analyses of covariance assessed interstudy, be-tween-groups changes in percentage overweight from baseline to 5 and10 years, with initial BMI as the covariate. All repeated measuresanalyses of covariance were checked for violations of sphericity withGreenhouse-Geiser adjustments. Residuals were examined for eachmodel to assess outliers and cases with undue leverage. Between-groups comparisons were based on linear contrasts in the generallinear model.
Second, chi-square analyses assessed differences by group in thepercentage of children who showed sustained increases or decreases of20% overweight and the percentage of children who were obese ornonobese. Third, a combination of correlational and analysis ofvariance techniques assessed the contribution of variables that couldinfluence interpretation of treatment effects, such as smoking orparticipation in other weight-control programs. Fourth, multipleregression techniques assessed the contribution of a variety of demo-graphic, intake, expenditure, and social-environmental variables tochanges over 10 years. The fit of the models was evaluated by plottingresiduals against the estimates. Variables within conceptually similarsubgroups were analyzed separately, and significant variables wereentered into the final model with backward regression procedures.Nonsignificant terms were removed in sequential fashion. Fifth,differences in parent and child baseline characteristics and childweight changes at 5 and 10 years were compared for children whodeveloped eating disorders or psychiatric problems versus childrenwho did not report these problems. All analyses were performed withSYSTAT software (Wilkinson, 1992).
Results
p > .05, were not different across groups. Significant differ-ences were observed in age, F(3,154) = 5.59,p = .001, height,F(3, 154) = 6.78, p < .001, and weight, F(3, 154) = 4.63, p =.004. Post hoc analyses showed children in Study 1 weresignificantly younger than children in Study 2 (p = .006), Study3 (p < .001), and Study 4 (p = .024); children were acceptedat younger ages (6-12) in Study 1 than in the other studies(8-12). Although children in Studies 2-4 were older and tallerand weighed more, their weight for height considered bypercentage overweight or BMI was equivalent. There were nodifferences in Sex Distribution x Study, x2(3, N = 158) = 3.54,p > .05.
No significant differences across studies were observed inmothers' height, F(3,153) = 1.61,/> > .05, or age, F(3,154) =0.75,^ > .05, or fathers' height, F(3, 149) = 2.10, p > .05, orage, F(3, 152) = 1.66, p > .05. Significant differences wereobserved in percentage overweight, F(3,153) = 3.1 l,p = .028,and BMI, F(3, 153) = 3.37, p = .02, for mothers andpercentage overweight, F(3, 148) = 5.91, p < .001, and BMI,F(3, 148) = 5.08, p = .002, for fathers, as some families werechosen in Study 3 because both parents were nonobese. Therewere no differences for participating parents in Sex Distribu-tion x Study, xz(3, N = 152) = 6.20,/» > .05.
Treatment Outcome
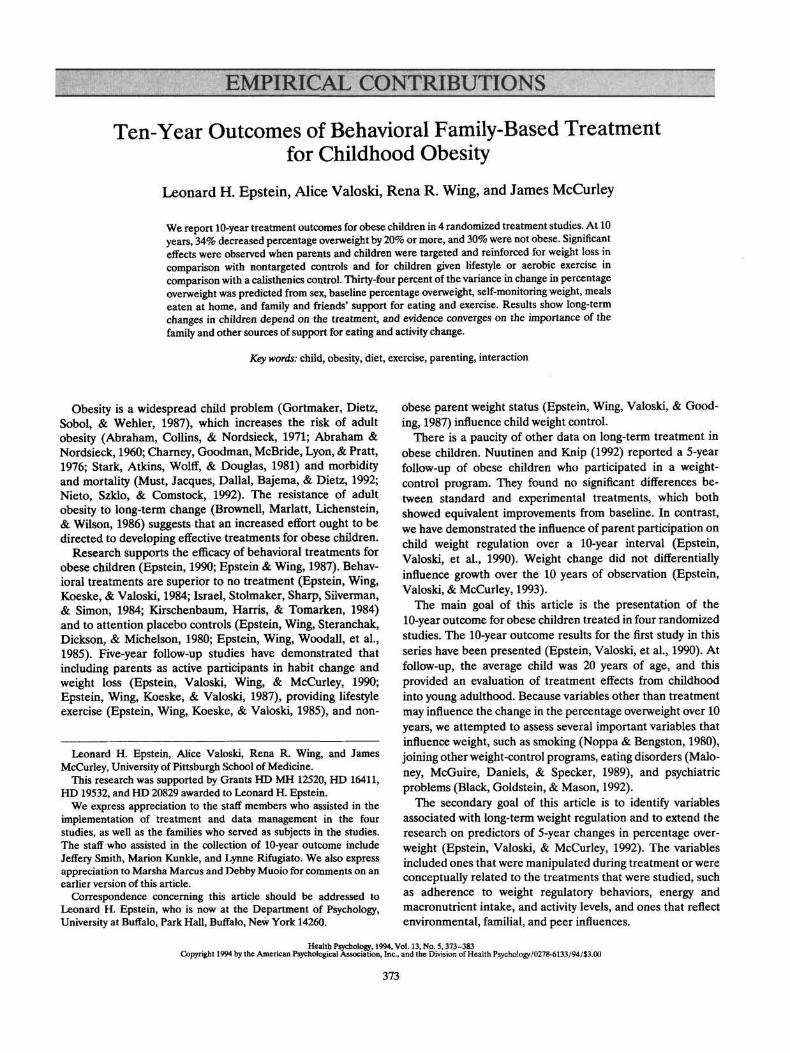
The change in children's percentage overweight by study3 ispresented in Figure 1. To facilitate assessment of the magni-tude of treatment effects, the 95% confidence intervals for10-year change in percentage overweight across all subjects arepresented in Figure 1 by dotted lines. Analysis of covarianceshowed a significant interaction of Group x Time4 for percent-age overweight, F(18, 294) = 1.77, p — .028, and percentageoverBMI, F(18,294) = 1.67,p = .044.
Contrasts for Study 1 showed that the parent-and-childgroup had significantly greater changes than the nonspecificcontrol at both 5, F(l, 145) = 12.94, p < .001, and 10 years,F(l, 145) = 7.1 l,p = .009. The parent-and-child group wassignificantly different from the child-only group at 5 years, F(l,145) = 5.15,p = .025, but not at 10 years, F(l, 145) = L88,p =.17. Children in the parent-and-child group decreased their
Baseline
The baseline characteristics of children and parents in allstudies are shown in Table 2. Children's percentage over-weight, F(3, 154) = 1.37, p > .05, and BMI, F(3,154) = 1.97,
3 We have reported results using the WHO (Jelliffe, 1966) stan-dards, since the newer NCHS standards (Hamill, Drizd, Johnson,Reed, Roche, & Moore, 1979) were not available when we began thesestudies, and the initial reports used the WHO standards. The WHOstandards present a more conservative test of the treatment, sincecomparisons of percent overweight calculated between WHO andNCHS standards show NCHS to be 4.5 ± 6.2 lower. Correlations of0- to 10-year change between the two methods for calculating percentoverweight were .98, and the Group x Tune interaction for theANOVA calculated using the NCHS standards was also significant,F(18,294) = 1.79, p = .0225.
4 Six subjects were identified as outliers in this analysis. The outlierswere subjects with excessive increases in percent overweight (M =71.4, range, 47.9-108.5). Redoing the analysis without the outliersresulted in a significant model, F(18, 278) = 1.86, p = .019. Given thepossibility that these excessive weight gains represented a small, butimportant percentage of the children, and to make the results moreconservative, the final model included all subjects.

TEN-YEAR OBESITY OUTCOMES 377
Table 2Baseline Characteristics (Means and Standard Deviations) of Overweight Children and Their Parents
Measure Total Study 1 Study 2 Study 3 Study 4
Child (N = 158; 42 boys and 116 girls)
%age overweightBody Mass IndexHeightWeightAgeSES
45.025.557.5
121.910.4
16.63.24.629.11.6
33.7 11.0
43.8 ± 16.424.8 ± 3.355.9 ± 4.5
112.3 ± 29.19.8 ± 1.8
36.2 ± 6.9
43.8 ± 13.725.6 ±2.158.4 ± 4.3
124.7 ± 21.910.8 ± 1.334.6 ±11.9
43.0 ± 16.425.9 ± 3.159.8 ± 4.2
133.4 ± 29.110.9 ± 1.130.2 ± 13.2
49.9 ± 18.426.2 ± 3.557.1 ± 4.2
123.6 ± 29.010.5 ± 1.335.2 ± 9.6
Mother (N = 152)
%age overweightBody Mass IndexHeightWeightAge
20.9 ± 23.527.8 ± 5.464.2 ± 2.5
162.9 ± 33.839.4 ± 6.3
20.9 ± 21.827.8 ± 5.063.9 ± 2.3
161.9 ± 31.639.5 ± 6.9
22.5 ± 21.127.9 ± 4.865.1 ± 3.1
168.7 ± 33.141.0 ± 7.0
12.6 ± 23.025.8 ± 5.264.4 ± 2.4
152.3 ± 33.139.0 ± 5.6
28.8 ± 25.929.7 ± 6.063.8 ± 2.7
171.9 ± 36.438.5 ± 5.7
Father (N = 152)
%age overweightBody Mass IndexHeightWeightAgeFamily SES
26.5 ± 19.129.3 ± 4.469.4 ± 2.6
200.8 ± 33.341.8 ± 7.245.2 ± 12.0
25.8 ± 16.329.2 ± 3.869.0 ± 2.5
198.2 ± 27.642.1 ± 8.047.5 ± 11.7
26.5 ± 21.329.3 ± 4.769.4 ± 2.7
201.4 ± 38.944.4 ± 8.845.3 ± 10.2
18.1 ± 15.227.4 ± 3.469.0 ± 2.7
186.1 + 28.740.8 ± 6.444.4 ± 12.2
36.0 ± 21.631.3 ± 5.070.3 ± 2.3
219.6 ± 34.940.5 ± 5.340.9 ± 13.3
Note. Height was measured in inches; weight was measured in pounds. SES = socioeconomic status. Child SES refers to level for children whowere employed at follow-up; family SES refers to level at entry.
percentage overweight by 15.3% whereas children in thecontrol group increased theirs by 7.6%. No significant differ-ences for change in percentage overweight were observedbetween groups in Study 2 after 5 or 10 years, though childrenin both groups showed decreases (8.4% and 10.0%) in long-term percentage overweight. In Study 3, a trend was observedfor children with nonobese parents (-11.1%) to do better thanchildren with obese parents (+3.1%); however, these differ-ences were not significant, F(l, 145) = 2.44, p = .12. Childrenin Study 4 given lifestyle (-19.7%), F(l, 145) = 7.18,p = .008,or aerobic exercise (-10.9%), F(l, 145) = 3.90, p = .05, hadgreater 10-year change than the calisthenics control group( + 12.2%). Contrasts of changes from 5 to 10 years weresignificant in comparisons of the lifestyle, F(l, 145) = 7.05,p =.009, or the aerobic exercise, F(l, 145) = 4.12,p = .044, to thecalisthenics control group.5
The percentage of children who maintained decreases of20%, X
2(18, N = 158) = 31.84, p = .02, differed by group(Table 3). In Study 1 the percentages of children in theparent-and-child, child-only, and control groups who main-tained decreases of 20% were 43%, 22%, and 29%, respec-tively. In Study 4, 58% of the children in the aerobics groupand 64% of those in the lifestyle exercise group maintained adecrease of 20%, as compared with an increase of 20% in thecalisthenics group. Thirty percent of the children in the fourstudies were not obese after 10 years. No significant differ-ences in this outcome were observed by group, x2(9, N = 158) =8.38,p = .50.
Confounding variables that could influence outcome. Sixgirls reported that they were treated for eating disorders. One
child had been treated for depression, and another had soughttreatment for alcohol abuse. Nineteen other children devel-oped major psychiatric disorders that required hospitalizationor long-term medication use. These included 16 children withdepression and 3 children with alcohol or drug abuse. A childwas treated for irritable bowel syndrome, a medical problemoften associated with psychiatric morbidity. Three women whohad been treated as children had been pregnant and deliveredwithin 6 months of the 10-year measurement. By self-report nosubjects were pregnant when measured. Treatment outcomedata were analyzed with and without these psychiatric, medi-cal, and pregnant subjects. The between-groups changes inpercentage overweight are significant if subjects with poten-tially confounding psychiatric and medical problems are ex-cluded, F(18, 230) = 2.04, p = .014. Analyses were alsoconducted to determine if smoking and other weight-controlattempts differentially influenced long-term weight control.Results of these analyses indicated none of these factorssignificantly affected the findings.6
5 To evaluate whether the use of self-report data influenced evalua-tion of the outcomes, percent overweight changes were analyzed usingonly directly measured data. The analyses showed a differential effectof treatment over time, F(IK, 234) = 1.76, p = .032, with no majordifferences in outcome when self-reported data were not used.
6 Twenty three percent of the subjects reported being active smok-ers, 13% former smokers, and 64% nonsmokers. No significantdifferences were observed in long-term percent overweight change as afunction of smoking, with percent overweight change for nonsmokers,former smokers and regular smokers as follows: -6.4 ± 29.9; -1.9 ±
378 EPSTEIN, VALOSKI, WING, AND McCURLEY
25
20
15
10
5
0
-5
-10
-15
-20
-25
25
20
15
10
5
0
-5
-10
-15
-20
NonspecificChildParent-Child
-12 0 12 24 36 48 60 72 84 96 108 120 132
Months
-25
* Nonobese Parents• Obese Parents
-12 0 12 24 36 48 60 72 84 96 108 120 132
Months
-25
A Diet• Diet + Lifestyle
-12 0 12 24 36 48 60 72 84 96 106 120 132
Months
-25
T Calisthenics* Aerobic• Lifestyle
-12 0 12 24 36 48 60 72 84 96 108 120 132
Months
Figure 1. Changes in percentage overweight after 5 and 10 years of follow-up for obese childrenrandomly assigned to 10 interventions across four studies. (The 95% confidence interval for the totalsample of children is represented by dotted lines.)
Regression analyses to predict change in percentage overweight.The demographic and height and weight predictors included
child's age and sex, participating parent's age and sex, familysocioeconomic status, child's height and percentage over-
29.4; and -4.2 ± 30.0. No differences in percent of smokers by groupwere observed, x2(9, N = 158) = 9.05, p = .43. Ninety-four percent ofthe subjects attempted additional weight control efforts over the 10years of follow-up. The average subject attempted 3.4 ± 3.0 othertimes to lose weight over the 10 years, which resulted in an averagemaintained (loss + regain weight loss of 3.2 ± 5.6 pounds perattempt). The majority of efforts were self-directed. Analyses ofvariance showed no differences in the number of additional weight lossattempts per group (p = .69), and no relationship between the numberof programs and long-term success (r = .10, p = .26). No differences
weight at baseline, parent's height and percentage overweightat baseline, and child's and parent's response to treatment asshown by respective percentages overweight from Months 0-6and from Months 0-60. Analyses of all predictors showed 0- to60-month change to be predictive of 10-year changes (r = .72,r2 = .52). When the 5-year change was not included, a bestfitting model was developed that accounted for 34% of thevariance in long-term outcome (Table 4). The variables in thismodel included child's sex, child's baseline percentage over-
were observed in the average amount of weight change by theseprograms per group (p = .10). There were too few subjects reportinguse of appetite suppressants or long periods of inactivity for analysis ofthese factors.

TEN-YEAR OBESITY OUTCOMES 379
weight, number of meals eaten at home, percentage over-weight for people with whom the child lives, self-monitoringdaily weight, good eating encouragement from the family,discouragement of bad eating from a friend, exercise participa-tion by a roommate, and exercise rewards by a roommate.Child's age and fat intake were related to outcome in indi-vidual models but were not retained when other variables wereincluded.7
Factors related to eating disorders and child psychiatric prob-lems. We attempted to evaluate factors that may have beenrelated to the development of eating disorders and childpsychiatric problems. Because the number of cases in theeating disorder and psychiatric disorders samples were small,traditional between-groups statistics were not appropriate forcomparisons. The 95% confidence interval for the childrenwho were not treated for psychiatric disorders for eachvariable was constructed, and children and parents withpsychiatric problems were compared with these intervals.Variables that were outside the 95% confidence intervals forthe nonpsychiatric cases are noted in Table 5. In spite of thelimitations of these small sample sizes, there were severalsuggestive differences. Children who developed psychiatricdisorders were below the 95% confidence interval for baselinepercentage overweight in comparison with children withoutpsychiatric disorders. These children also showed changes inpercentage overweight that were below the 95% confidenceinterval at 5 and 10 years. Children who developed eatingdisorders had mothers who were less obese and fathers whowere more obese at baseline than the respective 95% confi-dence intervals for parents of children without psychiatricproblems.
Table 4Regression Model for Change in Percentage OverweightOver 10 Years
DiscussionTreatment Outcome
Between-groups differences were shown from 0 to 10 yearsin Studies 1 and 4, consistent with previous data published on
Table 3Differences in Percentage of Children Who Showed Increases orDecreases of 10% or 20% From Baseline Percentage Overweightor Who Were Nonobese at the Final Follow-Up
Condition
Study 1Parent-childChildNonspecific
Study 2Diet and informationDiet and lifestyle
Study 3Family history +Family history -
Study 4Diet and aerobicDiet and lifestyleDiet and calisthenics
Total (N = 158)%
<;20%
432229
2031
3316
5864205333.5
%age children
-19%-19%
435033
6069
3377
2521607346.2
>20%
142838
200
336
814203220.3
Variable
Child's sexChild's baseline %age overweightNo. meals eaten at home per week%age overweight of people child
lives withSelf-monitoring daily weightGood eating encouragement from
familyBad eating discouragement from
friendExercise participation with room-
mateExercise rewards from roommate
Coefficient
-8.85-0.46
1.66
0.42-4.78
0.96
-0.73
-0.732.07
SE
4.400.130.44
0.151.64
0.35
0.30
0.311.07
t
2.013.643.74
2.752.92
2.77
2.41
2.351.94
P.046.000.000
.007
.004
.007
.017
.021
.055
Note. N = 129. R = .584, R2 = .341; F for equation = 7.77, p < .001.Sex was coded 0 for boys and 1 for girls. A negative relation suggeststhat the greater level of a variable is associated with more success(larger decreases in percentage over-weight), whereas a positiverelation suggests that a lower level of the variable is associated withgreater success.
the 5-year changes (Epstein, McCurley, Wing, & Valoski,1990). In Study 1, the parent-and-child group had a signifi-cantly greater change in percentage overweight than did thecontrol group, which supports the idea of treating both parentsand children in families in which obesity is represented in bothgenerations. The long-term superiority of including exercisewith diet is shown in Study 4, as both of the exercise groupsshowed better effects than the calisthenics control group. Inaddition to the statistically significant between-groups differ-ences, Figure 1 shows the changes in these treatment groupswere at or above the 95% confidence interval and the controlgroup was below the 95% confidence interval for magnitude ofchange. Thus, the changes were statistically significant and oflarge magnitude. It is interesting that even in Studies 2 and 3,which did not show significant between-groups differences incomparisons with internal control groups, large magnitudedecreases in percentage overweight for individual groups wereshown.
Thirty percent of all children achieved nonobese status, andabout one third had a decrease to at least 20% overweight.Although comparing experimental treatments to within-study
7 Regressions to test significant variables within each conceptuallysimilar subgroup of variables were conducted prior to the establishingthe complete model. The model using only baseline characteristicsincluded sex, age and initial percent overweight (R = .357, R2 = . 127, Ffor equation = 7.48, p < .001). Children who were older, female, withthose more obese showing the greatest change. Grams of fat intake(r = 2\,p < .05) and percent fat intake of calories (r = .19, p < .05)were related to long-term success. Total caloric expenditure per week(r = .06, p = .45) was not related to outcome. Frequency ofself-monitoring of weight was the only self-reported aspect of programadherence related to 10-year outcome, r = .22, p = .012. Twoenvironmental variables were related to outcome, the number of mealseaten at home and the number of obese people with whom the childcurrently lives (R = .309, R2 = .095, F for equation = 6.92, p = .001).

380 EPSTEIN, VALOSKI, WING, AND McCURLEY
Table 5Characteristics (Means) for Children and Their Parents by Report of Psychiatric Disorders
Nonpsychiatric
Variable Eating disorder Psychiatric M SD 95% CI
Child
AgeBaseline %age overweightChange over 0-6 monthsChange over 0-5 yearsChange over 0-10 years
10.248.7
-14.3-4.0
-11.4
10.239.5"
-18.34.7a
6.8"
10.445.9
-17.8-4.4-7.5
1.516.811.320.528.6
39.9-51.7-13.9—21.9
2.8 — 11.62.5—17.5
Mother
Age 37.0Baseline %age overweight 11.8"
39.021.6
39.521.6
6.223.3 13.4-29.8
Father
Age 38.5Baseline %age overweight 34.1"
42.231.1
41.925.4
7.519.7 18.5-32.3
Note. For children, 6 (all girls) reported eating disorders, 14 boys and 6 girls reported other psychiatricproblems, and 35 boys and 93 girls had no psychiatric problems. The number and percentage ofcorresponding parents with reported psychiatric problems for the three categories of children were asfollows: children with eating disorders, one parent = 16.7%; children with psychiatric problems, twoparents = 26.9%; children without psychiatric problems, two parents = 6.3%. CI = confidence interval."Outside of the 95% confidence interval for children without report of psychiatric problems.
control groups provides a rigorous test of treatment efficacy, itmay be interesting to know the effectiveness of these interven-tions in contrast with a no-treatment or a standard minimaltreatment or usual care control group. Research has shownthat children who are this obese (on the average 40% or moreoverweight) are more likely to maintain their obesity andbecome obese adults than their leaner peers (Abraham et al.,1971; Abraham & Nordsieck, 1960; Charney et al., 1976; Starket al., 1981), but there are no longitudinal data to estimate thenatural changes of obese children with obese parents who seektreatment. It is likely that nontreated children are less success-ful than children in the internal control groups in our studies.Children provided with these internal control treatmentsshowed large magnitude within-treatment changes, and signifi-cant treatment-control differences emerged only during follow-up. The treatment groups generally maintained their effects,and the control groups showed a more rapid return to baselineor even greater levels of obesity.
One methodological factor that can influence the evaluationof treatment outcome is power (Cohen, 1977). For example,families in the group with no obese parent in Study 2 wereoutside the 95% confidence interval for change in percentageoverweight and marginally different (p = .12) from the groupwith at least one obese parent. The sample size needed forsignificant (p < .05) between-groups differences was deter-mined with power analysis based on the standard deviation ofthe pooled sample (29.7). Sample sizes of 72 subjects per groupare needed to demonstrate the difference of 14.05 we observedbetween children with at least one obese parent and no obeseparent. Also, the difference in Study 1 between the parent-and-child and child-only groups of 10.6 requires almost 140 subjectsper group to be significant. These power analyses suggest that
only very large between-groups effects can be detected over10-year intervals, and future studies may require large samplesizes to detect differences between alternative treatments.
Prediction of Long-Term Outcome
The best predictor of change over the 10 years was changeduring the first 5 years (r = .72). When this variable was notincluded, variables of baseline characteristics, the eating andexercise environment, and support from family and friendswere predictive of outcome. The multiple correlation of .34 forthe best fitting model to predict 10-year change was encourag-ing because many of the variables are theoretically relevantand may be manipulated in treatment. These measures includevariables collected prospectively as well as variables collectedat the 10-year follow-up. Some of the variables collected at 10years assessed current status, such as who the person liveswith, how obese or active these persons are, and how support-ive they may be in regard to eating or activity change. Othervariables are designed to assess current levels of factors relatedto energy balance, such as caloric or macronutrient intake oractivity level. These variables were collected retrospectively byasking about behaviors over the last year. Variables collectedretrospectively must be interpreted cautiously in long-termstudies, as was discussed in the presentation of the 5-yearresults (Epstein et al., 1992).
Relationship of Weight Loss and Psychological Problems
There is a high prevalence of psychiatric illness (Black et al.,1992; Goldsmith et al., 1992) and eating disorder (Spitzer et
TEN-YEAR OBESITY OUTCOMES 381
al., 1992; Spitzer et al., 1993) in obese adults who seektreatment for obesity, in contrast to community samples. Giventhe increased prevalence of psychiatric problems in personswho seek specialized treatment for obesity and the increasedprevalence of bulimia in young adult females with obesity or ahistory of obesity (Pyle, Neuman, Halvorson, & Mitchell,1991), a higher prevalence of problems might be expected inthis population of children who sought treatment for obesity incomparison to obese children in families who do not seek thistype of treatment. The prevalence of bulimia nervosa or otherpsychiatric problems during the 10-year follow-up do notappear high. Approximately 4% of the children reportedseeking treatment for bulimia nervosa. Self-report studies haveshown an average prevalence for eating disorders of 9% ingirls, but structured-interview studies have shown a lowerprevalence of up to 5% (Fairburn & Beglin, 1990). Research isneeded to evaluate if sensible weight-control programs canprevent eating disorders by providing other weight regulatorycoping responses than bingeing and purging.
The most prevalent psychiatric problem was depression(11.6%). More of the parents of children who sought help forpsychiatric problems also sought such help than did parents ofobese children without psychiatric problems. There is verylittle data on the prevalence of psychiatric problems inchildren who enter obesity treatment, but research on adultssuggests a high prevalence of psychological problems in adultswho enter weight-control programs (Black et al., 1992; Gold-smith et al., 1992). In a different sample of obese childrenentering treatment, Epstein, Klein, and Wisniewski (1994)found that 29% met or exceeded clinical levels for psychologi-cal problems on the Child Behavior Checklist (Achenbach,1991), with the most prevalent elevations on the Anxiety-Depression and Social Problem scales. In that sample, childpsychopathology was not related to degree of childhoodobesity but rather to degree of parent psychological distress.
Children who developed psychiatric disorders were lessobese and less successful in long-term weight control thanchildren who did not. Parents of the former may have a lowerweight threshold before they think treatment is indicated andmay have been seeking help for their child's psychologicaldiscomfort, though these efforts did not result in better weightloss.
In summary, the results of these studies provide support forthe family-based behavioral treatment of childhood obesity.These studies provide the first evidence that weight regulationin children can be achieved and maintained over extendedperiods from childhood through adolescence to adulthood.The studies point to two treatment variables that can bereplicated and extended in subsequent studies. Study 1 sug-gested that in intact families effects are improved for childrenby including a parent with the child in treatment. This effectought to be replicated in other populations, in particular,single-parent and disadvantaged families. The power of thesefamily-based procedures may be enhanced by including intreatment other family members that influence the eating andexercise regulation of the targeted child, such as both parentsand siblings. Study 4 suggested that exercise enhances thelong-term effects of diet interventions, but additional work is
needed on other types of exercise programs, such as resistanceexercise or cross training. Likewise, the interaction betweendiet and exercise change needs to be explored, and the type ofdiet that best compliments activity change and the order ofimplementation (together or sequential) of diet and exercisechange addressed. The treated children generally showedlong-term decreases in percentage overweight, and someinterventions that did not show between-groups differences at10 years showed sustained decreases in percentage overweightand may warrant additional research. Given that these studiesinvolve 10-year follow-up, with the series initiated in 1977, theinterventions are quite old and may not represent state-of-the-art treatment. Newer studies, which take advantage of ad-vances in understanding child development, methods of incor-porating many family members in treatment, and behavioraland biological research on eating and activity may result infurther improvements in the outcome of attempts to preventobese children from becoming obese adults (Epstein, 1990).
References
Abraham, S., Collins, G., & Nordsieck, M. (1971). Relationship ofchildhood weight status to morbidity in adults. Public HealthRecords, 85, 273-284.
Abraham, S., & Nordsieck, M. (1960). Relationship of excess weight inchildren and adults. Public Health Reports, 75, 263-273.
Achenbach, T. M. (1991). Manual for the Child Behavior Checklist 14-18and 1991 profile. Burlington, VT: University of Vermont Depart-ment of Psychiatry.
American Psychiatric Association. (1987). Diagnostic and statisticalmanual of mental disorders (Rev. 3rd ed.). Washington, DC: Author.
Black, D. W., Goldstein, R. B., & Mason, E. E. (1992). Prevalence ofmental disorder in 88 morbidly obese bariatric clinic patients.American Journal of Psychiatry, 149, 227-234.
Bowman, R. L., & DeLuca, J. L. (1992). Accuracy of self-reportedweight: A meta-analysis. Behavior Therapy, 23, 637-656.
Bradley, P. J. (1985). Conditions recalled to have been associated withweight gain in adulthood. Appetite, 6, 235-241.
Brownell, K. D., Marlatt, G. A., Lichenstein, E., & Wilson, G. T.(1986). Understanding and preventing relapse. American Psycholo-gist, 41, 756-782.
Charney, M., Goodman, H. C, McBride, M., Lyon, B., & Pratt, R.(1976). Childhood antecedents of adult obesity: Do chubby infantsbecome obese adults? New England Journal of Medicine, 295, 6-9.
Cohen, J. (1977). Statistical power analysis for the behavioral sciences.Orlando, FL: Academic Press.
Epstein, L. H. (1990). Behavioral treatment of obesity. In E. M.Strieker (Ed.), Handbook of behavioral neurobiology: Vol. 10. Neuro-biology of food and fluid intake (pp. 61-73). New York: Plenum Press.
Epstein, L. H., Klein, K. R., & Wisniewski, L. (1994). Child and parentfactors that influence psychological problems in obese children.International Journal of Eating Disorders, 15, 151-157.
Epstein, L. H., Koeske, R., & Wing, R. R. (1984). Adherence toexercise in obese children. Journal of Cardiac Rehabilitation, 4,185-195.
Epstein, L. H., McCurley, J., Valoski, A., & Wing, R. R. (1990).Growth in obese children treated for obesity. American Journal ofDiseases of Children, 144, 1360-1364.
Epstein, L. H., McCurley, J., Wing, R. R., & Valoski, A. (1990).
382 EPSTEIN, VALOSKI, WING, AND McCURLEY
Five-year follow-up of family-based behavioral treatments for child-hood obesity. Journal of Consulting and Clinical Psychology, 58,661-664.
Epstein, L. H., Valoski, A., Koeske, R., & Wing, R. R. (1986).Family-based behavioral weight control in obese young children.Journal of American Dietetic Association, 86, 481-484.
Epstein, L. H., Valoski, A., & McCurley, J. (1992). Compliance andlong term follow-up for childhood obesity: Retrospective analysis. InN. A. Krasnegor, L. H. Epstein, S. B. Johnson, & S. J. Yaffe (Eds.),Developmental aspects of health compliance behavior (pp. 233-249).Hillsdale, NJ: Erlbaum.
Epstein, L. H., Valoski, A., & McCurley, J. (1993). The effect of weightloss by obese children on long-term growth. American Journal ofDiseases of Children, 147, 1076-1080.
Epstein, L. H., Valoski, A., Wing, R. R., & McCurley, J. (1990).Ten-year follow-up of behavioral, family-based treatment for obesechildren. Journal of the American Medical Association, 264, 2519-2523.
Epstein, L. H., & Wing, R. R. (1987). Behavioral treatment ofchildhood obesity. Psychological Bulletin, 101, 331-342.
Epstein, L. H., Wing, R. R., Koeske, R., Andrasik, F., & Ossip, D. J.(1981). Child and parent weight loss in family-based behavioralmodification programs. Journal of Consulting and Clinical Psychol-ogy, 49, 674-685.
Epstein, L. H., Wing, R. R., Koeske, R., & Valoski, A. (1984). Theeffects of diet plus exercise on weight change in parents andchildren. Journal of Consulting and Clinical Psychology, 52, 429-437.
Epstein, L. H., Wing, R. R., Koeske, R., & Valoski, A. (1985). Acomparison of lifestyle exercise, aerobic exercise, and calisthenicson weight loss in obese children. Behavior Therapy, 16, 345-356.
Epstein, L. H., Wing, R. R., Koeske, R., & Valoski, A. (1986). Effect ofparent weight on weight loss in obese children. Journal of Consultingand Clinical Psychology, 54, 400-401.
Epstein, L. H., Wing, R. R., Koeske, R., & Valoski, A. (1987).Long-term effects of family-based treatment of childhood obesity.Journal of Consulting and Clinical Psychology, 55, 91-95.
Epstein, L. H., Wing, R. R., Steranchak, L., Dickson, B., & Michelson,J. (1980). Comparison of family-based behavior modification andnutrition education for childhood obesity. Journal of PediatricPsychology, 5, 25-36.
Epstein, L. H., Wing, R. R., Valoski, A., & Gooding, W. (1987).Long-term effects of parent weight on child weight loss. BehaviorTherapy, 18, 219-226.
Epstein, L. H., Wing, R. R., Woodall, K., Penner, B. C, Kress, M. J., &Koeske, R. (1985). Effects of family-based behavioral treatment onobese 5- to 8-year-old children. Behavior Therapy, 16, 205-212.
Fairburn, C. G., & Beglin, S. J. (1990). Studies on the epidemiology ofbulimia nervosa. American Journal of Psychiatry, 147, 401-408.
Forster, J. L., Bloom, E., Sorensen, G., Jeffery, R. W., & Prineas, R. J.(1986). Reproductive history and body mass index in black andwhite women. Preventive Medicine, 15, 685-691.
Goldsmith, S. J., Anger-Friedfeld, K., Beren, S., Rudolph, D., Boeck,M., & Aronne, L. (1992). Psychiatric illness in patients presentingfor obesity treatment. International Journal of Eating Disorders, 12,63-71.
Gortmaker, S. L., Dietz, W. H., Sobol, A. M., & Wehler, C. A. (1987).Increasing pediatric obesity in the United States. American Journalof Diseases in Children, 141, 535-540.
Hammer, L. D., Kraemer, H. C., Wilson, D. M., Ritter, P. L., &Dornbusch, S. M. (1991). Standardized percentile curves of body-mass index for children and adults. American Journal of Diseases ofChildren, 145, 259-263.
Hollingshead, A. B. (1975). Four factor index of social status. Unpub-lished manuscript, Yale University, New Haven, CT.
Hubert, H. B., Eaker, E. D., Garrison, R. J., & Castelli, W. P. (1987).Life-style correlates of risk factor change in young adults: Aneight-year study of coronary heart disease risk factors in theFramingham offspring. American Journal of Epidemiology, 125,812-831.
Israel, A. C., Stolmaker, L., Sharp, J. P., Silverman, W. K., & Simon,L. G. (1984). An evaluation of two methods of parental involvementin treating obese children. Behavior Therapy, 15, 266-272.
Jelliffe, D. B. (1966). The assessment of the nutritional status of thecommunity. Geneva: World Health Organization.
Kirschenbaum, D. S., Harris, E. S., & Tomarken, A. J. (1984). Effectsof parental involvement in behavioral weight loss therapy forpreadolescents. Behavior Therapy, 15, 485-500.
Maloney, M. J., McGuire, J. B., Daniels, S. R., & Specker, B. (1989).Dieting behavior and eating attitudes in children. Pediatrics, 84,482-489.
Metropolitan Life Insurance Company. (1983). 1983 Metropolitanheight and weight tables. Statistical Bulletin, 64, 1-9.
Must, A., Dallal, G. E., & Dietz, W. H. (1991). Reference data forobesity: 85th and 95th percentiles of body mass index (wt/ht2) andtriceps skinfold thickness. American Journal of Clinical Nutrition, 53,839-846.
Must, A., Jacques, P. F., Dallal, G. E., Bajema, C. J., & Dietz, W. H.(1992). Long-term morbidity and mortality of overweight adoles-cents: A follow-up of the Harvard Growth Study of 1922 to 1935.New England Journal of Medicine, 327, 1350-1355.
Nieto, F. J., Szklo, M., & Comstock, G. W. (1992). Childhood weightand growth rate as predictors of adult mortality. American Journal ofEpidemiology, 136, 201-213.
Noppa, H., & Bengston, C. (1980). Obesity in relation to smoking: Apopulation study of women in Goteborg, Sweden. Preventive Medi-cine, 9, 534-543.
Nuutinen, O., & Knip, M. (1992). Long-term weight control in obesechildren: Persistence of treatment outcome and metabolic changes.International Journal of Obesity, 16, 279-287.
Paffenbarger, R. S., Hyde, R. T., Wing, A. L., & Hsieh, C. C. (1986).Physical activity, all-cause mortality, and longevity of college alumni.New England Journal of Medicine, 314, 605-613.
Paffenbarger, R. S., Wing, A. L., & Hyde, R. T. (1978). Physicalactivity as an index of heart attack risk in college alumni. AmericanJournal of Epidemiology, 108, 161-175.
Pyle, R. L., Neuman, P. A., Halvorson, P. A., & Mitchell, J. E. (1991).An ongoing cross-sectional study of the prevalence of eatingdisorders in freshman college students. International Journal ofEating Disorders, 10, 667-677.
Sallis, J. F., Grossman, R. M., Pinski, R. B., Patterson, T. L., & Nader,P. R. (1987). The development of scales to measure social supportfor diet and exercise behaviors. Preventive Medicine, 16, 825-836.
Siconolfi, S. F., Lasater, T. M., Snow, R. C. K, & Carleton, R. A.(1985). Self-reported physical activity compared with maximaloxygen uptake. American Journal of Epidemiology, 122, 101-105.
Spitzer, R. L., Devlin, M., Walsh, B. T., Hasin, D., Wing, R., Marcus,M., Stunkard, A., Wadden, T., Yanovski, S., Agras, S., Mitchell, J.,& Nonas, C. (1992). Binge eating disorder: A multisite field trial ofthe diagnostic criteria. International Journal of Eating Disorders, 11,191-203.
Spitzer, R. L., Yanovski, S., Wadden, T., Wing, R., Marcus, M.,Stunkard, A., Devlin, M., Mitchell, J., & Hasin, D. (1993). Bingeeating disorder: Its further validation in a multisite study. Interna-tional Journal of Eating Disorders, 13, 137-153.

TEN-YEAR OBESITY OUTCOMES 383
Stark, O., Atkins, E., Wolff, O. H., & Douglas, J. W. B. (1981).Longitudinal study of obesity in the National Survey of Health andDevelopment. British Medical Journal, 283, 13-17.
Valoski, A., & Epstein, L. H. (1990). Nutrient intake of obese childrenin a family-based behavioral weight control program. InternationalJournal of Obesity, 14, 667-677.
Wilkinson, L. (1992). SYSTAT for Windows [Computer manual].Evanston, IL: SYSTAT.
Willett, W. C, Reynolds, R. D., Cottrell-Hoehner, S., Sampson, L., &Browne, M. L. (1987). Validation of a semi-quantitative foodfrequency questionnaire: Comparison with a 1-year diet record.Journal of the American Dietetic Association, 87, 43-47.
Willett, W. C, Sampson, L., Stampfer, M. J., Rosner, B., Bain, C,Witschi, J., Hennekens, C. H., & Speizer, F. E. (1985). Reproducibil-ity and validity of a semiquantitative food frequency questionnaire.American Journal of Epidemiology, 122, 51-65.
AMERICAN PSYCHOLOGICAL ASSOCIATIONSUBSCRIPTION CLAIMS INFORMATION Today's Date:_
We provide this form to assist members, institutions, and nonmember individuals with any subscription problems. With theappropriate information we can begin a resolution. If you use the services of an agent, please do NOT duplicate claims throughthem and directly to us. PLEASE PRINT CLEARLY AND IN INK IF POSSIBLE.
HUNT FULL NAME OR KEY NAME OF INSTITUTION
ADDRESS
MEMBER OR CUSTOMER NUMBER (MAYBEFOUND ON ANYPASTISSUE LABEL)
DATE YOUR ORDER WAS MAILED (OR PHONED)
PREPAID CHECK __CHARGECHECK/CARD CLEARED DATE:..
crrY STATE/COUNTRY
YOUR NAME AND PHONE NUMBER
TITLE
df possible, send a copy, front and back, of your cancelled check to help us in our researchof your claim.)
ISSUES: __ MISSING DAMAGED
VOLUME OR YEAR NUMBER OR MONTH
Thank you. Once a claim is received and resolved, delivery of replacement issues routinely takes 4-6 weeks.
———————— (TO BE FILLED OUT BY APA STAFF) —i^—^———
DATE RECEIVED:.ACTION TAKEN: JSTAFF NAME:
DATE OF ACTION: _INV.NO.&DATE:LABEL NO. & DATE:_
Send this form to APA Subscription Claims, 750 First Street, NE, Washington, DC 20002-4242
PLEASE DO NOT REMOVE. A PHOTOCOPY MAY BE USED.