empirical analysis and statistical modeling of errors in satellite precipitation sensors yudong...
TRANSCRIPT

Empirical Analysis and Statistical Modeling of Errors in Satellite Precipitation Sensors
Yudong Tian, Ling Tang, Robert Adler, and Xin Lin
University of Maryland & NASA/GSFC
http://sigma.umd.edu
Sponsored by NASA ESDR-ERR Program

Motivation
• Two error sources in merged satellite data: -- the merging algorithm -- the upstream sensors
• Studying errors in the sensors is necessary in understanding errors in merged products
2

Outline
• To understand: empirical analysis of systematic errors: characterizing errors in passive microwave (PMW) sensors
• To quantify and to predict: statistical modeling of errors: with a measurement error model, to quantify both systematic and random errors
• Summary and Conclusions
3

Data and Study Period
• Time period: 3 years, 2009 ~ 2011
• Ground reference: Q2 (NOAA NSSL Next Generation QPE), bias-corrected with NOAA NCEP Stage IV (hourly, 4-km)
– Resolution: 5 minutes, 1 km, remapped to 5 mins,0.25o
• Satellite sensor instantaneous rainfall measurements aggregated to 5 minutes time interval
– Sensors: TMI, AMSR-E, and SSMIS – Imagers only for now– Resolution: 5 minutes, 0.25o
– Satellite data matched with Q2 over CONUS
4

5
Sensors covered by the study period

6
Q2 has biases and was corrected with Stage IV data
Before After
CPC Gauge Stage IV Radar

Sample sizes matched between sensors and Q2
7
AMSR-E TMI
SSMIS F16 SSMIS F17
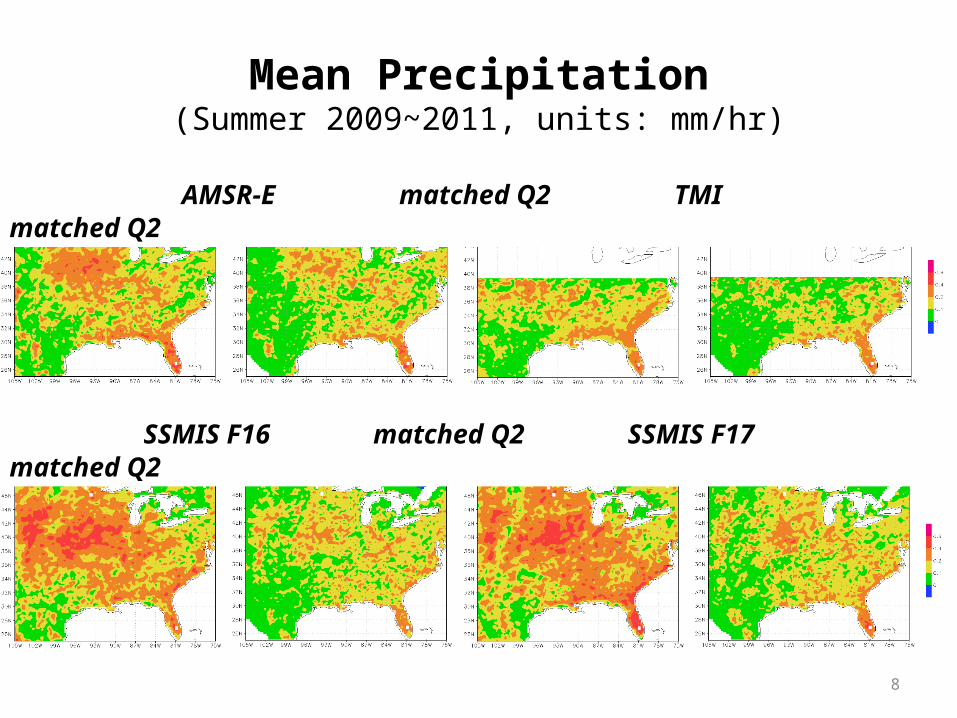
Mean Precipitation(Summer 2009~2011, units: mm/hr)
8
AMSR-E matched Q2 TMI matched Q2
SSMIS F16 matched Q2 SSMIS F17 matched Q2

Precipitation – Density Scatter Plots(Summer 2009~2011)
9
AMSR-E TMI
SSMIS F16 SSMIS F17

More overestimates in SSMIS for summer
10
AMSR-E TMI
SSMIS F16 SSMIS F17

11
AMSR-E TMI
SSMIS F16 SSMIS F17
More underestimates in AMSR-E & TMI for winter

PDF Comparisons confirm season-dependent error characteristics
12
AMSR-E TMI AMSR-E TMI
SSMIS F16 SSMIS F17 SSMIS F16 SSMIS F17
Summer Winter

13
A nonlinear multiplicative measurement error model:
Xi: truth, error free. Yi: measurements
With a logarithm transformation,
the model is now a linear, additive error model, with three parameters:
A=log(α), B=β, and σ
which can be easily estimated with ordinary least squares (OLS) method.
Modeling the Measurement Errors: A-B-σ model
eXY ii ),0(~ 2 N
)1()log()log()log( ii XY

14
• Clean separation of systematic and random errors
• More appropriate for measurements with several
orders of magnitude variability
• Good predictive skills
Tian et al., 2012: Error modeling for daily precipitation measurements: additive or multiplicative? to be submitted to Geophys. Rev. Lett.
Justification for the nonlinear multiplicative error model

Spatial distribution of the model parameters
15
TMI
AMSR-E
F16
F17
)()log()log( stdevXBAY ii A B σ(random error)

16
Probability distribution of the model parameters
A B σ
TMI
AMSR-E
F16
F17
)()log()log( stdevXBAY ii

Summary and Conclusions1. what we did
• Created bias-corrected radar data for validation
• Evaluated biases in PMW imagers: AMSR-E, TMI and SSMIS
• Constructed an error model to quantify both systematic and random errors
17

Summary and Conclusions2. what we found
• Sensor biases have seasonal and rain-rate dependency: summer – overestimates; winter: underestimates • AMSR-E and TMI did better in summer; SSMI F16 and F17 in
winter
• The multiplicative error model works consistently well• Both systematic and random errors are quantified• Model indicated AMSR-E had the lowest uncertainty
Results useful for data assimilation, algorithm cal/val, etc.
18

Extra slides
19

20
What we did:
1. A nonlinear multiplicative error model
2. Constant variance in random errors
3. More appropriate for variables with several orders of variability
4. A parametric model is useful for data assimilation, cal/val
What we found:
5. The model works well
6. Constant variance in random errors
7. More appropriate for variables with several orders of variability
8. A parametric model is useful for data assimilation, cal/val
Summary and Conclusions

Summary and Conclusionswhat we did:
• AMSR-E and TMI underestimate rainfall in winter in Southeast US.
• AMSR-E , SSMIS F16 and F17 overestimate rainfall in Summer in Central and Southeast US.
• SSMIS F16 and F17 have high positive BIAS in Summer, over Central US; AMSR-E and TMI have high negative BIAS in Winter, over Southeast US.
• TMI performs the best compared with the other three sensors.
21
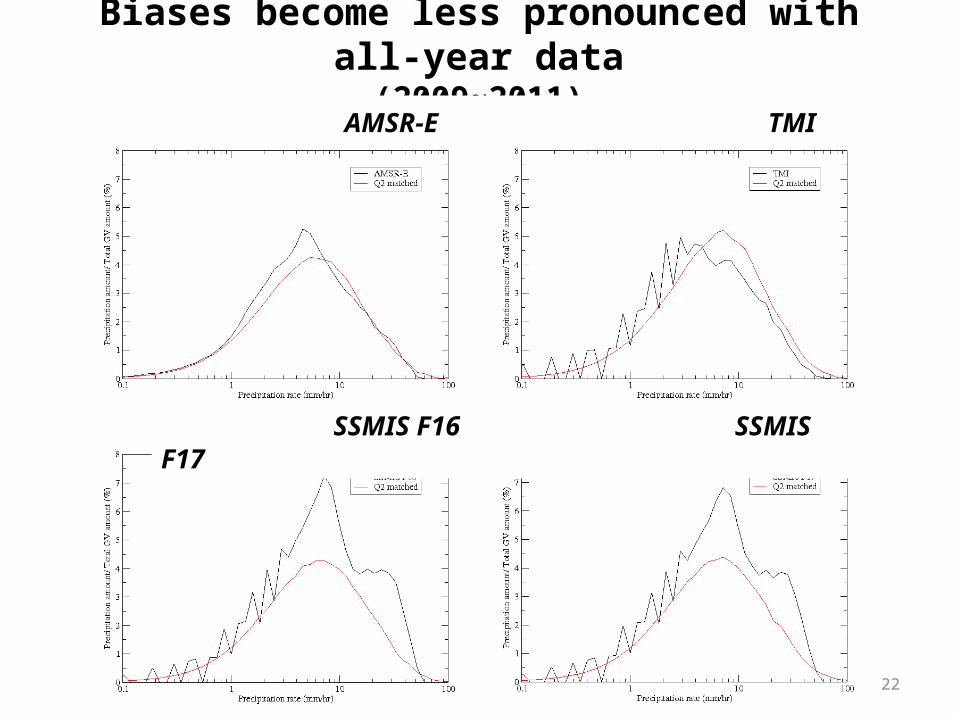
Biases become less pronounced with all-year data(2009~2011)
22
AMSR-E TMI
SSMIS F16 SSMIS F17

23
Satellite Sensor Data Availability
1995 1996 1997 1998 1999 2000 2001 2002 2003 2004 2005 2006 2007 2008 2009 2010 2011SSMIF13
0101-0502
0707-1231
1120-1231
No data
No data
SSMIF14
No data
No data
0101-0506
0824-1231
No data
No data
No data
SSMIF15
No data
No data
No data
No data
No data
0101-0222, 1201
0814-1231
No data
No data
No data
No data
No data
SSMISF16
No data
No data
No data
No data
No data
No data
No data
No data No data
No data
0101-1031
SSMISF17
No data
No data
No data
No data
No data
No data
No data
No data No data
No data
No data
0101-1212
SSMISF18
No data
No data
No data
No data
No data
No data
No data
No data No data
No data
No data
No data
No data
No data
No data
0101-0307
TMI No data
No data
0101-1207
AMSR-E No data
No data
No data
No data
No data
No data
No data
0101-0618,0730-0807,0913-0919
1004-1231
No data Missing files Complete

Precipitation – Density Scatter Plots(2009~2011)
24
AMSR-E TMI
SSMIS F16 SSMIS F17

Precipitation – Density Scatter Plots(Winter 2009~2011)
25
AMSR-E TMI
SSMIS F16 SSMIS F17

Sensors show mostly overestimates for summer
26
AMSR-E TMI AMSR-E TMI
SSMIS F16 SSMIS F17 SSMIS F16 SSMIS F17
Summer

Spatial distribution of the model parameters (for winter)
27
A B σ
TMI
AMSR-E
F16
F17

Spatial distribution of the model parameters for summer
28
A B σ
TMI
AMSR-E
F16
F17