emission model sensitivity analysis: the value of - openstarts
TRANSCRIPT

European Transport \ Trasporti Europei (2013) Issue 54, Paper n° 8, ISSN 1825-3997
1
Emission Model Sensitivity Analysis: The Value of
Smart Phone Weight-Mile Tax Truck Data
Katherine E. Bell 1
, Sirisha M. Kothuri 1, Miguel A. Figliozzi
1
1Department of Civil and Environmental Engineering, Portland State University, Portland, OR
Abstract
This research serves to evaluate the potential use of a system developed by the Oregon Department of
Transportation (ODOT) for emission estimates. The data collection system developed by ODOT – Truck
Road Use Electronics (TRUE) – includes a smart phone application with a Global Positioning System
(GPS) device and microprocessor. Previous research with the TRUE data served to demonstrate its use
for important ancillary applications such as highly accurate trip generation rates and mobility
performance measures. In addition, it was shown that the TRUE data has strong potential use for safety,
accessibility and connectivity, system condition and environmental stewardship performance measures.
This new research builds on that past work and evaluates the potential use of the TRUE data for
emissions estimates that take into account truck type details, truck weight and detailed speed profiles. A sensitivity analysis using the U.S. Environmental Protection Agency's (EPA) Motor Vehicle Emission
Simulator 2010b (MOVES2010b) is performed in order to understand the level of error that might be
encountered when such detailed data are not available. The impact of grade on emissions estimates is also
considered. Results indicate that TRUE data in integration with Oregon Department of Transportation
(ODOT) weight-mile tax (WMT) data will greatly improve the accuracy of emissions estimations at the
project and regional level.
Keywords: urban freight, emissions, road charging, modelling, GPS, transport sector externalities
1. Introduction
Reliable freight transportation is particularly important to Oregon due to its
geographic location. According to The Oregon Freight Plan (Cambridge Systematics,
Inc., 2011), Oregon is the ninth most trade-dependent state in the U.S. and is expected
to see significant increases in freight flows in the future. This trade dependency comes
with unwanted side effects, particularly in urban centers, such as congestion, travel
unreliability, environmental and health concerns, and increased transport costs (Wheeler
and Figliozzi, 2011) (Figliozzi, et al., 2011). In this regard, recent research stresses the
importance of freight performance measures and associated data management processes
in sustaining an effective transportation planning system (McMullen and Monsere,
2010) (NCFRP, 2011). Freight data that might be used for such performance measures
Corresponding author: Katherine E. Bell ([email protected])

European Transport \ Trasporti Europei (2013) Issue 54, Paper n° 8, ISSN 1825-3997
2
is usually incomplete, scarce and expensive to collect. However, a unique and highly
promising data source is available through a system recently developed by ODOT to
simplify its weight-mile tax (WMT) collection.
Oregon is one of the few states in the U.S. that currently charge a commercial truck
WMT. The current WMT applies to, and is the primary form of taxation for, trucks over
26,000 lbs. In February 2010, the ODOT Motor Carrier Transportation Division
(MCTD) implemented a pilot project for the use of Truck Road Use Electronics
(TRUE) (ODOT, n.d.). The TRUE system provides an automated process for WMT
collection that reduces the administrative burden on trucking firms and ODOT while
also reducing reporting errors and tax avoidance. The system includes a smart phone
application with a Global Positioning System (GPS) device and microprocessor. The
application can be uploaded to the phones of truck drivers in order to track miles
traveled; the data is then sent electronically to ODOT to produce the company's WMT
"invoice" which can be paid online. The TRUE application has been developed with the
intention that it can be used in the form of a smartphone application on a wide variety of
hardware so that in the future, trucking companies could use a wireless device of their
choosing (ODOT, n.d.).
Oregon is ideally suited for statewide implementation of a system such as TRUE as it
already has an established WMT system. Under Oregon law, motor carriers operate as a
regulated industry and are required to report miles traveled. However, Oregon Revised
Statute (ORS) (Oregon State Legislature, 2011) 825.517 specifies that data collected for
the WMT system is not public record. Therefore, the privacy of motor carriers using the
TRUE system is protected by Oregon law. Under Oregon's existing WMT system,
companies self-report the miles traveled in Oregon for each axle combination; taxes are
paid on a monthly or quarterly basis. Truck drivers must maintain log books to track
hours of service, truck combination, number of axles, and trip odometer readings and
then calculate their WMT. The administration of WMT in Oregon has traditionally been
very paperwork intensive. In 2003 ODOT implemented Oregon Trucking Online (OTO)
in order to simplify WMT collection (ODOT, n.d.). In recent years, approximately 25%
of WMT payments were made online through OTO. TRUE provides opportunity for
further regulatory streamlining and reduction of paperwork associated with WMT, thus
reducing the time and resources required (of both the state and truck companies) to
calculate, pay and process WMT.
Due to its level of disaggregation and its potential to differentiate between vehicle and
commodity types, the TRUE dataset has many unique characteristics and enormous
advantages over truck GPS data used in past research. Data collected through TRUE not
only provides commercial truck origin-destination, space/time coordinates and
trajectories, but also weight class, truck type and commodity codes when combined with
Weigh-in-Motion (WIM) data. Such information can be used to understand the
intricacies of freight transportation and to better inform decision makers. Previous
research (Bell and Figliozzi, 2013) with the TRUE data served to demonstrate its use for
important ancillary applications such as highly accurate trip generation rates and
mobility performance measures. In addition, it was shown that the TRUE data has
strong potential use for safety, accessibility and connectivity, system condition and
environmental stewardship performance measures. This new research builds on that past
work and evaluates the potential use of the TRUE data for emissions estimates that take
into account truck type details, truck weight and detailed speed profiles. A sensitivity
analysis using the U.S. Environmental Protection Agency's (EPA) Motor Vehicle
European Transport \ Trasporti Europei (2013) Issue 54, Paper n° 8, ISSN 1825-3997
3
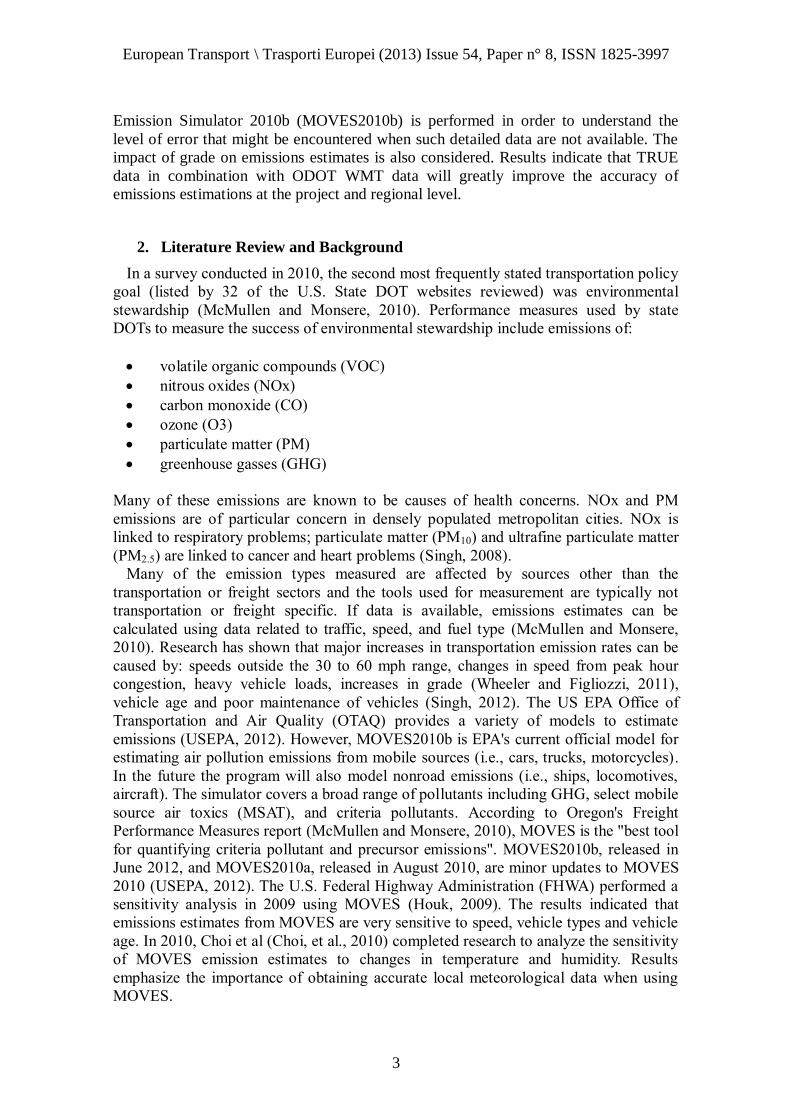
Emission Simulator 2010b (MOVES2010b) is performed in order to understand the
level of error that might be encountered when such detailed data are not available. The
impact of grade on emissions estimates is also considered. Results indicate that TRUE
data in combination with ODOT WMT data will greatly improve the accuracy of
emissions estimations at the project and regional level.
2. Literature Review and Background
In a survey conducted in 2010, the second most frequently stated transportation policy
goal (listed by 32 of the U.S. State DOT websites reviewed) was environmental
stewardship (McMullen and Monsere, 2010). Performance measures used by state
DOTs to measure the success of environmental stewardship include emissions of:
volatile organic compounds (VOC)
nitrous oxides (NOx)
carbon monoxide (CO)
ozone (O3)
particulate matter (PM)
greenhouse gasses (GHG)
Many of these emissions are known to be causes of health concerns. NOx and PM
emissions are of particular concern in densely populated metropolitan cities. NOx is
linked to respiratory problems; particulate matter (PM10) and ultrafine particulate matter
(PM2.5) are linked to cancer and heart problems (Singh, 2008).
Many of the emission types measured are affected by sources other than the
transportation or freight sectors and the tools used for measurement are typically not
transportation or freight specific. If data is available, emissions estimates can be
calculated using data related to traffic, speed, and fuel type (McMullen and Monsere,
2010). Research has shown that major increases in transportation emission rates can be
caused by: speeds outside the 30 to 60 mph range, changes in speed from peak hour
congestion, heavy vehicle loads, increases in grade (Wheeler and Figliozzi, 2011),
vehicle age and poor maintenance of vehicles (Singh, 2012). The US EPA Office of
Transportation and Air Quality (OTAQ) provides a variety of models to estimate
emissions (USEPA, 2012). However, MOVES2010b is EPA's current official model for
estimating air pollution emissions from mobile sources (i.e., cars, trucks, motorcycles).
In the future the program will also model nonroad emissions (i.e., ships, locomotives,
aircraft). The simulator covers a broad range of pollutants including GHG, select mobile
source air toxics (MSAT), and criteria pollutants. According to Oregon's Freight
Performance Measures report (McMullen and Monsere, 2010), MOVES is the "best tool
for quantifying criteria pollutant and precursor emissions". MOVES2010b, released in
June 2012, and MOVES2010a, released in August 2010, are minor updates to MOVES
2010 (USEPA, 2012). The U.S. Federal Highway Administration (FHWA) performed a
sensitivity analysis in 2009 using MOVES (Houk, 2009). The results indicated that
emissions estimates from MOVES are very sensitive to speed, vehicle types and vehicle
age. In 2010, Choi et al (Choi, et al., 2010) completed research to analyze the sensitivity
of MOVES emission estimates to changes in temperature and humidity. Results
emphasize the importance of obtaining accurate local meteorological data when using
MOVES.

European Transport \ Trasporti Europei (2013) Issue 54, Paper n° 8, ISSN 1825-3997
4
More recently, a 'regional level' sensitivity analysis was performed by the FHWA in
an effort to highlight areas where air quality practitioners should focus to refine their
MOVES model inputs. This study focused on running emissions process for of CO,
PM2.5, NOx and VOCs. The variables considered and input ranges used included:
Temperature (-40F to 120F)
Humidity (0 to 100%)
Ramp Fraction (0 to 0.20)
Analysis Year (2010 to 2050)
Age Distribution (three groups)
Average Speed Distribution
The results were generally consistent with those from the aforementioned sensitivity
analyses. Emissions rates were found to be very sensitive to changes in speed, vehicle
type, age, humidity and temperature.
NCFRP Report 10, which focuses on performance measurements specific to the
freight sector, addresses the concern of rising GHG emissions. According to the report,
national targets for other types of large/heavy-duty truck emissions are on track, but the
truck industry's GHG emissions continue to rise. Unlike with other types of emissions,
methods to reduce vehicular GHG emissions have not yet been developed (NCFRP,
2011). ODOT recognizes the need to address this concern and has developed the
Greenhouse Gas Statewide Transportation Emissions Planning (GreenSTEP) Model to
assess the effects of policies and other factors (i.e., gas prices) on GHG emissions from
the transportation sectors (ODOT, 2011). GreenSTEP is a sketch level planning tool
used to model estimates and determine forecasts for vehicle ownership, vehicle travel,
fuel consumption, and GHG emissions. GreenSTEP is currently focused on emissions
from household and light duty commercial vehicles (i.e., autos, SUVs, pickup trucks,
vans); modeling of GHG emissions from freight is still under development. According
to ODOT reports (ODOT, 2011), estimates from GreenSTEP could further be used to
assess the relative equity of different policy proposals for different road users.
3. Truck Road Use Electronics (TRUE)
3.1 Data Description and Preliminary Analysis
Data available for this research consists of 172,385 records from the TRUE pilot
study for the entire year of 2011. Seventeen trucks subject to Oregon's WMT were
equipped with a TRUE device for the pilot study. These trucks represent three different
carriers. The TRUE devices were configured to collect the latitude and longitude
locations of each vehicle every five minutes. The travel of the pilot study vehicles was
tracked through seven U.S. states and three regions in Canada; however, the geographic
limitations of future data collection would be dependent on the degree of partnership
with the private sector. Through trips using Oregon's highway network still have to pay
WMT, and hence may be included in future datasets if companies adopt the system. The
intention of the pilot project was to test the TRUE system, potential applications, and
associated data processes rather than to provide data that is representative of the entire
population of trucks in Oregon. Likewise, regardless of the sample rate of this pilot

European Transport \ Trasporti Europei (2013) Issue 54, Paper n° 8, ISSN 1825-3997
5
study, the methodologies proposed could be applied to the statewide implementation of
the TRUE system. According to the "GPS_ACCURACY" field of the data, the accuracy
of the GPS readings range from three to 840 feet. Figure 1 provides a histogram of the
cumulative distribution of the values from the "GPS Accuracy" field for readings up to
80 feet (the small number of records with accuracy worse than 80 feet are not included
in the figure). An accuracy of within ten feet was recorded for over fifty percent of the
GPS records; within twenty feet for over 75%; within 53 feet for over 95%; and within
79 feet for over 98%.
Figure 1: Distribution of GPS Accuracies
In addition to the GPS records, the data set available for this research includes
corresponding weigh-in-motion (WIM) station records for the pilot project vehicles.
Figure 2 provides a schematic showing data fields available through the TRUE dataset
and the WIM dataset. Using the "DEVICE_ID","BASE_PLATE",
"WAYPOINT_TIME" and "WEI_PSTDATETIME" fields, a TRUE record can be
found for each WIM record that is: a) from the same truck as the WIM record; and b)
closest in time to the WIM. This process can be completed using RStudio. Preliminary
review of the TRUE records and corresponding WIM data indicates that the TRUE
records from the pilot project represent vehicles of nine different weight classes
(ranging from 46,000 lbs. to 105,500 lbs.), with four to eight axles, and three different
commodity codes ("empty", "machinery" and "other"). Further applications available
through the linkage of these two datasets are described in (Bell and Figliozzi, 2013).

European Transport \ Trasporti Europei (2013) Issue 54, Paper n° 8, ISSN 1825-3997
6
Figure 2: TRUE Data Fields
The TRUE data in its "raw" format provides values for the fields listed in the top and
middle sections of Figure 2 including latitude and longitude coordinates with
corresponding timestamps, weight class and axle count of vehicles, and GPS record
accuracy. The initial data processing steps consisted of formatting including conversion
of timestamp values to database readable time format. Further data processing using a
combination of Excel, "RStudio" and ArcView GIS allows disaggregation of the dataset
to levels that have not been possible with previous datasets. Figure 3 is a GIS plot
providing an example of the ability to disaggregate the dataset by weight class. As an
example, this plot shows 2011 record counts from the TRUE pilot project for the 1030
(GVW up to 103,000 lbs) weight class. Similar disaggregation by commodity type,
vehicle type, axle count, gross weight and axle weight is also possible. Additional data
processing required for emissions applications is discussed in the proceeding sections of
the paper.

European Transport \ Trasporti Europei (2013) Issue 54, Paper n° 8, ISSN 1825-3997
7
Figure 3: GPS Record Count for 1030 Weight Class
3.2 Speed Estimates
Of the freight performance measures typically used at a national and state level, those
associated with mobility have received the most attention with regards to freight GPS
data research (Bell and Figliozzi, 2013), specifically in relation to travel time reliability
and congestion at bottlenecks (McMullen and Monsere, 2010). Emission rates are
highly correlated with travel speeds and traffic conditions (Figliozzi, 2011). Hence,
accurate environmental performance measures related to emissions are greatly
dependent on the availability of detailed mobility performance measures.
Previous research (Bell and Figliozzi, 2013) with the TRUE data presented a
methodology to estimate space-mean speeds using the TRUE data. In order to assess the
accuracy of the space-mean speed calculated from the TRUE data the calculated space-
mean speeds were compared to speeds from the Portland, Oregon Regional Archive
Listing (PORTAL) – the official Archived Data User Service (ADUS) for the Portland
metropolitan area. Speed measurements available through PORTAL are based on
inductive-loop detector data from nearly 600 sensors located throughout the Portland
metropolitan area on I-5, I-205, I-405, I-84, OR-207 and US-26 (Li and Bertini, 2010).
As can be seen in Figure 4, over fifty percent of the space-mean speeds calculated
from the TRUE dataset were within eight percent of the speeds calculated from
PORTAL; all of the TRUE speeds were within 25% of the PORTAL speeds. The
absolute values of the speed differences averaged nine percent; however, the TRUE
speeds were, on average, approximately seven percent (3.65 mph) less than the
PORTAL speeds. The speed differences had a standard deviation of eight percent (4.41
mph). Eighty percent of the TRUE speeds were less than the PORTAL speeds. This is
likely because PORTAL speeds are an aggregation of speed measurements from a

European Transport \ Trasporti Europei (2013) Issue 54, Paper n° 8, ISSN 1825-3997
8
variety of vehicle types (i.e., mostly passenger vehicles that typically travel at a faster
speed than trucks). The TRUE speeds ranged from 21% (12.4 mph) less than the
PORTAL speeds to ten percent (5.6 mph) greater than the PORTAL speeds.
Figure 4: Distribution of GPS Accuracies
The results of a paired sample t-test indicate that at the 0.01 significance level there is
sufficient evidence from the tested sample to conclude that the difference between the
PORTAL speeds and those calculated from the TRUE data is significant. This
conclusion is consistent with the findings of previous research on the same freeway
segments in the Portland region (Wheeler and Figliozzi, 2011); previous research results
indicated that speeds estimated from loop detectors were generally greater than speeds
estimated by truck GPS data provided by the American Transportation Research
Institute (ATRI).
4. MOVES Emission Estimates
4.1 Framework
This section describes the MOVES2010b input parameters and potential output as it
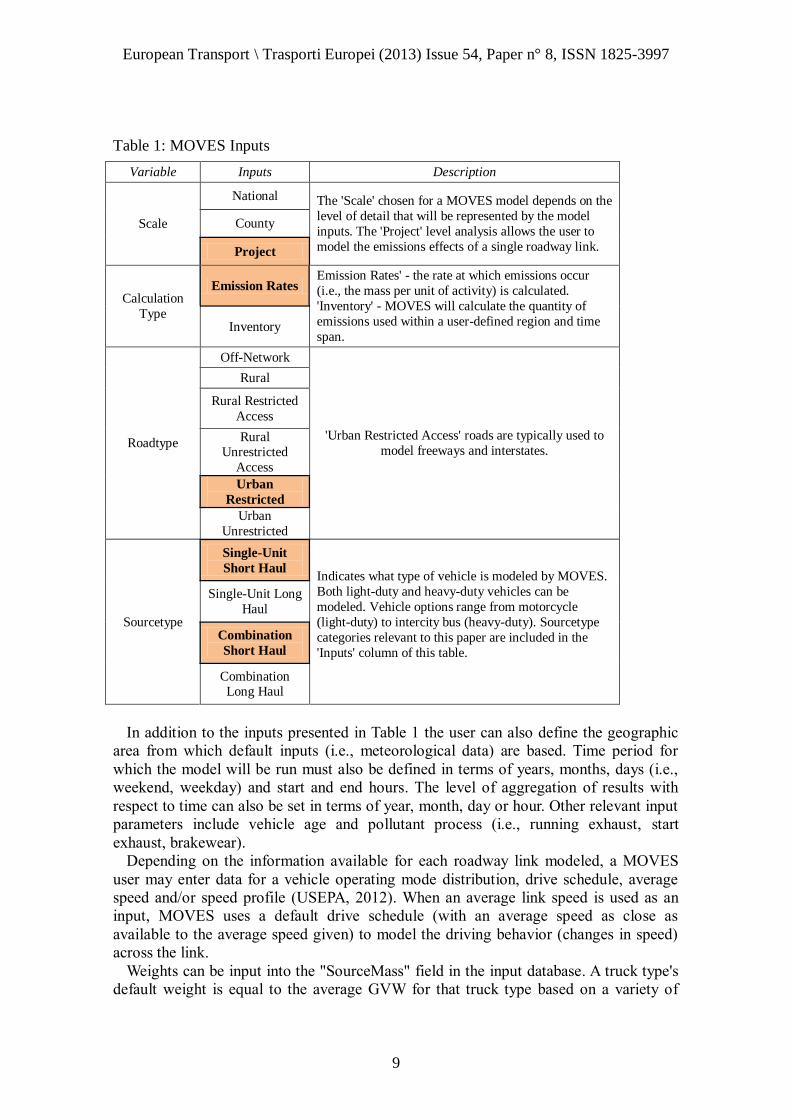
relates to the analysis presented in this paper. Table 1 provides a description of the
model inputs (USEPA, 2012); those selected for the model presented in this paper are
highlighted and in bold.
European Transport \ Trasporti Europei (2013) Issue 54, Paper n° 8, ISSN 1825-3997
9
Table 1: MOVES Inputs
Variable Inputs Description
Scale
National The 'Scale' chosen for a MOVES model depends on the
level of detail that will be represented by the model
inputs. The 'Project' level analysis allows the user to
model the emissions effects of a single roadway link.
County
Project
Calculation
Type
Emission Rates Emission Rates' - the rate at which emissions occur
(i.e., the mass per unit of activity) is calculated.
'Inventory' - MOVES will calculate the quantity of
emissions used within a user-defined region and time
span. Inventory
Roadtype
Off-Network
'Urban Restricted Access' roads are typically used to
model freeways and interstates.
Rural
Rural Restricted
Access
Rural Unrestricted
Access
Urban
Restricted
Urban
Unrestricted
Sourcetype
Single-Unit
Short Haul Indicates what type of vehicle is modeled by MOVES.
Both light-duty and heavy-duty vehicles can be
modeled. Vehicle options range from motorcycle
(light-duty) to intercity bus (heavy-duty). Sourcetype
categories relevant to this paper are included in the
'Inputs' column of this table.
Single-Unit Long
Haul
Combination
Short Haul
Combination Long Haul
In addition to the inputs presented in Table 1 the user can also define the geographic
area from which default inputs (i.e., meteorological data) are based. Time period for
which the model will be run must also be defined in terms of years, months, days (i.e.,
weekend, weekday) and start and end hours. The level of aggregation of results with
respect to time can also be set in terms of year, month, day or hour. Other relevant input
parameters include vehicle age and pollutant process (i.e., running exhaust, start
exhaust, brakewear).
Depending on the information available for each roadway link modeled, a MOVES
user may enter data for a vehicle operating mode distribution, drive schedule, average
speed and/or speed profile (USEPA, 2012). When an average link speed is used as an
input, MOVES uses a default drive schedule (with an average speed as close as
available to the average speed given) to model the driving behavior (changes in speed)
across the link.
Weights can be input into the "SourceMass" field in the input database. A truck type's
default weight is equal to the average GVW for that truck type based on a variety of

European Transport \ Trasporti Europei (2013) Issue 54, Paper n° 8, ISSN 1825-3997
10
data sources analyzed by EPA. The input values, "rollingTerm" and "rotatingTerm", are
a function of vehicle weight. MOVES does not automatically update these values when
the weight input is changed. Equations for these coefficients are based on study by V.A.
Petrushov (Petrushov, 1997).
4.2 MOVES Sensitivity Analysis
The sensitivity analysis described herein focuses primarily on the truck type, weight,
speed, and grade variables. Analysis was performed to examine changes in emissions
from variations of these parameters in isolation. The impact of each parameter on
emissions is evaluated by determining the percent change in emissions resulting from an
incremental change in each parameter. Unlike previous truck GPS data sources, truck
type and weight data is available through the TRUE system (in combination with WIM
data). Further, the accuracy of speed estimates from the TRUE system has been shown
through comparison to estimates loop detector data and other truck GPS data. As such,
this sensitivity analysis serves to evaluate the potential of the TRUE data to improve the
accuracy of emission estimations at the project and regional level.
Method
A 'Project' level analysis was performed in order to analyze the sensitivity of
emissions estimates at the link (highway segment) level. All parameters were kept
constant except truck type, weight, speed and grade variables. Four heavy-duty diesel
vehicles were included in the analysis: Single-Unit Short-Haul (SUSH), Single-Unit
Long-Haul (SULH), Combination Short-Haul (CSH) and Combination Long-Haul
(CLH). These vehicle types were chosen as they are consistent with the vehicle types
applicable to the TRUE system. However, the bulk of this analysis focuses on the CSH
vehicles as this was the most common vehicle type in the TRUE pilot study.
Emissions considered include Atmospheric CO2, CO2e, NOx, PM10 and PM2.5.
Preliminary analysis indicated that Atmospheric CO2 typically follows similar trends to
CO2e; PM2.5 typically follows similar trends to PM10. As such, the results for CO2
and PM2.5 emissions are not included in this report. As an initial effort to examine
MOVES' sensitivity to the variables being considered, this analysis focused on emission
changes related only to 'running exhaust' emissions. In addition, the 'Age' variable was
held constant at zero (i.e., new trucks) for all analyses. Further input values used for the
analysis are presented Table 2.

European Transport \ Trasporti Europei (2013) Issue 54, Paper n° 8, ISSN 1825-3997
11
Table 2: Sensitivity Analysis Inputs
Variable Input Description
Geographic
Bounds
Multnomah
County, OR
This is the geographic area containing the majority of records
from the TRUE pilot project.
Fuel Type Default The default fuel type for Multnomah County, OR (provided by
the MOVES Default Database) was used.
Roadtype Restricted
Access
This roadtype was used in order to represent the
freeway/interstate condition.
Year 2011 2011 is the year from which the TRUE data is available.
Month May May was chosen as it is typically a month of fairly mild
(average) weather conditions in the state of Oregon.
Days Weekdays These are the times at which a high percentage of TRUE records
on Interstate-5 (the primary north-south interstate in Oregon)
have timestamps. Time 4-5pm
In order to determine the appropriate weight ranges to model for each truck type,
weight measurements from ODOT's WIM data were analyzed. A histogram
representing the total truck weight versus frequency was plotted for each truck type
using records spanning several years. An example is provided in Figure 5 for Type 17 (7
axles) truck. The two peak record frequencies exhibited in these histograms indicate two
different weight situations (Figliozzi, et al., 2000): 1) an empty vehicle (tractor and
semitrailer weight) at the first peak frequency (i.e., approximately 36,000 lbs in Figure
5) and 2) the truck weight limit at the second peak frequency (i.e., approximately 92,000
lbs in Figure 5). Records between these two zones represent trucks that are partially
loaded or that carry a full load of lighter commodities.
Figure 5: Distribution of GVW, Type 17
European Transport \ Trasporti Europei (2013) Issue 54, Paper n° 8, ISSN 1825-3997
12
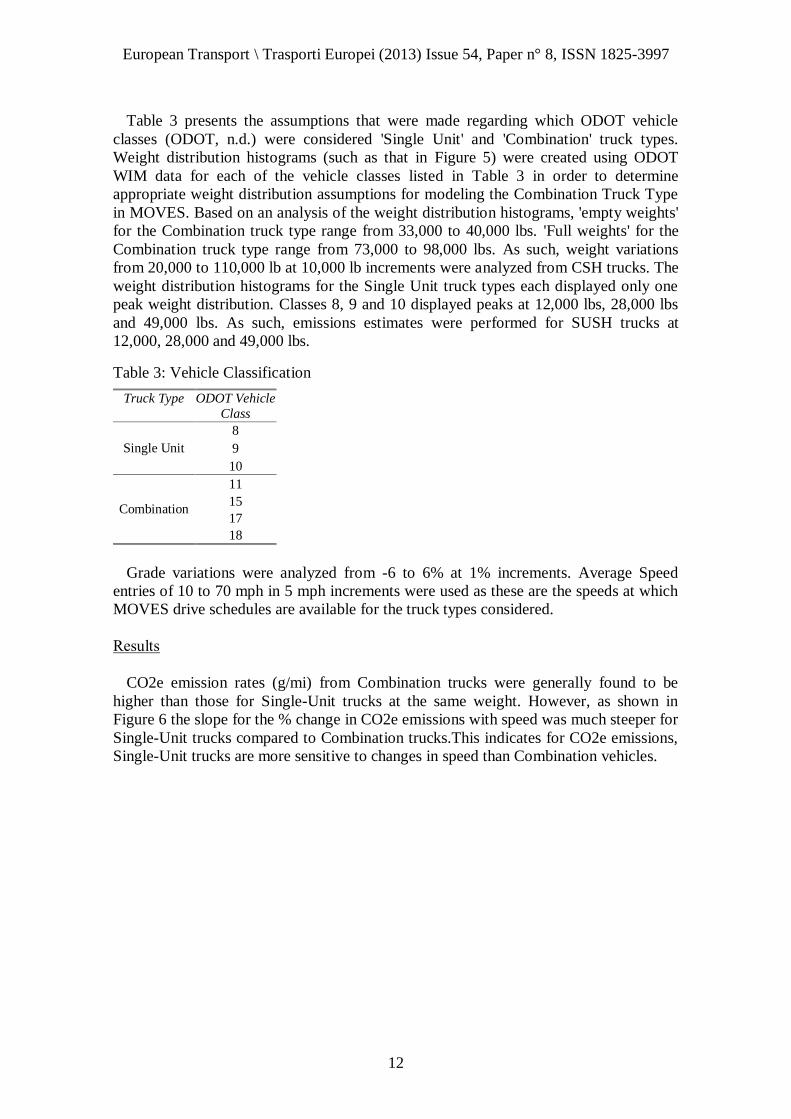
Table 3 presents the assumptions that were made regarding which ODOT vehicle
classes (ODOT, n.d.) were considered 'Single Unit' and 'Combination' truck types.
Weight distribution histograms (such as that in Figure 5) were created using ODOT
WIM data for each of the vehicle classes listed in Table 3 in order to determine
appropriate weight distribution assumptions for modeling the Combination Truck Type
in MOVES. Based on an analysis of the weight distribution histograms, 'empty weights'
for the Combination truck type range from 33,000 to 40,000 lbs. 'Full weights' for the
Combination truck type range from 73,000 to 98,000 lbs. As such, weight variations
from 20,000 to 110,000 lb at 10,000 lb increments were analyzed from CSH trucks. The
weight distribution histograms for the Single Unit truck types each displayed only one
peak weight distribution. Classes 8, 9 and 10 displayed peaks at 12,000 lbs, 28,000 lbs
and 49,000 lbs. As such, emissions estimates were performed for SUSH trucks at
12,000, 28,000 and 49,000 lbs.
Table 3: Vehicle Classification
Truck Type ODOT Vehicle
Class
Single Unit
8
9
10
Combination
11
15
17
18
Grade variations were analyzed from -6 to 6% at 1% increments. Average Speed
entries of 10 to 70 mph in 5 mph increments were used as these are the speeds at which
MOVES drive schedules are available for the truck types considered.
Results
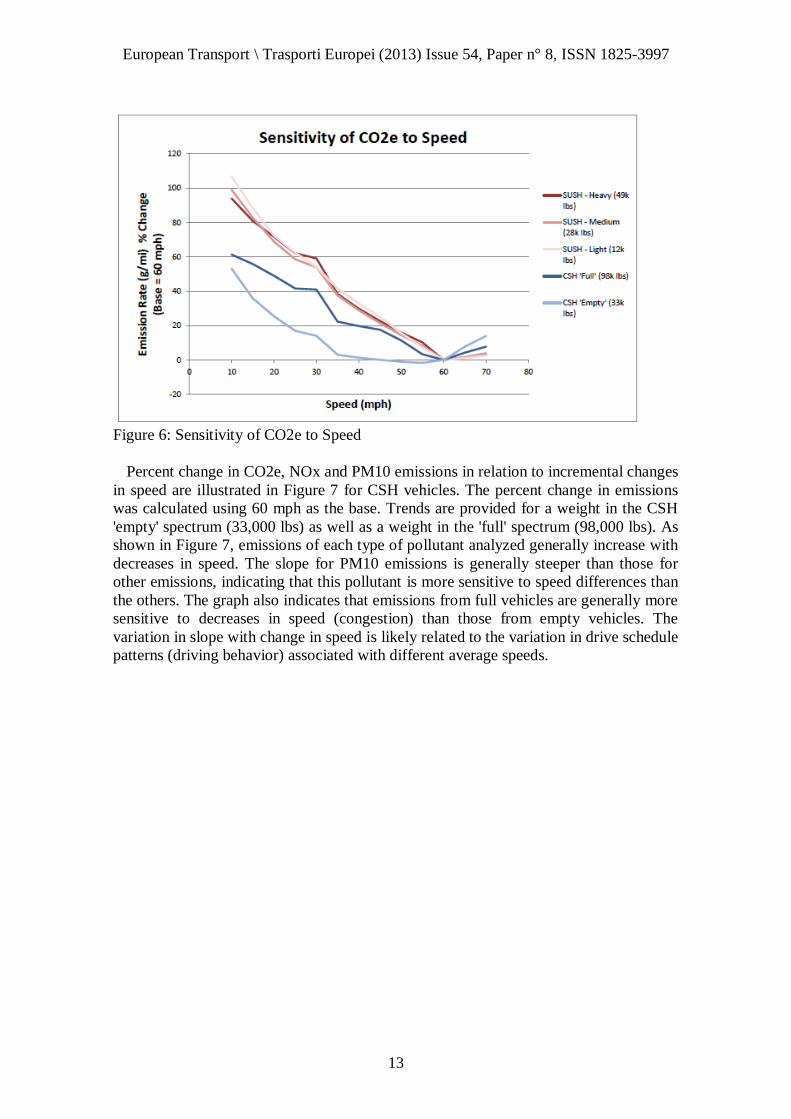
CO2e emission rates (g/mi) from Combination trucks were generally found to be
higher than those for Single-Unit trucks at the same weight. However, as shown in
Figure 6 the slope for the % change in CO2e emissions with speed was much steeper for
Single-Unit trucks compared to Combination trucks.This indicates for CO2e emissions,
Single-Unit trucks are more sensitive to changes in speed than Combination vehicles.
European Transport \ Trasporti Europei (2013) Issue 54, Paper n° 8, ISSN 1825-3997
13
Figure 6: Sensitivity of CO2e to Speed
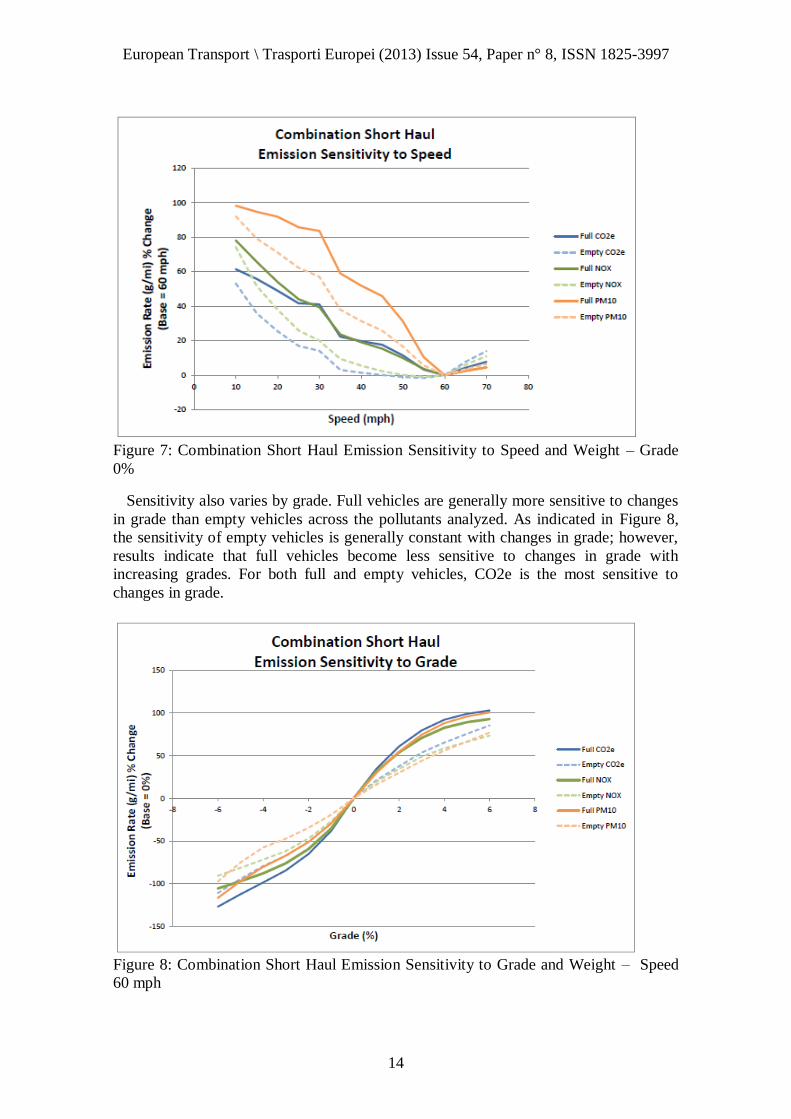
Percent change in CO2e, NOx and PM10 emissions in relation to incremental changes
in speed are illustrated in Figure 7 for CSH vehicles. The percent change in emissions
was calculated using 60 mph as the base. Trends are provided for a weight in the CSH
'empty' spectrum (33,000 lbs) as well as a weight in the 'full' spectrum (98,000 lbs). As
shown in Figure 7, emissions of each type of pollutant analyzed generally increase with
decreases in speed. The slope for PM10 emissions is generally steeper than those for
other emissions, indicating that this pollutant is more sensitive to speed differences than
the others. The graph also indicates that emissions from full vehicles are generally more
sensitive to decreases in speed (congestion) than those from empty vehicles. The
variation in slope with change in speed is likely related to the variation in drive schedule
patterns (driving behavior) associated with different average speeds.
European Transport \ Trasporti Europei (2013) Issue 54, Paper n° 8, ISSN 1825-3997
14
Figure 7: Combination Short Haul Emission Sensitivity to Speed and Weight – Grade
0%
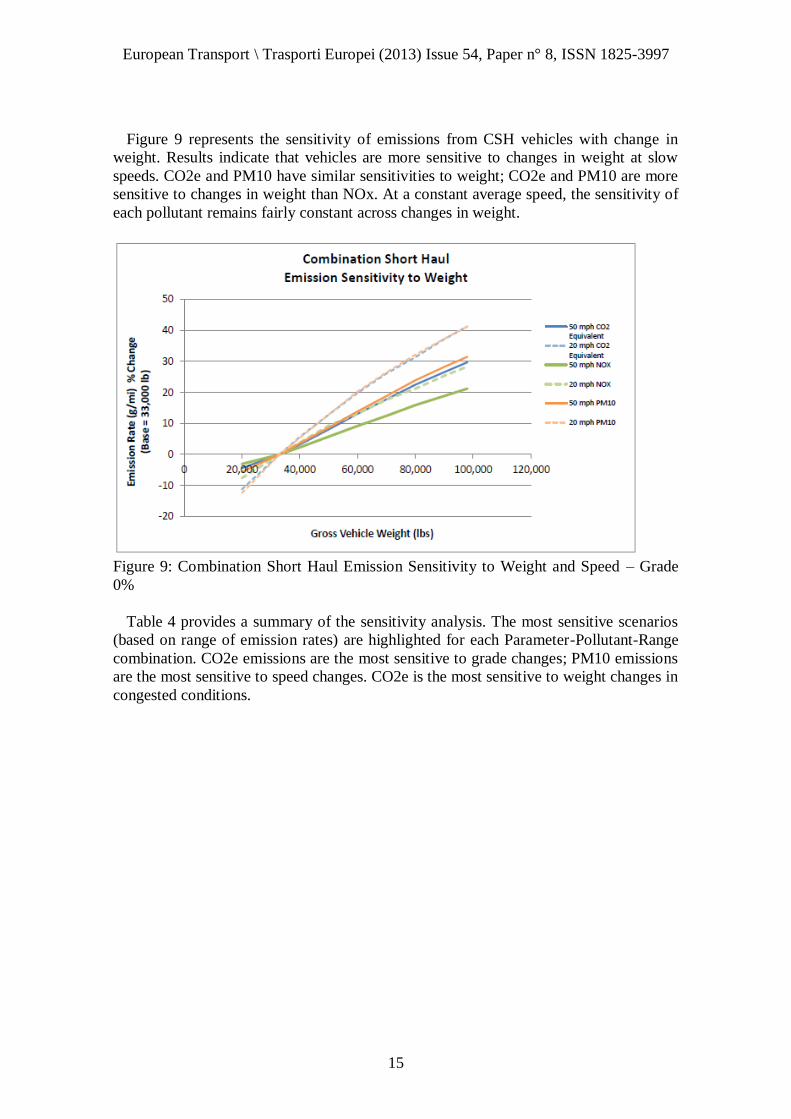
Sensitivity also varies by grade. Full vehicles are generally more sensitive to changes
in grade than empty vehicles across the pollutants analyzed. As indicated in Figure 8,
the sensitivity of empty vehicles is generally constant with changes in grade; however,
results indicate that full vehicles become less sensitive to changes in grade with
increasing grades. For both full and empty vehicles, CO2e is the most sensitive to
changes in grade.
Figure 8: Combination Short Haul Emission Sensitivity to Grade and Weight – Speed
60 mph
European Transport \ Trasporti Europei (2013) Issue 54, Paper n° 8, ISSN 1825-3997
15
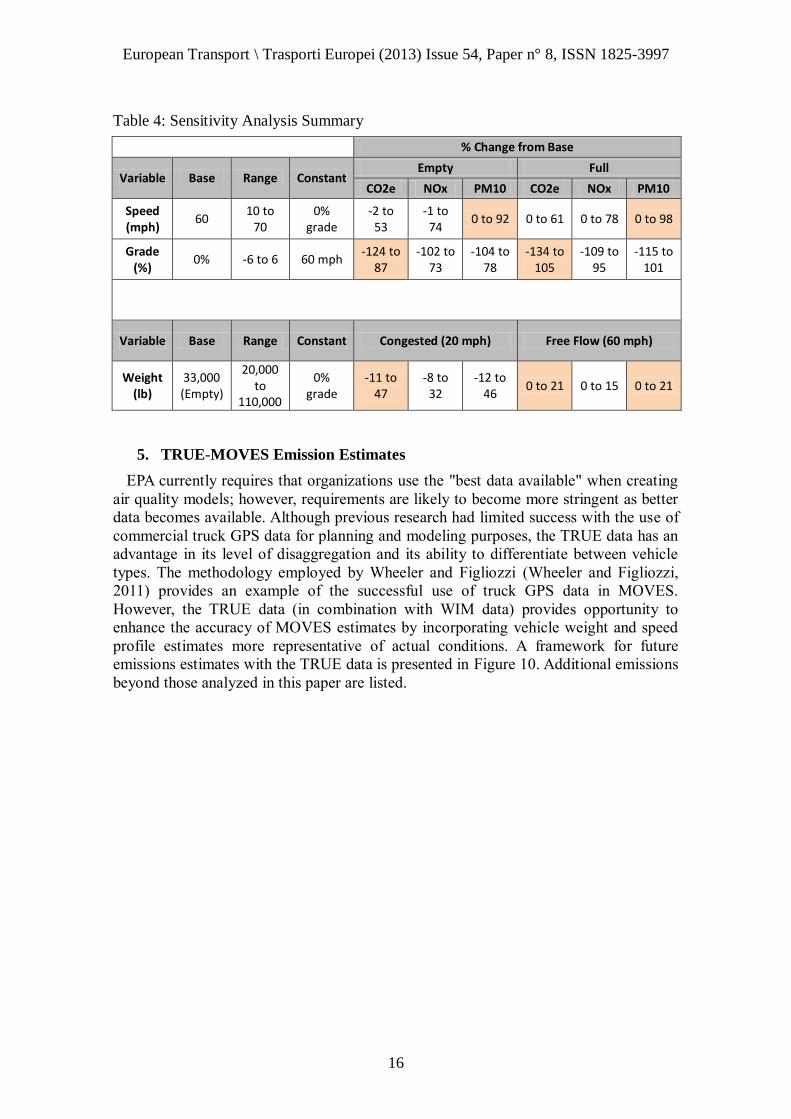
Figure 9 represents the sensitivity of emissions from CSH vehicles with change in
weight. Results indicate that vehicles are more sensitive to changes in weight at slow
speeds. CO2e and PM10 have similar sensitivities to weight; CO2e and PM10 are more
sensitive to changes in weight than NOx. At a constant average speed, the sensitivity of
each pollutant remains fairly constant across changes in weight.
Figure 9: Combination Short Haul Emission Sensitivity to Weight and Speed – Grade
0%
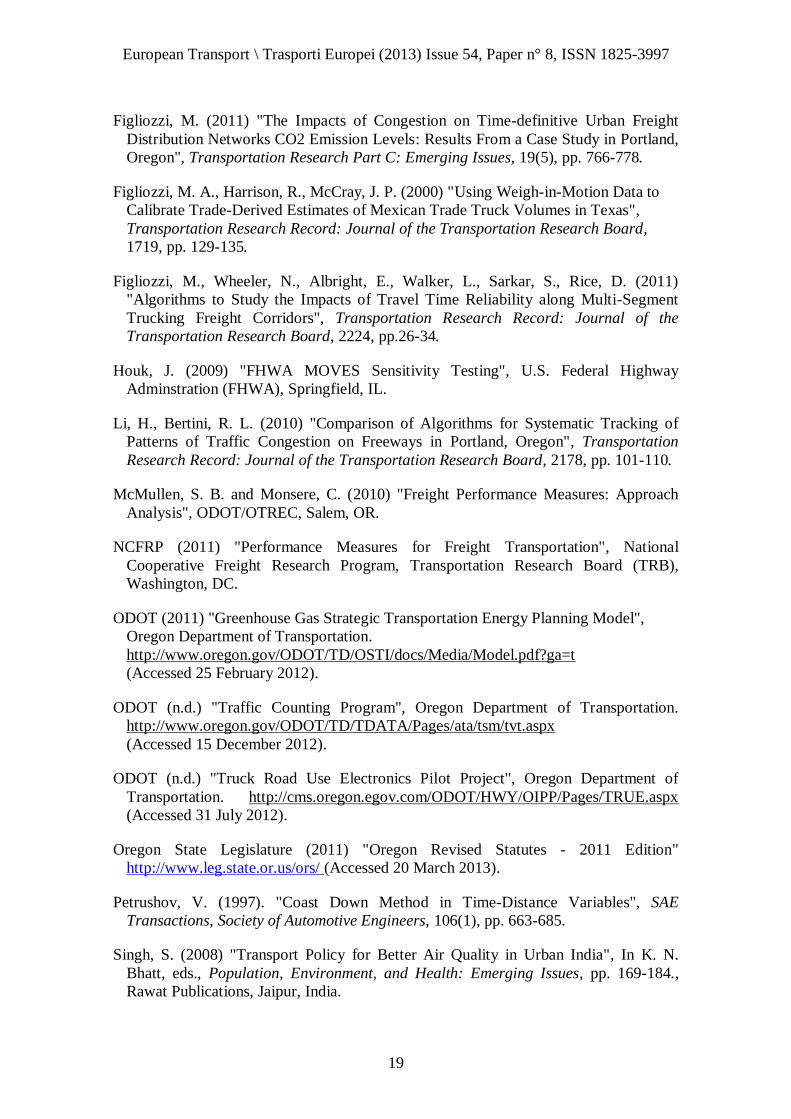
Table 4 provides a summary of the sensitivity analysis. The most sensitive scenarios
(based on range of emission rates) are highlighted for each Parameter-Pollutant-Range
combination. CO2e emissions are the most sensitive to grade changes; PM10 emissions
are the most sensitive to speed changes. CO2e is the most sensitive to weight changes in
congested conditions.
European Transport \ Trasporti Europei (2013) Issue 54, Paper n° 8, ISSN 1825-3997
16
Table 4: Sensitivity Analysis Summary
% Change from Base
Variable Base Range Constant Empty Full
CO2e NOx PM10 CO2e NOx PM10
Speed (mph)
60 10 to
70 0%
grade -2 to
53 -1 to
74 0 to 92 0 to 61 0 to 78 0 to 98
Grade (%)
0% -6 to 6 60 mph -124 to
87 -102 to
73 -104 to
78 -134 to
105 -109 to
95 -115 to
101
Variable Base Range Constant Congested (20 mph) Free Flow (60 mph)
Weight (lb)
33,000 (Empty)
20,000 to
110,000
0% grade
-11 to 47
-8 to 32
-12 to 46
0 to 21 0 to 15 0 to 21
5. TRUE-MOVES Emission Estimates
EPA currently requires that organizations use the "best data available" when creating
air quality models; however, requirements are likely to become more stringent as better
data becomes available. Although previous research had limited success with the use of
commercial truck GPS data for planning and modeling purposes, the TRUE data has an
advantage in its level of disaggregation and its ability to differentiate between vehicle
types. The methodology employed by Wheeler and Figliozzi (Wheeler and Figliozzi,
2011) provides an example of the successful use of truck GPS data in MOVES.
However, the TRUE data (in combination with WIM data) provides opportunity to
enhance the accuracy of MOVES estimates by incorporating vehicle weight and speed
profile estimates more representative of actual conditions. A framework for future
emissions estimates with the TRUE data is presented in Figure 10. Additional emissions
beyond those analyzed in this paper are listed.

European Transport \ Trasporti Europei (2013) Issue 54, Paper n° 8, ISSN 1825-3997
17
Figure 10: MOVES Emission Estimations and Sensitivity Analysis
As an initial analysis, emission estimates were performed using TRUE GPS records
from one CSH truck trip on an approximately thirty mile segment of northbound
interstate-5 just north of the metropolitan area of Portland, Oregon. The records used are
from a weekday trip in the hour of 4 to 5pm. The truck's TRUE GPS records were
integrated with the applicable WIM records in order to determine the weight value input
for MOVES. Other inputs used were consistent with those described in the 'MOVES
Sensitivity Analysis' section of this paper. Table 5 presents a comparison of emissions
estimates obtained when using the average speed (and associated default drive schedule
from MOVES) for this trip compared to those obtained when using the trip's speed
profile. Results indicate that the emissions estimates obtained from MOVES using the
TRUE average speed and associated default drive schedules overestimated emission
quantities. PM emissions were most sensitive to the change in speed input method; NOx
emissions were least sensitive.
Table 5: MOVES Emission Estimates Using TRUE Data
Pollutant Using TRUE Speed Profile
(g/mi)
Using TRUE Average
Speed (g/mi) % Difference
CO2 1555 1764 -13.4
CO2 Equivalent 1556 1765 -13.4
NOx 0.97 1.05 -8.5
PM10 0.016 0.018 -14.7
PM2.5 0.015 0.018 -14.7

European Transport \ Trasporti Europei (2013) Issue 54, Paper n° 8, ISSN 1825-3997
18
Previous research (Wheeler and Figliozzi, 2011) used truck GPS data to obtain
emissions estimates in MOVES for the same northbound segment of interstate-5 that is
analyzed in Table 5. Subsequently a methodology was presented to estimate the cost
effects of such emissions. The analysis presented in Table 5 could be repeated for other
truck trips represented by the records from the TRUE pilot project. The results of the
analysis could then be compared to those from the analysis performed by Wheeler and
Figliozzi (Wheeler and Figliozzi, 2011) for the same highway segment in order to
further understand the impact of the more detailed truck data available through TRUE.
Similarly, such an analysis would allow a more robust understanding of the impact of
detailed speed profiles on emissions estimates in comparison to average speed values
and the associated default drive schedules in MOVES.
6. Conclusions and Future Research
The impact of the selected MOVES input parameters on CO, NOx and PM emissions
were examined by comparing the percent change in emissions to base input values. The
results demonstrate that speed, grade and weight can have substantial impact on
MOVES' estimates of emissions.CO2 emissions were the most sensitive to grade
changes; PM emissions were the most sensitive to speed changes. CO2 was the most
sensitive to weight changes in congested conditions.The results of the analysis indicate
the value of the detailed weight and speed data available through TRUE. In the future,
the accuracy of emission estimates using the TRUE data could be further enhanced
through the use of more accurate inputs for parameters for other variables such as age
distribution and Inspection and Maintenance (I/M) program.
According to ODOT reports (ODOT, 2011), estimates from ODOT's GreenSTEP
model could further be used to assess the relative equity of different policy proposals for
different road users. As of October 2011, ODOT's GreenSTEP focused on emissions
from household and light duty commercial vehicles (i.e., autos, SUVs, pickup trucks,
vans); modeling of GHG emissions from freight is still under development. Given that
commercial vehicle emissions are greatly dependent on vehicle weight and speed,
emissions estimates from the TRUE data (in combination with WIM data) would be
highly valuable in further developing the freight portion of GreenSTEP.
References
Bell, K. E., Figliozzi, M. A. (2013) "Evaluation of Smart Phone Weight-Mile Tax Data
for Supporting Freight Modeling, Performance Measures and Planning" Forthcoming
Transportation Research Record: Journal of the Transportation Research Board.
Cambridge Systematics, Inc. (2011) "Oregon Freight Plan, An Element of the Oregon
Transportation Plan", ODOT Freight Mobility Unit, Salem, OR.
Choi, D., Beardsley, M., Brezezinski, D., Koupal, J. and Warila, J. (2010). "MOVES
Sensitivity Analysis: The Impacts of Temperature and Humidity on Emissions", U.S.
EPA – Proceedings from the 19th Annual International Emission Inventory
Conference, Ann Arbor, MI.
European Transport \ Trasporti Europei (2013) Issue 54, Paper n° 8, ISSN 1825-3997
19
Figliozzi, M. (2011) "The Impacts of Congestion on Time-definitive Urban Freight
Distribution Networks CO2 Emission Levels: Results From a Case Study in Portland,
Oregon", Transportation Research Part C: Emerging Issues, 19(5), pp. 766-778.
Figliozzi, M. A., Harrison, R., McCray, J. P. (2000) "Using Weigh-in-Motion Data to
Calibrate Trade-Derived Estimates of Mexican Trade Truck Volumes in Texas",
Transportation Research Record: Journal of the Transportation Research Board,
1719, pp. 129-135.
Figliozzi, M., Wheeler, N., Albright, E., Walker, L., Sarkar, S., Rice, D. (2011)
"Algorithms to Study the Impacts of Travel Time Reliability along Multi-Segment
Trucking Freight Corridors", Transportation Research Record: Journal of the
Transportation Research Board, 2224, pp.26-34.
Houk, J. (2009) "FHWA MOVES Sensitivity Testing", U.S. Federal Highway
Adminstration (FHWA), Springfield, IL.
Li, H., Bertini, R. L. (2010) "Comparison of Algorithms for Systematic Tracking of
Patterns of Traffic Congestion on Freeways in Portland, Oregon", Transportation
Research Record: Journal of the Transportation Research Board, 2178, pp. 101-110.
McMullen, S. B. and Monsere, C. (2010) "Freight Performance Measures: Approach
Analysis", ODOT/OTREC, Salem, OR.
NCFRP (2011) "Performance Measures for Freight Transportation", National
Cooperative Freight Research Program, Transportation Research Board (TRB),
Washington, DC.
ODOT (2011) "Greenhouse Gas Strategic Transportation Energy Planning Model",
Oregon Department of Transportation.
http://www.oregon.gov/ODOT/TD/OSTI/docs/Media/Model.pdf?ga=t
(Accessed 25 February 2012).
ODOT (n.d.) "Traffic Counting Program", Oregon Department of Transportation.
http://www.oregon.gov/ODOT/TD/TDATA/Pages/ata/tsm/tvt.aspx
(Accessed 15 December 2012).
ODOT (n.d.) "Truck Road Use Electronics Pilot Project", Oregon Department of
Transportation. http://cms.oregon.egov.com/ODOT/HWY/OIPP/Pages/TRUE.aspx
(Accessed 31 July 2012).
Oregon State Legislature (2011) "Oregon Revised Statutes - 2011 Edition"
http://www.leg.state.or.us/ors/ (Accessed 20 March 2013).
Petrushov, V. (1997). "Coast Down Method in Time-Distance Variables", SAE
Transactions, Society of Automotive Engineers, 106(1), pp. 663-685.
Singh, S. (2008) "Transport Policy for Better Air Quality in Urban India", In K. N.
Bhatt, eds., Population, Environment, and Health: Emerging Issues, pp. 169-184.,
Rawat Publications, Jaipur, India.
European Transport \ Trasporti Europei (2013) Issue 54, Paper n° 8, ISSN 1825-3997
20
Singh, S. (2012) "Urban Transport in India: Issues, Challenges, and the Way Forward",
European Transport, 52, Paper n° 5.
USEPA (2012) "Modeling and Inventories", US Environmental Protection Agency.
http://www.epa.gov/otaq/models.htm
(Accessed 15 December 2012).
USEPA (2012) "Motor Vehicle Emission Simulator (MOVES) - User Guide for
MOVES2010b", US Environmnetal Protection Agency.
Wheeler, N., Figliozzi, M. (2011) "Multicriteria Freeway Performance Measures for
Trucking in Congested Corridors", Transportation Research Record: Journal of the
Transportation Research Board, 2224, pp. 82-93.
Acknowledgements
Support for this research from the Oregon Transportation Research and Education
Consortium (OTREC) and the Oregon Department of Transportation (ODOT) is
gratefully acknowledged. The authors would also like to thank Greg Dal Ponte (ODOT
MCTD), Becky Knudson (ODOT Transportation Analysis Unit), Myra Sperley (ODOT
Research Section) and Gina Salang, Steve Ross, Chris Howell, Peter Douglas and
Michael Bolliger (ODOT Motor Carrier Applications Development). Any omissions and
mistakes are the sole responsibility of the authors.