modeling an integrated public transportation system - openstarts
TRANSCRIPT

European Transport \ Trasporti Europei n. 41 (2009): 28-46
28
Modeling an Integrated Public Transportation System -
a case study in Dublin, Ireland
Prabhat Shrivastava 1∗∗∗∗, Margaret O'Mahony
2
1 Professor of Transportation System Engineering
Department of Civil Engineering - Sardar Patel College of Engineering
Bhavan's Campus, Andheri (W), Mumbai – 400058, India 2 Professor of Civil Engineering, Bursar,
Head of Department of Civil, Structural & Environmental Engineering and
Director of the Centre for Transport Research, Trinity College Dublin,
Dublin 2, Ireland
Abstract
The efficiency of the public transport system in any city depends on integration of its major public
transport modes. Suburban railway and public buses are the modes normally used by the majority of
commuters in metropolitan cities of developed and developing countries. Integration of these two services
reduces overall journey time of an individual. In this research, a model is developed for operational
integration of suburban trains and public buses. The model has two sub models: a Routing Sub Model and
a Scheduling Sub Model. In the Routing Sub Model, feeder routes are generated for public buses which
originate from a railway station. A Heuristic Feeder Route Generation Algorithm is developed for
generation of feeder routes. In the Scheduling Sub Model, optimal coordinated schedules for feeder buses
are developed for the given schedules of suburban trains. As a case study the Dun Laoghaire DART
(Dublin Area Rapid Transit) (heavy rail suburban service) station of Dublin in Ireland is selected. Feeder
bus services are coordinated with existing schedules of the DART on the developed feeder route network.
Genetic Algorithms, which are known to be a robust optimization technique for this type of problem, are
used in the Scheduling Sub Model. Finally the outcome of the research is a generated feeder route
network and coordinated services of feeder buses on it for the DART station.
Keywords: Coordinated schedules, Genetic algorithms, Modal integration, Optimization, Public
transportation, Routing and scheduling.
1. Introduction
It has been observed that most of the metropolitan cities of developed and developing
countries are facing problems due to lack of coordination among public transport
facilities. Each public transport facility is planned and designed without considering its
* Corresponding author: Prabhat Shrivastava ([email protected], [email protected])

European Transport \ Trasporti Europei n. 41 (2009): 28-46
29
impact on other public transport services. In fact in most of the cases these facilities
compete each other instead of complementing. This unhealthy competition leads to
duplication of services to many areas and hence proves to be uneconomical. Commuters
have to spend more time on journeys because of higher transfer time due to lack of
integration among public transport modes. The efficiency of an entire public transport
system can be enhanced by overall coordination among its modes. Coordination among
different modes can be achieved by system integration, which occurs at three levels:
institutional, operational and physical. The literature review has revealed that many
studies are carried out for optimization of services of a single mode specially bus or
train but the effort is meager as far as coordination of two modes are concerned.
However, routing and scheduling problems for coordinated operations were attempted
by Wirasinghe (1980), Geok and Perl (1988) using analytical models. They had
considered highway grid which is assumed to be rectangular and parallel to a single
railway line which may not always be true in practice. They had made an attempt to
describe complex transit system by approximate analytical models. Thus most of the
studies on coordination of modes are limited to analytical modeling without considering
a real life network (Shrivastava and Dhingra, 2000). In this research, a model is
developed for operational integration of public transport modes. Development of feeder
routes and schedule coordination, the two important aspects of operational integration,
are attempted in this research. As a case study, Dun Laoghaire DART station is
selected. Dun Laoghaire is a rapidly growing suburb of Dublin city in Ireland. The
coordination between DART services and Dublin buses (public buses) at this DART
station is attempted.
2. Data collection
The Dublin Area Rapid Transit (DART) is a suburban railway system in Dublin,
running basically along the coastline of Dublin Bay from Greystones to Howth and
Malahide. There are 32 stations on the existing DART line. Lack of coordination
between public buses and DART services has been observed even during peak hours at
many stations. Dun Laoghaire is one of the prominent DART stations from where large
number of trips originate. It was decided to select Dun Laoghaire as the study area due
to its land use pattern which allows greater scope of feeder bus services from the station.
Considerable movement of commuters takes place towards many areas from the DART
station.
Typical traffic surveys were conducted during the morning peak period i.e. 7 to 9 a.m.
on April 28, 2004. It was observed that the maximum number of commuters travel
during 8 to 9 a.m. Therefore this time period is identified as peak hour. It has been
confirmed during traffic surveys that after 9 a.m. commuter traffic starts decreasing and
becomes very less after 9.30 a.m. onwards. During the traffic surveys, commuters
exiting the DART station were counted manually. Typical commuter counts revealed
that between 8 and 9 a.m. 1293 commuters exit from the DART station. Traffic
surveyors conducted sample interviews of commuters leaving the DART station.
Between 8 and 9 a.m. 300 commuters were interviewed thus making a sample size
above 20%. Enquiries were made regarding their destinations, mode of transport and
travel time to their destinations from DART station. Commuters who did not opt public

European Transport \ Trasporti Europei n. 41 (2009): 28-46
30
buses for their further journeys were also asked about their willingness to shift to public
buses if buses are coordinated with DART services in future. It was found that 40% of
commuters have their working places very near to DART station and they have to walk
even less than 5 minutes. These commuters were not interested in shifting to public
buses even if they are well coordinated with DART services. The percentage of
commuters willing to shift to public buses were added to those who use public buses
and a potential demand matrix for public buses was developed. It was found that there
are 16 destinations (nodes) for which demand exist from DART station. Table 1
indicates potential demands to various destinations. The demand for Dun Laoghaire
College, Sallynoggin, Monkstown, Deans Grange, Stillorgan and Loughlinstown was
found to be more than average. Thus these nodes were identified as major destinations
and priority is given to these destinations for development of feeder routes.
Connectivity and distances to all destinations were obtained from Dublin Street map
(Dublin street map, 2000). An average speed of 15 km per hour was adopted to address
the existing congestion level and road geometrics of the influence area (Scott Wilson,
2000). Using this speed, a travel time matrix was developed. The size of matrix was 17
×17 which includes DART station and other identified 16 destinations as indicated in
Table 1. The potential demand matrix and travel time matrix were used for development
of feeder route network. It was also observed during traffic surveys that in the morning
peak period the trains towards city centre (north bound trains) contribute about 30%
passengers; the remaining 70% were by trains from city centre (south bound trains).
There were nine north bound and eight south bound trains during the peak hour of 8 to 9
a.m. The schedule coordination for feeder buses is attempted for theses trains during the
indicated peak hour.
Table 1: Potential Demand to Various Destinations
Potential demand to various destinations Node No. (code)
Destinations
7 - 8 a.m. 8 - 9 a.m. 7 - 9 a.m.
1 Dun Laoghaire DART Station 00 00 00
2 Dun Laoghaire College 39 202 241
3 Sallynoggin 17 103 120
4 Monks town 10 63 73
5 Deans Grange 16 93 109
6 Temple Hill 02 06 08
7 Black Rock 08 46 54
8 Stillorgan 13 77 90
9 Leopards town 02 08 10
10 Foxrock 02 08 10
11 Maple Manor / Cabinteely 02 04 06
12 Lough Linstown 13 78 91
13 Mount Merrion 02 15 17
14 University College of Dublin 04 23 27
15 Dundrum 06 31 37
16 Sandyford 03 15 18
17 Rouches Town Avenue 02 04 06
European Transport \ Trasporti Europei n. 41 (2009): 28-46
31
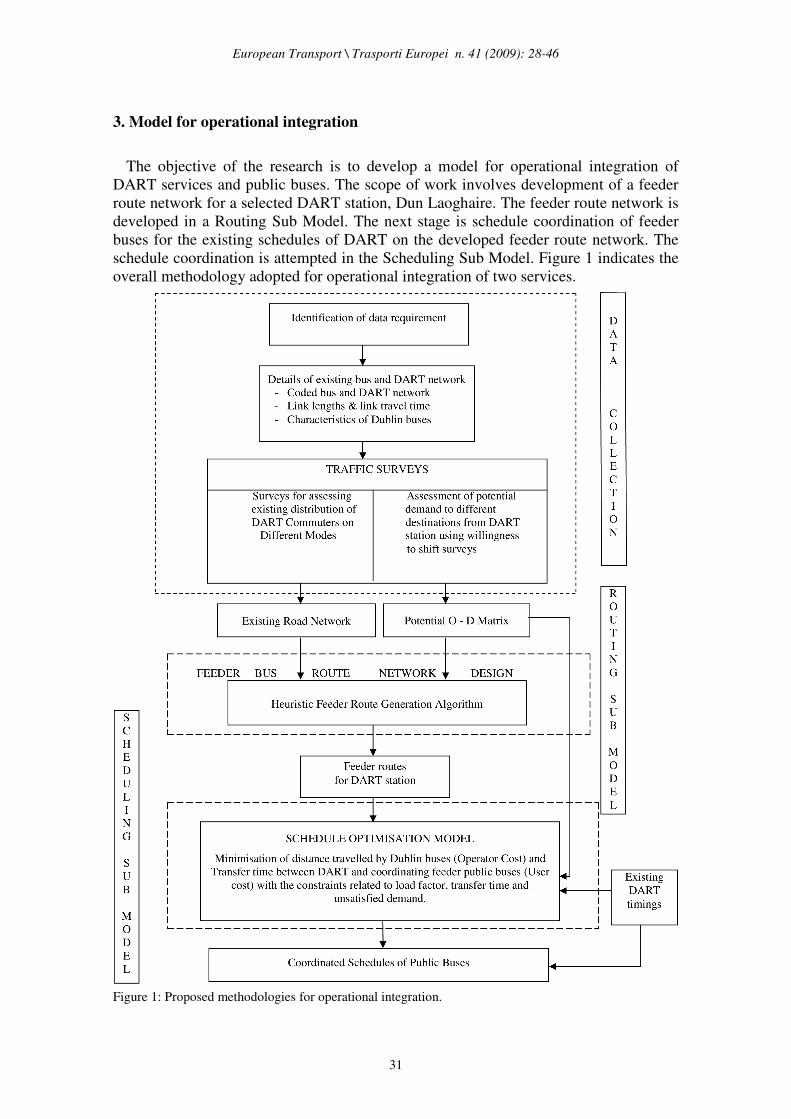
3. Model for operational integration
The objective of the research is to develop a model for operational integration of
DART services and public buses. The scope of work involves development of a feeder
route network for a selected DART station, Dun Laoghaire. The feeder route network is
developed in a Routing Sub Model. The next stage is schedule coordination of feeder
buses for the existing schedules of DART on the developed feeder route network. The
schedule coordination is attempted in the Scheduling Sub Model. Figure 1 indicates the
overall methodology adopted for operational integration of two services.
Figure 1: Proposed methodologies for operational integration.

European Transport \ Trasporti Europei n. 41 (2009): 28-46
32
3.1 Routing Sub Model
From the literature review it is evident that heuristic approach has been very popular
for development of route network. Lampkin and Saalmans (1967), Silman et al. (1974),
Dubois et al. (1979), Hsu and Surti (1976), Dhingra (1980), Mandl (1980), Baaj and
Mahamassani (1990 and 1995) developed bus routes using heuristic approach by
insertion of nodes in base network. Heuristic approach may or may not provide optimal
route structure but it is certainly able to provide good practically acceptable suboptimal
solutions (Shrivastava and Dhingra, 2001). Location of various destinations (nodes),
limited connectivity among some of nodes in the influence area of DART station and
design of routes without further bus to bus transfer (passengers are already subjected to
one transfer i.e. from DART to buses) also encouraged to use heuristic approach in this
study. The heuristic algorithm described here is developed in ‘C’ language using
different node selection and insertion strategies. Proposed heuristic algorithm is heavily
guided by demand matrix because satisfaction of demand is one of the prime aspects for
generation of routes (Baaj and Mahamassani, 1995). Thus the model for operational
integration is decomposed in two sub models: one for routing and other for schedule
coordination. In actual practice also user is more concerned about the waiting / transfer
time rather than slightly higher journey time. It leads to higher level of discomfort and
dissatisfaction if commuters have to wait longer for connecting buses to their
destinations. Therefore it is decided to carry out rigorous optimization to minimize
transfer time from DARTs to buses on heuristically developed feeder routes.
The proposed heuristic algorithm has two distinct parts
1. Development of shortest paths using Dijkstra’s algorithm from DART station to
identified major destinations.
2. Deviation of shortest paths by inserting other identified nodes to develop feeder
routes. The deviation of shortest paths has been done based on various ‘node
selection and insertion strategies’.
There should be a judicious balance in satisfaction of demand due to insertion of
nodes and increase in route length for development of routes (Baaj and Mahamassani,
1995). Thus the deviation of shortest paths for development of routes is governed by
‘maximum demand deviated shorter path time’ criterion. In this criterion, the deviation
of shortest paths due to insertion of nodes between origin and destination is restricted to
1.5 times the travel time on the shortest paths. The nodes which are attached at the end
of shortest paths are governed by ‘path extension time criterion’. The path extension
time criterion fixes an upper limit on the length of routes. In the present case study this
upper limit for the length of routes is kept as 15 Km (1 hr). This upper limit for the
routes is decided based on the locations of various destinations identified in sample
interviews which were part of traffic surveys. The upper limit on length of routes is
imposed because if routes are very long then the purpose of feeder routes is lost and
such routes pose difficulty in maintaining the schedules. Though the upper limit of the
route length adopted in the case study is on higher side, this limit can be reduced if other
DART stations are also coordinated. This is due to the fact that a particular node may
have connectivity with more than one DART stations which may lead to shorter and
better routes from one station as compared to other one. Traffic surveys also revealed
that some of the nodes having higher demands are concentrated near the DART station
and as a result many shortest paths would be developed from DART station to these
major destinations. After inserting the nodes very short routes mushrooming near

European Transport \ Trasporti Europei n. 41 (2009): 28-46
33
railway station would develop. Such routes are not practically acceptable. A similar
problem was felt in route generation algorithm of Baaj and Mahmassani (1995).
Proposed heuristic algorithm avoids development of such routes by imposing a
constraint on minimum length of shortest paths and deviation of shortest paths using
node selection and insertion strategies. The various steps involved in the proposed
algorithm are described as follows:
1. Prepare the demand matrix with code numbers of various nodes (destinations) to
which potential demand is identified from the DART station (origin).
2. Identify the connectivity of the above nodes using the existing route map and
develop travel distance matrix in kms. Non connectivity of nodes is assigned a
very high number in the matrix. Using the average speed of travel the matrix is
converted into travel time matrix in terms of ‘minutes’.
3. Identify the nodes having more than average demand and select them as major
destinations.
4. Develop the Shortest paths from the DART station to major destinations using
Dijkstra’s algorithm.
5. Remove all the nodes from the node list which are present in any shortest path and
arrange remaining nodes in the decreasing order of their demand i.e. node having
highest demand is kept at top and one with least demand at the bottom. This is
done so as to give priority to higher demand nodes during the insertion process.
Nodes at the top are chosen first for insertion. The nodes are removed from node
list because they are now the part of shortest path and hence will be the part of a
route. The opportunity is given to other nodes for insertion in shortest paths /
routes.
6. Identify the nodes/chain of nodes at the end of shortest paths / routes and insert
them at the end of shortest path/routes using path extension time criteria. This
automatically avoids delay to the higher demand nodes (major destinations).
7. The nodes, which are remaining and are already arranged as per demand, are then
inserted as per node selection and insertion strategies. The lengths of routes are
governed by the above mentioned time criteria which are applied depending on
location of nodes and the way they are inserted in the shortest paths / routes.
8. Insertion of nodes continues one after another until all the nodes are exhausted.
9. After generating all of the routes, they are checked for backtracking. If
backtracking is found and better alternatives are available they are considered and
the route is suitably modified.
3.2 Node selection and insertion strategies
In development of feeder routes the nodes having higher demands should be given
priority over nodes having lower demands (Shrivastava and Dhingra, 2001). Thus in
node selection and insertion strategies the nodes having higher demands are given
priority for insertion over lower demand nodes. The strategies adopted for insertion of
any node in the shortest paths / routes are briefly mentioned below.
a) The best possible shortest path / route for any node to be inserted is first identified.
The best possible shortest path / route for a particular node is decided on the basis
of the ratio of saving in passengers walk time (SPWT) to increased bus passenger
time (IBPT) due to insertion of the node. This ratio is calculated for all the shortest

European Transport \ Trasporti Europei n. 41 (2009): 28-46
34
paths / routes. The node is inserted to the shortest path / route which gives the
highest value of this ratio.
Figure 2: Insertion of a node in different routes.
Let, in fig. II
DART Station: ‘i’
Destinations having more than average demand: j1, j2 and j3
Shortest paths/Routes originating from DART station ‘i’: (i,j1), (i,j2) and ( i,j3)
Node to be inserted: ‘k1’
Demand from railway station ‘i’ to ‘j’: Dij
Demand from railway station ‘i’ to ‘k1’: Di k1
Nodes on shortest paths/routes (i,j1), (i,j2) and ( i,j3) which are nearest to ‘k1’: j1~
,j2~
and j3~
(Routes/shortest paths those have no connectivity with k1 are omitted)
Travel time on shortest path/route (i, j): tm (i,j)
Say k1 is inserted in route (i,j1) the travel time will increase from ‘i’ to ‘j1’ due to
deviation of this shortest path/route. Also Di k1 passengers who had to walk for a
distance of (j1~
k1) to reach k1 will be benefited. Therefore
Travel time from ‘i’ to ‘j1’ via node k1 due to its insertion: t (i, j1)
Increase in travel time: {t (i, j1) - tm (i, j1)}
Delay in terms of passenger-min for bus passengers (IBPT): Dij1{ t ( i, j1) - tm (i,j1) }
Walking time for passengers from j1~
to k1: t (j1~
k1)
Saving in passengers-min due to walking (SWPT): Di k1 t (j1~
k1)
Calculate following (SPWT/ IBPT) ratios for all the routes as given below and
consider the route for which this ratio is maximum. In this case Maximum demand
deviated shorter time path criterion is adopted.
a. Di k1 t(j1~
k1) / Dij1 { t ( i, j1) - tm (i,j1) }
b. Di k1 t(j2~
k1) / Dij2 { t ( i, j2) - tm (i,j2) }
c. Di k1 t(j3~k1) / Dij 3 { t ( i, j3) - tm (i,j3) }

European Transport \ Trasporti Europei n. 41 (2009): 28-46
35
b) After selecting the route / shortest path for insertion of any node the best possible
way in which the node could be inserted in the selected shortest path / route is
determined. The best possible way is determined on the basis of minimum
additional passengers delay to successor nodes. Sometimes backtracking becomes
essential at any node due to its location and connectivity with other nodes. In such
cases also the above criterion of minimum additional passenger delay is used.
c) The presence of a node or series of nodes at the end of shortest path / route makes
it essential to extend the route. In case of the presence of one node, both the
options of inserting the node at the end of shortest path / route and between last
and last but one node are analyzed. The option which gives the minimum
additional passenger delay is selected. The series of nodes are attached at the end
of the concerned shortest path / route if they are present at the end to avoid
additional delay to higher demand nodes.
d) Sometimes due to the presence of a series of nodes near to the shortest path /
route, backtracking on some nodes becomes essential. This backtracking may also
increase the length of the route beyond the specified value. In such cases, to avoid
backtracking and delays to higher demand nodes part of the length of shortest path
is merged with the series of nodes and thus new routes are developed (Shrivastava
and Dhingra, 2001).
e) Finally, all the routes are checked for undesirable backtracking. To check
undesirable backtracking and to explore better options the travel time on the return
journey of backtracked section is assigned a very high value. Other options, if any,
are analyzed and compared with the backtracked option and the better one in
terms of minimum passenger delay is selected.
3.3 Scheduling Sub Model
Attempts have been made to obtain optimal schedule on transit networks only with
transfer time consideration using computer simulation (Rapp and Gehner, 1976) and
combination of optimization model and simulation procedure (Bookbinder and
Diesilets, 1992). However development of optimal schedules is an extremely difficult
task especially for schedule coordination problem even for a small transit network. The
schedule coordination problem consists of transfers between at least two modes along
with other objective like vehicle operation cost or fleet size. There are constraints like
keeping load factors and transfer times on various routes acceptable to both users and
operators. Thus the objective function and constraints make such problems multi
objective, non linear and non convex (Shrivastava et al, 2002). The difficulty due to
large number of variables and constraints, the discrete nature of variables and non-
linearity involved in the objective function and the constraints makes such problems
difficult to be solved by traditional optimization techniques (Chakroborthy et al., 1995).
In view of this, techniques like fuzzy logic have been tried for such problems (Kikuchi
and Parmeswaran, 1993). Chakroborthy et al. (1995) highlighted the enormity of a
similar type of problem. Even after linearizing the problem, the complexity remains
very large. The benefit obtained through linearization is offset by the increase in the
number of variables and constraints. In general, the number of variables and constraints
required are of the order of O (r2n
2), where ‘r’ is the number of routes through a transfer
station and ‘n’ is the number of buses/trains on any of the routes. Chakroborthy et al
(1995) attempted to solve the linearized formulation of a similar problem, but the

European Transport \ Trasporti Europei n. 41 (2009): 28-46
36
algorithm failed to converge to any solution. Therefore Genetic Algorithms (GAs),
which is a robust optimization technique and well suited for such problems, is applied
for this phase of the research (Goldberg, 1989). The basic differences of GAs with most
of the traditional methods are that GAs use coding of the variables instead of variables
directly, a population of points instead of a single point, and a stochastic operators
instead of deterministic operators. All these features make GAs search robust, allowing
them to be applied to a wide variety of schedule coordination problems (Shrivastava and
Dhingra, 2002). The following steps are involved in determination of coordinated
schedules.
1. Assignment of traffic on developed feeder routes.
2. Development of objective function and constraints.
3. Calculation of penalized objective function
4. Application of Genetic Algorithm to determine optimal frequencies on different
routes for minimum penalized objective function.
3.3.1 Assignment of traffic on developed routes
Potential demand to various destinations from the DART station is identified through
traffic surveys. Since all the feeder routes to different destinations originate from the
DART station the link connecting the station and the first node on the route is critical
link. This link carries the maximum load on the route. Scheduling of buses is done on
the basis of this maximum load. The assignment of traffic on feeder routes is based on
the proportionate frequency criterion which is based the fact that a higher bus frequency
attracts larger traffic.
3.3.2 Development of objective function and constraints
The scheduling of any public transport facility must satisfy both users and operators.
The users are concerned with availability of services without waiting longer time and
acceptable crowding levels. Operators are concerned with saving in operational cost of
facility or minimizing the fleet size and higher crowding levels to earn profit or at least
to get break even. Thus in the objective function for schedule coordination the user cost
is associated with the transfer time between buses and DART services. The operator
cost is taken as the vehicle operating cost which is incurred due to total distance
travelled by buses (Shrivastava and Dhingra, 2002). The constraints are related to
minimum and maximum load factor, minimum and maximum transfer time and
unsatisfied demand. Mathematically the objective function and constraints can be
presented as follows:
Objective Function:
Minimize
Transfer Time between nth
and sth
bound DARTS and buses VOC
( ) ( ). .
1 2
u l u u l v l v v l
j j j j j j j j
j u l j u l j
C pass bus dart pass bus dart C f Tlδ δ − + − + ∑ ∑ ∑ ∑ ∑ ∑ ∑

European Transport \ Trasporti Europei n. 41 (2009): 28-46
37
Constraints
1. ( ) max
l u
jbus dart T− ≤ and ( ) max
l v
jbus dart T− ≤ Maximum transfer time constraint
2. ( ) min
l u
jbus dart T− ≥ and ( ) min
l v
jbus dart T− ≥ Minimum transfer time constraint
3. maxmax.
LCAPN
Q
j
j≤
× Maximum load factor constraint
4. minmax.
LCAPN
Q
j
j≥
× Minimum load factor constraint
5. unsat
j
d∑ = 0 Unsatisfied demand constraint
Where,
j = Number of routes available at each stations
l = Number of buses available for uth
north bound DART and vth
south bound DART
VOC = Vehicle operating cost for Dublin buses
C1 = Cost of transfer time in Euro per minute, adopted as 11.32 cents/minute for the
case study, (Steer Davies, 1994).
C2 = Cost of operation of Dublin bus per Km., adopted as € 3.66 for Dublin buses for
the case study, (Scott Wilson, 2000).
passju
= Passengers transferring from uth
north bound DART to jth
route.
passjv = Passengers transferring from v
th south bound DART to j
th route.
busjl = Departure of l
th bus on j
th route
dartu = Arrival of u
th north bound DART
dartv = Arrival of v
th south bound DART
δju.l
= is a term which shows whether transfer of passengers is possible or not. It
attains a value one if transfer from uth
north bound DART to lth
bus on jth
route at
DART station is feasible otherwise it attains a value zero.
δjv.l
= is also a term which shows whether transfer of passengers is possible or not. It
attains a value one if transfer from vth
south bound DART to lth
bus on jth
route at
DART station is feasible otherwise it attains a value zero.
fj = Frequency of buses on jth
route in terms of number of bus trips per hour
lj = length of jth
route in kilometers
TP = Time period, hours
Tmax = Maximum allowable transfer time between arrival of DART and departure of
connecting bus. For the case study this value is assumed as 10 minutes (Based on
commuters’ opinion survey in study area).
Tmin = Minimum allowable transfer time between arrival of DART and departure of
connecting bus. For the case study this value is assumed at 5 minutes (Based on
observations & opinion survey in study area).
Qj.max = Number of passengers on first link connecting DART station on jth
route for
given time period.
Nj = Number of bus trips during entire time period under consideration ( fj * TP)
CAP = Seating capacity of bus, for Dublin buses it is taken as 74 (Scott Wilson, 2000)
Lmax = Maximum load factor, it is adopted as 1.2 for the case study (Scott Wilson,
2000)
Lmin = Minimum load factor, adopted as 1 for the case study
dunsat = Unsatisfied demand

European Transport \ Trasporti Europei n. 41 (2009): 28-46
38
The first term of the objective function involves transfer time between DART services
(both nth and sth bound) and coordinating buses. The second term gives the vehicle
operating cost, which is proportional to the distance traveled by buses. Constants C1and
C2 are used to convert the objective function in monetary unit of Euro (€). The first two
constraints are related to transfer time (Chakroborthy et al., 1995). The first constraint
ensures that transfer time between arrival of a DART and departure of connecting buses
should be less than a maximum value. The second constraint ensures that there should
be minimum time available for transfer. This constraint is obvious because it takes a
minimum time for passengers to board coordinating buses after arriving from DART.
Through the traffic surveys this minimum transfer time has been established as 5
minutes. The third and fourth constraints ensure that the load factor lies within a
maximum and a minimum value so that better level of service and availability of a
certain minimum number of passengers can be ensured for economical operations. The
maximum load factor is the ratio of crush capacity and normal capacity of Dublin buses.
The crush capacity is taken as 88 and normal capacity is 74 thus the maximum load
factor is taken as 1.2 (Scott Wilson, 2000). The last constraint ensures that maximum
demand is satisfied and maximum number of commuters get coordinating buses during
the period of analysis (Shrivastava et al, 2002). None of the above constraints are rigid.
These constraints are obeyed and violated as per their relative importance and
magnitude is directly proportional to potential demand associated with a particular
constraint. Penalties are decided as per the extent of violation of constraints i.e. higher
penalties are imposed for greater violation of these constraints.
3.3.3 Calculation of penalized objective function
The objective function and constraints as mentioned above pose a constrained
optimization problem. Transformation methods are the simplest and most popular
optimization methods of handling constraints. The constrained problem is transformed
into a sequence of unconstrained problems by adding penalty terms for each constraint
violation. If a constraint is violated at any point, the objective function is penalized by
an amount depending on the extent of constraint violation (Deb, 1995). Three sets of
penalties are decided which are added to objective function and penalized objective
function is calculated. The following penalties are used in analysis:
1. Transfer time penalty
2. Load factor penalty
3. Penalty for unsatisfied demand
These penalties are function of objective function, penalty coefficient, number of
affected commuters and adopted bus capacity.
3.3.3.1 Transfer time (tt) penalties
As stated above, it is observed during the surveys that it takes about 5 minutes on
average to reach a bus stop after arriving from the DART. Thus the minimum transfer
time from DART to bus is adopted as 5 minutes. Therefore, any bus which starts after 5
minutes of the scheduled arrival of DART is considered as a connecting bus to that
particular DART service. A transfer time between 5 to 10 minutes is regarded as
acceptable. In fact considering 5 minutes as the minimum time required for transfer,
effective waiting time lies between zero to five minutes which is considered as
acceptable. Any transfer after 10 minutes i.e. effective waiting time more than 5 minutes
European Transport \ Trasporti Europei n. 41 (2009): 28-46
39
is penalized. Higher values of penalty coefficients are adopted for higher transfer time
because higher transfer time causes more discomfort to passengers.
3.3.3.2 Penalty due to unsatisfied demand
If some passengers are not able to get any bus in the specified duration of analysis
then it is taken as unsatisfied demand and the penalty is imposed on objective function.
3.3.3.3 Load factor (LF) penalties
The minimum value of load factor is adopted as ‘1’. The value of maximum load
factor is adopted as 1.2 so as to maintain a better level of service. Level of service
becomes poor due to a rise in load factor above maximum adopted value. If the load
factor becomes less than ‘1’ it leads to uneconomical operation which may not be
acceptable to operators. Therefore higher values of penalty coefficients are adopted as
load factor increases above the maximum specified value similarly higher values are
adopted as load factor decreases below minimum value.
3.3.4 Application of Genetic Algorithms
In the real world, the process of natural selection controls evolution. Organisms most
suited for their environment tend to live long enough to reproduce, whereas less suited
organisms often die before producing young or produce fewer and/or weaker young. In
the applications of Genetic Algorithms process of evolution is studied by creating an
artificial world, populating it with pseudo organisms and giving those organisms a goal
to achieve (Goldberg, 1989). Genetic Algorithms store the characteristics of artificial
organisms in a Genotype, which mimics the DNA of natural life. The genotype is
nothing more than a long string of bits. A bit is the smallest piece of data a computer
can process. It can be only one of two values: ‘0’ or ‘1’. A bit in the genotype string can
be ‘on’ which has the value ‘1’, or can be ‘off’ which has the value ‘0’. The existence of
a certain characteristic can be indicated by whether a particular bit is set to ‘on’ or ‘off’.
The operation of GAs begins with population of random strings representing design of
decision variables. Thereafter, each string is evaluated to find the fitness value. The
population is then operated by three main operators’- reproduction, crossover and
mutation to create a new population of points. The new population is further evaluated
and tested for termination. If the termination criterion is not met, the population is
iteratively operated by the above three operators and evaluated. This procedure is
continued until the termination criterion is met. One cycle of these operations and
subsequent evaluation procedure is known as a ‘generation’. The GAs use search
strategies by using probability in all their operators. Since an initial random population
is used, to start with, the search can proceed in any direction and no major decisions are
made in the beginning. Later on, when the population begins to converge in some bit
positions, the search direction narrows and optimal or near optimal solution is achieved.
Thus nature of narrowing the search space as the search progresses is adaptive and is
unique characteristic of Genetic Algorithms (Deb, 1995). Therefore Genetic Algorithms
always guarantee the optimum / near to global optimum solution for ill behaved
functions. Solutions even near to global optimum obtained by GAs are acceptable for
practical problems, like the one which is being attempted in this research.
‘Reproduction operator’ is usually the first operator applied on a population.
Reproduction selects a good string in a population and forms a mating pool. In the

European Transport \ Trasporti Europei n. 41 (2009): 28-46
40
‘Crossover operation’, information among strings of the mating pool is exchanged and
new strings are created. ‘Mutation’ adds new information in a random way to the
genetic search process, and ultimately helps to avoid GAs from getting stuck at local
optimums. In the present analysis ‘uniform random’ and ‘roulette’ selection operators
are compared. Similarly ‘simple’ and ‘uniform’ cross over are tested. Best among
‘simple invert’, ‘simple random’ and ‘swap’ mutation is used (Lance Chambers, 1995).
3.4 Use of Genetic Algorithms for objective function and constraints
The above objective function is used with LibGA software (Lance Chambers, 1995)
of Genetic Algorithms in Linux environment to determine optimal frequencies on
developed feeder route network. Genetic Algorithms parameters are tuned for the
objective function and thus type of process and best values of operators are decided.
The following are the outcomes of several runs for tuning Genetic Algorithms
parameters.
− Roulette and uniform random selections are compared and it is found that Roulette
selection converges faster for our objective function.
− Simple random and Swap mutation give better results as compared to Simple
invert. In the analysis the Simple random mutation is adopted.
− Uniform crossover converges earlier to Simple crossover. Thus uniform crossover
is adopted for the analysis.
− Among seed values 1 to 10 seed value ‘1’ gave best results and hence is adopted
for analysis.
− The value of penalized objective function for pool size 30 is found to be same as
obtained for pool size 70 and above. Therefore pool size 30 is adopted which has
the advantage of lesser computational time also.
− It is found that combination of crossover probability of 0.85 and mutation
probability of 0.005 gave the lowest value of penalized objective function. Thus
these values are used for the analysis.
Using the above Genetic Algorithm parameters, a set of penalty coefficients for
transfer time, load factor and unsatisfied demand are decided. The coefficients are
decided so as to keep the load factor in the range between 1 (minimum load factor) and
1.2 (maximum load factor), the percentage unsatisfied demand as low as possible and
the effective waiting time for larger percentage demand between ‘zero’ and ‘five’
minutes. The demand satisfaction and load factors on various routes are two dominating
factors for both users and operators. It has been found during the interviews of
commuters that they prefer to have connecting buses with in five minutes of waiting
after arriving at bus stops but most of them even accept ten minutes of waiting as a
reasonable time. Thus the variation of penalty coefficients for minimum load factor is
studied on percentage satisfaction of demand with in ten minutes of waiting. The
coefficient for minimum load factor is selected because it is observed that the load
factor frequently goes below 0.4 (minimum value) due to low demand which is not
compatible to adopted existing bus capacity. Table 2 indicates typical variation of
overall load factor (average load factor of all the routes), percentage demand satisfied
with in ten minutes of waiting and values of penalized objective function. This typical
variation is observed when penalty coefficient corresponding to minimum load factor
(less than 0.4) is varied keeping other coefficients same. The typical variation in the
table shows that Genetic Algorithms are very sensitive to penalties. A weighted factor is

European Transport \ Trasporti Europei n. 41 (2009): 28-46
41
calculated by awarding equal weights to the overall load factor and percentage demand
satisfaction with in ten minutes of waiting. Penalty coefficient corresponding to higher
weighted factor is selected for further analysis.
Table 2: Typical variation of over all Load factor, satisfied demand with in ‘10’ minutes of waiting and
penalized objective function with respect to coefficient of minimum load factor penalty
Value of Coefficient for minimum load factor
1 2 3 4 5 6 7 8 9 10
Over all load factor (average for all the routes)
0.3074 0.3074 0.3656 0.3656 0.4210 0.5055 0.5055 0.5141 0.5310 0.5423
% demand satisfied with in 10 minutes of weighting
95.24 95.24 90.04 86.77 85.11 77.11 76.19 75.19 73.34 71.74
Typical values of penalized objective function
61804 81708 92732 105126 125158 132600 140042 149857 155529 173348
The penalties discussed above are calculated using the selected set of penalty
coefficients and the penalized objective function is determined by adding penalties to
the objective function. A set of frequencies on various routes corresponding to the
minimum value of the penalized objective function is used for determination of
coordinated schedules on various routes.
4. Results and discussion
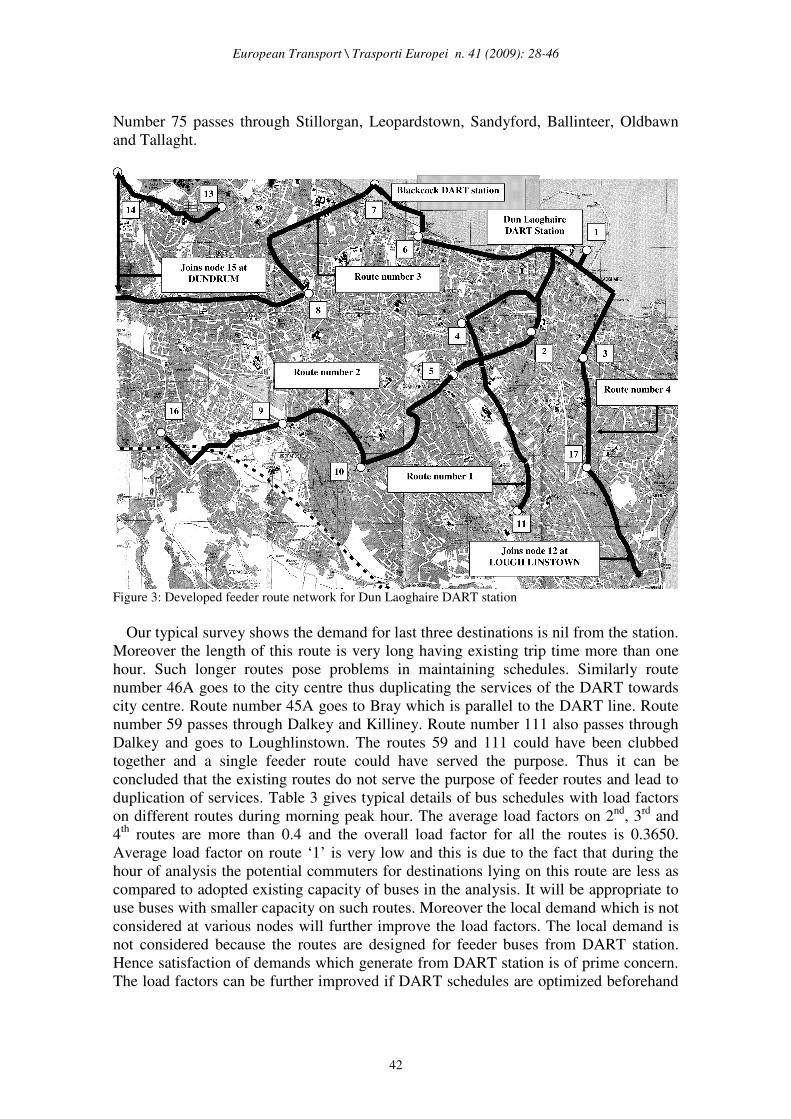
It was found that there are 6 destinations having demand greater than average. These
destinations are Dun Laoghaire College, Sallynoggin, Monkstown, Deans Grange,
Stillorgan, and Loughlinstown. Using Dijkstra’s algorithm, four shortest paths were
developed. These shortest paths were modified by node selection and insertion
strategies and four feeder routes were obtained. The developed feeder route network is
shown in Figure 3 with the code numbers of nodes as given in Table 1. The lengths of
feeder routes 1, 2, 3 and 4 are 5.54, 9.10, 14.6 and 5.8 km respectively. If similar
exercise is carried out by identifying influence area of all stations shorter feeder routes
will be developed. This is due to the fact that one node may be connected to more than
one DART station and its connectivity will certainly be better with shorter connecting
length from one particular station. This will lead to smaller feeder routes which will
ultimately help in maintaining schedules of feeder buses (Shrivastava and Dhingra,
2001). It can be seen in Figure 3 that destinations like Stillorgan (8), Mount Merrion
(13), University College Dublin (14) and Dundrum (15) are closer to Blackrock DART
station as compared to Dun Laoghaire. Thus feeder routes for these destinations from
Blackrock will be shorter. In the existing route structure of Dun Laoghaire bus routes
numbers 46A, 75, 111, 59, 46X originate from station where as route numbers 7, 7A
and 45A pass through the station with origins elsewhere. Some of the existing routes
that originate at the station pass through some of the locations for which demand does
not originate from the station as indicated in our typical traffic survey. The route
European Transport \ Trasporti Europei n. 41 (2009): 28-46
42
Number 75 passes through Stillorgan, Leopardstown, Sandyford, Ballinteer, Oldbawn
and Tallaght.
Figure 3: Developed feeder route network for Dun Laoghaire DART station
Our typical survey shows the demand for last three destinations is nil from the station.
Moreover the length of this route is very long having existing trip time more than one
hour. Such longer routes pose problems in maintaining schedules. Similarly route
number 46A goes to the city centre thus duplicating the services of the DART towards
city centre. Route number 45A goes to Bray which is parallel to the DART line. Route
number 59 passes through Dalkey and Killiney. Route number 111 also passes through
Dalkey and goes to Loughlinstown. The routes 59 and 111 could have been clubbed
together and a single feeder route could have served the purpose. Thus it can be
concluded that the existing routes do not serve the purpose of feeder routes and lead to
duplication of services. Table 3 gives typical details of bus schedules with load factors
on different routes during morning peak hour. The average load factors on 2nd
, 3rd
and
4th
routes are more than 0.4 and the overall load factor for all the routes is 0.3650.
Average load factor on route ‘1’ is very low and this is due to the fact that during the
hour of analysis the potential commuters for destinations lying on this route are less as
compared to adopted existing capacity of buses in the analysis. It will be appropriate to
use buses with smaller capacity on such routes. Moreover the local demand which is not
considered at various nodes will further improve the load factors. The local demand is
not considered because the routes are designed for feeder buses from DART station.
Hence satisfaction of demands which generate from DART station is of prime concern.
The load factors can be further improved if DART schedules are optimized beforehand

European Transport \ Trasporti Europei n. 41 (2009): 28-46
43
(Shrivastava and Reddy, 2002). However if DART schedules are modified then
coordination for other direction travel i.e. from buses to DART should also be studied.
In the existing scenario due to frequent availability of DART services there will always
be coordination from buses to DARTs irrespective of arrival time of buses.
Table 3: Details of Bus Schedules with Load Factors
Train Timings Bus Timings Load Factors S. No.
North Bound DARTS
South Bound DARTS
Route 1 Route 2 Route 3 Route 4 Route 1 Route 2 Route 3 Route 4
Over all
load factor
1 08.08 08.02 8.07 8.07 8.07 8.07 0.0676 0.3784 0.2297 0.2162
2 08.15 08.09 8.22 8.13 8.19 8.19 0.1216 0.1351 0.3108 0.2973
3 08.23 08.20 8.37 8.19 8.31 8.31 0.2568 0.3784 0.6216 0.5946
4 08.29 08.25 8.52 8.25 8.43 8.43 0.2162 0.5135 0.7027 0.6757
5 08.33 08.31 8.31 8.55 8.55 0.5135 0.3919 0.3784
6 08.38 08.36 8.37 - 0.5135 -
7 08.43 08.45 8.43 - 0.6486 -
8 08.49 08.53 8.49 - 0.1351 -
9 08.58 - 8.55 - 0.5135 -
9.00 - 0.3784 -
10 Trains after 9
a.m.
Buses to be
scheduled after 9 a.m.
Buses to be scheduled after 9 a.m.
Buses to be
scheduled after 9 a.m.
Load factor for Buses to
be scheduled
after 9 a.m.
Load factor for Buses to be scheduled after 9 a.m.
Load factor for Buses to
be scheduled
after 9 a.m.
Average Load factors on Individual Routes 0.1655 0.4108 0.4513 0.4324
0.3650
Table 4 gives waiting time details corresponding to developed coordinated schedules.
It can be seen from the table that 65.07% demand is satisfied within ‘0’ to ‘5’ minutes
of waiting and 24.97 % of demand is satisfied between ‘6’ to ‘10’ minutes of waiting.
Thus a total demand of 90.04% is satisfied within ‘10’ minutes of waiting. Entire
demand is satisfied before ‘15’ minutes of waiting. In the present scenario since the
existing routes do not serve the purpose of feeder routes average waiting time of
commuters at Dun Laoghaire DART station is more than 15 minutes even during the
morning peak hour with load factors in the range of 0.2 to 0.3.
Table 4: Waiting Time Details of Passengers
Percentage Demand Satisfied Duration of Delay in Minutes
Route No : 1 Route No : 2 Route No. 3 Route No.4 Overall
0 - 5 42.8 87.3 65.2 65.0 65.07
6 - 10 32.2 12.7 27.5 27.5 24.97
11 - 15 25.0 nil 07.2 07.5 09.96
More than 15 nil nil nil nil nil
European Transport \ Trasporti Europei n. 41 (2009): 28-46
44
5. Conclusions
Following conclusions can be drawn from this research.
− In this research, the model has been developed for operational integration of two
services i.e. public buses and a rail service (DART) for one DART station only.
The same modeling exercise can be repeated at various other DART stations after
identifying influence area of each for different time periods of a day. Thus the
model can develop an integrated public transport system in which suburban
trains / DART services will work as main line haul service and buses can feed the
local areas. This type of integrated system will allow both the modes to
compliment each other instead of competing. The integrated system will also
reduce wasteful duplication of services. If the modelling exercise is repeated to
other DART stations route structures will be better in terms of lengths and
satisfaction of demands.
− It is also confirmed that Genetic Algorithms are very efficient in solving multi
objective, non linear schedule coordination problem. The time taken to obtain
results is directly proportional to adopted population size. Near optimal results can
be obtained with smaller population sizes, which take less computational time and
are practically acceptable in real life situations. In the case study population size
30 is selected which takes less computation time and is able to provide equally
good results as provided by higher population sizes.
− The variation of percentage demand satisfaction and over all load factor against
variation of minimum load factor penalty shows that the Genetic Algorithms are
very sensitive to penalties. Thus selection of appropriate penalties is very much
required before the optimization process.
− The model developed in the research considers and develops real life network
with real life objectives for both users and operators. The model takes into account
real life constraints like level of service (maximum load factor), economical
operation (minimum load factor), minimum and maximum transfer time and
availability of public buses to maximum number of commuters (constraint for
unsatisfied demand). The model maintains a judicious balance between load factor
and satisfaction of demand within acceptable waiting time. Thus the model is able
to provide satisfactory results (feeder routes and coordinated schedules) from
users and operators point of view. Hence it can be claimed that proposed modeling
exercise is a specific contribution towards realistic modeling on coordinated
operations for passenger trips.
Acknowledgements
The research is funded under the Programme for Research in Third-Level Institutions
(PRTLI), administered by the HEA. The authors would like to acknowledge the useful
discussions with Dr Biswajit Basu during the research work.

European Transport \ Trasporti Europei n. 41 (2009): 28-46
45
References
Baaj M.H. and Mahamassani H.S. (1990), “TRUST: A LISP Program for Analysis of Transit Route
Configurations” Transportation Research Record 1283, pp.125 – 135.
Baaj M.H. and Mahmassani H.S.(1995), “ Hybrid Route Generation Heuristic Algorithm for the Design
of Transit Networks”, Transpn. Res.C, Vol. 3, No 1, pp 31 – 50
Bookbinder James H. and Desilets Alain (1992), “Transfer Optimization in a Transit Network”,
Transportation Science, Vol. 26, No 2, May 1992, pp. 106 – 118
Chakroborthy Partha, Kalyanmoy Deb, and Subrahmanyam S (1995), “Optimal Scheduling of Transit
Systems Using Genetic Algorithms”. ASCE Journal of Transportation engineering, 121(6), 544 –552.
Deb Kalyanmoy (1995), Optimization for engineering design – Algorithms and Examples, Prentice Hall
of India Pvt. Ltd., New Delhi, India, pp 290 -320.
Dhingra S.L.,(1980), “Simulation of Routing and Scheduling of City bus Transit Network”, Ph.D. thesis,
IIT Kanpur.
Dublin Street map (2000), published by ordinance survey of Ireland, 17th
Popular Edition, Revised in
2000.
Dubois D., Bel G. and Llibre M.(1979), “A set of methods in Transportation Network synthesis and
Analysis”. Journal of Operation Research Society, Vol.30, No. 9, pp. 797- 808.
Geok K, and Jossef Perl,(1988), “ Optimization of feeder bus routes and bus stop spacing” Journal of
Transportation Engineering, Vol. 114, No 3, ASCE pp 341-354.
Goldberg, D.E. (1989), Genetic Algorithm in search, optimization and machine learning, Addison-
Wesley Publishing Co., Reading Mass, 412p.
Hsu J. and Surti V.H. (1976), “Demand Model for bus network design” Transportation Engg, Journal
ASCE, Vol 102, TE3, Proc. Paper 12309,pp.451 – 460.
Kikuchi, S. and Parmeswaran J (1993). “Solving a Schedule Co-ordination Problem Using a Fuzzy
Control Technique”. In Proceeding of Intelligent Scheduling Systems, Symposium, ORSA- TIMS, San
Francisco, California.
Lampkin, W. and Saalmans, P.D.(1967). “The design of routes, service frequencies and schedules for a
Municipal Bus Undertaking: A Case Study”, Operation Research Quarterly Vol. 18, No 4, pp 375-
397.
Lance Chambers (1995). Practical Handbook of Genetic Algorithms Applications. Volume I, CRC Press,
pp.144 - 168.
Mandl, C. E. (1980), "Evaluation and Optimization of Urban Public Transport Networks", European
Journal of Operational Research, Vol. 6, pp. 31-56.
Maps and Zones at Home page of Irish rail for planning the journey by DART ,
http://www.irishrail.ie/dart/your_journey/maps_and_zones.asp . Accessed on March 22, 2004
Rapp M.H. and Gehner C.D. (1976), “Transfer optimization in an interactive graphic system for transit
planning”. Transportation Research Record, 619, pp. 27 –33.
Scott Wilson (2000), Final Report on Bus Network Strategy Appraisal Report for Greater Dublin Area.
www.dublinbus.ie/about_us/pdf/swilson.pdf Accessed on May 13, 2004.
Shrivastava Prabhat and Dhingra S.L (2000). An overview of bus routing and scheduling techniques.
Highway Research Bulletin, Number 62, pp. 65 – 90.
Shrivastava Prabhat and Dhingra S.L. (2001), “Development of feeder routes for suburban railway
stations using heuristic approach” ASCE journal of Transportation Engineering, USA, July/August
2001, Vol. 127, No. 4, pp. 334-341.
Shrivastava Prabhat and Dhingra S.L. (2002), “Development of co-coordinated schedules using Genetic
Algorithms” ASCE journal of Transportation Engineering, USA, Jan/Feb, Vol. 128, No. 1, pp. 89-96.
Shrivastava Prabhat, Dhingra S.L. and Gundaliya P.J. (2002), “Application of Genetic Algorithm for
Scheduling and Schedule co-ordination problems”, Journal of Advanced Transportation, Vol. 36, No.
1, winter 2002, pp. 23 – 41
Shrivastava Prabhat and Reddy Subbi M (2002) “Determination of Sub-optimal frequencies of suburban
trains using simulation”. In Journal of Transport Europei, Quarterly Journal of Transport Law and
Economics and Engineering, No. 18, pp. 4-11.
Silman L.A., Brazily Z. and Passy U.(1974), “Planning the rout system for Urban buses”. Computer and
Operation Research, Vol. 1, pp. 201-211.
Steer Davies Gleave (1994). Dublin Transportation Initiative, Final Report and Technical reports (Ten),
Stationery Office, Dublin.

European Transport \ Trasporti Europei n. 41 (2009): 28-46
46
Wirasinghe, S.C.(1980), “Nearly optimal parameters for a rail feeder bus system on a rectangular grid.”
Transp. Sci. 14A (1), pp33-40.