emerging markets equity...and the consumer discretionary sector, where, as in china, automotive...
TRANSCRIPT

EMERGING MARKETS EQUITY2020 Third Quarter Report
2020 Third Quarter Report | 1
Watch the Emerging Markets Equity quarterly review
View other reports at hardingloevner.com/insights
ONLINE SUPPLEMENTS
Sector and geographic allocations are supplemental information only and complement the fully compliant Emerging Markets Composite GIPS Presentation.
Source: Harding Loevner Emerging Markets Model; MSCI Inc. and S&P. MSCI Inc. and S&P do not make any express or implied warranties or representations and shall have no liability whatsoever with respect to any GICS data contained herein.
Market Review ›
The strong recovery in Emerging Markets (EMs) that began in mid-March sustained through the third quarter with the EM Index now having recouped nearly all of first quarter’s steep loss.
Performance and Attribution ›
Sources of relative return by region and sector.
Perspective and Outlook ›
Our Brazilian holdings illustrate our fixation on companies and their managements to uncover growth in diverse industries.
Portfolio Highlights ›
Holding roughly one-sixth of the portfolio in banks has not been good for returns this year, but weak shares are not necessarily a sign of weak businesses.
Portfolio Holdings ›
Information about the companies held in our portfolio.
Portfolio Facts ›
Contributors, detractors, characteristics, andcompleted transactions.
WHAT'S INSIDE
1The Composite performance returns shown are preliminary; 2Annualized Returns; 3Inception Date: November 30, 1998; 4The Benchmark Index; 5Gross of withholding taxes.
Please read the above performance in conjunction with the footnotes on the last page of this report. Past performance does not guarantee future results. All performance and data shown are in US dollar terms, unless otherwise noted.
COMPOSITE PERFORMANCE (% TOTAL RETURN) FOR PERIODS ENDED SEPTEMBER 30, 20201
3 MONTHS YTD 1 YEAR 3 YEARS2 5 YEARS2 10 YEARS2 SINCE INCEPTION2,3
HL EMERGING MARKETS (GROSS OF FEES) 9.32 -6.59 5.30 1.38 9.41 4.72 11.89
HL EMERGING MARKETS (NET OF FEES) 9.07 -7.23 4.34 0.47 8.44 3.79 10.98
MSCI EMERGING MARKETS INDEX (GROSS)4,5 9.70 -0.91 10.91 2.79 9.36 2.86 8.81
(UNDER) / OVER THE BENCHMARK
SECTO R EXPO SURE (%)
HL EM MSCI EM
FINANCIALS 21.8 17.1
INFO TECHNOLOGY 22.6 18.5
INDUSTRIALS 8.3 4.4
CONS STAPLES 9.6 6.1
CASH 2.3 —
ENERGY 4.9 5.4
UTILITIES 1.3 2.0
HEALTH CARE 2.4 4.3
REAL ESTATE 0.0 2.4
COMM SERVICES 9.8 12.7
CONS DISCRETIONARY 17.0 20.2
MATERIALS 0.0 6.9
(8.0) (4.0) 0.0 4.0 8.0
(UNDER) / OVER THE BENCHMARK
G EO G RAPHIC EXPO SURE (%)
6Emerging markets or frontier markets companies listed in developed markets; 7Includes countries with less-developed markets outside theIndex; 8Includes the remaining emerging markets, which individually, comprise less than 5% of the Index;9The Harding Loevner EmergingMarkets Model Portfolio’s end weight in China is 28.0% and Hong Kong is 6.8%. The Benchmark does not include Hong Kong.
HL EM MSCI EM
DEVELOPED MARKET LISTED6 5.9 —
RUSSIA 7.6 3.0
MEXICO 4.3 1.6
BRAZIL 6.9 4.6
CASH 2.3 —
FRONTIER MARKETS7 1.9 —
INDIA 7.6 8.3
SOUTH AFRICA 1.6 3.5
SOUTH KOREA 10.0 12.1
TAIWAN 10.6 12.8
SMALL EMERGING MARKETS8 6.5 12.2
CHINA + HONG KONG9 34.8 41.9
(8.0) (4.0) 0.0 4.0 8.0

2
This page intentionally left blank.

3
infection rates demand policy responses that hinder economic recovery. Brazil’s economy has proven more resilient than one would have anticipated given the horrifying levels of infections and deaths it continues to experience. The magnitude of its government’s extraordinary fiscal support, equating to 8% of GDP, has certainly helped, though potentially at a steep cost to future growth.
The strongest performing sectors by far were Consumer Discretionary and Information Technology (IT), followed by Materials, where deep cyclicals such as chemicals and paper stocks outperformed. High levels of Chinese investment have supported the global prices of industrial commodities, except energy, which remains stifled by lackluster demand and high inventories. Utilities was the weakest sector, followed by Energy and Financials. Financials received positive contributions from securities houses that saw a surge in trading volumes from the
MARKET REVIEW
The strong recovery in Emerging Markets (EMs) that began in mid-March sustained through the third quarter with the MSCI EM Index registering a return of nearly 10%, outperforming Developed Markets by nearly 2%. EMs posted their strongest six-month return since 2009, recouping nearly all of first quarter’s steep loss and leaving them down less than 1% year-to-date.
Companies that benefit from consumer habits shaped by lockdowns and social distancing, such as e-commerce and online services businesses, saw continued acceleration of demand into the third quarter. Investors clamoring for exposure to this select group of EM winners continued to fuel momentum in their shares, akin to the FAANG concentration effect we have witnessed in the US stock market. The combined index weight of Chinese internet and direct marketing retail companies, including heavyweights Alibaba, JD.com, and Meituan Dianping, has almost doubled year-to-date from 6% to 11%. E-commerce and semiconductors accounted for over 50% of the EM Index return during the quarter, by our calculation the greatest concentration in EM stock returns ever.
The market surge has been fueled in the lockdown period by a boom in local retail investing in domestic stocks by people stuck at home with lots of spare time to fill, helped by government COVID-19 income replacement programs, user-friendly trading platforms, disappearing trading commissions, and nominal interest rates in EM at all-time lows. The number of individual equity accounts in Brazil, for instance, has more than trebled since 2018, as savers-turned-speculators have abandoned low-yielding deposits or bonds for the allure of equities, particularly those of the fastest-growing companies. Notably, regulators in South Korea (where retail investors now make up about 70% of total volume) and China, two of the strongest markets in the recent rebound, have raised concerns about the increased use of margin loans by retail investors to participate in the equity rally.
On the economic front, wide disparities have opened up across regions. Among the “haves,” China has been notable for the speed and strength of its economic recovery, having already returned to posting year-over-year growth. China’s economic revival is being led by the old formula of fixed-asset investment—excavator sales have surged some 50% compared to last year—plus gushing supplies of credit, reflecting a hiatus in the long-term policy goal of deleveraging the shadow-banking sector. With a few exceptions, such as eating in restaurants, Chinese consumption remains robust. Lingering wariness about the health risks of public transport has pumped up auto sales after a three-year slump.
Relative to China’s experience, the economic damage wrought by the pandemic in most other EMs has been significantly greater and their recoveries more halting. In the populous Southeast Asian countries of India and Indonesia, near-term expectations for growth have been further slashed as resurgent
SECTOR PERFORMANCE (USD %)OF T H E M SC I E M I NDEX
Source: FactSet (as of September 30, 2020). MSCI Inc. and S&P.
TRAILING 12 M O N TH S
25.6
48.5
-2.4
-18.7
-18.6
47.1
-6.7
42.6
8.5
-7.6
-18.1
SECTOR 3Q 2020
COMMUNICATIO N SERVICES 2.5
CONSUMER DISCRETION ARY 26.9
CONSUMER STAPLES 4.4
ENERGY -0.2
FINANCIALS -0.3
HEALTH CARE 2.0
INDUSTRIAL S 3.0
INFORMATION TECHNOLOGY 20.7
MATERIALS 11.8
REAL ESTATE 1.0
UTILITIES -4.3
MARKET PERFORMANCE (USD %)
REGION/COUN TRY 3Q 2020 TRAILING 12 MONTHS
AFRICA 3.8 -10.7
SOUTH AFRICA 3.7 -10.6
ASIA 12.1 21.9
CHINA 12.6 33.8
INDIA 15.1 0.7
SOUTH KOREA 12.9 19.2
TAIWAN 17.1 36.0
EUROPE -4.9 -18.7
RUSSIA -4.3 -15.2
LATIN AMERICA -1.2 -29.1
BRAZIL -3.3 -32.3
MEXICO 4.7 -20.3
MIDDLE EAST 8.6 -3.9
MSCI EM INDEX 9.7 10.9
SECTOR PERFORMANCE (USD %)
OF THE MSCI EM INDEX

4
growing retail investor base, but the sector was dragged down by banks. The “Big Four” Chinese banks were particularly weak this quarter, their pandemic-related credit losses set to rise in the second half of the year.
By geography, Asia continued its streak of outperformance this quarter, with returns in Taiwan, South Korea, and China enhanced by these markets’ heavy weights in IT and Consumer Discretionary stocks. India also performed strongly led by IT services companies, which are benefitting from a global acceleration in the digital transformation of business, and the Consumer Discretionary sector, where, as in China, automotive companies witnessed a positive inflection in demand following a prolonged downcycle. The single largest contributor to India’s returns was the conglomerate Reliance Industries, which rallied on the sale of a small stake in its multi-category and multi-channel retailing division valued at nearly US$60 billion.
The weakest region was Europe. Russia faced dual headwinds: a weak oil price and a rising geopolitical threat of a harsher US stance following the US presidential election in the wake of the poisoning of Kremlin critic Alexei Navalny. Turkey, the weakest EM, suffered a sharp fall in its currency following a spike in inflation expectations. Latin America underperformed primarily due to Brazil, as signs of fractures in its political leadership collided with fears over the rising costs of the pandemic.
Across EMs on average, stocks of companies that score highest on Growth and Quality measures significantly outperformed the broad index.
PERFORMANCE AND ATTRIBUTION
The Emerging Markets composite rose 9.3% in the third quarter, just behind the 9.7% rise of the MSCI Emerging Markets Index. Our continued pursuit of diversification and commitment to investing in high-quality, growing, and reasonably priced companies put us at odds with the huge concentration of returns from the biggest “COVID-19 winners.” Unfavorable allocations relative to the benchmark were the key source of underperformance, particularly our underweight in Consumer Discretionary, where we had relatively lower exposure to COVID-19-winning e-commerce and online services stocks, and our overweight in Financials.
In Consumer Discretionary we also had poor stock selection in the automobile industry. Indonesia’s Astra International
reported weak second-quarter results and temporarily closed its auto manufacturing and sales operations due to the country’s re-imposition of social-distancing measures. By contrast, Chinese auto glass manufacturer Fuyao Glass Industry was a notable outperformer, a sign of an improving growth outlook for China’s auto sector. Weak stocks in Energy were also a detractor. Shares of Russian oil producer Lukoil were weighed down by the low oil price and concerns that a new proposal from within the Russian government to cancel certain mineral extraction tax breaks may cut into the company’s returns.
We strongly outperformed in Industrials, led by Hong Kong-based power tool manufacturer Techtronic Industries, a big beneficiary of the COVID-19-era do-it-yourself trend, and Brazilian electric motor manufacturer WEG, an emerging leader in internet-connected industrial equipment. Both
-2.0
-1.0
0.0
1.0
2.0
INDU
COM
M
INFT
RLS
T
UTI
L
HLT
H
MA
TS
CAS
H
STPL
FIN
A
ENE
R
DSC
R
Effe
ct (
%)
Selection Effect Allocation Effect Total Effect
SECTO R PERFO RMANCE ATTRIBUTIO NTHIRD Q UARTER 2020
EMERGING M A R K ETS CO M PO SITE VS. M SCI EM IN D EX
Total Effect: -0.3 Selection Effect: 0.2 Allocation Effect: -0.5
Companies held in the portfolio during the quarter appear in bold type; onlythe first reference to a particular holding appears in bold. The portfolio isactively managed therefore holdings shown may not be current. Portfolioholdings should not be considered recommendations to buy or sell anysecurity. It should not be assumed that investment in the security identifiedhas been or will be profitable. To request a complete list of holdings for thepast year, please contact Harding Loevner. A complete list of holdings atSeptember 30, 2020 is available on page 9 of this report.
G EO G RAPHIC PERFO RMANCE ATTRIBUTIO NTHIRD Q UARTER 2020
EMERGING M A R K ETS CO M PO SITE VS. M SCI EM IN D EX
¹Includes the remaining emerging markets, which individually, compriseless than 5% of the Index; ²Emerging markets or frontier marketscompanies listed in developed markets; ³Includes countries with less-developed markets outside the Index. Source: FactSet; Harding LoevnerEmerging Markets Composite; MSCI Inc. and S&P. The total effect shownhere may differ from the variance of the Composite performance andbenchmark performance shown on page 1 of this report due to the way inwhich FactSet calculates performance attribution. This information issupplemental to the Composite GIPS presentation.
-2.0
-1.0
0.0
1.0
2.0
TAIW
AN
SAFR
ICA
SMAL
L EM
S¹
CHIN
A +
HK
DEV
MK
TLI
STE
D²
BRA
ZIL
FRO
NTI
ERM
KTS
³
SKO
REA
RU
SSIA
INDI
A
CAS
H
MEX
ICO
Effe
ct (
%)
Selection Effect Allocation Effect Total Effect
Total Effect: -0.3 Selection Effect: 0.9Allocation Effect: -1.2

5
companies announced strong second-quarter earnings and offered encouraging growth outlooks.
Russia’s online-search leader Yandex contributed to good returns in Communication Services after posting strong second-quarter results. The advertising market in Russia, as in many markets, has been soft due to the fallout of the pandemic, hurting Yandex’s online search segment revenue. However, Yandex’s grocery delivery business, which it launched just before Russians began to social distance, could not have started at a better time. Towards the end of the quarter the market also cheered Yandex’s announcement that it would acquire Russian online bank Tinkoff.
By geography, again, our allocations detracted from relative returns, notably our overweight in Europe and Latin America and underweight to North Asia. We also underperformed in India, with poor returns from our Financials stocks as a rise in coronavirus cases through the quarter heightened worries about further deterioration of the economy that could lead to a higher percentage of non-performing loans. We also lagged in Mexico. FEMSA, the country’s largest convenience store operator and controlling stakeholder in one of the world’s largest Coca-Cola bottlers, has been hurt by pandemic-related business interruptions. However, the company is recovering with an increasing number of stores now operating under normal hours.
We had good stock selection in China (Fuyao Glass among others) and Taiwan, where the growth outlook for TSMC looks solid due to rising demand for its advanced chips used in 5G devices and high-performance computing. TSMC’s competitive position also appears to have improved at the expense of US rival Intel, which has been experiencing manufacturing struggles with the most-advanced technology and now may look to TSMC to outsource more of the production of the chips it designs to TSMC.
PERSPECTIVE AND OUTLOOK
Viewed superficially, that the EM Index returned to pre-pandemic levels during the third quarter might suggest that the effects of the pandemic are now behind the EMs and their commercial life is back to normal. Unfortunately, nothing could be further from the truth. To see how much has changed, look below the surface of the EM Index at the colossal divergence of sectors within. While the IT and Consumer Discretionary sectors rose 20% and 27%, respectively, for the year-to-date, Financials fell 26%. Country performance has been similarly disparate. The year-to-date spread in returns between China (up 17%) and Brazil (down 41%) is an eye-watering 58%.
The difference between China and Brazil owes in part to their respective gearing to global growth and their opposite roles in the global commodity trade, and in part to how effectively each country has handled the pandemic. Once it recognized the seriousness of the initial outbreak of the disease in Wuhan,
Chinese authorities were relatively quick to impose severe and widescale lockdowns, along with instituting comprehensive tracing and testing. By contrast, Brazil’s President Jair Bolsonaro has consistently dismissed the seriousness of the virus, and his administration’s uneven approach to containing it has left 5 million reportedly infected and 150,000 dead, a close second behind only the US, whose population is considerably larger.
But the disparity in their stock markets’ performance ultimately also comes down to the relative makeup, in terms of company membership, of each countries’ sleeve of the EM Index. China has an especially large weighting in technology-related companies that in many cases have directly benefitted from the pandemic. Some of these are great companies whose long-term growth prospects have been pulled forward as changes in consumer habits accelerated over the past several months, but some, like many in a recent rash of IPOs to hit the market, are considerably more speculative. Brazil’s stock market, by comparison, tends to represent a more diversified mix of sectors, with larger market weights in Financials, Materials, and Energy, one-tenth the weight of China in Communications Services, and almost no weight in IT (see chart below). The largest EM outside Asia, Brazil nonetheless continues to have the profile of a traditional developing market, with a large proportion of listed companies engaged in traditional activities, e.g., basic banking, infrastructure construction, and food and commodity production.
Pursuing growth opportunities among banking, industrials, oil and gas, and the like may not be as exciting as the latest pure technology sensation such as NIO, a Chinese electronic vehicle producer, currently valued at over 10 times estimated 2020 sales. While the company has tremendous growth potential, it also has a short history, significant operating losses, and is not expected to breakeven until 2022. Examples of growing,
WEIGHT OF EACH SECTOR (BY MARKET CAP) IN MSCI BRAZIL AND CHINA INDEXES
Source: MSCI Inc.; End weights as of September 30, 2020.
0.0
10.0
20.0
30.0
40.0
COMM DSCR STPL ENER FINA HLTH INDU INFT MATS RLST UTIL
(%)
Brazil China

6
expensive, but profitless companies currently abound in EMs. We are attracted to what may appear more boring: well-established companies with technological and other competitive advantages that offer consistent profitability, strong management, and sound finances, along with prospects for above average, if not always rocketing, growth.
Our Brazilian holdings, which range across the Financials, Consumer, Energy, and Industrials sectors, illustrate our ability to uncover growth in diverse industries. Among our selection criteria, management quality is key, and especially relevant at stressed times like these because foresight and skill enable companies to navigate unanticipated challenges successfully. So far, their managements have done a good job of navigating this crisis; not only have they sustained their businesses, they have been laying foundations for future growth by investing in leading edge technology to improve their digital capabili-ties and better adapt to potential changes in a post-COVID-19 world. Their success at sustaining their businesses has not in every case been reflected in their share prices, especially our bank holdings. Nevertheless, over time, good businesses are good investments and, overall, our stock selection in Brazil has been a positive contributor to returns this year.
A great example of skillful management and growth in a pro-saic industry is Localiza, the country’s largest rental car com-pany. It was the first rental car company in Brazil to adopt dy-namic pricing, adjusting the price based on short-term supply and demand, an innovation that was only possible after digi-tizing core processes. Localiza has been working on improving customer satisfaction and stickiness with new digital interfaces including a WhatsApp-based booking and customer assistance service-bot and the first rental solution in Brazil that is 100% mobile and eliminates human interaction through the entire rental experience. Localiza’s management seems to be han-dling the crisis well, further evidence that it is one of the best in the industry. While its retail car rental volumes declined 8% in the second quarter, they rebounded in June and July almost back to last year’s levels despite continuing low demand in airports. Its business of renting fleets to corporate clients grew revenues 15% year-over-year in the second quarter and has a strong long-term growth opportunity as less than a tenth of corporate fleets are outsourced currently. To take advantage of rising demand for private transport as a substitute for mass transit when the pandemic recedes, Localiza has begun to offer flexible long-term subscriptions to individuals as well.
Another Brazilian company leading its industry in technologi-cal investment and innovation is the electric motors, genera-tor, and transformer manufacturer WEG. The company is one of Brazil’s most successful industrial exporters, generating
about 60% of revenues from outside its home market. In the second quarter, WEG’s domestic revenue grew 24% and for-eign revenues 23% year-over-year despite a tough economic backdrop. Some of the growth has come from growing sales to wind and solar energy producers, as demand for energy from green sources has bucked the overall energy downturn. Look-ing forward, an even bigger area of opportunity relates to its integration of smart technology across its installed base of en-ergy and other industrial equipment. Before and throughout the pandemic, WEG’s management has pursued a strategy to enhance its digital and automation capabilities to enable the company to serve customers better. The foundation for this initiative is the embedded sensor technology that is already incorporated into much of the equipment WEG sells. The com-pany has a trove of data captured by these embedded sensors. After a string of recent acquisitions, it now also has a portfolio of measurement, reporting, and artificial intelligence technol-ogies for harnessing and interpreting that data. Its goal is to create an information service offering that customers will val-ue, for example, for its ability to reduce equipment downtime. That WEG is using its strong balance sheet to continue this development during the pandemic to enhance its competitive positioning is the latest example of the kind of forward think-ing we have come to expect from its management.
Perhaps nowhere has management skill in navigating the pan-demic come more into play than in Brazil’s banking industry. Bankers’ ability to assess the damage done to their loans by the pandemic has been clouded by temporary moratoriums on repayments of certain loans. These moratoriums have been imposed by governments in Brazil and elsewhere as a relief measure to forestall a large-scale financial crisis. As long as the moratoriums remain in effect, bankers’ visibility into which of their borrowers will be left standing is limited. Conserva-tive bankers at well-capitalized banks have taken provisions for loan losses aggressively to ensure they can withstand worst-case scenarios. Generally, such provisioning, whether undertaken in an abundance of caution or fully warranted, has heightened investors’ concerns about asset quality, leading to indiscriminate pressure on bank shares. Brazil’s moratorium is expected to end in October, following which banks will get to see which of their borrowers have been swimming naked, and investors will get to see which of their banks have an abun-dance of such borrowers.
We hold two Brazilian banks, Banco Bradesco and Itaú Unibanco. Itaú’s second quarter results were dragged down by its provisions. However, compared to competitors, the percentage of its loans covered by the moratoriums represents but a small fraction (8%) of its total loan book. Moreover, of those loans, 58% are fully collateralized. The risk of actual
Management quality is key, and especially relevant at stressed times like these, because foresight and skill enable companies to navigate unanticipated
challenges successfully.
Bankers’ ability to assess the damage done to their loans by the pandemic has been clouded by temporary moratoriums on repayments of
certain loans.
7
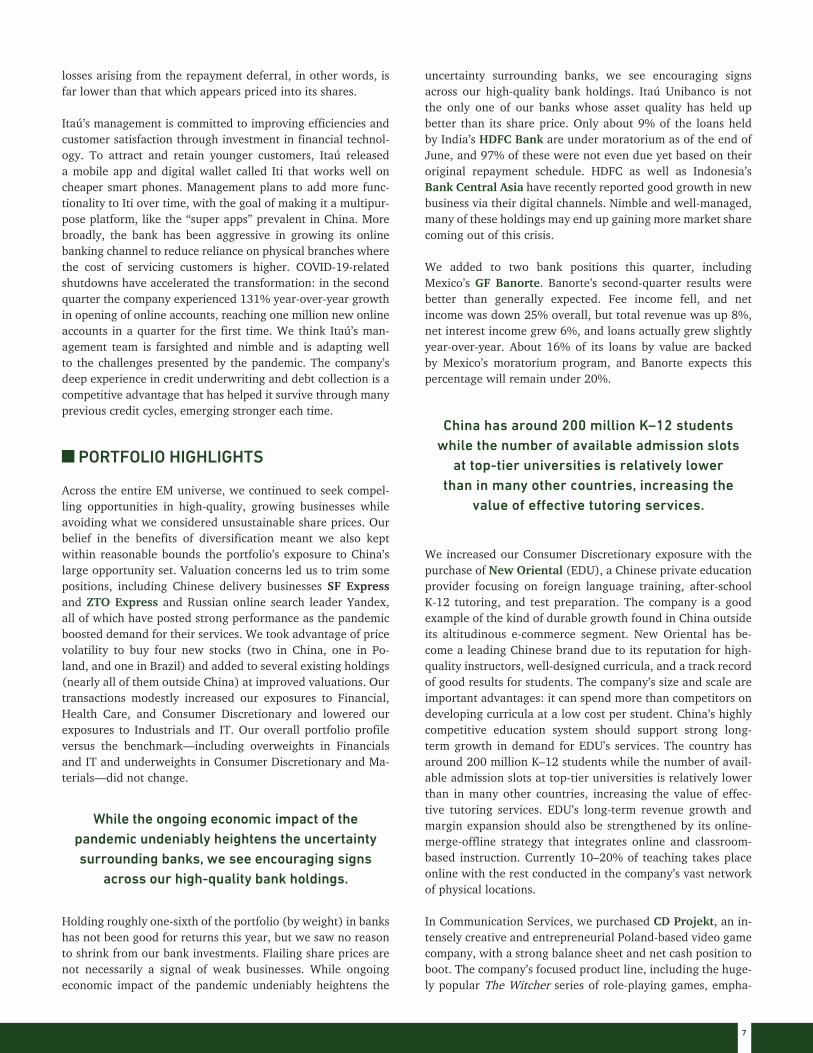
losses arising from the repayment deferral, in other words, is far lower than that which appears priced into its shares.
Itaú’s management is committed to improving efficiencies and customer satisfaction through investment in financial technol-ogy. To attract and retain younger customers, Itaú released a mobile app and digital wallet called Iti that works well on cheaper smart phones. Management plans to add more func-tionality to Iti over time, with the goal of making it a multipur-pose platform, like the “super apps” prevalent in China. More broadly, the bank has been aggressive in growing its online banking channel to reduce reliance on physical branches where the cost of servicing customers is higher. COVID-19-related shutdowns have accelerated the transformation: in the second quarter the company experienced 131% year-over-year growth in opening of online accounts, reaching one million new online accounts in a quarter for the first time. We think Itaú’s man-agement team is farsighted and nimble and is adapting well to the challenges presented by the pandemic. The company’s deep experience in credit underwriting and debt collection is a competitive advantage that has helped it survive through many previous credit cycles, emerging stronger each time.
PORTFOLIO HIGHLIGHTS
Across the entire EM universe, we continued to seek compel-ling opportunities in high-quality, growing businesses while avoiding what we considered unsustainable share prices. Our belief in the benefits of diversification meant we also kept within reasonable bounds the portfolio’s exposure to China’s large opportunity set. Valuation concerns led us to trim some positions, including Chinese delivery businesses SF Express and ZTO Express and Russian online search leader Yandex, all of which have posted strong performance as the pandemic boosted demand for their services. We took advantage of price volatility to buy four new stocks (two in China, one in Po-land, and one in Brazil) and added to several existing holdings (nearly all of them outside China) at improved valuations. Our transactions modestly increased our exposures to Financial, Health Care, and Consumer Discretionary and lowered our exposures to Industrials and IT. Our overall portfolio profile versus the benchmark—including overweights in Financials and IT and underweights in Consumer Discretionary and Ma-terials—did not change.
Holding roughly one-sixth of the portfolio (by weight) in banks has not been good for returns this year, but we saw no reason to shrink from our bank investments. Flailing share prices are not necessarily a signal of weak businesses. While ongoing economic impact of the pandemic undeniably heightens the
While the ongoing economic impact of the pandemic undeniably heightens the uncertainty surrounding banks, we see encouraging signs
across our high-quality bank holdings.
uncertainty surrounding banks, we see encouraging signs across our high-quality bank holdings. Itaú Unibanco is not the only one of our banks whose asset quality has held up better than its share price. Only about 9% of the loans held by India’s HDFC Bank are under moratorium as of the end of June, and 97% of these were not even due yet based on their original repayment schedule. HDFC as well as Indonesia’s Bank Central Asia have recently reported good growth in new business via their digital channels. Nimble and well-managed, many of these holdings may end up gaining more market share coming out of this crisis.
We added to two bank positions this quarter, including Mexico’s GF Banorte. Banorte’s second-quarter results were better than generally expected. Fee income fell, and net income was down 25% overall, but total revenue was up 8%, net interest income grew 6%, and loans actually grew slightly year-over-year. About 16% of its loans by value are backed by Mexico’s moratorium program, and Banorte expects this percentage will remain under 20%.
We increased our Consumer Discretionary exposure with the purchase of New Oriental (EDU), a Chinese private education provider focusing on foreign language training, after-school K-12 tutoring, and test preparation. The company is a good example of the kind of durable growth found in China outside its altitudinous e-commerce segment. New Oriental has be-come a leading Chinese brand due to its reputation for high-quality instructors, well-designed curricula, and a track record of good results for students. The company’s size and scale are important advantages: it can spend more than competitors on developing curricula at a low cost per student. China’s highly competitive education system should support strong long-term growth in demand for EDU’s services. The country has around 200 million K–12 students while the number of avail-able admission slots at top-tier universities is relatively lower than in many other countries, increasing the value of effec-tive tutoring services. EDU’s long-term revenue growth and margin expansion should also be strengthened by its online-merge-offline strategy that integrates online and classroom-based instruction. Currently 10–20% of teaching takes place online with the rest conducted in the company’s vast network of physical locations.
In Communication Services, we purchased CD Projekt, an in-tensely creative and entrepreneurial Poland-based video game company, with a strong balance sheet and net cash position to boot. The company’s focused product line, including the huge-ly popular The Witcher series of role-playing games, empha-
China has around 200 million K–12 students while the number of available admission slots
at top-tier universities is relatively lower than in many other countries, increasing the
value of effective tutoring services.

8
sizes visually stunning games for consoles and PCs that feature complex plots that attract millions of loyal gamers worldwide. CD Projekt’s competitive advantage is its low-cost locale, where game developer talent is on par with that of competi-tors in the US, western Europe, and Japan but wages are sig-nificantly lower. The company’s highly anticipated next game, Cyberpunk 2077, is slated for release in November 2020 after several years of development involving over 500 staff develop-ers. Whether Cyberpunk 2077 will meet its high expectations awaits the verdict of gamers. Regardless, CD Projekt is a leader in an industry that is producing ever more immersive games, which, through digital distribution, are accessible to millions of gamers worldwide who spend increasing amounts of time playing them.
Our sales this quarter included Chinese smartphone-component manufacturer AAC Technologies due to concerns that its core business making speakers and microphones faces rising competition that may compress margins. Moreover, AAC’s newer business lines in handset lenses and camera modules face competition from well-entrenched established producers, so its growing capacity in these areas could lead to price wars.
0.0
1.0
2.0
3.0
4.0
5.0
6.0
7.0
8.0
ConsDiscretionary
InfoTechnology
Financials
10y Avg 12/31/2019 9/30/2020
EM VALUATIONS - P/B CURRENT VS. HISTORY SELECT SECTORS IN THE MSCI EM INDEX
Source: FactSet and MSCI Inc.; Data as of September 30, 2020.
9
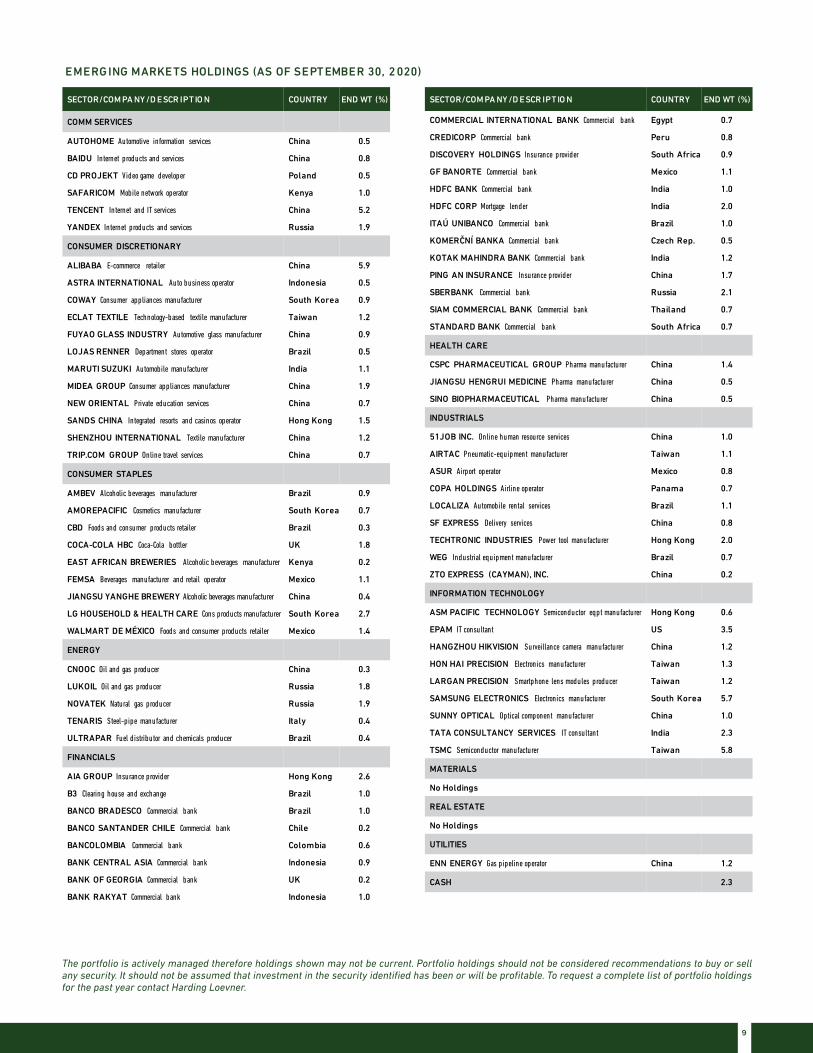
The portfolio is actively managed therefore holdings shown may not be current. Portfolio holdings should not be considered recommendations to buy or sell any security. It should not be assumed that investment in the security identified has been or will be profitable. To request a complete list of portfolio holdings for the past year contact Harding Loevner.
SECTOR/COM PA NY /D ESCR IPTIO N COUNTRY END WT (%)
COMM SERVICES
AUTOHOME Automotive information services China 0.5
BAIDU Internet products and services China 0.8
CD PROJEKT Video game developer Poland 0.5
SAFARICOM Mobile network operator Kenya 1.0
TENCENT Internet and IT services China 5.2
YANDEX Internet products and services Russia 1.9
CONSUMER DISCRETIONARY
ALIBABA E-commerce retailer China 5.9
ASTRA INTERNATIONAL Auto business operator Indonesia 0.5
COWAY Consumer appliances manufacturer South Korea 0.9
ECLAT TEXTILE Technology-based textile manufacturer Taiwan 1.2
FUYAO GLASS INDUSTRY Automotive glass manufacturer China 0.9
LOJAS RENNER Department stores operator Brazil 0.5
MARUTI SUZUKI Automobile manufacturer India 1.1
MIDEA GROUP Consumer appliances manufacturer China 1.9
NEW ORIENTAL Private education services China 0.7
SANDS CHINA Integrated resorts and casinos operator Hong Kong 1.5
SHENZHOU INTERNATIONAL Textile manufacturer China 1.2
TRIP.COM GROUP Online travel services China 0.7
CONSUMER STAPLES
AMBEV Alcoholic beverages manufacturer Brazil 0.9
AMOREPACIFIC Cosmetics manufacturer South Korea 0.7
CBD Foods and consumer products retailer Brazil 0.3
COCA-COLA HBC Coca-Cola bottler UK 1.8
EAST AFRICAN BREWERIES Alcoholic beverages manufacturer Kenya 0.2
FEMSA Beverages manufacturer and retail operator Mexico 1.1
JIANGSU YANGHE BREWERY Alcoholic beverages manufacturer China 0.4
LG HOUSEHOLD & HEALTH CARE Cons products manufacturer South Korea 2.7
WALMART DE MÉXICO Foods and consumer products retailer Mexico 1.4
ENERGY
CNOOC Oil and gas producer China 0.3
LUKOIL Oil and gas producer Russia 1.8
NOVATEK Natural gas producer Russia 1.9
TENARIS Steel-pipe manufacturer Italy 0.4
ULTRAPAR Fuel distributor and chemicals producer Brazil 0.4
FINANCIALS
AIA GROUP Insurance provider Hong Kong 2.6
B3 Clearing house and exchange Brazil 1.0
BANCO BRADESCO Commercial bank Brazil 1.0
BANCO SANTANDER CHILE Commercial bank Chile 0.2
BANCOLOMBIA Commercial bank Colombia 0.6
BANK CENTRAL ASIA Commercial bank Indonesia 0.9
BANK OF GEORGIA Commercial bank UK 0.2
BANK RAKYAT Commercial bank Indonesia 1.0
EMERG ING MARKETS HOLDINGS (AS OF SEPTEMBER 30, 2020)
SECTOR/COM PA NY /D ESCR IPTIO N COUNTRY END WT (%)
COMMERCIAL INTERNATIONAL BANK Commercial bank Egypt 0.7
CREDICORP Commercial bank Peru 0.8
DISCOVERY HOLDINGS Insurance provider South Africa 0.9
GF BANORTE Commercial bank Mexico 1.1
HDFC BANK Commercial bank India 1.0
HDFC CORP Mortgage lender India 2.0
ITAÚ UNIBANCO Commercial bank Brazil 1.0
KOMERČNÍ BANKA Commercial bank Czech Rep. 0.5
KOTAK MAHINDRA BANK Commercial bank India 1.2
PING AN INSURANCE Insurance provider China 1.7
SBERBANK Commercial bank Russia 2.1
SIAM COMMERCIAL BANK Commercial bank Thailand 0.7
STANDARD BANK Commercial bank South Africa 0.7
HEALTH CARE
CSPC PHARMACEUTICAL GROUP Pharma manufacturer China 1.4
JIANGSU HENGRUI MEDICINE Pharma manufacturer China 0.5
SINO BIOPHARMACEUTICAL Pharma manufacturer China 0.5
INDUSTRIALS
51JOB INC. Online human resource services China 1.0
AIRTAC Pneumatic-equipment manufacturer Taiwan 1.1
ASUR Airport operator Mexico 0.8
COPA HOLDINGS Airline operator Panama 0.7
LOCALIZA Automobile rental services Brazil 1.1
SF EXPRESS Delivery services China 0.8
TECHTRONIC INDUSTRIES Power tool manufacturer Hong Kong 2.0
WEG Industrial equipment manufacturer Brazil 0.7
ZTO EXPRESS (CAYMAN), INC. China 0.2
INFORMATION TECHNOLOGY
ASM PACIFIC TECHNOLOGY Semiconductor eqpt manufacturer Hong Kong 0.6
EPAM IT consultant US 3.5
HANGZHOU HIKVISION Surveillance camera manufacturer China 1.2
HON HAI PRECISION Electronics manufacturer Taiwan 1.3
LARGAN PRECISION Smartphone lens modules producer Taiwan 1.2
SAMSUNG ELECTRONICS Electronics manufacturer South Korea 5.7
SUNNY OPTICAL Optical component manufacturer China 1.0
TATA CONSULTANCY SERVICES IT consultant India 2.3
TSMC Semiconductor manufacturer Taiwan 5.8
MATERIALS
No Holdings
REAL ESTATE
No Holdings
UTILITIES
ENN ENERGY Gas pipeline operator China 1.2
CASH 2.3

10
The portfolio is actively managed therefore holdings identified above do not represent all of the securities held in the portfolio and holdings may not be current. It should not be assumed that investment in the securities identified has been or will be profitable. The following information is available upon request: (1) information describing the methodology of the contribution data in the charts above; and (2) a list showing the weight and contribution of all holdings during the quarter and the last 12 months. Past performance does not guarantee future results. In the charts above, “weight” is the average percentage weight of the holding during the period, and “contribution” is the contribution to overall performance over the period. Contributors and detractors exclude cash and securities in the Composite not held in the Model Portfolio. Quarterly data is not annualized. Portfolio attribution and characteristics are supplemental information only and complement the fully compliant Emerging Markets Composite GIPS Presentation. Portfolio holdings should not be considered recommendations to buy or sell any security.
PO RTFO LIO CHARACTERISTICS
1Weighted median; 2Trailing five years, annualized; 3Five-year average; 4Weighted harmonic mean; 5Weighted mean. Source (Risk characteristics): eVestment Alliance (eA); Harding Loevner Emerging MarketsComposite, based on the Composite returns; MSCI Inc. Source (other characteristics): FactSet (Run Date: October 4, 2020, based on the latest available data in FactSet on this date.); Harding Loevner EmergingMarkets Model, based on the underlying holdings; MSCI Inc.
QUALITY & GROWTH HL EM MSCI EM
PROFIT MARGIN1 (%) 15.8 16.1
RETURN ON ASSETS1 (%) 9.0 6.4
RETURN ON EQUITY1 (%) 19.7 15.7
DEBT/EQUITY RATIO1 (%) 27.3 40.4
STD DEV OF 5 YEAR ROE1 (%) 3.6 3.7
SALES GROWTH1,2 (%) 7.9 6.6
EARNINGS GROWTH1,2 (%) 12.5 9.7
CASH FLOW GROWTH1,2 (%) 13.6 11.0
DIVIDEND GROWTH1,2 (%) 16.3 11.3
SIZE & TURNOVER HL EM MSCI EM
WTD MEDIAN MKT CAP (US $B) 34.0 37.0
WTD AVG MKT CAP (US $B) 146.4 178.6
RISK AND VALUATION HL EM MSCI EM
ALPHA2 (%) -0.02 —
BETA2 1.02 —
R-SQUARED2 0.95 —
ACTIVE SHARE3 (%) 71 —
STANDARD DEVIATION2 (%) 18.05 17.23
SHARPE RATIO2 0.46 0.48
TRACKING ERROR2 (%) 3.90 —
INFORMATION RATIO2 0.01 —
UP/DOWN CAPTURE2 101/101 —
3Q20 CO NTRIBUTO RS TO ABSO L UTE RETURN (%)
3Q20 D ETRACTO RS FRO M ABSO L UTE RETURN (%)
L AST 12 MO S CO NTRIBUTORS TO ABSOL UTE RETURN (%)
L AST 12 MO S D ETRACTORS FROM ABSO L UTE RETURN (%)
LARGEST CONTRIBUTORS SECTOR AVG. WT. CONTRIBUTION
TSMC INFT 5.9 2.15
ALIBABA DSCR 5.6 1.66
SAMSUNG ELECTRONICS INFT 5.2 0.73
EPAM INFT 2.9 0.71
YANDEX COMM 2.1 0.56
LARGEST CONTRIBUTORS SECTOR AVG. WT. CONTRIBUTION
TSMC INFT 5.7 3.36
ALIBABA DSCR 5.2 2.97
TENCENT COMM 5.1 2.71
EPAM INFT 2.2 1.56
YANDEX COMM 1.3 1.38
LARGEST DETRACTORS SECTOR AVG. WT. CONTRIBUTION
BANCO BRADESCO FINA 1.4 -1.00
ITAÚ UNIBANCO FINA 1.3 -0.77
COPA HOLDINGS INDU 0.8 -0.70
BANK RAKYAT FINA 1.3 -0.69
GF BANORTE FINA 1.1 -0.69
LARGEST DETRACTORS SECTOR AVG. WT. CONTRIBUTION
LUKOIL ENER 2.2 -0.38
LARGAN PRECISION INFT 1.4 -0.21
ITAÚ UNIBANCO FINA 1.2 -0.16
AMBEV STPL 0.9 -0.14
TENARIS ENER 0.5 -0.12
PRICE/EARNINGS4 20.5 16.8
PRICE/CASH FLOW4 14.1 10.3
PRICE/BOOK4 2.7 1.8
DIVIDEND YIELD5 (%) 2.4 2.4TURNOVER3 (ANNUAL %) 18.1 —
POSITIONS SOLD COUNTRY SECTOR
AAC TECHNOLOGIES CHINA INFT
DP WORLD* UAE INDU
POSITIONS ESTABLISHED COUNTRY SECTOR
CD PROJEKT POLAND COMM
JIANGSU HENGRUI MEDICINE CHINA HLTH
NEW ORIENTAL CHINA DSCR
ULTRAPAR BRAZIL ENER
CO MPL ETED PORTFOLIO TRANSACTIONS
*Taken private
11
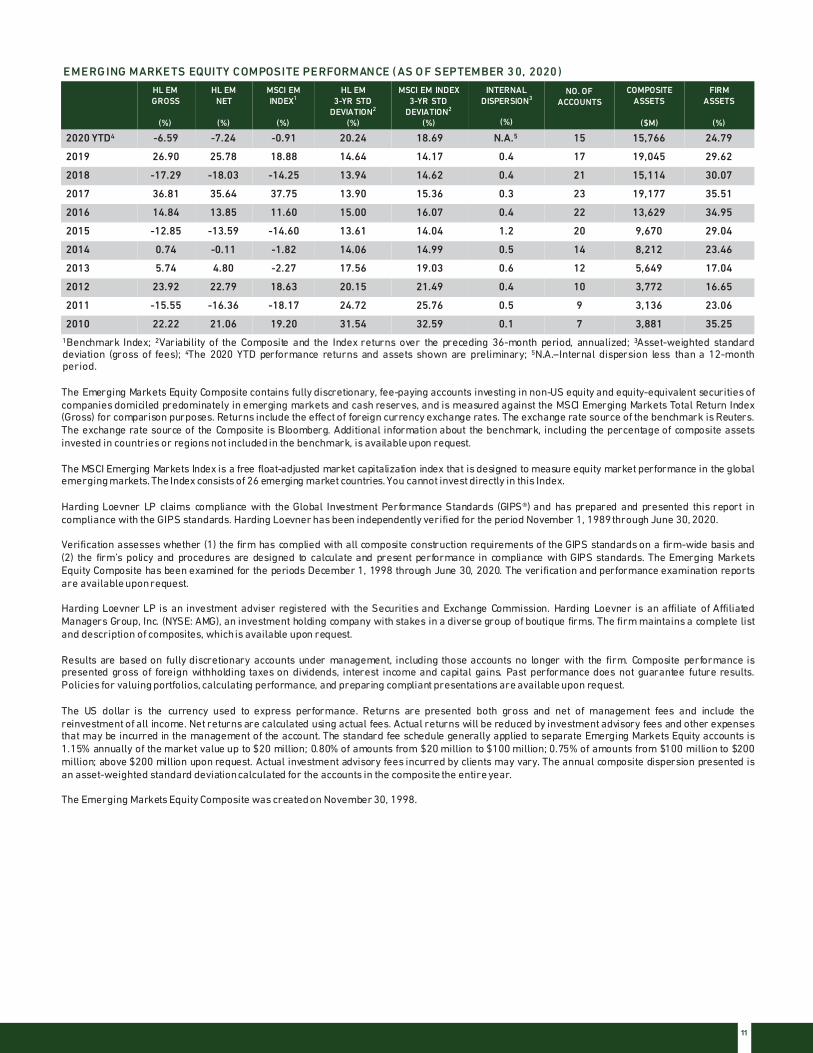
1Benchmark Index; 2Variability of the Composite and the Index returns over the preceding 36-month period, annualized; 3Asset-weighted standarddeviation (gross of fees); 4The 2020 YTD performance returns and assets shown are preliminary; 5N.A.–Internal dispersion less than a 12-monthperiod.
The Emerging Markets Equity Composite contains fully discretionary, fee-paying accounts investing in non-US equity and equity-equivalent securities ofcompanies domiciled predominately in emerging markets and cash reserves, and is measured against the MSCI Emerging Markets Total Return Index(Gross) for comparison purposes. Returns include the effect of foreign currency exchange rates. The exchange rate source of the benchmark is Reuters.The exchange rate source of the Composite is Bloomberg. Additional information about the benchmark, including the percentage of composite assetsinvested in countries or regions not includedin the benchmark, is available upon request.
The MSCI Emerging Markets Index is a free float-adjusted market capitalization index that is designed to measure equity market performance in the globalemergingmarkets. The Index consists of 26 emerging market countries. You cannot invest directly in this Index.
Harding Loevner LP claims compliance with the Global Investment Performance Standards (GIPS®) and has prepared and presented this report incompliance with the GIPS standards. Harding Loevner has been independently verified for the period November 1, 1989through June 30, 2020.
Verification assesses whether (1) the firm has complied with all composite construction requirements of the GIPS standards on a firm-wide basis and(2) the firm’s policy and procedures are designed to calculate and present performance in compliance with GIPS standards. The Emerging MarketsEquity Composite has been examined for the periods December 1, 1998 through June 30, 2020. The verification and performance examination reportsare available uponrequest.
Harding Loevner LP is an investment adviser registered with the Securities and Exchange Commission. Harding Loevner is an affiliate of AffiliatedManagers Group, Inc. (NYSE: AMG), an investment holding company with stakes in a diverse group of boutique firms. The firm maintains a complete listand description of composites, whichis available upon request.
Results are based on fully discretionary accounts under management, including those accounts no longer with the firm. Composite performance ispresented gross of foreign withholding taxes on dividends, interest income and capital gains. Past performance does not guarantee future results.Policies for valuingportfolios, calculating performance, and preparing compliant presentations are available upon request.
The US dollar is the currency used to express performance. Returns are presented both gross and net of management fees and include thereinvestment of all income. Net returns are calculated using actual fees. Actual returns will be reduced by investment advisory fees and other expensesthat may be incurred in the management of the account. The standard fee schedule generally applied to separate Emerging Markets Equity accounts is1.15% annually of the market value up to $20 million; 0.80% of amounts from $20 million to $100 million; 0.75% of amounts from $100 million to $200million; above $200 million upon request. Actual investment advisory fees incurred by clients may vary. The annual composite dispersion presented isan asset-weighted standard deviationcalculated for the accounts in the composite the entire year.
The Emerging Markets Equity Composite was createdon November 30, 1998.
EMERG ING MARKETS EQUITY COMPOSITE PERFORMANCE ( AS O F SEPTEMBER 30, 2020)
HL EMGROSS
(%)
HL EMNET
(%)
MSCI EM INDEX1
(%)
HL EM3-YR STD
DEVIATION2
(%)
MSCI EM INDEX3-YR STD
DEVIATION2
(%)
INTERNAL DISPERSION3
(%)
NO. OF ACCOUNTS
COMPOSITE ASSETS
($M)
FIRM ASSETS
(%)
2020 YTD4 -6.59 -7.24 -0.91 20.24 18.69 N.A.5 15 15,766 24.79
2019 26.90 25.78 18.88 14.64 14.17 0.4 17 19,045 29.62
2018 -17.29 -18.03 -14.25 13.94 14.62 0.4 21 15,114 30.07
2017 36.81 35.64 37.75 13.90 15.36 0.3 23 19,177 35.51
2016 14.84 13.85 11.60 15.00 16.07 0.4 22 13,629 34.95
2015 -12.85 -13.59 -14.60 13.61 14.04 1.2 20 9,670 29.04
2014 0.74 -0.11 -1.82 14.06 14.99 0.5 14 8,212 23.46
2013 5.74 4.80 -2.27 17.56 19.03 0.6 12 5,649 17.04
2012 23.92 22.79 18.63 20.15 21.49 0.4 10 3,772 16.65
2011 -15.55 -16.36 -18.17 24.72 25.76 0.5 9 3,136 23.06
2010 22.22 21.06 19.20 31.54 32.59 0.1 7 3,881 35.25

400 CROSSING BLVD, FOURTH FLOOR • BRIDGEWATER, NJ 08807T (908)218-7900 • F (908)218-1915 • HARDINGLOEVNER.COM
©2020 HARDING LOEVNER
This page intentionally left blank.