emerging economies and the impacts of globalized trade and investment on forests and...
TRANSCRIPT

Emerging economies and the impacts of globalized
trade and investment on forests and forest-
dependent communitiesD. Andrew Wardell, CIFOR
CIFOR Side Event, UNIKIS, Kisangani – 7 June 2014

Emerging economies and the impacts of globalized
trade and investment - Overview
History matters
34
12 China in Africa – dispelling some myths
Case studies - Gabon and Ghana
Opportunities through Aid-for-Trade

Global context - WTO International Trade Statistics 2011
F1
F2
F3
F1 = Forest products, world, 245 US$ bn
F2 = Roundwood & sawnwood, world, 50 US$ bn
F3 = Roundwood & sawnwood, Africa, 2 US$ bnSource: FAO Forest products yearbook 2011

Global developments 1960-2010B
illio
n p
eo
ple
Source: Holmgren, 2013

What to expect
9.6 billion people in 2050
Changing consumption patterns
Continued economic growth
Growing expectations of justice and equity
Migrations to seek new opportunities
Increased climate variability
Growing demand for food, fibre, fodder and fuel
(notably BRICS)
Continued deforestation but at a lower rate

EU impact on deforestation
Only 2% of global deforestation
attributed to logging
0.7 Mha/year of deforestation
caused by EU27 imports
cf. Tropical Forest Alliance
aiming for “Zero deforestation”
through commodity chains

History matters1


Major shifts in dominant producing
regions, 1900-2000
CocoaBananas
Rubber
Oil palm
Source: Byerlee and Rueda, 2013
Map indicates colonial boundaries in 1900

Rubber
1900Wild harvest—Congo,
Amazon
Major human rights issues!
1900-1914Plantation rubber Malaysia
> 1920Southeast Asia
Smallholders share 85%0
10
20
30
40
50
60
70
80
1900 1910 1930 1950 1970 1990 2010
% share of production
Americas
Africa
Malaysia
Indonesia
Other SE Asia
Source: Byerlee and Rueda, 2013

Oil palm
1900 Wild palm West Africa by
smallholders
> 1911Unilever rejected Nigeria
Congo--First large plantations
> 1920 Sumatra plantations
> 1965Malaysia plantations
> 1990 Indonesia (40% smallholders)
-10.0
0.0
10.0
20.0
30.0
40.0
50.0
60.0
70.0
80.0
1910 1930 1950 1970 1990 2010
Percent export shares of the world palm oil market
Congo
Indonesia
MalaysiaNigeria
Source: Byerlee and Rueda, 2013

Agricultural certification – slow progress
Status
Bananas Chiquita 100% RFA certified
Oil palm 14% RSPO certified in 2012
Rubber < 5% certifiedOpportunity for premium eco-certification in agroforestry systems
Cocoa < 5% certified (Sub-Saharan Africa)Opportunity for premium eco-certification in agroforestry systems

Lessons learned
• Perceived low value of forests, and hence dominant ethos:
deforestation = development
• Long history of concerns about land use for tropical exports
Land and forest rights
- Slow and lacked international agreements and institutions
- Championed by civil society + sometimes colonial governments and private
companies
Ecosystem services of forests
- Late comer (at global level) but rapid progress in agreements
- Initially championed by science
• Progressive shift to smallholder production systems
• Prevailing ‘standards’ have often had major impact on how and
where produced
Need for international minimum standards to avoid a ‘race to the bottom’
• Weak institutions, lack of resources, and vested interests are
recurring themes in implementation

China in Africa – dispelling some myths 2

Global
Source: Adapted from Lua Xinjian, 2010
• 1,950 million ha of forest
area
• Total stock of forest is
13.7 billion cubic meter

Key challenges for China
Forest Area 3-4% of the world
Land Area 7% of the world
Population 22% of the world
Production and living demand
Ecological conservation
Source: Lua Xinjian, 2010
Poverty reduction and economic development

Chinese forest products – imports and exports
Source: Lua Xinjian, 2010

Evolution of China’s OFDI Policy
• Phase 1: 1979-1990: Tentative development
• China formally recognized the legal status of overseas
investments and several tentative but favourable
policies were developed to facilitate OFDI activities
• Phase 2: 1991-2001: Sporadic development
• Restrictive policies were developed to control
predominantly large-scale investments
• Phase 3: 2002 to 2011: Fast and stable development
• “Going out” strategy was implemented and the whole
policy system was reformed to promote ODFI.
Regulatory activities were also strengthened
• Phase 4: April 2011-present: First White Paper on Foreign
Aid (State Council)
Source: Adapted from CIFOR, 2011

Preliminary findings
• China’s imports from Africa in 2008 (petroleum - ca.
US$40b; mining - ca. US$7b; and forestry - ca. US$1b)
• Almost half of all African timber exports from Gabon
• China’s OFDI in Africa grew from ca. US$1b in 2000 to
over US$56b in 2009
• 30% of investments in the mining sector (2009)
• 16% of investments in agriculture, forestry, fisheries
and animal husbandry (2009)
• Chinese firms (and SMEs) also investing in banks,
manufacturing, telecommunications and retailing
• “Chinese infrastructure projects are knitting the
African continent together from wireless networks to
roads and bridges” (Brautigam, 9/2/2012)

Dispelling some myths
• The West is worried (again) about Chinese investment
in Africa (cf. veiled references to the danger of
Africa’s “new colonialists”)
• But little evidence to support alleged large-scale
Chinese land grabbing,
• to suggest that Chinese firms (or companies from
other BRICS countries) operate with any different
standards than their European or North American
counterparts,
• to indicate that Chinese companies are investing
more or less than Western firms in countries ruled by
unsavoury regimes and
• to affirm that Chinese companies bring in all their own
workers (but depends on type of investment)

Understanding Chinese investments
• Chinese investments are not simply motivated by short-
term commercial and strategic interests but by broader
and longer-term interests
• But methodological challenges remain in terms of being
able to identify and distinguish between different types
of Chinese investment and investors in e.g. Ethiopia
which include Huajian (shoe factory), Sino-Ethiopian
Associates (pharmaceutical joint venture) and David
Huang’s (7 ha farm producing vegetables for the
growing Chinese population) and the extent to which
each has benefited (or not) from state-financing
• Need for greater recognition of China’s own efforts to
comply with international standards cf. the new
Forest Certification Scheme

China’s Forest Certification Scheme
Source: Lua Xinjian, 2010

Case study – Gabon
3

Gabon – supplying logs to China
• Investment Charter, 1998 and Private Investment
Promotion Agency (APIP), 2000
• New Forest Law, 016, 2001
• Gabon – largest African supplier of logs to China until
logging ban introduced in 2010
• Chinese companies currently own 121 concession
permits (out of total of 500 active permits) to manage
and log 2.67 million ha of forestland esp. in the Province
of Ogooue Ivindo (half of which belong to 5 companies)
• Annual timber exports ca. 1 million m3 (70% of total)
• Timber investments by private companies and
individuals (not known if backed by Chinese
development banks or not)

Timber Exports to China - Gabon, Cameroon and DRC,
1998-2009 (million US$)
0.00
50.00
100.00
150.00
200.00
250.00
300.00
350.00
400.00
450.00
199819992000200120022003200420052006200720082009
YEAR
USD
(m
illi
on
s)
0.10
1.00
10.00
100.00
1000.00
199819992000200120022003200420052006200720082009
YEAR
USD
(m
illi
on
s)
Gabon
Cameroon
DRC
Gabon
Cameroon
DRC
Normal scale Log scale
Source: CIFOR WP #

Chinese OFDI - Gabon

Gabon – shifting investments in forestry
• Investors must enter into a ‘provisional convention of
management, exploitation and transformation’ (CPAET -
Forest Law, Art. 23)
• 3 types of logging permit viz., CFAD (SFM concession);
PFA (Gabonese forestry associates permit), and PGG
(over-the-counter permit)
• By 2010 Gabon had 7m ha (CPAETs), 3.4m (CFADs with
approved management plans) and 5 concessions owned
by 2 companies under FSC certification (1.3m ha)
• Special Economic Zone jointly managed by Gabonese
government and Olam
• Olam owns 400,000 ha of timber concessions in Gabon
• Now targeting companies for investments in processing
in wake of 2010 logging ban

Special Economic Zone - Gabon
Gabon SEZ strategically located at Nkok offers optimum logistic advantage by way multiple
connectivity port Owendo 30 Km from the site, nearest rail connectivity from Ntoum and Owendo,
nearest national highway RN 1 connecting just 500m away from northern boundary of the site.
Fiscal incentives
Income Tax holiday for 10 yrs & then concessional tax of 10% for next 5 yrs
Complete waiver on import of material & export of manufactured product
Duty exemptions on import of Plant &Machinery and spares
Exemption of VAT (Value Added Tax)
Relaxations & waivers
50% concession on power tariff
100% repatriation of funds
Relaxed labour laws
Up to 5% DTA sales permitted without any tax implication
Common infrastructure
Water treatment plant
Sewage & effluent treatment plant
Common Log Park
Common Dry kiln facility
A 15 MW capacity Eco-friendly Co-gen power plant to generate power from the wood waste
generated in the zone.
Forest Concessions offered to the units
The forest concession under sustainable management which can cover a surface area between
50,000 ha and 200,000 ha.
A single logging company can be granted many CFADs, however the cumulative area granted to one
company cannot exceed 600,000 ha.
Regulatory and statutory clearances
Gabon SEZ would facilitate to obtain all such necessary regulatory and statutory clearances
required for setting up an industry in Gabon SEZ from various government departments of Gabon
by way of single window clearance approach, simplifying the process in granting speedy approvals
to the units.

Forest concessions - Gabon
Source: Projet d’accompagnement des petits permis forestier gabonais (PAPPFG, 2010)

Gabon – acquiring logging rights
• Chinese companies use diverse ways to obtain logging
rights sometimes in the ‘margins of the law’ including:
• Acquisition of multiple PFAs
• Purchase of larger established companies e.g. Leroy
Gabon – Plyrosol (by Honest Timber) and Gabon Export
Bois (by Shengyang group: Euro 68m for a 1.47m ha
concession)
• Renting rights from French companies in anticipation of
a planned acquisition
• Other alleged violations include i.a. failure to pay area
taxes, illegal logging of national parks bordering
concessions, logging of trees below the legal minimum
diameter, improper documentation of timber and incorrect
listing of volumes on waybills

New opportunities through Aid-for-Trade?
4

What is Aid-for-Trade?
Aid-for-Trade (AfT) launched in 2005
5 AfT categories:
• Trade-related infrastructure
• Support to trade policy and regulations
• Addressing trade-related adjustment costs
• Building productive capacity
• Trade development
Increased from US$20.6b in 2006 to US$32.1b in 2010
OECD and emerging companies contribute to AfT
Sub-Saharan Africa largest regional recipient
AfT help LICs and LDCs to reduce reliance on aid and...
...ensure trade delivers growth, jobs and structural
economic reformsSource: Basnett and Engel, 2013

Aid for trade – lessons learned
3rd review (2011) based on 270 cases identified need to
target:
• reducing costs of trading
• improving administrative procedures (such as border
clearing times, and times to register a new business or
obtain certificates of origin)
• binding constraints to growth (inc. infrastructure, skills,
transport and energy costs)
• blending financial instruments to address trade-related
constraints at transnational and regional levels
• More effective coordination between (and within) donors
and recipient country institutions at design,
implementation and monitoring of AfT initiatives Source: Basnett et al, 2012

Conclusions
• China successfully promoted domestic growth by combining state
intervention and private investment
• China has, more recently, successfully applied a similar model
during the evolution of the country’s OFDI in Africa
• History does matter particularly in terms of securing access to land
and resource extraction rights
• China’s trade in tropical timber is relatively small in the bigger
picture
• Much of what “everyone knows” about Chinese investment in Africa
is simply wrong (Brautigam, 2012)
• But need for caution given some evidence of continued illegality in
the forest sector
• Aid for Trade can help ensure trade delivers growth, jobs and
structural economic change, and more effectively leverage private
investments

Focus remains on wood supplies.....

...although significant trade in NTFPs (e.g. Cameroon)
613,600,000
378,641,309
12,197,503
8,089,580
4,040,000
2,874,928
2,799,330
1,574,661
989,504
847,182
730,325
585,586
430,639
284,013
269,083
249,938
244,420
171,175
124,489
94,803
61,105
31,500
18,000
11,868
5,911
78.9
1 10 100 1,000 10,000 100,000 1,000,000 10,000,000 100,000,000 1,000,000,000
Fish (catfish and other species)
Fuelwood (wood, charcoal and chips)
Gnetum africanum, Gnetum buchholzianum
Irvingia gabonensis, Irvingia wombulu
Acacia senegal, Acacia polyacantha
Prunus africana
Bushmeat
Raphia spp.
Dacryodes edulis
Pausinystalia johimbe
Ricinodendron heudelotii
Voacanga africana
Cola nitida
Ratan
Cola acuminata
Garcinia kola
Beekeeping: bee wax
Garcinia lucida
Tetrapleura tetraptera
Rauvolfia vomitoria
Beekeeping: honey
Cinchona spp.
Kigelia africana
Baillonella toxisperma
Carpolobia lutea, Carpolobia albea
Piper guineensis
$

New research initiatives
Emerging countries (Brazil, China, Malaysia and
Indonesia) in transition to a green economy: Will it make a
difference for forests and people in the Mekong, Sub-
Saharan Africa and Western Amazon regions?
Building enabling legal frameworks for low carbon
investment in sustainable land-use (IDLO-CIFOR, initially
focusing on Tanzania, Mozambique and Zambia)
Corporate governance in the oil palm and domestic timber
sectors
Evidence-based forestry

Initiated by CIFOR, CATIE, ICRAF, CIRAD, IUFRO
and University of Oxford
Broad collaboration anticipated
1. Determining priority policy-relevant questions
2. Systematic reviews to analyse evidence
Evidence-based forestry initiative
Initial tranche of systematic reviews as of 14 June 2013
1. Does production of oil palm, soybean and jatropha lead to the loss of biodiversity and ecosystem functions in tropics due to deforestation and fragmentation?
2. Environmental impacts of different property regimes.
3. Forests sustaining agriculture: the contribution of forest-based ecosystem services to agricultural production
4. Gender, Forests and Food security
5. Alternative livelihoods and biodiversity conservation for evidence-based policy
6. What are appropriate criteria and indicators for defining and measuring research quality in the realm of applied natural resources management?
7. What is the potential role of land use change dynamics in miombo woodlands in relation to REDD+?

Linking forestry and bigger-picture policies
Political
relevance
Positive
contributions
Not only
problems
Sustainable Development
“Big 5”

THANK YOU
References 1
Slide Reference
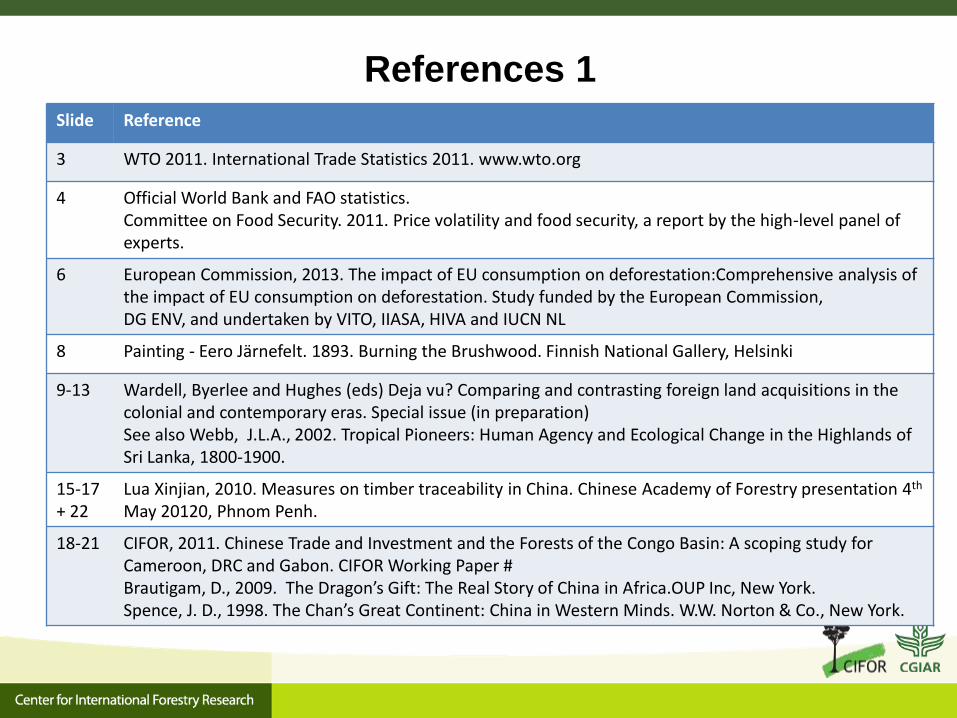
3 WTO 2011. International Trade Statistics 2011. www.wto.org
4 Official World Bank and FAO statistics.Committee on Food Security. 2011. Price volatility and food security, a report by the high-level panel of experts.
6 European Commission, 2013. The impact of EU consumption on deforestation:Comprehensive analysis ofthe impact of EU consumption on deforestation. Study funded by the European Commission,DG ENV, and undertaken by VITO, IIASA, HIVA and IUCN NL
8 Painting - Eero Järnefelt. 1893. Burning the Brushwood. Finnish National Gallery, Helsinki
9-13 Wardell, Byerlee and Hughes (eds) Deja vu? Comparing and contrasting foreign land acquisitions in the colonial and contemporary eras. Special issue (in preparation)See also Webb, J.L.A., 2002. Tropical Pioneers: Human Agency and Ecological Change in the Highlands of Sri Lanka, 1800-1900.
15-17 + 22
Lua Xinjian, 2010. Measures on timber traceability in China. Chinese Academy of Forestry presentation 4th
May 20120, Phnom Penh.
18-21 CIFOR, 2011. Chinese Trade and Investment and the Forests of the Congo Basin: A scoping study for Cameroon, DRC and Gabon. CIFOR Working Paper # Brautigam, D., 2009. The Dragon’s Gift: The Real Story of China in Africa.OUP Inc, New York. Spence, J. D., 1998. The Chan’s Great Continent: China in Western Minds. W.W. Norton & Co., New York.

References 2
Slide Reference
23-30 CIFOR Working Papers (2011)• Analysis of approvals for Chinese companies to invest in Africa’s mining, agricultural and forestry sectors• Analysis of China’s overseas investment policies• Chinese trade and investment and the forests of the Congo Basin• Chinese trade and investment and its impacts A scoping study in the miombo woodlands• Wenbin Huang, Andreas Wilkes, Ziafang Sen and Ann Terheggen, 2012 Who is importing forest products from Africa? Environment, Development and Sustainability DOI 10.1007/s10668-012-9413
31-35 Wardell, D.A. and Schoneveld, G., 2013. “Still trying to kill two birds with one stone?” 250 years of land acquisitions in Ghana. Paper presented at the 14th IASC, 4th June 2013, Fujiyoshida, Japan. Schoneveld, G., L. German and E. Nukator. 2011. Land-based investments for rural development? A grounded analysis of the local impacts of biofuel feedstock plantations in Ghana. Ecology and Society
36-37 Cali, M. and te Velde, D.W., 2011. Does Aid-for-Trade really improve trade performance? World Development 39 (5): 725-740Basnett, Y. and Engel, J., 2013. Focusing on what matters in Aid-for-Trade: Increasing effectiveness and delivering results. ODI Briefing Paper # 79; and Basnett, Y. et al, 2012. Increasing the effectiveness of Aid for Trade: the circumstances under which it works best. ODI Working Paper # 353.
38 Patey, L.A. and Large, D., 2012. Cooperating with China in Africa. DIS Policy Brief, Copenhagen.
39 Cerruti, P., 2013 (unpublished)
40 OFAC, State of the Forests 2010
42 CIFOR, 2013. Evidence-based forestry. www.cifro.org/ebf