elemental analysis of dtpa-extracted ... - agilent · cost-effective analysis: the mp-aes is ideal...
TRANSCRIPT
Agilent’s 4210 Microwave Plasma Atomic Emission Spectrometer (MP-AES)
IntroductionThe Agilent 4210 MP-AES is well suited to the analysis of agricultural samples, including soil analysis for the determination of micronutrients (Cu, Fe, Mn and Zn) following a DTPA extraction method.
Key benefits for micronutrient soil analysis Cost-effective analysis: The MP-AES is ideal for agricultural laboratories looking to reduce operating costs, as the instrument uses nitrogen gas from either a Dewar or the Agilent 4107 Nitrogen Generator for the plasma emission source, eliminating the ongoing supply of expensive gases.
Improved safety: Eliminates the need for flammable gases such as acetylene, enabling unattended analysis.
Excellent performance for difficult samples: The stable microwave plasma is capable of analyzing complex matrices such as DTPA soil extracts or soil digests containing elevated total dissolved solids (TDS).
Multi-elemental analysis: MP-AES provides improved analytical performance for multi-element methods, lower detection limits and wide calibration range compared to Flame Atomic Absorption Spectroscopy.
Easy-to-use: The intuitive MP Expert software and plug-and-play torch simplify instrument setup, and allow method development with minimal training required.
ELEMENTAL ANALYSIS OF DTPA-EXTRACTED MICRONUTRIENTS IN SOILS USING AN AGILENT 4210 MP-AESAPPLICATION OVERVIEW
This information is subject to change without notice.
© Agilent Technologies, Inc. 2017Published May 1, 2017
5991-7787EN
For more information: Contact your local Agilent
representative or visit: www.agilent.com/chem
Analysis exampleA dried and ground soil sample was prepared following a DTPA extraction method and analyzed for micronutrient analysis on the 4210 MP-AES, with results shown below:Table 1. Linear calibration range and correlation coefficients for Cu, Fe, Mn and Zn.
Element & wavelength (nm)
Concentration range
(µg/mL)
Calibration fit
Correlation coefficient
Cu 324.754 0.5-5 Linear 1.000Fe 259.940 10-100 Linear 0.999Mn 257.610 5-50 Linear 0.999Zn 213.857 0.5-5 Linear 0.999
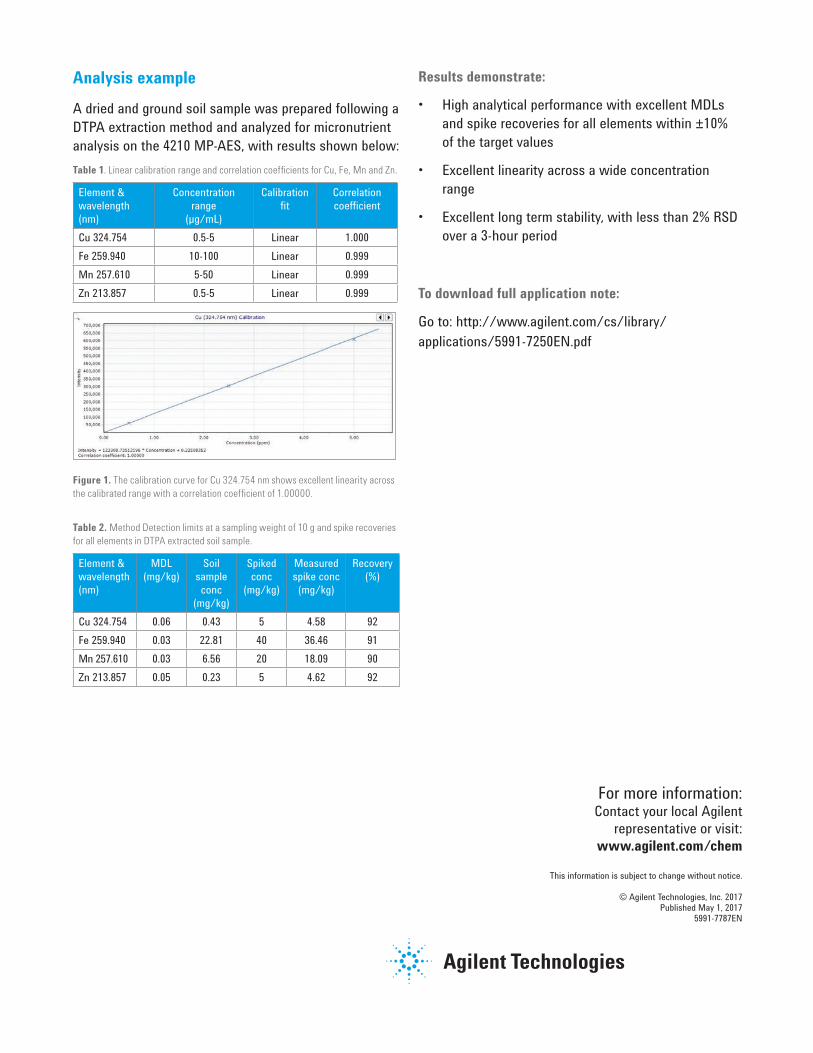
Figure 1. The calibration curve for Cu 324.754 nm shows excellent linearity across the calibrated range with a correlation coefficient of 1.00000.
Table 2. Method Detection limits at a sampling weight of 10 g and spike recoveries for all elements in DTPA extracted soil sample.
Element & wavelength (nm)
MDL (mg/kg)
Soil sample conc
(mg/kg)
Spiked conc
(mg/kg)
Measured spike conc (mg/kg)
Recovery (%)
Cu 324.754 0.06 0.43 5 4.58 92Fe 259.940 0.03 22.81 40 36.46 91Mn 257.610 0.03 6.56 20 18.09 90Zn 213.857 0.05 0.23 5 4.62 92
Results demonstrate:
• High analytical performance with excellent MDLs and spike recoveries for all elements within ±10% of the target values
• Excellent linearity across a wide concentration range
• Excellent long term stability, with less than 2% RSD over a 3-hour period
To download full application note:
Go to: http://www.agilent.com/cs/library/applications/5991-7250EN.pdf