electronic transitions and dielectric functions of...
TRANSCRIPT

Electronic transitions and dielectric functions of relaxor ferroelectric Pb(In1∕2Nb1∕2)O3-Pb(Mg1∕3Nb2∕3)O3-PbTiO3 single crystals: Temperature dependent spectroscopic studyJ. J. Zhu, J. Z. Zhang, G. S. Xu, X. L. Zhang, Z. G. Hu, and J. H. Chu Citation: Applied Physics Letters 104, 132903 (2014); doi: 10.1063/1.4870426 View online: http://dx.doi.org/10.1063/1.4870426 View Table of Contents: http://scitation.aip.org/content/aip/journal/apl/104/13?ver=pdfcov Published by the AIP Publishing Articles you may be interested in Broadband inelastic light scattering study on relaxor ferroelectric Pb(In1/2Nb1/2)-Pb(Mg1/3Nb2/3)O3-PbTiO3single crystals J. Appl. Phys. 115, 234103 (2014); 10.1063/1.4878855 Electrocaloric properties in relaxor ferroelectric (1−x)Pb(Mg1/3Nb2/3)O3–xPbTiO3 system J. Appl. Phys. 114, 174105 (2013); 10.1063/1.4829012 Temperature-dependent Raman scattering and multiple phase coexistence in relaxor ferroelectricPb(In1∕2Nb1∕2)O3-Pb(Mg1∕3Nb2∕3)O3-PbTiO3 single crystals J. Appl. Phys. 114, 153508 (2013); 10.1063/1.4825322 Temperature-dependent dielectric functions and interband critical points of relaxor lead hafnate-modifiedPbSc1/2Ta1/2O3 ferroelectric ceramics by spectroscopic ellipsometry Appl. Phys. Lett. 102, 151908 (2013); 10.1063/1.4802205 Phase transition behaviors in relaxor ferroelectric [001]-poled Pb(In1/2Nb1/2)O3-Pb(Mg1/3Nb2/3)O3-PbTiO3single crystals studied by Brillouin light scattering and dielectric spectroscopies J. Appl. Phys. 111, 054103 (2012); 10.1063/1.3692596
This article is copyrighted as indicated in the article. Reuse of AIP content is subject to the terms at: http://scitation.aip.org/termsconditions. Downloaded to IP:
222.66.117.15 On: Mon, 20 Oct 2014 07:51:03

Electronic transitions and dielectric functions of relaxor ferroelectricPb(In1=2Nb1=2)O3-Pb(Mg1=3Nb2=3)O3-PbTiO3 single crystals: Temperaturedependent spectroscopic study
J. J. Zhu (诸佳俊),1,2 J. Z. Zhang (张金中),1,2 G. S. Xu (许桂生),3 X. L. Zhang (张小龙),1
Z. G. Hu (胡志高),1,a) and J. H. Chu (褚君浩)1,21Key Laboratory of Polar Materials and Devices, Ministry of Education, Department of ElectronicEngineering, East China Normal University, Shanghai 200241, China2National Laboratory for Infrared Physics, Shanghai Institute of Technical Physics, Chinese Academyof Sciences, Shanghai 200083, China3R&D Center of Synthetic Crystals, Shanghai Institute of Ceramics, Chinese Academy of Sciences,Shanghai 201800, China
(Received 6 February 2014; accepted 23 March 2014; published online 1 April 2014)
Optical properties and phase transitions of Pb(In1=2Nb1=2)O3-Pb(Mg1=3Nb2=3)O3-PbTiO3 (PIN-PMN-PT)
crystals near morphotropic phase boundary (MPB) have been investigated by temperature dependent
transmittance and reflectance spectra. Three critical point energies Eg¼ 3.17–3.18eV, Ea¼ 3.41–3.61 eV,
and Eb¼ 4.74–4.81 eV can be assigned to the transitions from oxygen 2p to titanium d, niobium d, andlead 6p states, respectively. They show narrowing trends with increasing temperature, which can be
caused by thermal expansion of the lattice and electron-phonon interaction. Deviation from the linear
behaviors can be observed from Ea and Eb versus PT concentration, indicating a complex multiphase
structure near MPB region.VC 2014 AIP Publishing LLC. [http://dx.doi.org/10.1063/1.4870426]
Relaxor ferroelectrics with peculiar characteristics
of ferroelectricity and piezoelectricity can be used in the
fields for sensors, nonvolatile random access memories,
electro-optic modulators, pyroelectric detectors, and micro-
electromechanical systems.1–6 Ferroelectricity in lead (Pb)-
based relaxors with ABO3 perovskite structure is driven
mainly by the stereochemical activity of Pb. Nevertheless,
the B-site ions primarily affect morphotropic phase boundary
(MPB) and facile polarization rotation, providing the disor-
der and leading to relaxor ferroelectricity.2,3 Ionic size
effects, A-site-oxygen (O) and B-site-O hybridizations play
an important role in competing structural and polar instabil-
ities of perovskites, indicating the complexity of physical
mechanism.4 The solid solutions of PbMg1=3Nb2=3O3-
PbTiO3 (PMN-PT) crystallize in a complex ABO3 perovskite
structure, where B-site ions occupy the same crystallo-
graphic site in the structure with a complex energy distribu-
tion. It has a higher piezoelectric response than that of
conventional piezoelectric PbZrxTi1�xO3 (PZT) ceramics,
especially near the MPB region. Note that a transition occurs
from the rhombohedral (R) to tetragonal (T) phase when PT
concentration is close to 0.33.5 In spite of the recent progress
on the development of the PMN-PT crystals, they have a rel-
atively low coercive field (Ec¼ 2–3 kV/cm) and depoling
temperature (TR–T� 80–90 �C) due to a strongly curved
MPB.6 Moreover, large deviations of the refractive index
from a linear behavior were observed in PMN below the
Burns temperature due to the formation of static or slowly
moving polar nano-regions.7 This decreases the thermal sta-
bility of dielectric and piezoelectric properties and reduces
the operation temperature range of the devices, which
becomes a critical limitation for applications.
Fortunately, it was found that Pb(In1=2Nb1=2)O3-Pb
(Mg1=3Nb2=3)O3-PbTiO3 (PIN-PMN-PT) systems offer a
larger coercive field ðEc � 5 kV=cmÞ and higher degree of
structural instabilities ðTR�T � 135 �CÞ, while the piezoelec-tric performance is comparable to that of PMN-PT systems.
Moreover, temperature dependence of dielectric and piezo-
electric properties is more stable, which makes PIN-PMN-
PT ternary systems the most promising materials for future
device applications. Recently, we reported bandgap narrow-
ing and widening trends with increasing temperature for
PIN-PMN-PT crystals near MPB below room temperature
(RT).8 However, the dielectric functions and electronic band
structures at high temperatures have not been fully clarified.
Generally, transmittance spectra can provide optical bandgap
(OBG), dielectric functions, absorption characteristics, and
band tail state behavior by comparing the reasonable disper-
sion model to experimental spectra. Similarly, spectral re-
flectance technique can be used to investigate the electronic
band energy above the OBG, which cannot be detected
by transmittance technique due to the strong absorption
(Fig. 1).9–11 The reliability of the inverse synthesis method
mainly depends on the validity of the optical model and the
fitting statistics. Therefore, one can take advantages of solid
state spectroscopy to further study the promising ternary sys-
tem. In the Letter, we estimated the interband critical point
energies of PIN-PMN-PT crystals by combining spectral
transmittance with reflectance located in the ultraviolet
energy range. Effects from temperature and PT concentration
on electronic band structure have been discussed in detail.
PIN-PMN-PT single crystals were grown using a verti-
cal Bridgman technique.12 The samples were cut perpendicu-
lar to the h001i direction. The nominal concentration of
xPIN-(1�x�y)PMN-yPT crystals was x� 0.27–0.28 and
y� 0.29–0.35. All PIN-PMN-PT crystals were double-side
polished with a mechanical polishing process to smooth the
a)Author to whom correspondence should be addressed. Electronic mail:
[email protected]. Tel.: þ86-21-54345150. Fax: þ86-21-54345119.
0003-6951/2014/104(13)/132903/5/$30.00 VC 2014 AIP Publishing LLC104, 132903-1
APPLIED PHYSICS LETTERS 104, 132903 (2014)
This article is copyrighted as indicated in the article. Reuse of AIP content is subject to the terms at: http://scitation.aip.org/termsconditions. Downloaded to IP:
222.66.117.15 On: Mon, 20 Oct 2014 07:51:03

surface. Then the crystals were rigorously cleaned in pure
ethanol with an ultrasonic bath and rinsed several times by
deionized water for spectral measurements. The surface
morphology of the crystals was examined by atomic force
microscopy (AFM: Digital Instruments Icon, Bruker).
The normal-incident transmittance spectra and near-normal
incident (about 8�) reflectance spectra were measured by
a double beam ultraviolet-infrared spectrophotometer
(PerkinElmer UV/VIS Lambda 950) at the wavelength range
of 2650–190 nm (0.5–6.5 eV) with a spectral resolution of
2 nm. The samples were mounted on a heating stage (Bruker
A511), which can be varied from RT to 453K with a step of
61K.
Figs. 1(a) and 1(b) show reflectance and transmittance
spectra of PIN-PMN-0.29PT single crystal from near infra-
red to ultraviolet regions at different temperatures, respec-
tively. With increasing photon energy, the transmission
decreases quickly and falls down to zero at about 3.18 eV,
indicating an optical absorption edge. This process excites
an electron from the filled valence band to an elevated state
of the conduction band. The primary contribution of optical
loss is from the bandgap and domain wall scattering, which
becomes increasingly crucial for photon energies near the
bandgap. Lattice dynamical theories indicate that optical
properties as well as static dielectric behavior are mainly
determined by the BO6 octahedra because the B-site cation dorbits and the O-anion 2 p orbits associated with each octa-
hedron contribute to the lower conduction bands and the
upper valence bands.13 Electronic band structures of ABO3
perovskite are closely relative to the BO6 octahedron and
sensitive to the B-site atom concentration. The B-site ion
plays more important role in the refined energy level as com-
pared to the A-site. For PIN-PMN-PT crystals, Mg2þ,Nb5þ, In3þ, Ti4þ ions occupy the octahedral B site disorder-
edly, giving rise to the disorder and the random fields. The
substitution of Ti4þ for the complex (In1=2Nb1=2)4þ and
(Mg1=3Nb2=3)4þ ions prefers the development of macro-polar
domains from nanopolar regions inherently present in relax-
ors. The nanoregions, domain structure, and order/disorder
state of the B-site cation structure have strong effects on the
dielectric functions of the crystal.
The main spectral features in Figs. 1(a) and 1(b) are cen-
tered at 3.186 0.02, 3.626 0.07, and 4.756 0.02 eV, which
are labeled as Eg, Ea, and Eb, respectively. These features
have been also reported in ferroelectrics PbTiO3 PT, PbZrO3
(PZ), PZT, (1� x)Pb(Sc1=2Ta1=2)O3-xPbHfO3 (PSTH), and
Pb(ZrSnTi)O3 (PZST).14–17 The structures shift to a lower
energy side and become broader with increasing tempera-
ture. According to the experimental data as well as local den-
sity approximation electronic band structure calculations, the
critical point energies for PT at 3.78, 4.00, and 4.93 eV are
attributed to X50v � X3c transition, X40v � X3c transition, and
X50v � X1c transition, respectively.16,17 An anticrossing of
critical point energies for PZT occurred, which is due to the
coupling between X1c and X3c bands, arising from intrinsic
alloy disorder. The potential fluctuation caused by alloy dis-
order induces a coupling between the degenerate bands.16
Figs. 1(c)–1(f) show reflectance spectra of PIN-PMN-PT
crystals at 303K and 453K, respectively. Two obvious peak
positions Ea and Eb are located at 3.62 eV and 4.75 eV for
PIN-PMN-0.29PT crystal, which are consistent with the fit-
ted peak position energies Ep1 (3.616 0.07 eV) and Ep2
(4.746 0.02 eV), as shown in Table I.
Fig. 2(a) shows that the most obvious temperature effect
on the transmittance spectra is from the visible region, which
is close to the onset of electronic density of states (DOS) at
the conduction band. The first principle study reveals that the
conduction bands of PMN are primarily from niobium (Nb)
4d near the bandgap and become Pb 6p at about 5 eV,18 cor-
responding to the critical point Eb (4.746 0.02 eV) in the
present PIN-PMN-PT system. The electronic DOS at the
conduction band edge comes primarily from Nd d states in
addition to Pb p and magnesium (Mg)/indium (In) d states.
Noticeable Pb p character is distributed through the O pbands while Mg/In d character in the valence bands is not
obvious. Considerable Nb d character is concentrated at the
FIG. 1. (a) Reflectance and (b) transmittance spectra of PIN-PMN-0.29PT
crystal at the temperatures of 303K, 373K, and 453K, respectively. The
experimental (dots) and calculated (solid lines) reflectance spectra of (c)
PIN-PMN-0.29PT, (d) PIN-PMN-0.31PT, (e) PIN-PMN-0.33PT, and (f)
PIN-PMN-0.35PT crystals at 303K and 453K, respectively. The arrows
indicate the corresponding interband transitions.
TABLE I. Parameter values of the double Tauc-Lorentz dispersion model for the PIN-PMN-PT crystals are obtained by simulating the near-infrared-ultravio-
let reflectance spectra at 303K (Fig. 1). Note that the unit is eV except for the high-frequency dielectric constant e1, which is dimensionless. The 90% reliabil-
ity of the fitting parameters is given in parentheses.
TL1 TL2
xPT e1 A1 Ep1 C1 Et1 A2 Ep2 C2 Et2
0.29 3.64 (0.03) 120 (35) 3.61 (0.07) 0.89 (0.07) 3.39 (0.03) 139 (7) 4.74 (0.02) 1.91 (0.05) 3.49 (0.04)
0.31 4.22 (0.04) 149 (117) 3.45 (0.21) 0.73 (0.22) 3.45 (0.15) 81 (12) 4.79 (0.04) 1.95 (0.07) 3.28 (0.07)
0.33 3.99 (0.04) 150 (99) 3.46 (0.17) 0.73 (0.17) 3.46 (0.22) 89 (10) 4.81 (0.03) 2.02 (0.05) 3.26 (0.06)
0.35 4.07 (0.08) 154 (142) 3.41 (0.30) 0.86 (0.28) 3.41 (0.25) 91 (21) 4.74 (0.05) 1.93 (0.09) 3.32 (0.11)
132903-2 Zhu et al. Appl. Phys. Lett. 104, 132903 (2014)
This article is copyrighted as indicated in the article. Reuse of AIP content is subject to the terms at: http://scitation.aip.org/termsconditions. Downloaded to IP:
222.66.117.15 On: Mon, 20 Oct 2014 07:51:03
bottom of the O p bands, reflecting the main crystal field
splitting of the O 2p bands into pr (one per O) and pp (two
per O) because of hybridization with Nb. The primary Nb-O
hybridization is eg � pr and Pb p-O p hybridization is not
the strongest interaction for the purpose of the O crystal
field.18 The lower valence band for PT consists of two orbi-
tals: one is the Pb 5d orbital on the high energy side and the
other is the O 2s orbital on the low energy. The upper va-
lence band of simple perovskite-type oxides ABO3 consists
of the O 2p orbital mixed with the d valence electrons of the
B atom.19 The conduction band consists of the t2g and egbands of Ti 3d orbital, above which is the Pb 6p band. It was
reported that the shape of the upper valence band for several
Pb-based perovskite-type oxides ABO3 only changes slightly
despite B site substitution while those of the conduction
band are remarkably modified by the variation of the B
atom.19 Compared with the electronic structure of PMN, PT,
PSTH, and PZST, it is concluded that Eg, Ea, Eb are attrib-
uted to transitions from the top of the valance band O 2p to
the bottom of the conduction band Ti d, Nb d, Pb p,respectively.
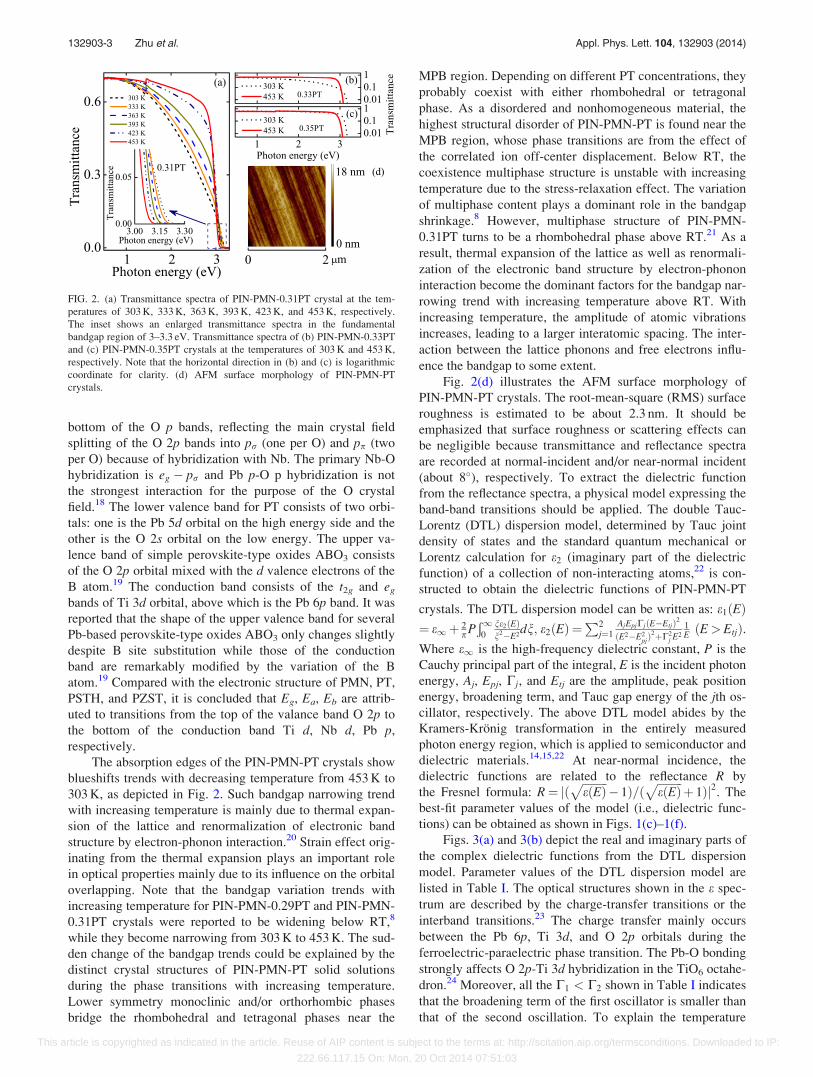
The absorption edges of the PIN-PMN-PT crystals show
blueshifts trends with decreasing temperature from 453K to
303K, as depicted in Fig. 2. Such bandgap narrowing trend
with increasing temperature is mainly due to thermal expan-
sion of the lattice and renormalization of electronic band
structure by electron-phonon interaction.20 Strain effect orig-
inating from the thermal expansion plays an important role
in optical properties mainly due to its influence on the orbital
overlapping. Note that the bandgap variation trends with
increasing temperature for PIN-PMN-0.29PT and PIN-PMN-
0.31PT crystals were reported to be widening below RT,8
while they become narrowing from 303K to 453K. The sud-
den change of the bandgap trends could be explained by the
distinct crystal structures of PIN-PMN-PT solid solutions
during the phase transitions with increasing temperature.
Lower symmetry monoclinic and/or orthorhombic phases
bridge the rhombohedral and tetragonal phases near the
MPB region. Depending on different PT concentrations, they
probably coexist with either rhombohedral or tetragonal
phase. As a disordered and nonhomogeneous material, the
highest structural disorder of PIN-PMN-PT is found near the
MPB region, whose phase transitions are from the effect of
the correlated ion off-center displacement. Below RT, the
coexistence multiphase structure is unstable with increasing
temperature due to the stress-relaxation effect. The variation
of multiphase content plays a dominant role in the bandgap
shrinkage.8 However, multiphase structure of PIN-PMN-
0.31PT turns to be a rhombohedral phase above RT.21 As a
result, thermal expansion of the lattice as well as renormali-
zation of the electronic band structure by electron-phonon
interaction become the dominant factors for the bandgap nar-
rowing trend with increasing temperature above RT. With
increasing temperature, the amplitude of atomic vibrations
increases, leading to a larger interatomic spacing. The inter-
action between the lattice phonons and free electrons influ-
ence the bandgap to some extent.
Fig. 2(d) illustrates the AFM surface morphology of
PIN-PMN-PT crystals. The root-mean-square (RMS) surface
roughness is estimated to be about 2.3 nm. It should be
emphasized that surface roughness or scattering effects can
be negligible because transmittance and reflectance spectra
are recorded at normal-incident and/or near-normal incident
(about 8�), respectively. To extract the dielectric function
from the reflectance spectra, a physical model expressing the
band-band transitions should be applied. The double Tauc-
Lorentz (DTL) dispersion model, determined by Tauc joint
density of states and the standard quantum mechanical or
Lorentz calculation for e2 (imaginary part of the dielectric
function) of a collection of non-interacting atoms,22 is con-
structed to obtain the dielectric functions of PIN-PMN-PT
crystals. The DTL dispersion model can be written as: e1ðEÞ¼ e1þ 2
pPÐ10
ne2ðEÞn2�E2
dn; e2ðEÞ ¼P2
j¼1AjEpjCjðE�EtjÞ2ðE2�E2
pjÞ2þC2j E
2
1E ðE> EtjÞ.
Where e1 is the high-frequency dielectric constant, P is the
Cauchy principal part of the integral, E is the incident photon
energy, Aj, Epj, Cj, and Etj are the amplitude, peak position
energy, broadening term, and Tauc gap energy of the jth os-
cillator, respectively. The above DTL model abides by the
Kramers-Kronig transformation in the entirely measured
photon energy region, which is applied to semiconductor and
dielectric materials.14,15,22 At near-normal incidence, the
dielectric functions are related to the reflectance R by
the Fresnel formula: R¼ jð ffiffiffiffiffiffiffiffiffieðEÞp � 1Þ=ð ffiffiffiffiffiffiffiffiffi
eðEÞp þ 1Þj2. Thebest-fit parameter values of the model (i.e., dielectric func-
tions) can be obtained as shown in Figs. 1(c)–1(f).
Figs. 3(a) and 3(b) depict the real and imaginary parts of
the complex dielectric functions from the DTL dispersion
model. Parameter values of the DTL dispersion model are
listed in Table I. The optical structures shown in the e spec-trum are described by the charge-transfer transitions or the
interband transitions.23 The charge transfer mainly occurs
between the Pb 6p, Ti 3d, and O 2p orbitals during the
ferroelectric-paraelectric phase transition. The Pb-O bonding
strongly affects O 2p-Ti 3d hybridization in the TiO6 octahe-
dron.24 Moreover, all the C1 < C2 shown in Table I indicates
that the broadening term of the first oscillator is smaller than
that of the second oscillation. To explain the temperature
FIG. 2. (a) Transmittance spectra of PIN-PMN-0.31PT crystal at the tem-
peratures of 303K, 333K, 363K, 393K, 423K, and 453K, respectively.
The inset shows an enlarged transmittance spectra in the fundamental
bandgap region of 3–3.3 eV. Transmittance spectra of (b) PIN-PMN-0.33PT
and (c) PIN-PMN-0.35PT crystals at the temperatures of 303K and 453K,
respectively. Note that the horizontal direction in (b) and (c) is logarithmic
coordinate for clarity. (d) AFM surface morphology of PIN-PMN-PT
crystals.
132903-3 Zhu et al. Appl. Phys. Lett. 104, 132903 (2014)
This article is copyrighted as indicated in the article. Reuse of AIP content is subject to the terms at: http://scitation.aip.org/termsconditions. Downloaded to IP:
222.66.117.15 On: Mon, 20 Oct 2014 07:51:03

dependent behavior, the OBG energies for PIN-PMN-PT
crystals are calculated by considering a direct transition
between the valance and conduction bands. Direct transition
is a first-order process because no phonon is involved. The
absorption coefficient a as a function of photon energy is
expressed by the Tauc relation: ahv / ðhv� EgÞ1=2, where vis the frequency, h is the Planck constant, and Eg is the
allowed direct OBG energy. Therefore, the straight line
between ðahvÞ2 and hv will provide the OBG value, which is
extrapolated by the linear portion of the plot to ðahvÞ2 ¼ 0,
as shown in Figs. 3(c)–3(f). At 303K, the direct bandgap Eg
of PIN-PMN-0.29PT, PIN-PMN-0.31PT, PIN-PMN-0.33PT,
and PIN-PMN-0.35PT crystals are 3.186 0.02, 3.186 0.02,
3.176 0.02, and 3.176 0.02 eV, showing a redshift trend
with increasing PT concentration. Similar phenomena are also
reported in relaxor PbZn1=3Nb2=3O3-PbTiO3 (PZN-PT).25 The
basic energy levels are determined by the common (B1B2)O6
oxygen octahedral structure in A(B1B2)O3-ype perovskite fer-
roelectrics. Thus, similar optical absorption edges with slight
differences are found in PIN-PMN-PT and PZN-PT crystals
due to different B-site cations and concentration. Temperature
dependence of the critical point energies is displayed in
Fig. 4. An empirical formula for the bandgap energy of the
relaxor ferroelectric PIN-PMN-PT single crystals versus the
temperature (T) and PT concentration (x) can be found as
Egðx; TÞ ¼ 1:324þ 0:204x� 0:065x2 þ 6:77� 10�5x3
� 8:60� 10�4T þ 3:41� 10�6xT; (1)
where 0:29 � x � 0:35 and 303K � T � 453K in the pres-
ent experiment. The fitting lines are well consist with the ex-
perimental value, as shown in Figs. 4(c)–4(f).
Deviation from the linear behaviors of critical point
energies Ea and Eb as a function of PT concentration is
observed from Figs. 4(a) and 4(b) with different structures
labeled. Note that the structures of the present PIN-PMN-PT
crystals are different according to the x-ray diffraction.8,21
Such deviation from the linear behavior indicates an effect
of phase transitions on the critical point energies. The ABO3
perovskite structure is a three-dimensional network of regu-
lar corner-linked BO6, octahedra with B cations at the center
of each octahedron and A cations being centrally located in
the AO12 cuboctahedral cavity formed by eight octahedra.
The tetragonal and rhombohedral phases might coexist and
various low-symmetry phases have been postulated in the
MPB region, indicating a complicated chemical structure of
PMN-PT based solid solutions.26 Synchrotron x-ray powder
diffraction measurements reveal that the orthorhombic or
monoclinic phase of MC type with space group Pm coexist
with either rhombohedral or tetragonal phase in the MPB
and their volume fractions changes with increasing tempera-
ture.27 Temperature dependent dielectric constant, piezoelec-
tric resonance frequency and powder neutron diffraction
studies suggest a MB type with space group Cm existing in
PT poor region of MPB. The short range MB type monoclinic
order at RT can grow to long range monoclinic order on low-
ering the temperature.28 Moreover, three intermediate phases
including one orthorhombic phase and two monoclinic
phases are proposed to separate the tetragonal and rhombo-
hedral phase.29 Such low symmetry phases were even
observed in a wide PT concentration range of 0.3–0.47.30
The phase transition between two monoclinic phases is of
first order and shows a large thermal hysteresis.31 A similar
competing mechanism between rhombohedral and mono-
clinic order is reported in PZT crystal near MPB region as
well.32 The complex MPB states of the PMN-PT/PIN-PMN-
PT systems point to an energy balance between different
phases, which is much more delicate than that of PZT based
system.
In conclusion, we have investigated optical properties
and electronic band structures of (001)-face PMN-PT single
crystals around MPB region by transmittance and reflectance
spectra from 303 to 453K. Three typical interband transi-
tions and dielectric functions are correlated with structural
changes from rhombohedral to tetragonal phase. Deviation
from the linear behaviors of critical point energies Ea and Eb
FIG. 3. (a) and (b) Dielectric functions ðe ¼ e1 þ ie2Þ of PIN-PMN-PT crystals
at 303K. The arrows indicate the assignments of electronic band transitions.
The variations of ðahvÞ2 with the photon energy for the (c) PIN-PMN-0.29PT,
(d) PIN-PMN-0.31PT, (e) PIN-PMN-0.33PT, and (f) PIN-PMN-0.35PT crystals
measured at 303 and 453K, respectively.
FIG. 4. The critical point energies (a) Ea and (b) Eb as a function of the PT
concentration for the PIN-PMN-PT crystals. A representative error bar is
shown. Note that the shade parts approximately correspond to the MPB
region. Temperature dependence of the critical point energies for (c) PIN-
PMN-0.29PT, (d) PIN-PMN-0.31PT, (e) PIN-PMN-0.33PT, and (f) PIN-
PMN-0.35PT crystals, respectively. Note that the dotted and solid lines in
(c)–(f) indicate the experimental determination and fitting data by the empir-
ical formula, respectively.
132903-4 Zhu et al. Appl. Phys. Lett. 104, 132903 (2014)
This article is copyrighted as indicated in the article. Reuse of AIP content is subject to the terms at: http://scitation.aip.org/termsconditions. Downloaded to IP:
222.66.117.15 On: Mon, 20 Oct 2014 07:51:03
versus PT concentration can be observed, indicating that the
variation of electronic band structures are closely related to
the phase transitions.
This work was financially supported by Major State Basic
Research Development Program of China (Grant Nos.
2011CB922200 and 2013CB922300), Natural Science
Foundation of China (Grant Nos. 11374097 and 61376129),
Projects of Science and Technology Commission of Shanghai
Municipality (Grant Nos. 13JC1402100 and 13JC1404200),
and the Program for Professor of Special Appointment (Eastern
Scholar) at Shanghai Institutions of Higher Learning.
1L. E. Cross, Ferroelectrics 76, 241 (1987).2H. Fu and R. E. Cohen, Nature (London) 403, 281 (2000).3H. You and Q. M. Zhang, Phys. Rev. Lett. 79, 3950 (1997).4W. Zhong and D. Vanderbilt, Phys. Rev. Lett. 74, 2587 (1995).5S. E. Park and T. R. Shrout, J. Appl. Phys. 82, 1804 (1997).6Z. G. Ye, MRS Bull. 34, 277 (2009).7G. Burns and B. A. Scott, Solid State Commun. 13, 423 (1973).8J. J. Zhu, W. W. Li, G. S. Xu, K. Jiang, Z. G. Hu, and J. H. Chu, Acta
Mater. 59, 6684 (2011).9K. Y. Chan, W. S. Tang, C. L. Mak, and K. H. Wong, Phys. Rev. B 69,144111 (2004).
10X. L. Zhang, Z. G. Hu, G. S. Xu, J. J. Zhu, Y. W. Li, Z. Q. Zhu, and J. H.
Chu, Appl. Phys. Lett. 103, 051902 (2013).11J. J. Zhu, W. W. Li, G. S. Xu, K. Jiang, Z. G. Hu, M. Zhu, and J. H. Chu,
Appl. Phys. Lett. 98, 091913 (2011).12G. S. Xu, K. Chen, D. F. Yang, and J. B. Li, Appl. Phys. Lett. 90, 032901(2007).
13M. DiDomenico, Jr. and S. H. Wemple, J. Appl. Phys. 40, 720 (1969).
14W. J. Zhang, Z. H. Duan, K. Jiang, Z. G. Hu, G. S. Wang, X. L. Dong, and
J. H. Chu, Acta Mater. 60, 6175 (2012).15X. Chen, K. Jiang, Z. G. Hu, X. F. Chen, G. S. Wang, X. L. Dong, and J.
H. Chu, Appl. Phys. Lett. 101, 011914 (2012).16T. D. Kang, H. Lee, G. Xing, N. Izumskaya, V. Avrutin, B. Xiao, and H.
Morkoc, Appl. Phys. Lett. 91, 022918 (2007).17J. Robertsonk, W. L. Warren, and B. A. Tuttle, J. Appl. Phys. 77, 3975(1995).
18M. Suewattana and D. J. Singh, Phys. Rev. B 73, 224105 (2006).19M. Kitamura and H. Chen, Ferroelectrics 210, 13 (1998).20H. Y. Fan, Phys. Rev. 82, 900 (1951).21J. J. Zhu, K. Jiang, G. S. Xu, Z. G. Hu, Y. W. Li, Z. Q. Zhu, and J. H. Chu,
J. Appl. Phys. 114, 153508 (2013).22G. E. Jellison, Jr. and F. A. Modine, Appl. Phys. Lett. 69, 371 (1996); 69,2137 (1996).
23S. G. Choi, H. T. Yi, S. W. Cheong, J. N. Hifiker, R. France, and A. G.
Norman, Phys. Rev. B 83, 100101(R) (2011).24J. C. Jan, H. M. Tsai, C. W. Pao, J. W. Chiou, K. Asokan, K. P. K. Kumar,
W. F. Pong, Y. H. Tang, M. H. Tsai, S. Y. Kuo, and W. F. Hsieh, Appl.
Phys. Lett. 87, 012103 (2005).25E. Sun, R. Zhang, Z. Wang, D. Xu, L. Li, and W. Cao, J. Appl. Phys. 107,113532 (2010).
26R. A. Cowley, S. N. Gvasaliya, S. G. Lushnikov, B. Roessli, and G. M.
Rotaru, Adv. Phys. 60, 229 (2011).27B. Noheda, D. E. Cox, G. Shirane, J. Gao, and Z. G. Ye, Phys. Rev. B 66,054104 (2002).
28A. K. Singh, D. Pandey, and O. Zaharko, Phys. Rev. B 74, 024101
(2006).29Z. Kutnjak, J. Petzelt, and R. Blinc, Nature 441, 956 (2006).30V. A. Shuvaeva, A. M. Glazer, and D. Zekria, J. Phys.: Condens. Matter
17, 5709 (2005).31D. Zekria, V. A. Shuvaeva, and A. M. Glazer, J. Phys.: Condens. Matter
17, 1593 (2005).32D. Phelan, X. Long, Y. Xie, Z. G. Ye, A. M. Glazer, H. Yokota, P. A.
Thomas, and P. M. Gehring, Phys. Rev. Lett. 105, 207601 (2010).
132903-5 Zhu et al. Appl. Phys. Lett. 104, 132903 (2014)
This article is copyrighted as indicated in the article. Reuse of AIP content is subject to the terms at: http://scitation.aip.org/termsconditions. Downloaded to IP:
222.66.117.15 On: Mon, 20 Oct 2014 07:51:03