electronic supporting information · electronic supporting information a two-photon fluorescent...
TRANSCRIPT
Electronic Supporting Information
A two-photon fluorescent probe for ratiometric imaging of endogenous
hypochlorous acid in live cells and tissues
Yong Woong Jun,‡a Sourav Sarkar,‡
a Subhankar Singha,*
a Ye Jin Reo,
a Hye Rim Kim,
a Jong-
Jin Kim,b Young-Tae Chang*
ab and Kyo Han Ahn*
a
aDepartment of Chemistry, Pohang University of Science and Technology, 77 Cheongam-Ro, Nam-Gu,
Pohang, Gyungbuk 37673, Republic of Korea
bLaboratory of Bioimaging Probe Development, Singapore Bioimaging Consortium, Agency for
Science, Technology and Research (A*STAR), Biopolis 138667, Singapore
*Corresponding authors. E-mail address: [email protected]; [email protected];
‡ These authors contributed equally to this work and are considered co-first authors.
Contents
1. General information on materials and methods
2. Fluorescence assays with the probe rTP-HOCl 1
3. Preparation of cell samples and their two-photon imaging
4. Preparation of mouse brain tissue samples and their TPM imaging
5. Synthesis of the probe rTP-HOCl 1
6. Supporting figures (including HPLC analysis, cell viability assay)
7. Supporting tables (including two-photon photophysical properties of probe and
product)
8. NMR (1H &
13C) spectra
Electronic Supplementary Material (ESI) for Chemical Communications.This journal is © The Royal Society of Chemistry 2017
1. General information on materials and methods
Unless otherwise noted, the chemical reagents were purchased from Sigma-Aldrich or Alfa-
Aesar and used as received. LysoTracker® Deep Red was purchased from Invitrogen. All
solvents were purified and dried by standard methods prior to use. Deionized water was used
to prepare all aqueous solutions. 1H and
13C NMR spectra were recorded on a Bruker 500
MHz spectrometer using tetramethylsilane as the internal reference. All chemical shifts are
reported in the standard notation of parts per million (ppm) using residual solvent protons as
the internal standard. Mass spectroscopic data were obtained from the Korea Basic Science
Institute (Daegu) with a JEOL JMS 700 high resolution mass spectrometer.
2. Fluorescence assays with the probe rTP-HOCl 1
All of the solvents used were of analytical grade. NaOCl solution was used as source of
HOCl (pKa = 7.46). A stock solution of NaOCl (300−600 µM) was prepared by dilution of
commercial NaOCl solution (Aldrich) in 0.1 M NaOH solution. The concentration of NaOCl
solution was determined from the absorption at 292 nm (ε = 350 M-1
cm-1
) in 0.1 M NaOH
solution. Finally, the required volumes of NaOCl stock solution were gradually added to the
probe solutions in cuvette to make the desired concentrations of HOCl. Stock solutions of the
probe rTP-HOCl 1 (1.0 mM) were made by dissolving the probe in dimethylsulfoxide
(DMSO). Stock solution of the probes (15 µL) was added to 3 mL of PBS buffer (pH 7.4)
solution to make the final probes concentration of 5 µM. UV−vis absorption spectra were
obtained using an UV−vis spectrophotometer (HP 8453). Fluorescence spectra were recorded
on a fluorimeter (Photon Technology International) with a 10 mm cuvette. The excitation and
emission wavelength band paths were both set at 2 nm.
3. Preparation of cell samples and their two-photon imaging
HeLa cells were obtained from Korean Cell Line Bank. The cells were incubated in DMEM
supplemented with 10% (v/v) fetal bovine serum (FBS) and 1% (v/v) penicillin-streptomycin
(PS) at 37 °C in a humidified atmosphere of 5% of CO2 in the air. Cells were passaged when
they reached approximately 80% confluence. Cells were seeded onto a cell culture dish at a
density of 1.0 × 10⁵ cells, which was incubated at 37
°C overnight under 5% CO2 in the air.
For imaging experiments, cells were incubated in three conditions: For the detection of
endogenous HOCl, cells were incubated in DMEM containing the probe rTP-HOCl 1 (10
μM) for 10 min and washed with PBS (phosphate buffered saline) three times to remove the
remaining probe. In the negative control experiment with N-acetylcysteine (NAC), cells were
co-incubated in DMEM containing the probe (10 μM) and NAC (1 mM or 0.5 mM) for 10
min and washed with PBS (phosphate buffered saline) three times to remove the remaining
probe. In the positive control experiment with an exogenous HOCl source, the cells were co-
incubated in DMEM containing the probe (10 μM) and HOCl (5 µM or 10 µM) for 10 min
and washed with PBS (phosphate buffered saline) three times to remove the remaining probe.
Fluorescence images of the cell samples were recorded by two-photon microscopy (TPM).
TPM imaging was performed using a Ti-Sapphire laser (Chameleon Vision II, Coherent) at
140 fs pulse width and 80 MHz pulse repetition rate (TCS SP5 II, Leica, Germany) through a
40× objective lens (obj. HCX PL APO 40×/ 1.10 W CORR CS, 506341, Leica, Germany).
The two-photon excitation wavelength for the probe was tuned to 900 nm. Each emission
light was spectrally resolved into two channels (λem, Green = 415–520 nm, λem, Red = 540–665
nm). The cell samples prepared as above were mounted on a tight-fitting holder. The
excitation laser power was approximately 9.3 mW. The images were consisted of 1024 ×
1024 pixels, and the scanning speed was maintained as 100 MHz during the entire imaging.
Acquired images were processed using LAS AF Lite (Leica, Germany), and all the images
were converted into the corresponding pixel-to-pixel ratiometric images based on the
intensity ratio of IRed/IGreen.
4. Preparation of mouse brain tissue samples and their TPM imaging
The experimental procedures regarding mouse tissues herein were performed in accordance
with protocols approved by the Pohang University of Science and Technology Committee on
Animal Research and followed the guidelines for the use of experimental animals established
by The Korean Academy of Medical Science. We made every effort to minimize animal
suffering and reduce the number of animals used to prepare samples for imaging.
Balb/C type mice (6 weeks) were used for this experiment. Basically experiment was done
under light protected conditions (in a dark-room and using aluminum foil). The mouse was
dissected after dislocation of the cervical vertebra. The mouse brain was dissected within 2
min and sliced to the thicknesses of 300 µm under PBS buffer solution by using Vibratome
(Leica vt1000s model). The tissues were incubated with the probe rTP-HOCl 1 (10 µM; 30
min) only or probe followed by HOCl (10 µM; 30 min) treatment and washed three times
with PBS buffer. The prepared tissue samples were mounted on the microscope slides by
using buffer solution and subjected to two-photon microscopic imaging.
Fluorescence images of the tissue samples were recorded by two-photon microscopy (TPM).
TPM imaging was performed using a Ti-Sapphire laser (Chameleon Vision II, Coherent) at
140 fs pulse width and 80 MHz pulse repetition rate (TCS SP5 II, Leica, Germany) and a 40×
objective lens (obj. HCX PL APO 40×/ 1.10 W CORR CS, 506341, Leica, Germany). The
two-photon excitation wavelength was tuned to 900 nm for the probe. Each emission light
was spectrally resolved into two channels (λem, Green = 415–520 nm, λem, Red = 540–665 nm).
The tissue samples prepared as above were mounted on a tight-fitting holder. The excitation
laser power was approximately 9.3 mW. The images were consisted of 1024 × 1024 pixels,
and the scanning speed was maintained as 100 MHz during the entire imaging. Acquired
images were processed by using LAS AF Lite (Leica, Germany).
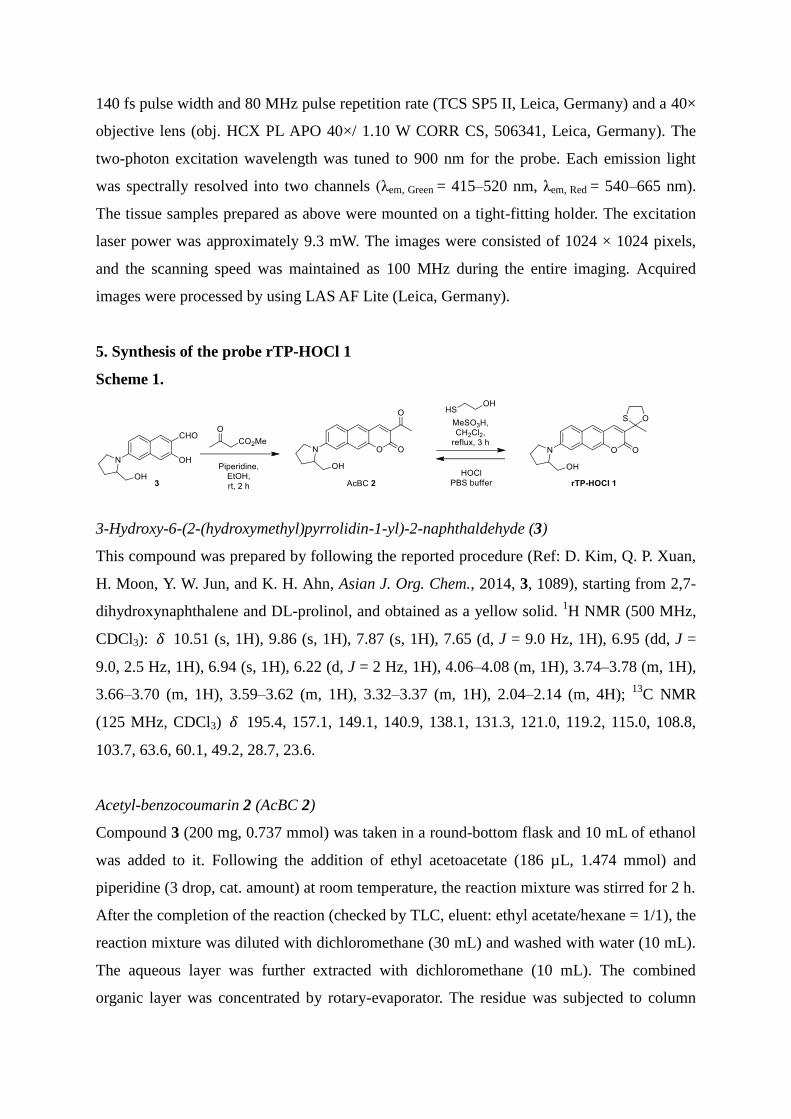
5. Synthesis of the probe rTP-HOCl 1
Scheme 1.
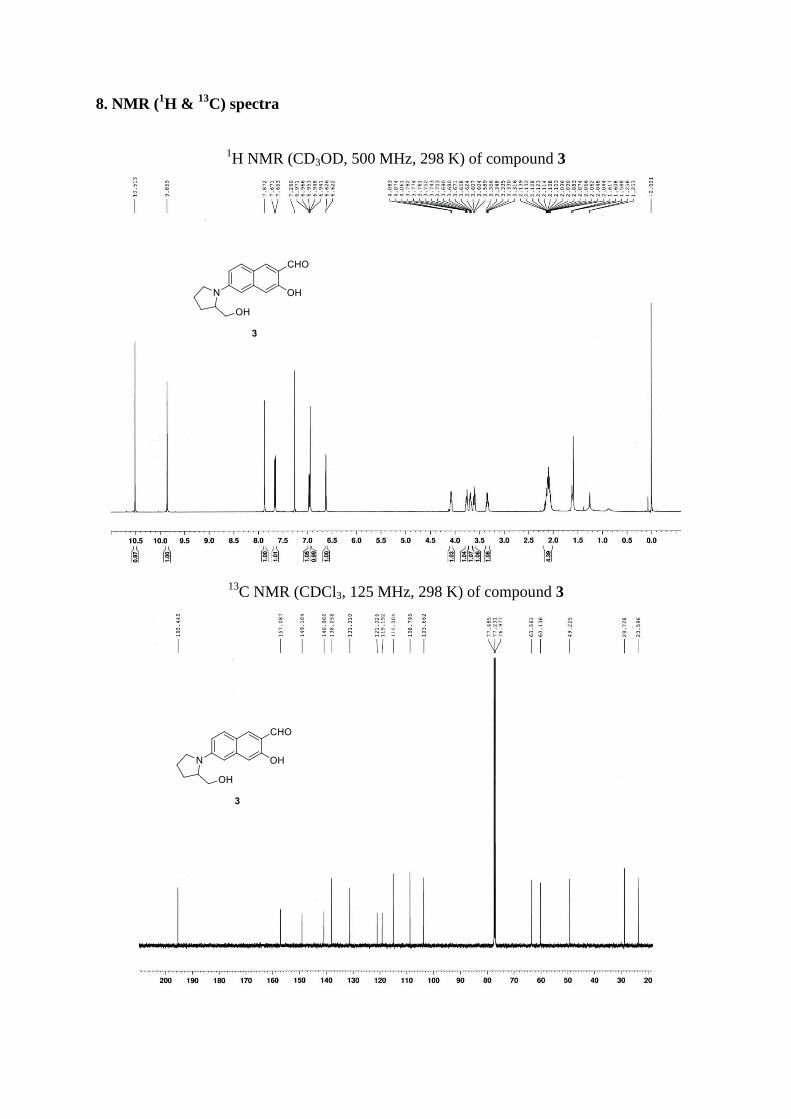
3-Hydroxy-6-(2-(hydroxymethyl)pyrrolidin-1-yl)-2-naphthaldehyde (3)
This compound was prepared by following the reported procedure (Ref: D. Kim, Q. P. Xuan,
H. Moon, Y. W. Jun, and K. H. Ahn, Asian J. Org. Chem., 2014, 3, 1089), starting from 2,7-
dihydroxynaphthalene and DL-prolinol, and obtained as a yellow solid. 1H NMR (500 MHz,
CDCl3): 𝛿 10.51 (s, 1H), 9.86 (s, 1H), 7.87 (s, 1H), 7.65 (d, J = 9.0 Hz, 1H), 6.95 (dd, J =
9.0, 2.5 Hz, 1H), 6.94 (s, 1H), 6.22 (d, J = 2 Hz, 1H), 4.06–4.08 (m, 1H), 3.74–3.78 (m, 1H),
3.66–3.70 (m, 1H), 3.59–3.62 (m, 1H), 3.32–3.37 (m, 1H), 2.04–2.14 (m, 4H); 13
C NMR
(125 MHz, CDCl3) 𝛿 195.4, 157.1, 149.1, 140.9, 138.1, 131.3, 121.0, 119.2, 115.0, 108.8,
103.7, 63.6, 60.1, 49.2, 28.7, 23.6.
Acetyl-benzocoumarin 2 (AcBC 2)
Compound 3 (200 mg, 0.737 mmol) was taken in a round-bottom flask and 10 mL of ethanol
was added to it. Following the addition of ethyl acetoacetate (186 µL, 1.474 mmol) and
piperidine (3 drop, cat. amount) at room temperature, the reaction mixture was stirred for 2 h.
After the completion of the reaction (checked by TLC, eluent: ethyl acetate/hexane = 1/1), the
reaction mixture was diluted with dichloromethane (30 mL) and washed with water (10 mL).
The aqueous layer was further extracted with dichloromethane (10 mL). The combined
organic layer was concentrated by rotary-evaporator. The residue was subjected to column
chromatography (eluent: starting from only CH2Cl2 to 10% EtOAc in CH2Cl2) to collect the
pure acetyl-benzocoumarin 2 (226 mg, 91%) as red solid. 1H NMR (500 MHz, CDCl3): δ
8.57 (s, 1H), 7.95 (s, 1H), 7.76 (d, J = 9.0 Hz, 1H), 7.38 (s, 1H), 7.12 (dd, J = 9.0, 2.5 Hz,
1H), 6.79 (d, J = 1.5 Hz, 1H), 4.10–4.12 (m, 1H), 3.78–3.80 (m, 1H), 3.71–3.72 (m, 1H),
3.63–3.66 (m, 1H), 3.35–3.40 (m, 4H), 2.73 (s, 3H), 2.14 (m, 4H); 13
C NMR (125 MHz,
CDCl3) 𝛿 195.9, 160.4, 152.1, 148.6, 148.4, 139.0, 132.1, 130.9, 124.0, 121.5, 117.0, 114.7,
109.4, 104.4, 63.5, 60.3, 49.3, 30.9, 28.7, 23.6; HRMS: m/z calcd for C20H19NO4 [M+]
337.1314; found 337.1316 [M+].
rTP-HOCl 1 (Probe)
Acetyl-benzocoumarin 2 (34 mg, 0.1 mmol), methanesulfonic acid (25 μL) and 2-
mercaptoethanol (8 µL, 0.11 mmol) were mixed in 10 mL dichloromethane solution and
refluxed for 3 h under Ar atmosphere. After the reaction was completed, the mixture was
cooled to room temperature and purified by column chromatography (eluent: starting from
only CH2Cl2 to 10% EtOAc in CH2Cl2). The pure probe rTP-HOCl 1 was obtained as orange
solid (31 mg, 78%). 1H NMR (500 MHz, CDCl3): δ 7.80 (s, 1H), 7.79 (s, 1H), 7.71 (d, J = 8.5
Hz, 1H), 7.41 (d, J = 1.5 Hz, 1H), 7.10 (d, J = 9.0 Hz, 1H), 6.80 (s, 1H), 4.41–4.45 (m, 1H),
4.16–4.21 (m, 1H), 4.07–4.08 (m, 1H), 3.76–3.79 (m, 1H), 3.69–3.72 (m, 1H), 3.61–3.65 (m,
1H), 3.31–3.35 (m, 1H), 3.14–3.19 (m, 1H), 3.01 (br, m, 1H), 2.08–2.14 (m, 4H); 13
C NMR
(125 MHz, CDCl3) 𝛿 160.8, 151.0, 147.4, 136.9, 134.8, 130.5, 129.8, 128.4, 123.9, 116.6,
115.5, 109.7, 104.4, 91.9, 71.5, 63.7, 60.3, 49.4, 33.7, 29.9, 28.8, 23.7; HRMS: m/z calcd for
C22H23NO4S [M+] 397.1348; found 397.1349 [M
+].
6. Supporting figures
300 350 400 450 500 550 600 650
0.00
0.05
0.10
0.15
0.20
abs
= 487 nmAb
so
rban
ce
Wavelength (nm)
rTP-HOCl 1
Acetyl-benzocoumarin 2
(a)
abs
= 424 nm
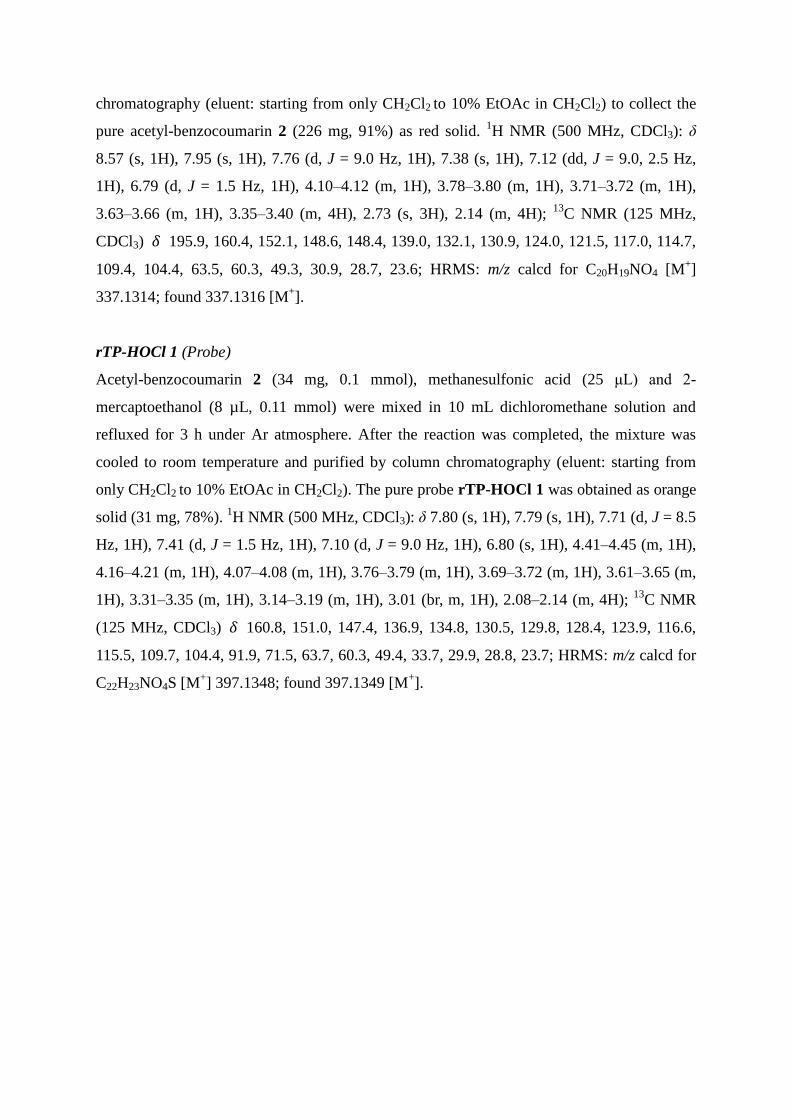
Fig. S1 Absorption spectra of rTP-HOCl 1 (5 μM) and acetyl-benzocoumarin 2 (5 μM) in
PBS (pH 7.4) containing 1% DMSO, recorded at 25 °C.
0 400 800 1200 1600 2000
0.75
0.80
0.85
0.90
Fl.
In
ten
sit
y R
ati
o (I 633/I598)
[HOCl] (nM)
Equation y = a + b*x
Adj. R-Square 0.98845
Value Standard Error
B Intercept 0.72149 0.00192
B Slope 7.35544E-5 2.29366E-6
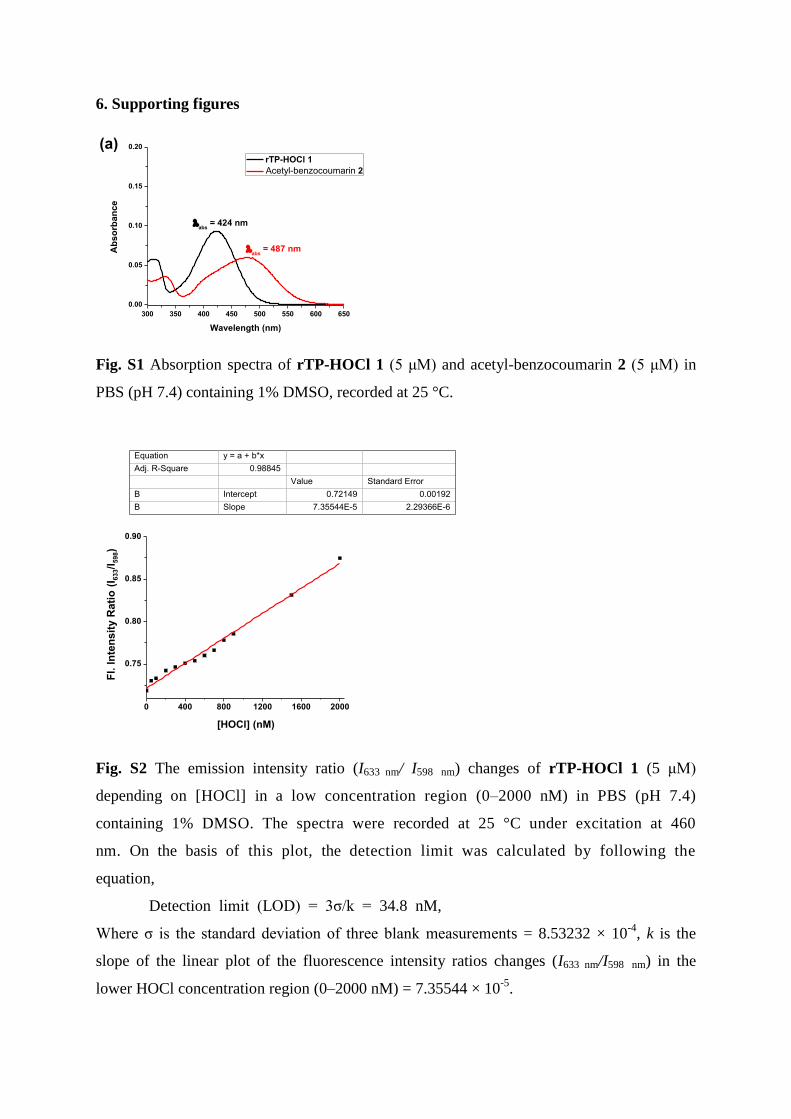
Fig. S2 The emission intensity ratio (I633 nm/ I598 nm) changes of rTP-HOCl 1 (5 μM)
depending on [HOCl] in a low concentration region (0–2000 nM) in PBS (pH 7.4)
containing 1% DMSO. The spectra were recorded at 25 °C under excitation at 460
nm. On the basis of this plot, the detection limit was calculated by following the
equation,
Detection limit (LOD) = 3σ/k = 34.8 nM,
Where σ is the standard deviation of three blank measurements = 8.53232 × 10⁻⁴
, k is the
slope of the linear plot of the fluorescence intensity ratios changes (I633 nm/I598 nm) in the
lower HOCl concentration region (0–2000 nM) = 7.35544 × 10⁻⁵
.
500 550 600 650 700 750 800
0
50
100
150
200
Fl.
In
ten
sit
y (
au
)
Wavelength (nm)
Probe
ATP
NAD
GSH
Cys
Fe(III)
Zn(II)
Cu(II)
NO.
1O2
O2-
tBuOOH
H2O
2
tBuOO
.
HO.
HOCl
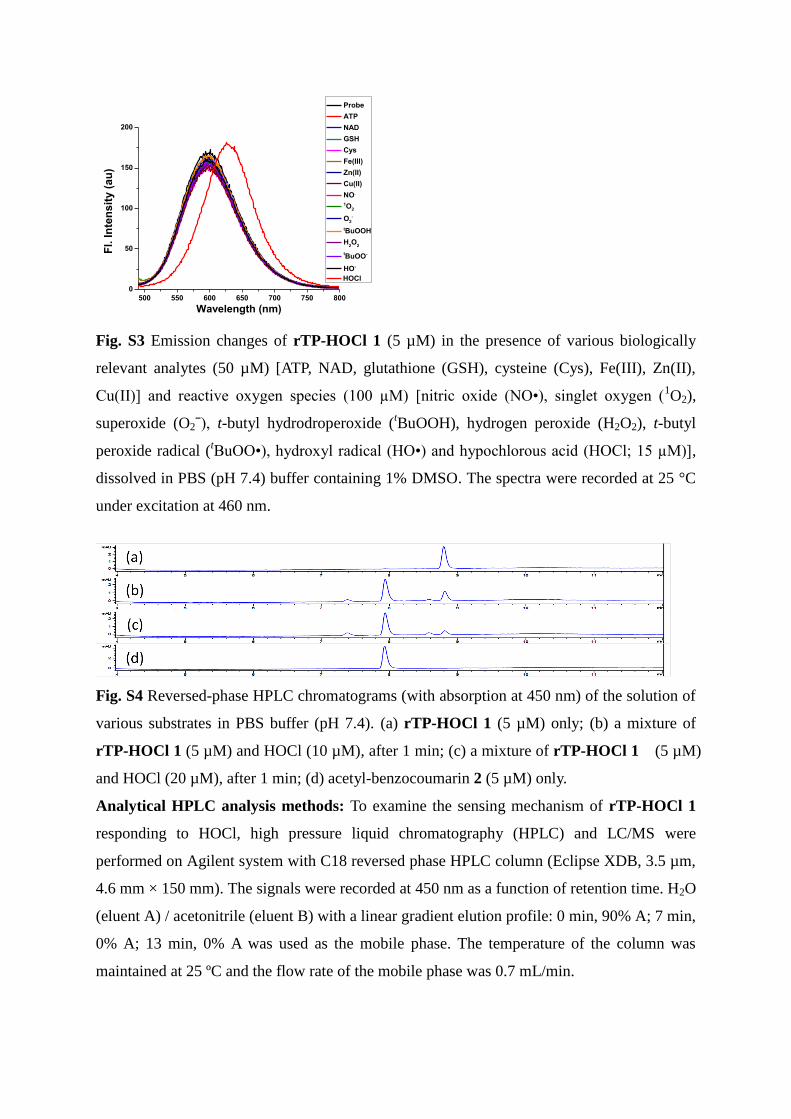
Fig. S3 Emission changes of rTP-HOCl 1 (5 µM) in the presence of various biologically
relevant analytes (50 µM) [ATP, NAD, glutathione (GSH), cysteine (Cys), Fe(III), Zn(II),
Cu(II)] and reactive oxygen species (100 µM) [nitric oxide (NO•), singlet oxygen (1O2),
superoxide (O2ˉ), t-butyl hydrodroperoxide (tBuOOH), hydrogen peroxide (H2O2), t-butyl
peroxide radical (tBuOO•), hydroxyl radical (HO•) and hypochlorous acid (HOCl; 15 µM)],
dissolved in PBS (pH 7.4) buffer containing 1% DMSO. The spectra were recorded at 25 °C
under excitation at 460 nm.
Fig. S4 Reversed-phase HPLC chromatograms (with absorption at 450 nm) of the solution of
various substrates in PBS buffer (pH 7.4). (a) rTP-HOCl 1 (5 µM) only; (b) a mixture of
rTP-HOCl 1 (5 µM) and HOCl (10 µM), after 1 min; (c) a mixture of rTP-HOCl 1 (5 µM)
and HOCl (20 µM), after 1 min; (d) acetyl-benzocoumarin 2 (5 µM) only.
Analytical HPLC analysis methods: To examine the sensing mechanism of rTP-HOCl 1
responding to HOCl, high pressure liquid chromatography (HPLC) and LC/MS were
performed on Agilent system with C18 reversed phase HPLC column (Eclipse XDB, 3.5 µm,
4.6 mm × 150 mm). The signals were recorded at 450 nm as a function of retention time. H2O
(eluent A) / acetonitrile (eluent B) with a linear gradient elution profile: 0 min, 90% A; 7 min,
0% A; 13 min, 0% A was used as the mobile phase. The temperature of the column was
maintained at 25 ºC and the flow rate of the mobile phase was 0.7 mL/min.
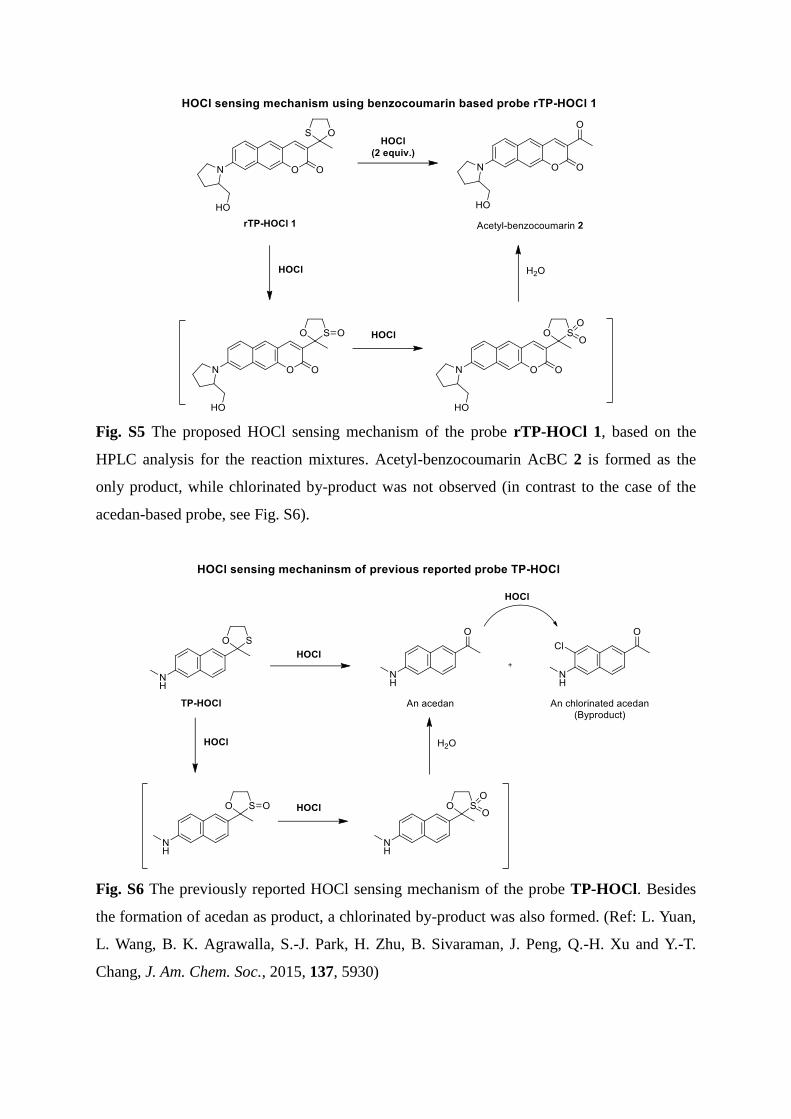
Fig. S5 The proposed HOCl sensing mechanism of the probe rTP-HOCl 1, based on the
HPLC analysis for the reaction mixtures. Acetyl-benzocoumarin AcBC 2 is formed as the
only product, while chlorinated by-product was not observed (in contrast to the case of the
acedan-based probe, see Fig. S6).
Fig. S6 The previously reported HOCl sensing mechanism of the probe TP-HOCl. Besides
the formation of acedan as product, a chlorinated by-product was also formed. (Ref: L. Yuan,
L. Wang, B. K. Agrawalla, S.-J. Park, H. Zhu, B. Sivaraman, J. Peng, Q.-H. Xu and Y.-T.
Chang, J. Am. Chem. Soc., 2015, 137, 5930)
2 4 6 8 100
20
40
60
80
100
Cell
Via
bil
ity (
%)
Time (h)
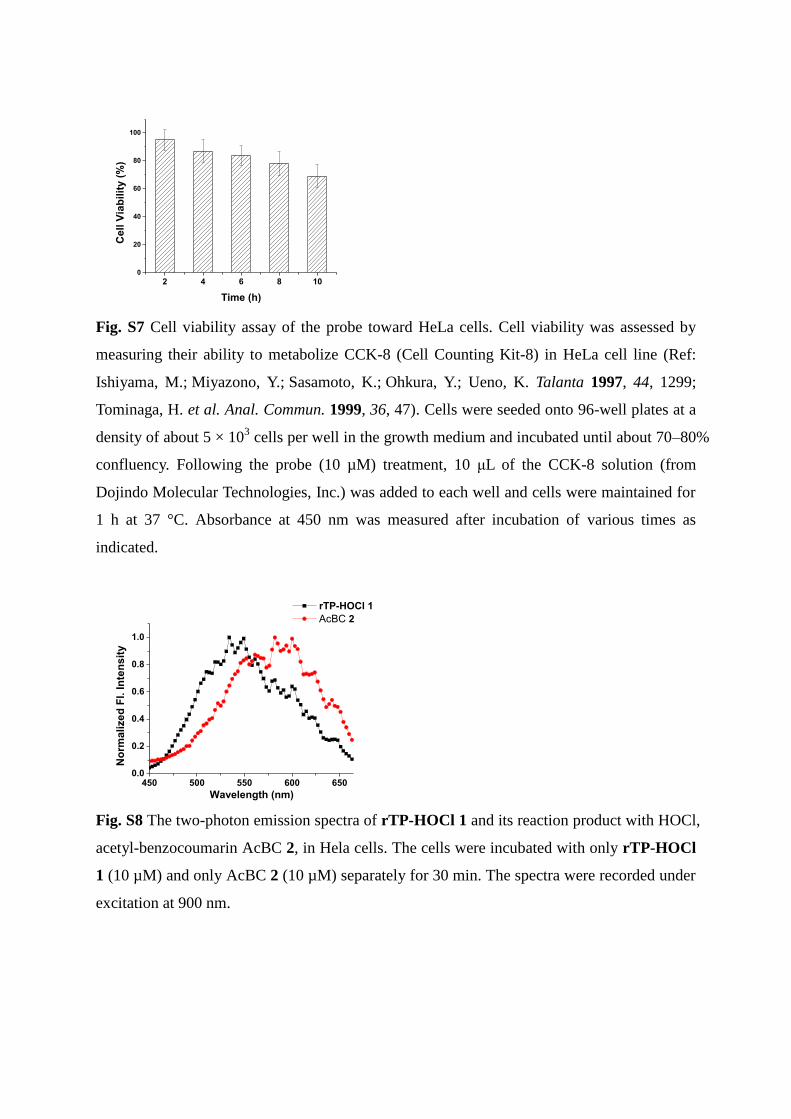
Fig. S7 Cell viability assay of the probe toward HeLa cells. Cell viability was assessed by
measuring their ability to metabolize CCK-8 (Cell Counting Kit-8) in HeLa cell line (Ref:
Ishiyama, M.; Miyazono, Y.; Sasamoto, K.; Ohkura, Y.; Ueno, K. Talanta 1997, 44, 1299;
Tominaga, H. et al. Anal. Commun. 1999, 36, 47). Cells were seeded onto 96-well plates at a
density of about 5 × 10³ cells per well in the growth medium and incubated until about 70–80%
confluency. Following the probe (10 µM) treatment, 10 μL of the CCK-8 solution (from
Dojindo Molecular Technologies, Inc.) was added to each well and cells were maintained for
1 h at 37 °C. Absorbance at 450 nm was measured after incubation of various times as
indicated.
450 500 550 600 6500.0
0.2
0.4
0.6
0.8
1.0
No
rma
lize
d F
l. I
nte
ns
ity
Wavelength (nm)
rTP-HOCl 1
AcBC 2
Fig. S8 The two-photon emission spectra of rTP-HOCl 1 and its reaction product with HOCl,
acetyl-benzocoumarin AcBC 2, in Hela cells. The cells were incubated with only rTP-HOCl
1 (10 µM) and only AcBC 2 (10 µM) separately for 30 min. The spectra were recorded under
excitation at 900 nm.
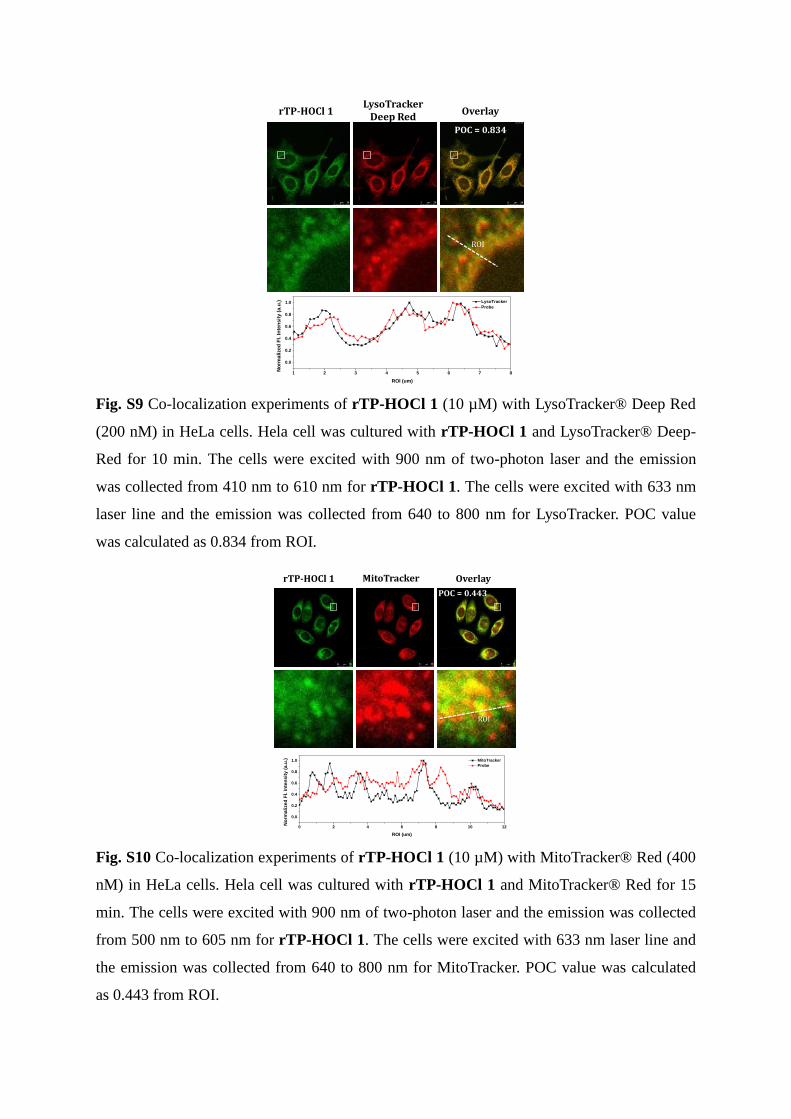
Fig. S9 Co-localization experiments of rTP-HOCl 1 (10 µM) with LysoTracker® Deep Red
(200 nM) in HeLa cells. Hela cell was cultured with rTP-HOCl 1 and LysoTracker® Deep-
Red for 10 min. The cells were excited with 900 nm of two-photon laser and the emission
was collected from 410 nm to 610 nm for rTP-HOCl 1. The cells were excited with 633 nm
laser line and the emission was collected from 640 to 800 nm for LysoTracker. POC value
was calculated as 0.834 from ROI.
Fig. S10 Co-localization experiments of rTP-HOCl 1 (10 µM) with MitoTracker® Red (400
nM) in HeLa cells. Hela cell was cultured with rTP-HOCl 1 and MitoTracker® Red for 15
min. The cells were excited with 900 nm of two-photon laser and the emission was collected
from 500 nm to 605 nm for rTP-HOCl 1. The cells were excited with 633 nm laser line and
the emission was collected from 640 to 800 nm for MitoTracker. POC value was calculated
as 0.443 from ROI.
ROI
1 2 3 4 5 6 7 8
0.0
0.2
0.4
0.6
0.8
1.0
No
rma
lize
d F
l. I
nte
ns
ity
(a
.u.)
ROI (um)
LysoTracker
Probe
POC = 0.834
rTP-HOCl 1LysoTracker
Deep RedOverlay
ROI
0 2 4 6 8 10 12
0.0
0.2
0.4
0.6
0.8
1.0
No
rma
lize
d F
l. I
nte
ns
ity
(a
.u.)
ROI (um)
MitoTracker
Probe
POC = 0.443
rTP-HOCl 1 MitoTracker Overlay
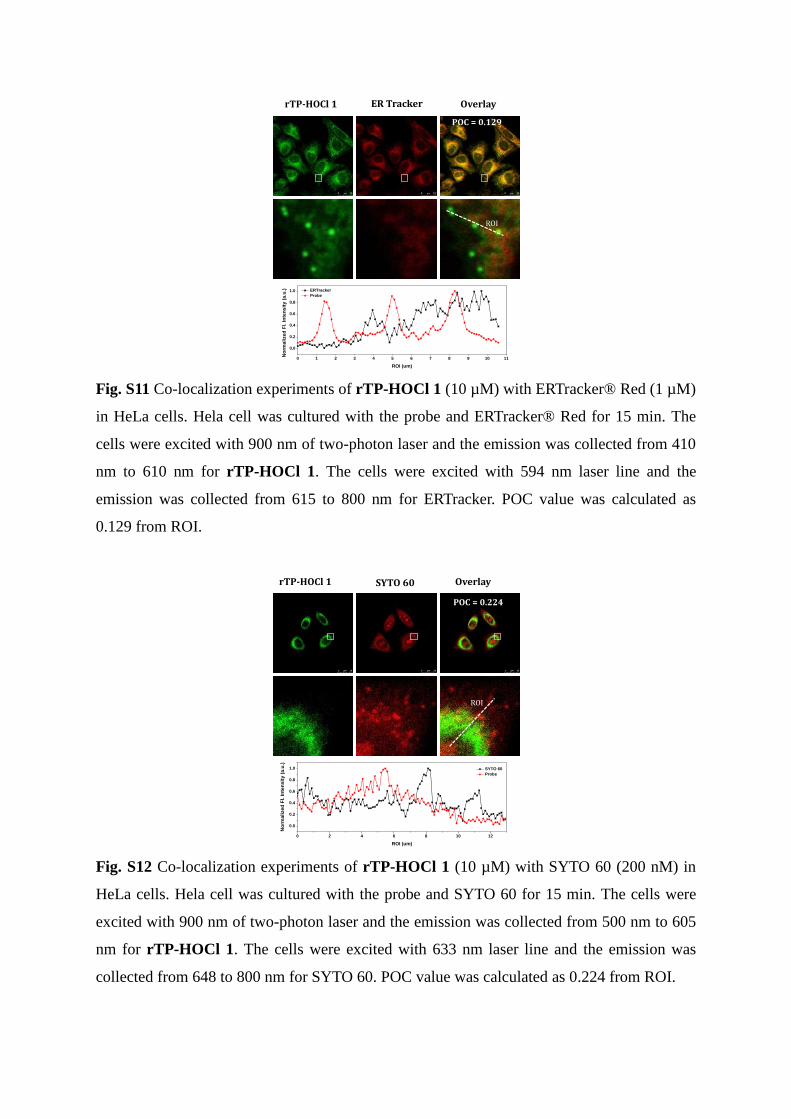
Fig. S11 Co-localization experiments of rTP-HOCl 1 (10 µM) with ERTracker® Red (1 µM)
in HeLa cells. Hela cell was cultured with the probe and ERTracker® Red for 15 min. The
cells were excited with 900 nm of two-photon laser and the emission was collected from 410
nm to 610 nm for rTP-HOCl 1. The cells were excited with 594 nm laser line and the
emission was collected from 615 to 800 nm for ERTracker. POC value was calculated as
0.129 from ROI.
Fig. S12 Co-localization experiments of rTP-HOCl 1 (10 µM) with SYTO 60 (200 nM) in
HeLa cells. Hela cell was cultured with the probe and SYTO 60 for 15 min. The cells were
excited with 900 nm of two-photon laser and the emission was collected from 500 nm to 605
nm for rTP-HOCl 1. The cells were excited with 633 nm laser line and the emission was
collected from 648 to 800 nm for SYTO 60. POC value was calculated as 0.224 from ROI.
ROI
0 1 2 3 4 5 6 7 8 9 10 11
0.0
0.2
0.4
0.6
0.8
1.0
No
rmalized
Fl. In
ten
sit
y (
a.u
.)
ROI (um)
ERTracker
Probe
POC = 0.129
rTP-HOCl 1 ER Tracker Overlay
ROI
0 2 4 6 8 10 12
0.0
0.2
0.4
0.6
0.8
1.0
No
rma
lize
d F
l. I
nte
ns
ity
(a
.u.)
ROI (um)
SYTO 60
Probe
POC = 0.224
rTP-HOCl 1 SYTO 60 Overlay
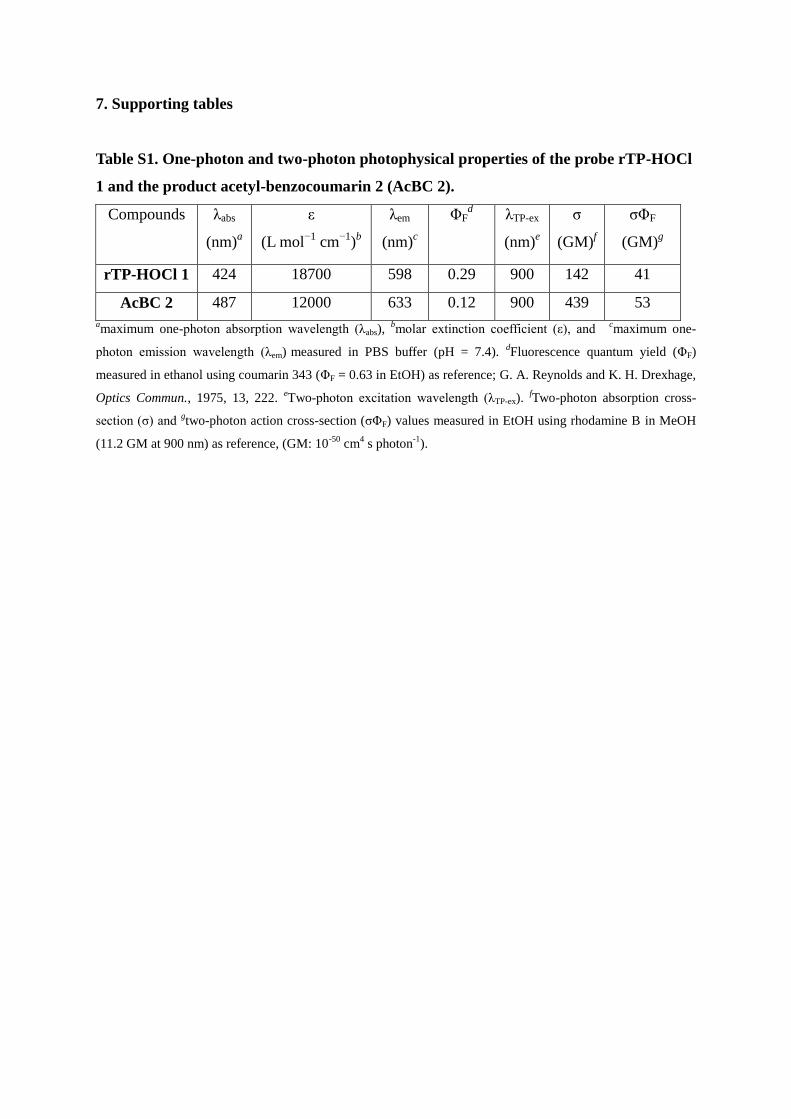
7. Supporting tables
Table S1. One-photon and two-photon photophysical properties of the probe rTP-HOCl
1 and the product acetyl-benzocoumarin 2 (AcBC 2).
Compounds λabs
(nm)a
ε
(L mol−1
cm−1
)b
λem
(nm)c
ΦFd λTP-ex
(nm)e
σ
(GM)f
σΦF
(GM)g
rTP-HOCl 1 424 18700 598 0.29 900 142 41
AcBC 2 487 12000 633 0.12 900 439 53
amaximum one-photon absorption wavelength (λabs),
bmolar extinction coefficient (ε), and
cmaximum one-
photon emission wavelength (λem) measured in PBS buffer (pH = 7.4). dFluorescence quantum yield (ΦF)
measured in ethanol using coumarin 343 (ΦF = 0.63 in EtOH) as reference; G. A. Reynolds and K. H. Drexhage,
Optics Commun., 1975, 13, 222. eTwo-photon excitation wavelength (λTP-ex).
fTwo-photon absorption cross-
section (σ) and gtwo-photon action cross-section (σΦF) values measured in EtOH using rhodamine B in MeOH
(11.2 GM at 900 nm) as reference, (GM: 10-50
cm4 s photon
-1).
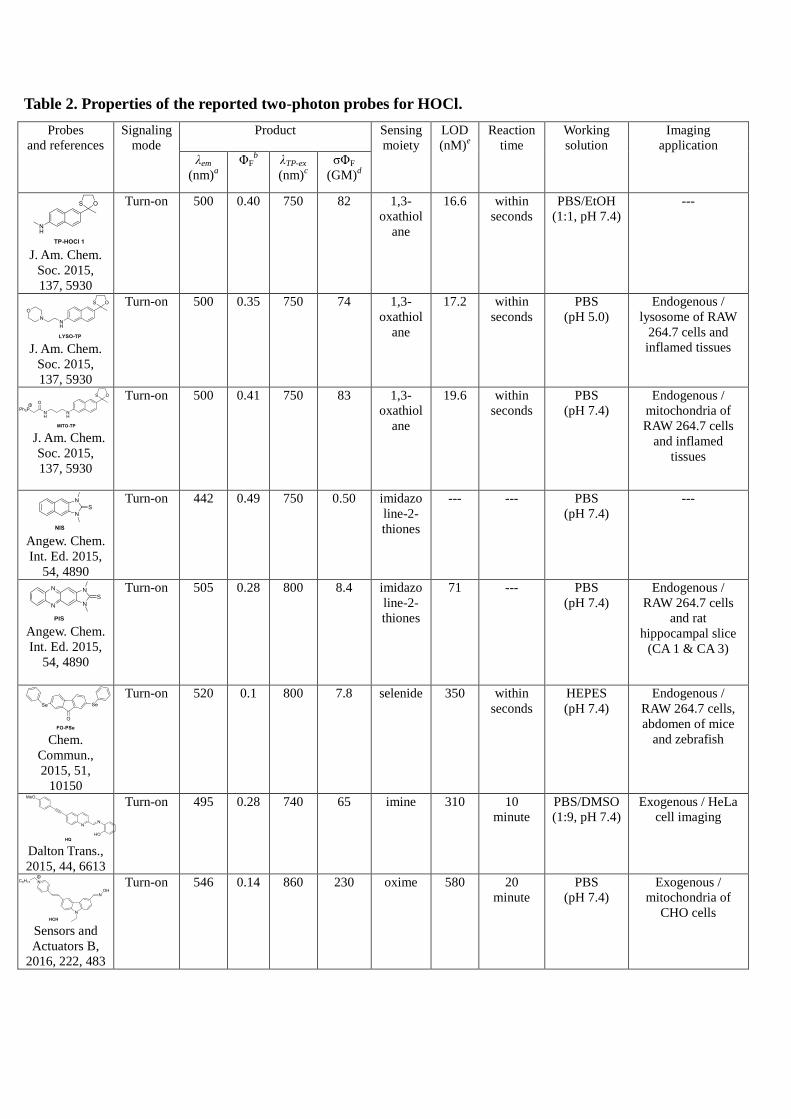
Table 2. Properties of the reported two-photon probes for HOCl.
Probes
and references
Signaling
mode
Product Sensing
moiety
LOD
(nM)e
Reaction
time
Working
solution
Imaging
application λem
(nm)a
ΦFb
λTP-ex
(nm)c
σΦF
(GM)d
J. Am. Chem.
Soc. 2015,
137, 5930
Turn-on
500 0.40 750 82 1,3-
oxathiol
ane
16.6 within
seconds
PBS/EtOH
(1:1, pH 7.4)
---
J. Am. Chem.
Soc. 2015,
137, 5930
Turn-on
500 0.35 750 74 1,3-
oxathiol
ane
17.2 within
seconds
PBS
(pH 5.0)
Endogenous /
lysosome of RAW
264.7 cells and
inflamed tissues
J. Am. Chem.
Soc. 2015,
137, 5930
Turn-on
500 0.41 750 83 1,3-
oxathiol
ane
19.6 within
seconds
PBS
(pH 7.4)
Endogenous /
mitochondria of
RAW 264.7 cells
and inflamed
tissues
Angew. Chem.
Int. Ed. 2015,
54, 4890
Turn-on
442 0.49 750 0.50 imidazo
line-2-
thiones
--- --- PBS
(pH 7.4)
---
N
N
N
N
S
PIS Angew. Chem.
Int. Ed. 2015,
54, 4890
Turn-on
505 0.28 800 8.4 imidazo
line-2-
thiones
71 --- PBS
(pH 7.4)
Endogenous /
RAW 264.7 cells
and rat
hippocampal slice
(CA 1 & CA 3)
Chem.
Commun.,
2015, 51,
10150
Turn-on
520 0.1 800 7.8 selenide 350 within
seconds
HEPES
(pH 7.4)
Endogenous /
RAW 264.7 cells,
abdomen of mice
and zebrafish
Dalton Trans.,
2015, 44, 6613
Turn-on
495 0.28 740 65 imine 310 10
minute
PBS/DMSO
(1:9, pH 7.4)
Exogenous / HeLa
cell imaging
Sensors and
Actuators B,
2016, 222, 483
Turn-on
546 0.14 860 230 oxime 580 20
minute
PBS
(pH 7.4)
Exogenous /
mitochondria of
CHO cells
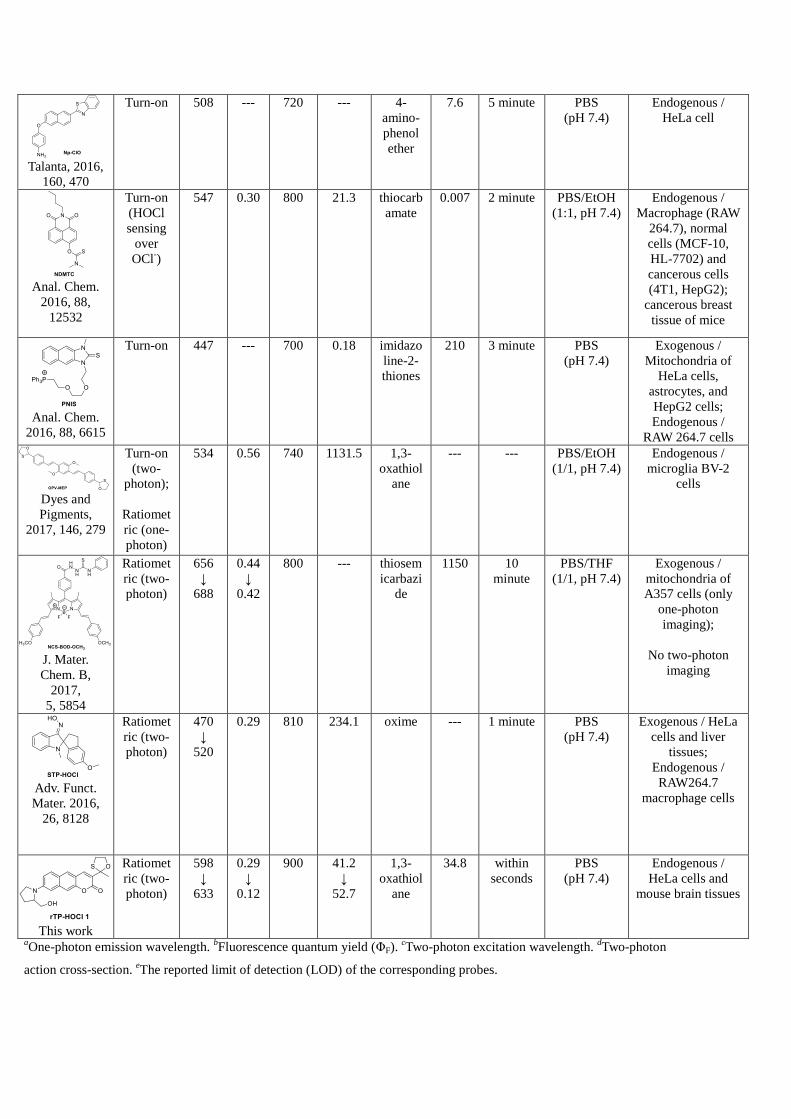
Talanta, 2016,
160, 470
Turn-on
508 --- 720 --- 4-
amino-
phenol
ether
7.6 5 minute PBS
(pH 7.4)
Endogenous /
HeLa cell
Anal. Chem.
2016, 88,
12532
Turn-on
(HOCl
sensing
over
OCl-)
547 0.30 800 21.3 thiocarb
amate
0.007 2 minute PBS/EtOH
(1:1, pH 7.4)
Endogenous /
Macrophage (RAW
264.7), normal
cells (MCF-10,
HL-7702) and
cancerous cells
(4T1, HepG2);
cancerous breast
tissue of mice
Anal. Chem.
2016, 88, 6615
Turn-on
447 --- 700 0.18 imidazo
line-2-
thiones
210 3 minute PBS
(pH 7.4)
Exogenous /
Mitochondria of
HeLa cells,
astrocytes, and
HepG2 cells;
Endogenous /
RAW 264.7 cells
Dyes and
Pigments,
2017, 146, 279
Turn-on
(two-
photon);
Ratiomet
ric (one-
photon)
534 0.56 740 1131.5 1,3-
oxathiol
ane
--- --- PBS/EtOH
(1/1, pH 7.4)
Endogenous /
microglia BV-2
cells
J. Mater.
Chem. B,
2017,
5, 5854
Ratiomet
ric (two-
photon)
656
↓
688
0.44
↓
0.42
800 --- thiosem
icarbazi
de
1150 10
minute
PBS/THF
(1/1, pH 7.4)
Exogenous /
mitochondria of
A357 cells (only
one-photon
imaging);
No two-photon
imaging
Adv. Funct.
Mater. 2016,
26, 8128
Ratiomet
ric (two-
photon)
470
↓
520
0.29 810 234.1 oxime --- 1 minute PBS
(pH 7.4)
Exogenous / HeLa
cells and liver
tissues;
Endogenous /
RAW264.7
macrophage cells
This work
Ratiomet
ric (two-
photon)
598
↓
633
0.29
↓
0.12
900 41.2
↓
52.7
1,3-
oxathiol
ane
34.8 within
seconds
PBS
(pH 7.4)
Endogenous /
HeLa cells and
mouse brain tissues
aOne-photon emission wavelength.
bFluorescence quantum yield (ΦF).
cTwo-photon excitation wavelength.
dTwo-photon
action cross-section. eThe reported limit of detection (LOD) of the corresponding probes.
8. NMR (1H &
13C) spectra
1H NMR (CD3OD, 500 MHz, 298 K) of compound 3
13C NMR (CDCl3, 125 MHz, 298 K) of compound 3
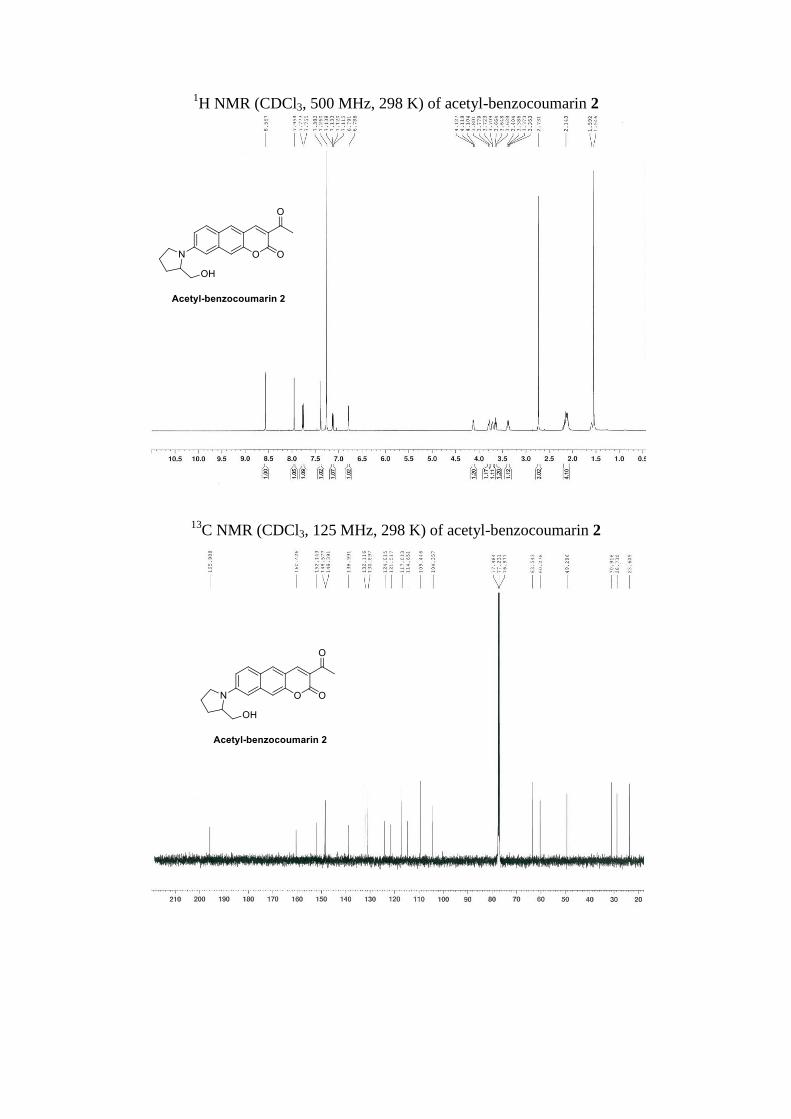
1H NMR (CDCl3, 500 MHz, 298 K) of acetyl-benzocoumarin 2
13C NMR (CDCl3, 125 MHz, 298 K) of acetyl-benzocoumarin 2
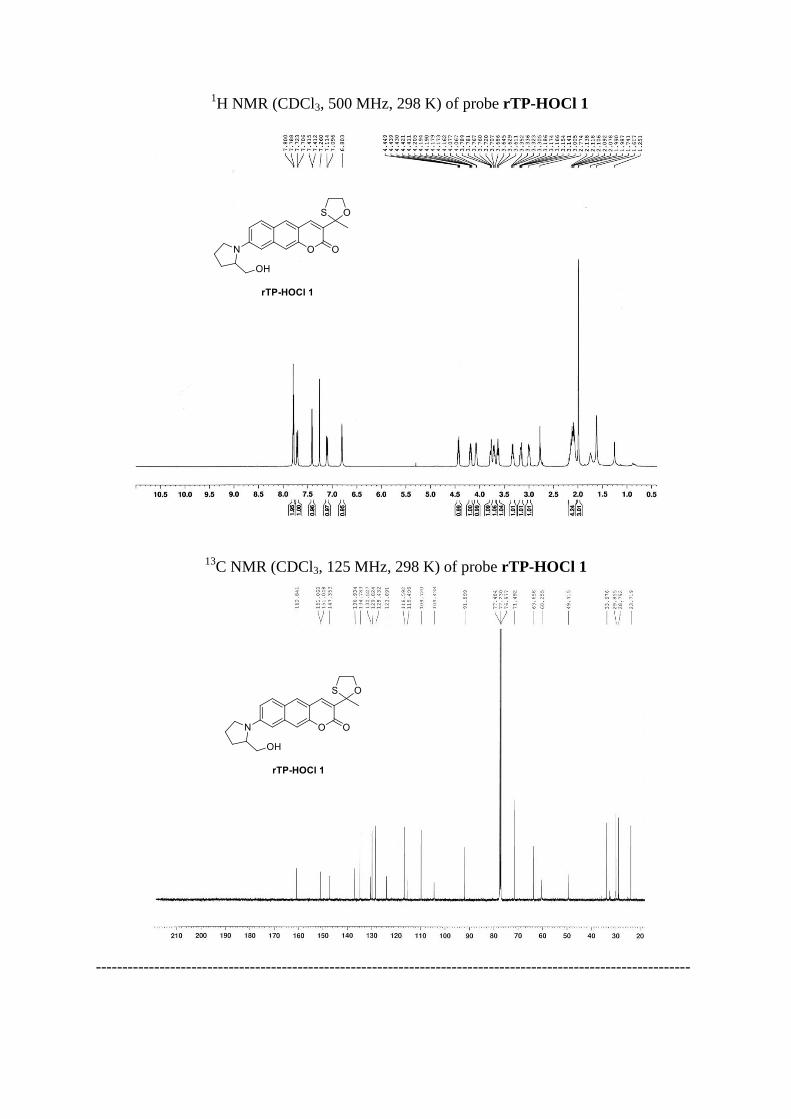
1H NMR (CDCl3, 500 MHz, 298 K) of probe rTP-HOCl 1
13C NMR (CDCl3, 125 MHz, 298 K) of probe rTP-HOCl 1
----------------------------------------------------------------------------------------------------------------