electronic journal of plant breeding - icrisat
TRANSCRIPT

Received: 29 May 2020 Accepted: 18 Jun 2020Revised: 18 Jun 2020
https://doi.org/10.37992/2020.1102.089 Vol 11(2):528-537 528
Electronic Journal of Plant Breeding
Research Article
Diversity and stability studies in barnyard millet (Echinochloa frumentacea (Roxb). Link.) germplasm for grain yield and its contributing traitsR. Prabu1, C. Vanniarajan1*, M. Vetrivanthan2, R. P. Gnanamalar1, R. Shanmughasundaram3 and J. Ramalingam4
1Department of Plant Breeding and Genetics, 2Gene bank, International Crops Research Institute for the Semi-Arid Tropics, Patancheru -502324, Hyderabad, Telangana, India.3Department of Soils and Environment, 4Department of Biotechnology, Agricultural College and Research Institute, Madurai – 625104, Tamil Nadu, India.*E-Mail: [email protected]
AbstractNutritionally, Barnyard millet is an important crop, it is probably originated in central Asia and spread from central Asia to Europe and America. Climate change will alert an extra constrains as many parts of the country are becoming drier with increasingly severe weather patterns. Developing better barnyard millet cultivars is always placing as an important strategy in crop improvement. This study was focused to evaluate the phenotypic diversity and stability of barnyard millet germplasm for yield and its attributing traits. Diversity as revealed by D2 analysis indicated that the trait grain yield had contributed maximum towards the diversity followed by days to maturity. The accessions M5P1, M36P1 and M37P1 exhibited the highest mean values for grain yield per plant, but no significance difference was found comparing checks. Stability analysis revealed that none of the accessions were showed stable performance, indicated that influence of environmental factors played a major role.
KeywordsBarnyard millet, diversity, stability, environments
INTRODUCTIONBarnyard millet (Echinochloa frumentacea (Roxb). Link.) is one among the group of crops called small millets. It can be grown with little use of water and it is alternate to water-guzzing crops. It has also been utilized for the reclamation of sodicity, arsenic and cadmium problem soils as it grows well under soil salinity condition and mitigates the cadmium stress; and increase the biosynthesis in plants Sherif and Ali (2007); Abe et al. (2011). It is also cultivated at hills under double cut production system with better yield Bandyopadhyay, (2009). The grains of barnyard millet contains of 6.2 g of protein, 9.8 g of crude fibre, 2.2 g of fat, 4.4 g of ash, 65.5 g of carbohydrate, 300 Kcal of energy, 0.30 mg of thiamin and 0.09 mg of
riboflavin Muthamilarasan et. al, (2016) and the grains are consumed just like rice Ruiz-Santaella et al (2006). The nutrient – rich grain is making a quick come back in the Indian Agrarian landscape after decades of long neglect. In 2016, the area under the cultivation of barnyard millet in India, figured about 1, 46000 ha with its production of about 1, 51000 tons Bhat et al. (2018).
In Tamil Nadu, it is being practiced as rainfed agriculture and spread across districts like Ramanathapuram, Madurai, Virudhunagar, Theni, Salem, Namakkal, Villupuram, Dindigul, Coimbatore and Erode districts Nirmalakumari et al.(2009). The awareness of using

EJPB
https://doi.org/10.37992/2020.1102.089
Diversity and stability studies in barnyard millet
529
small millets is catching up fast in the urban centres due to its fair source of protein, which is highly digestible and is an excellent source of dietary fibre with good amounts of soluble and insoluble fractions Hadimani and Malleshi (1993); Veena et al. (2005). Although barnyard millet like any other millet is nutritionally superior to cereals, yet its utilization is unexplored. Thus, it leads to highly demandable millet and occupies its need to increase the area under cultivation and productivity. This study aims to evaluate the barnyard millet accessions including of some early maturing germplasm for genetic diversity and stability of yield and early maturity across
three different environments, to identify stable and high yielding accessions for their utilization in barnyard millet improvement.
MATERIALS AND METHODSForty germplasm of barnyard millet were used in this study (Table 1). These germplasm were obtained from the Genebank, International Crops Research Institute for the Semi-Arid Tropics (ICRISAT), Hyderabad, India; Department of Plant Breeding and Genetics, Agricultural College and Research Institute, Madurai; Department of Millets, Tamil Nadu Agricultural University (TNAU),
Table 1. Details of genotypes used for the study
Sl.No Genotypes Origin/Parentage Source1 ACM 110
IndiaDepartment of Plant Breeding and Genetics, Agricultural College and Research Institute, Madurai
2 ACM 1613 ACM 2954 ACM 3315 ACM 3336 ACM-15-343 A cross derivative from
ACM cultures7 ACM-15-353 A cross derivative from
ACM cultures8 GECH 10
India
All India Co-ordinated Small Millets Improvement Project, Bengaluru.9 GECH 15
10 IEc – 52
ICRISAT, Hyderabad
11 IEc - 16712 IEc – 56813 IEc – 16614 IEc – 67215 IEc – 8216 IEc – 10917 IEc – 10718 IEc – 10819 IEc – 38620 IEc – 38521 IEc – 35622 IEc – 35023 IEc – 39124 IEc – 7125 IEc – 29626 IEc – 396
27 T 5 IndiaDepartment of Millets, Tamil Nadu Agricultural University, Coimbatore.
28 M1 Gamma ray - 900 Gy
Mutant lines of Co (Kv)-2
Department of Plant Breeding and Genetics, Agricultural College and Research Institute, Madurai
29 M2 EMS - 70mM + Gamma ray 700 Gy
30 M3 EMS - 60 mM31 M5 EMS - 70mM + Gamma
ray 800 Gy32 M12 Gamma ray - 800 Gy33 M18 EMS - 70 mM34 M27 Gamma ray - 900 Gy35 M28 Gamma ray - 900 Gy36 M36 EMS - 70mM + Gamma
ray 900 Gy37 M37 EMS - 70mM + Gamma
ray 900 Gy38 M38 EMS - 60 mM
39 MDU – 1India
Department of Plant Breeding and Genetics, Agricultural College and Research Institute, Madurai
40 Co (KV)- 2Department of Millets, Tamil Nadu Agricultural University, Coimbatore.

EJPB
530https://doi.org/10.37992/2020.1102.089
Prabu et al.,
Coimbatore, India and All India Coordinated Small Millets Improvement Project, Bengaluru, India, and two local checks namely MDU 1 and CO (Kv) 2 were included. These checks were released as varieties by Agricultural College and Research Institute (AC&RI), Madurai in 2015 (MDU 1) and Tamil Nadu Agricultural University, Coimbatore in 2009 (CO (Kv) 2). The experiments
were laid in randomized complete block design (RCBD) with two replications at three different environments. At Idukki, a hills region of Kerala state, considered as E1, at AC&RI, Madurai (E2), a plain region and at Theni, a valley region considered as E3. The meteorological data of the distinguished environments is furnished in the Table 2.
Table 2. Meteorological data of the three environments
Location Latitude Longitude Average Rainfall Average Temperature Date of sowingIdukki 10.010N 77.340E 1082 mm 21.90C 07 th January 2019Madurai 9.950N 78.010E 857 mm 28.80C 09th January 2019Theni 9.930N 77.470E 791 mm 27.20C 11th January 2019
All these experiments were conducted during the summer season 2019 and sowing was carried out with two days gap in each location (Table 2).The data on seventeen yield and its contributing traits on five randomly selected plants in each accession and in each replication were recorded following the barnyard millet descriptors (Bioversity International. 1983). The traits such as plant height, days to first flowering, days to maturity, the number of nodes, node length, the number of basal tillers, stem diameter, flag leaf length, flag leaf width, inflorescence length, inflorescence width, length of lower racemes, length of peduncle, the number of racemes, thousand grain weight, single ear head weight and grain yield per plant were considered for data collection. All the inputs practices were followed on time with proper pest management as per the package of practices recommended by TNAU, Coimbatore.
The data over quantitative traits were analyzed for each
environment individually and combined of all three environments using Residual Maximum Likelihood (REML) (Patterson, 1971 #248)Patterson and Thompson, (1971) in GenStat 19th edition (http://www.genstat.co.uk) giving consideration to accessions as random and environment as fixed. Wald statistic was utilized for environment significance. The components of variance due to genotype (σ2
g), genotype × environment (σ2ge) and standard errors
(SE) were calculated for individual and pooled data. Best Linear Unbiased Predictors (BLUPs) Schonfeld and Werner, (1986) were obtained for all the quantitative traits for each accession for individual environment and for pooled data. The BLUPs obtained from combined of three environments were used for Mahalonobis’s generalized distance (D2) estimation to measure the genetic divergence among the accessions and clustering was done following Tocher’s method Radhakrishna Rao (1952). Stability analysis was performed using the PBTools software PBTools, (2014).
Table 3. Estimation of variance components for individual and pooled of three environments using REML approach
Variables E1 E2 E3 Pooledσ2g σ2g σ2g σ2g σ2ge
Days to flowering 213.69** 193.40** 213.39** 191.18** 15.65**Days to maturity 281.90** 205.99** 292.77** 252.00** 8.21**Grain yield per plant (g) 340.31** 245.49** 70.44** 172.26** 46.41**Length of flag leaf (cm) 28.92** 23.57** 21.69** 15.87** 8.87**Length of lower racemes 0.24** 0.62** 0.40** 0.16** 0.26**Length of inflorescence 16.05** 13.20** 13.65** 10.60** 3.66**Length of nodes 6.61** 3.91** 4.90** 1.20 3.92**Length of peduncle 18.71** 4.66** 2.66** 1.09 7.59**Number of tillers 15.48** 4.48** 7.08** 1.42 7.60**Number of nodes 2.07** 1.23** 2.01** 0.84** 0.93**Number of racemes 145.89** 143.75** 143.37** 130.31** 13.98**Plant height 1198.72** 827.25** 211.16** 450.23** 294.88**Stem diameter 1.42** 1.07** 0.56** 0.84** 0.18**Single ear head weight 19.64** 8.87** 4.02** 7.89** 2.96**Thousand grain weight 0.09** 0.40** 0.11** 0.01 0.19**Width of flag leaf 0.29** 0.50** 0.31** 0.26** 0.11**Width of inflorescence 0.65** 0.57** 0.52** 0.41** 0.17**
Note: σ2g, genotypic variance component; σ2ge Genotype x environment variance component

EJPB
531https://doi.org/10.37992/2020.1102.089
Prabu et al.,
RESULTS AND DISCUSSIONThe REML analysis indicated that the genotypic variance component (σ2
g) was significant for all the traits in all three environments studied, and in the combined environment indicating the presence of considerable variability for all the traits except the traits like length of nodes, length of peduncle, the number of tillers and thousand grain weight which showed non-significance (Table 3). The variance component due to genotypic and environment interaction (σ2
ge) was significant for all the traits under combined of three environments, indicating that significant influence of environment on the expression of traits. Mean performance of barnyard millet accessions for various quantitative traits in different growing environments (Table 4) indicated that the trait plant height significantly differed in all three environments (75.86 cm in E3 to 148.47 cm in E1), while days to maturity was similar in all three environments (96.3.4 days E2 to 99.65 days in E3), and pooled of three environments (97.66 days) (Table 3). Grain yield was significantly differed between E1 (40.29 g) and E3 (23.34g) and E2 (35.99 g) and pooled of three environments (33.20 g) exhibited almost equal data on yield (33.20 g). Similarly, the traits like flag leaf length,
inflorescence length, node length, length of peduncle and single ear head weight were varied significantly from E1 to E3 (Table 3), which indicated that the agro-climatically conditions, soil types and other meteorological parameters in the phenotypic expressions. The E2 and pooled data positioned in between values to both E1 and E3 for majority of the traits.
Based on the mean performance, there are 12 accessions such as IEc 71, IEc 82, IEc 107, IEc 108, IEc 109, IEc 296, IEc 350, IEc 356, IEc 385, IEc 386, IEc 391 and IEc 396 matured early (64 – 84 days) and dwarf stature in plant height (54-116 cm) comparing to all other accessions. However, these accessions were expressed low to moderate yield (3.16 – 27.36 g) than the checks. Therefore, these traits can be considered as useful in the breeding program for developing the early maturing genotypes through hybridization breeding methods. Considering the grain yield per plant among the 40 accessions, three accessions like M5P1 (52.6 g), M36P1 (52.93g) and M37P1 (50.86 g) recorded high grain yield than checks (MDU 1- 48.07 g and CO (Kv) 2 – 49.90 g), but no significance difference.
Table 4. Mean performance of barnyard millet accessions at different environments, and pooled of three environments
Trait E1 E2 E3 PooledDays to flowering 63.74ab 60.42b 65.58a 63.24ab
Days to maturity 97.00a 96.34a 99.65a 97.66a
Grain yield per plant (g) 40.29a 35.99ab 23.34b 33.20ab
Length of flag leaf (cm) 29.03ab 29.04ab 17.68b 25.25a
Length of lower racemes 3.73a 3.03ab 2.15b 2.97ab
Length of inflorescence 20.26a 17.28ab 15.27b 17.60ab
Length of nodes 16.86a 11.82ab 8.71b 12.46ab
Length of peduncle 15.17a 10.77ab 6.33b 10.76ab
Number of tillers 16.44a 12.55b 13.16ab 14.05ab
Number of nodes 6.53ab 7.51a 5.91b 6.65ab
Number of racemes 43.17ab 48.90a 37.43b 43.17ab
Plant height 148.47a 135.86ab 75.86b 120.07ab
Stem diameter 2.77ab 3.12a 1.95b 2.61ab
Single ear head weight 9.83a 9.68a 4.06b 7.86c
Thousand grain weight 3.39b 4.33a 3.44b 3.72b
Width of flag leaf 2.76a 2.77a 2.07a 2.54a
Width of inflorescence 3.66a 3.07a 2.54b 3.09a
‡Means with the same letter within row are not significantly different at P≤ 0.05
D2 statistics is a very useful statistical measure in multivariate analysis and it is an important biometric tool for plant breeders to utilize its applications in the field of classification and clustering Mahalanobis, (1936). The D2
analysis resulted in six major clusters and the cluster I had the maximum number of fifteen accessions, followed by cluster IV that had 12 accessions. Cluster VI had 7 accessions; and Cluster II, III and Cluster IV had two accessions each. Interestingly, all the early maturing
accessions were fallen into the Cluster V which indicated that these accessions are closely diverged.
The mean values of various traits of pooled environments based on D2 values are presented in Table 5. Cluster V had the accessions which recorded low mean values for many traits, like dwarf plant height (89.54 cm), early flowering (4.53 days), early maturity (74.40 days), the number of nudes (5.19), stem diameter length (1.30 cm),

EJPB
532https://doi.org/10.37992/2020.1102.089
Prabu et al.,
flag leaf length (19.81 cm), flag leaf width (1.82 cm), inflorescence length (13.40 cm), width of inflorescence (2.23 cm), length of lower racemes (2.60 cm), the number of racemes (27.69), thousand grain weight (3.54 g), single ear head weight (3.86 g) and grain yield per plant (16.40 g), whereas, it had high mean values for peduncle length (12.00 cm). All Clusters except Cluster V, contained a high mean value for plant height (> 130 cm – 138.09 cm). Cluster I, II and VI had accessions that had high mean value for days to first flowering (late flowering - > 71 – 73 days) and all Clusters except Cluster V also had a high mean value for days to maturity (107-110 days). Similarly, the high mean value for the number of nodes was observed for Clusters I, II, III, IV and VI, except Cluster V. Almost all the Clusters had contained maximum mean values for length of nodes. Cluster III contained the accessions that
had the low mean value for the number of tillers (11.97). The accessions with higher mean value for the traits such as, stem diameter (> 3- 3.63 cm), flag leaf length (26.46 – 30.44 cm), flag leaf width (2.72-3.36 cm), inflorescence length (17.86-21.62 cm), width of inflorescence (2.23-3.71 cm), length of lower racemes (2.92-3.49 cm), the number of racemes (48.44 - 54.32), thousand grain weight (> 3 – 3.94 g), single ear head weight (9.95 – 11.68 g) and grain yield per plant (45 – 51.51 g) for all the Clusters except Cluster V. Cluster I had accessions which had a medium mean values for single ear head weight (8.73 g) and grain yield per plant (35.10 g). The accessions contained high mean values (Clusters I, II, III, IV and VI) for grain yield per plant had taken long days to harvest (lately matured), indicating that the late maturing accessions are high yielding Arunachalam and Vanniarajan (2012).
Table 5. Mean values of various traits based on pooled of three environments
Cluster Number
PH DF DM NN LON NBT SD LFL WFL LOI WOI LLR LOP NOR TGW SEW GY_P
C I 130.21 72.56 107.63 7.08 12.29 14.37 3.03 26.46 2.72 19.07 3.31 2.92 9.94 48.44 3.82 8.73 35.10C II 136.65 72.75 107.05 7.10 13.31 14.29 3.29 30.44 2.97 21.62 3.61 3.38 9.70 50.98 3.70 9.95 44.24C III 132.73 69.85 109.35 7.92 12.81 11.97 3.63 28.46 3.36 18.78 3.71 3.13 9.30 54.32 3.68 11.68 49.86C IV 132.82 67.80 108.70 7.73 11.66 13.52 3.62 28.61 2.98 17.86 3.59 3.21 10.27 51.93 3.94 11.31 51.51C V 89.54 43.53 74.40 5.19 11.82 13.49 1.30 19.81 1.82 13.40 2.23 2.60 12.00 27.69 3.54 3.86 16.40C VI 138.09 71.33 107.27 7.43 13.89 15.08 3.22 28.47 2.88 20.11 3.59 3.49 10.92 50.44 3.81 10.17 45.00
Note: DF – Days to Flowering, DM – Days to Maturity, GY_P – Grain Yield per Plant, LFL – Length of Flag Leaf, LLR - Length of Inflorescence; LON – Length of Node; LOP – Length of Peduncle; NBT – Number of Basal Tillers; NN – Number of Nodes; NOR – Number of Racemes; PH – Plant Height; SD – Stem Diameter; SEW – Single Ear head Weight; TGW – Thousand Grain Weight; WFL – Width of Flag Leaf; WOI – Width of Inflorescence
The distances of inter and intra cluster are presented in Table 6. The inter cluster distance was peak between cluster III and V (D= 120.698) and the maximum intra-cluster distance was recorded in cluster V (D=47.218). This implicit that these clusters have the accessions with greater genetic divergence Patil and Kale (2013). With reference to the traits contributions to the genetic divergence (Table 7), the most important trait grain yield per plant (51.92 %) showed its maximum contribution to genetic divergence. The days to maturity (23.72%) stood
up with second place for its contribution, followed by stem diameter (6.54 %), thousand grain weight (6.03 %), and single ear head weight (4.49%). This clearly indicated that the selection of accessions from the genetically diverged groups by the plant breeders, must classify the resources on the basis of traits performance such as grain yield per plant, days to maturity, stem diameter, thousand grain weight and single ear head weight as they implied with greater contribution towards divergence.
Table 6. Inter and Intra D square cluster distances of barnyard millet accessions based on pooled of three environments
C I C II C III C IV C V C VIC I 23.98 22.865 27.795 29.266 120.853 28.507C II 13.157 21.15 25.277 124.487 22.322C III 13.794 16.364 127.492 24.968C IV 13.954 120.698 26.138C V 47.218 120.932C VI 28.233
Relative contribution of each trait towards the genetic diversity is presented in Table 7. The rank was allotted to individual traits based on its contribution to the total genetic divergence. The major contribution was expressed by grain yield per plant (51.92 %), followed by days to
maturity (23.72 %). These two traits covered 75.64 % altogether to the total divergence. Stem diameter (6.54 %) and thousand grain weight (6.03 %) had contributed almost equally to the genetic divergence, followed by single ear head weight (4.49 %) and inflorescence width (3.72

EJPB
533https://doi.org/10.37992/2020.1102.089
Prabu et al.,
Sl.No Trait No. of first rank % contribution1 Days to flowering 0 0.002 Days to maturity 185 23.723 length of flag leaf 0 0.004 Length of lower racemes 6 0.775 Length of inflorescence 2 0.266 Length of nodes 2 0.267 Length of peduncle 0 0.008 Number of basal tillers 0 0.009 Number of nodes 1 0.1310 Number of racemes 2 0.2611 Plant height 1 0.1312 Stem diameter 51 6.5413 Single ear head weight 35 4.4914 Thousand grain weight 47 6.0315 Width of flag leaf 14 1.7916 Width of inflorescence 29 3.7217 Grain yield per plant 405 51.92
TOTAL 100.00
Table 7. Contribution of each character to divergence, based on pooled of three environments
Table 8. Stability analysis through GGE biplot for 40 accessions
Sl.No
Traits Closer ideal genotypes
Nature of stability
Proximal ideal genotypes Nature of stability
1 Days to flowering
M28P1 (G33)
Stable ACM-15-353 (G39), M37P1(G35), M36P1(G34), M27P1 (G32), M18P1 (G31), M12P1 (G30), M3P2 (G28), M1P1 (G26), IEc350 (G21), ACM 161 (G1), T5 (G2), ACM 110 (G3), IEc52 (G4), GECH 10 (G5), ACM 333 (G11), GECH15 (G12), IEc672 (G13), IEc356 (G20)
Stable/ Partially stable
MDU 1 (G 37) , ACM-15-343 ( G38) Partially stable2 Days to
maturityM28P1 (G 33)
Stable ACM 161 (G1), T5 (G2), ACM 110 (G3), IEc52 (G4), GECH 10 (G5), IEc167(G6), ACM 331(G7), ACM 295 (G8), IEc568 (G9), IEc166 (G10), ACM 333 (G11), GECH15 (G12), M1P1(G26), M2P1(G27),M3P2(G28),M5P1(G29),M12P1 (G30), M18P1 (G31), M27P1 (G32), M36P1 (G34), M37P1 (G35), M38P1 (G36), ACM 15-343 (G38), ACM-15-353 (G39).
Stable/ Partially stable
3 Grain yield per yield
None None ACM 110 (G3), GECH 10 (G5), M38P1 (G36), M5P1(29), IEc52 (G4), MDU 1(G37), M37P1 (G35), M27P1(32), IEc568 (G9), T5 (G2), IEc296 (G 24)
Partially stable
4 Length of inflorescence
M18P1 (G31), M27P1 (G32)
Stable ACM 331 (G7), M1P1(G26), M3P2 (G28) Stable
M5P1 (G29), ACM 295 (G8), ACM-15-353 (G39), MDU 1 (G37), M2P1 (G27)
Partially stable
5 Number of basal tillers
IEc71 (G23) Stable IEc672 (G13) Stable
IEc166 (G10), IEc296 (G24), GECH 10 (G5). Partially stable6 Plant height CO (Kv) 2
(G40)Stable ACM 161 (G1), T5 (G2), IEc167 (G6), ACM 331 (G7), ACM
295 ( G8), ACM 333 (G11), M5P1 (G29), M12P1 (G30), M18P1 (G31), M27P1 (G32), M28P1(G33), M36P1(G34),M37P1(G35), M38P1(G36),MDU 1(G37), ACM-15-343 (G38), ACM-15-353 (G 39)
Partially stable
7 Thousand grain weight
IEc52 (G4) Partially stable
IEc108 (G 17), M3P2 (G 28) Partially stable
EJPB
534https://doi.org/10.37992/2020.1102.089
Prabu et al.,
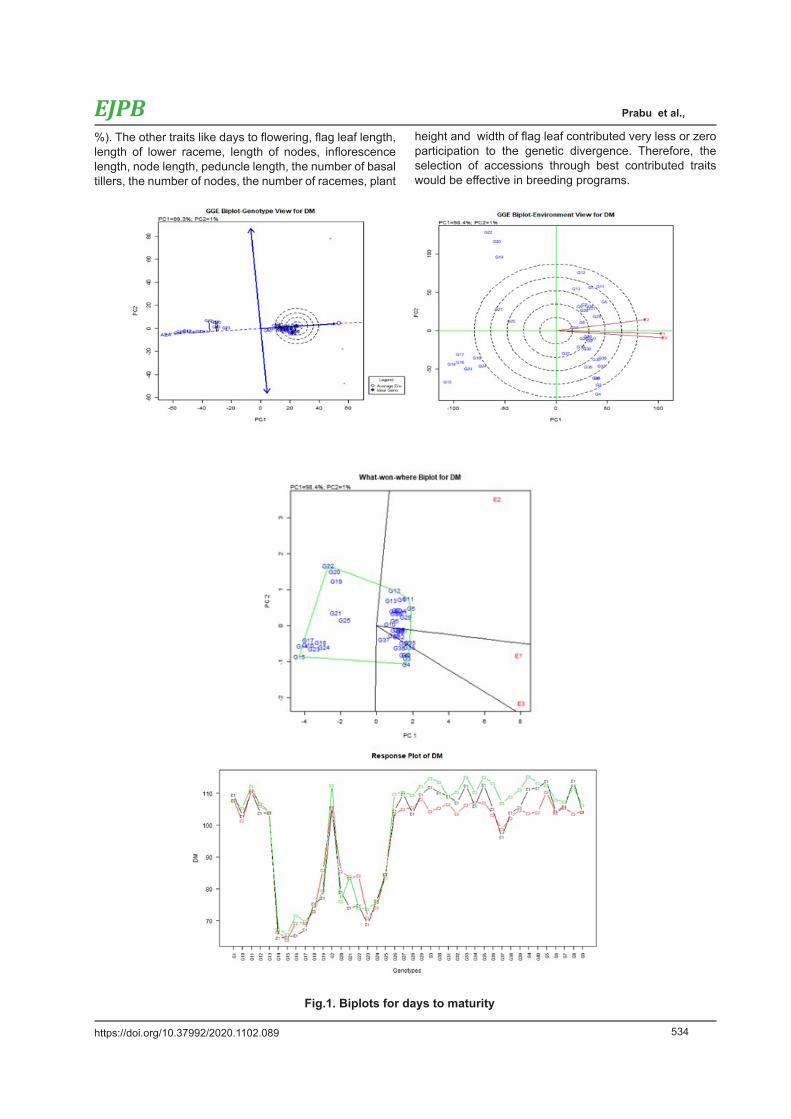
%). The other traits like days to flowering, flag leaf length, length of lower raceme, length of nodes, inflorescence length, node length, peduncle length, the number of basal tillers, the number of nodes, the number of racemes, plant
height and width of flag leaf contributed very less or zero participation to the genetic divergence. Therefore, the selection of accessions through best contributed traits would be effective in breeding programs.
Fig.1. Biplots for days to maturity
Fig.1. Biplots for days to maturity

EJPB
535https://doi.org/10.37992/2020.1102.089
Prabu et al.,
Fig. 2. Biplots for grain yield per plant
Fig. 2. Biplots for grain yield per plant

EJPB
536https://doi.org/10.37992/2020.1102.089
Prabu et al.,
The biplot provides information on relative performance of genotypes between the environments and helps to divide the target environment into multiple mega environments. The accessions pertaining for its favorable environment were furnished in Table 9. On the basis of environment, some accessions respond well to a specific environment. Considering the yield, ACM 331, M5P1 and M38P1 were most suitable to E1 for grain yield per plant, while the accessions like ACM-15-353, CO (Kv) 2, IEc 568 and M37P1 suited for E2. In E3, ACM 110 and M12P1 were found to be most suitable. From the stability analysis, it is found that, none of the accessions were stable in all three environments for grain yield per plant which indicated that the influence of environmental factors played a major role.
From the experiment results, it is evident that there is existence of genetic diversity of morphological and agronomic characters in the barnyard millet germplasm. We could identified some of the early maturing genotypes (64-80 days) irrespective of good grain yield, which could be efficiently used in breeding programmes for improvement of this crop. The stability analysis indicated that, none of the accessions were stable in all three environments for grain yield per plant due to the influence of environmental factors. Thus, the differentiation of germplasm based on morphologically similar and presumably genetically similar groups is helpful for selecting parents for crossing.
The stability analysis for maturity and grain yield are depicted in Fig. 1 and 2, for duration of maturity and grain yield, respectively and Table 8 illustrates stability analysis through GGE biplot for better understanding of the traits. From the table, it is evident that there are few accessions were positioned as closer ideal genotypes for the traits like days to flowering (M28P1), days to maturity (M28P1), length of inflorescence (M18P1 and M27P1), the number of basal tillers (IEc 71), plant height (CO (Kv) 2) and thousand grain weight (IEc 52). All the traits except
thousand grain weight (partially stable) were exhibited stable performance, whereas, the trait, grain yield per plant did not identify as stable performer. About 24 accessions were proximal to ideal accession for days to maturity, while 11 accessions were proximal for grain yield per plant including MDU 1, M5P1, M36P1 and M37P1, which are exhibited partially stable performance. Hence, the accessions like MDU 1, M5P1, M36P1 and M37P1 are identified as better stable performer for grain yield that could be recommended for utilizing crop improvement program.
Table 9. What-won-where bi-plot for 40 accessions in three environments
Sl.No
Character E1 E2 E3
1 Days to flowering M28P1 (G 33) M5P1 (G 29) M37P1 (G 35)2 Days to maturity M37P1 (G35), M27P1 (G 32) GECH 10 (G5), ACM 333
(G 11), GECH15 (G 12)IEc52 (G 4), ACM 110 (G 3), M27P1 (G 32) M37P1(G 35)
3 Grain yield per plant M38P1(G36), ACM 331 (G 7), M5P1 (G 29)
M37P1 (G 35), ACM-15-353 (G 39), CO (Kv) 2 (G
40), IEc568 (G 9)
ACM 110 (G 3), M12P1 (G 30)
4 Length of inflorescence
ACM 295 (G 8), IEc568 (G 9), GECH 10 (G 5)
M18P1 (G 31), M27P1 (G 32)
MDU 1 (G 37)
5 Number of basal tillers
IEc71 (G 23), ACM-15-343 (G 38)
GECH 10 (G 5) GECH 10 (G 5)
6 Plant height ACM 295 (G 8), IEc167 (G 6), IEc568 (G 9)
M18P1 (G 31), M2P1 (G 27), CO (Kv) 2
CO (Kv) 2 (G 40), M2P1 (G 27), M18P1 (G 31
7 Thousand grain weight
M36P1 (G 34) IEc52 (G 4), M3P2 (G 28) M36P1 (G 34)
ACKNOWLEDGEMENTThe authors are much grateful to ICRISAT, Hyderabad, Telangana for providing seed materials of barnyard millet germplasm accessions for research purpose.
REFERENCE
Abe, T., Fukami, M. and Ogasawara, M. 2011. Effect of hymexazole (3-hydroxy-5-methylisoxazole) on cadmium stress and accumulation in Japanese millet (Echinochloa frumentacea Link). Journal of Pesticide Science.; 36 (1): 48-52. [Cross Ref]
Arunachalam P and Vanniarajan C. 2012. Genetic parameters and quantitative traits association in barnyard millet (Echinochloa frumentacea). Plant Archives, 12(2), 691-694.
Bandyopadhyay, B.B., 2009. Evaluation of Barnyard millet cultivars for fodder yield under single and double cut treatments at higher elevation of hills. Agricultural Science Digest, 29(1), pp.66-68.
Bhat B, Tonapi V, Rao B, Singode A, Santra D and Johnson, J. 2018. Production and utilization of millets in India. Paper presented at the Proceedings of the International Millet Symposium and the 3rd International Symposium on Broomcorn Millet (3rd ISBM), Fort Collins, CO, USA.

EJPB
537https://doi.org/10.37992/2020.1102.089
Prabu et al.,
Bioversity International. 1983. Echinochloa millet descriptors. In.
Hadimani, NA, and NG Malleshi. 1993. “Studies on milling, physico-chemical properties, nutrient composition and dietary fibre content of millets.” Journal of Food Science and Technology (India) 30 (1):17-20.
Mahalanobis P C. 1936. On the generalized distance in statistics.
Muthamilarasan, Mehanathan, Annvi Dhaka, Rattan Yadav, and Manoj Prasad. 2016. “Exploration of millet models for developing nutrient rich graminaceous crops.” Plant Science 242 : 89-97. [Cross Ref]
Nirmalakumari, A, A Subramanian, P Sumathi, N Senthil, N Kumaravadivel, A John Joel, K Mohanasundaram, AR Muthiah, TS Raveendran, and T Raguchander. 2009. “A high yielding kudiraivali variety CO (KV) 2.” Madras Agric J 96:319-321.
PBTools, v. 2014. Biometrics and Breeding Informatics.
Patil J, and Kale, A. 2013. Study of genetic diversity in finger millet (Elesuine coracana L.) genotypes using RAPD markers. Int. J. Integr. Sci. Innov. Technol, 2, 31-36.
Patterson, H. D., and Thompson, R. 1971. Recovery of inter-block information when block sizes are unequal. Biometrika, 58(3), 545-554. [Cross Ref]
Radhakrishna Rao, C. 1952. Advanced statistical methods in biometric research: A Division Of Macmillan Publishing Co, Inc New York; Collier-Macmillan.
Ruiz-Santaella, J. P., F. Bastida, A. R. Franco, and R. De Prado. 2006. “Morphological and Molecular Characterization of Different Echinochloa spp. and Oryza sativa Populations.” Journal of Agricultural and Food Chemistry 54 (4):1166-1172. [Cross Ref]
Schonfeld P and Werner H J. 1986. ökonomische progress-, entscheidungsund gleichgewichts- modelle. In: Krelle, W., editor. VCH Verlagsgesellschaft, Weinheim, Germany. p. 251–262
Sherif, Al, and Emad Ali. 2007. “Echinochloa colona (L.) Link., A Promising species to cultivate Salt Affected Soils in Arid lands.” American-EuroAsian J. Agric. & Environ. Sci 2 (6).
Veena, B, BV Chimmad, RK Naik, and G Shantakumar. 2005. “Physico-chemical and nutritional studies in barnyard millet.” Karnataka J Agril Sci 18 (1):101-105.