electron-donor and affinity constants and their application to the inhibition of...
TRANSCRIPT

INHIBITION OF AChE BY CARBAMATES
Mazzocchi, P. H., Rao, M. P., J. Agric. Food Chem. 20,957 (1972). Moilanen, K. W., Crosby, D. G., J. Agric. Food Chem. 20, 950
Peterson, J. I., Anal. Biochem. 31,204 (1969). Peterson, J. I., Wagner, F., Siegel, S., Nixon, W., Anal. Biochem.
Powers, L. J., J . Pharm. Sci. 60, 1425 (1971).
Robinson, H. J., Silber, R. H., Graessle, 0. E., Tez. Rep. Bid. Med
Rosen, J . D., Siewierski, M., J. Agric. Food Chem. 20,434 (1972). Su, G. C. C., Zabik, M. J., J . Agric. Food Chem. 20,642 (1972).
Received for review October 18,1974. Accepted February 20,1975.
27, (Suppl. 21,537 (1969). (1972).
31,189 (1969).
Electron-Donor and Affinity Constants and Their Application to the Inhibition of Acetylcholinesterase by Carbamates
Bogumil Hetnarski* and Richard D. O’Brien
Twenty-three methylcarbamates were studied, in these factors accounted for most of the varia- and the effects of variations in their hydrophobici- tion in enzymic effects, but the compounds fell ty and ability to form charge-transfer complexes into two distinct classes with respect to the rela- upon their affinity, reactivity, and overall potency tion between, for instance, reactivity and affinity. for acetylcholinesterase were explored. Variations
Most carbamates inhibit acetylcholinesterase (AChE) by reacting with i t in two steps (Wilson e t al., 1961; O’Brien et al., 1966; O’Brien, 1968). The first step is characterized by the dissociation constant for the reversible complex of AChE and the carbamate (Michaelis complex); the second involves carbamylation of a serine hydroxyl in the AChE active site and is usually characterized by the reaction con- stant, h2. If C is the methylcarbamyl group and X is the leaving group, the inhibition process may be represented as follows:
where h3 is the rate constant of enzyme regeneration. The overall potency of the carbamate is measured by hi, which equals k&d (Main, 1964).
In para-substituted phenyl methylcarbamates, the varia- tion in potency (for instance, as measured by Zjo, the con- centration of a carbamate to inhibit AChE by 50% in a fixed time) is primarily due to variation in Kd (O’Brien e t al., 1966). For 1 2 such compounds, we showed that their 1 5 0
values were closely correlated with the ability of their aro- matic portions to donate electrons to a model electron ac- ceptor (tetracyanoethylene [TCNE]) and form charge- transfer complexes (CTC) (Hetnarski and O’Brien, 1972). The CTC formation ability is measured by K,, the associa- tion constant for CTC formation. Later we showed (Het- narski and O’Brien, 1973) that for seven arylmethyl methylcarbamates, which are virtually noncarbamylating, and therefore simple reversible inhibitors, their Kd and K , values were excellently correlated.
In the present study we have extended this approach to additional para-substituted aromatic methylcarbamates and also to nine meta-substituted compounds. We have also introduced new constants, the electron-donor and af- finity factors, to simplify the quantitation of structure-ac- tivity relation, and to examine the processes in question from the viewpoint of the linear free-energy relationship.
Section of Neurobiology and Behavior, Cornel1 Universi- t y , Ithaca, New York 14850.
The current work also includes investigations on kinetic constants of the second stage ( k 2 ) , and hence covers the whole inhibition process, characterized by k ; .
METHODS Kd values were determined by the zero-time method
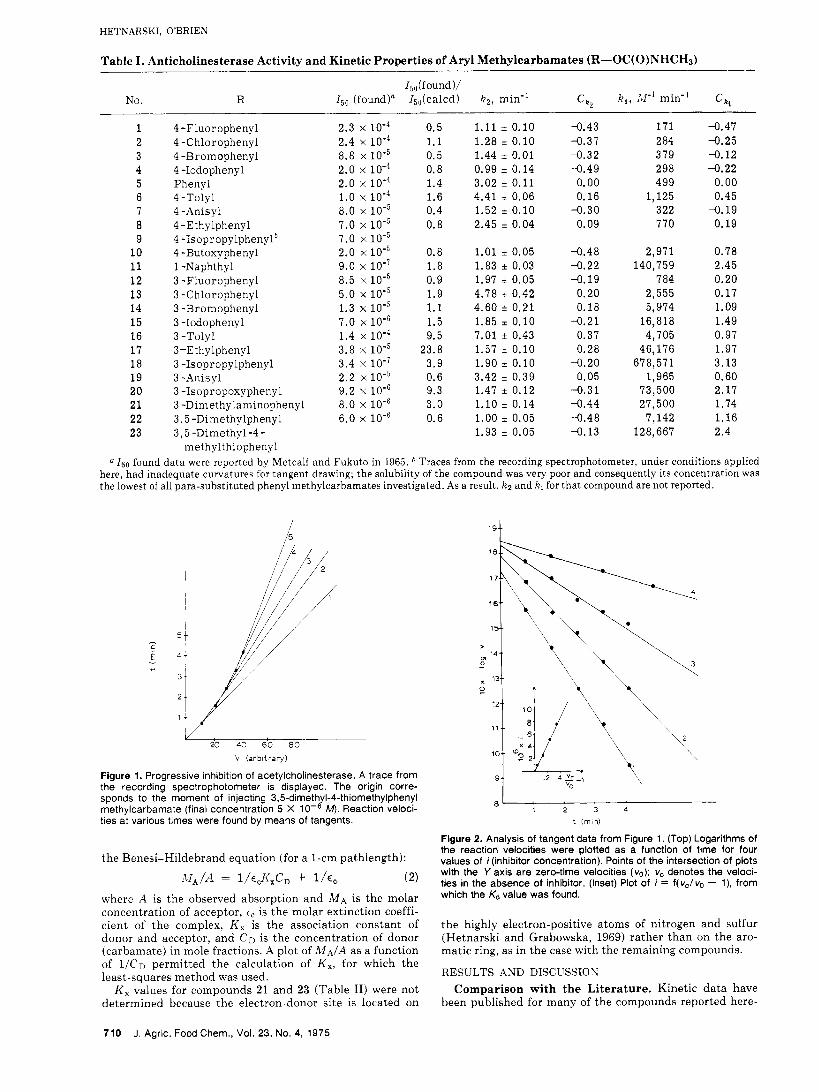
(O’Brien, 1968; Hart and O’Brien, 1973). The assays were performed a t 25’ by the following procedure, modified from Ellman et al. (1961). A mixture was prepared consist- ing of 15 vol of buffer (0.2 M sodium phosphate, pH 7.6), 0.2 vol of acetylcholine chloride (Sigma) designed to give a final concentration of 0.73Km and 0.88Km (K, = 0.29 X lo-:] M , found under conditions described here) in freshly distilled water, and 1 vol of a 0.014 M solution of Nbsz [5,5’-dithiobis(2-nitrobenzoic acid)] plus 0.02 M sodium carbonate in 0.2 M sodium phosphate buffer (pH 7 ) . Of this mixture, 1.62 ml was placed into the cuvette and 1 ml of 1.5 unitdm1 of bovine erythrocyte AChE (Sterwin) solu- tion in the aforementioned buffer solution (pH 7.6) was added; the final concentration of enzyme was 0.57 unit/ml, of Nbsn 0.53 mM, and of sodium phosphate (the dominant ions) 0.2 M. The final pH was 7.56. The reaction was fol- lowed over 0.5 min a t 412 nm using a Beckman Acta I11 spectrophotometer, then 0.02 ml of a freshly prepared solu- tion of inhibitor was added, the contents of the cuvette were mixed instantly, and readings were taken a t 412 nm (Figure 1). In order to find Kd values we plotted i (inhibi- tor final concentration) against(u,/uo) - 1, where u, and uo are the reaction velocities in the absence and presence of an inhibitor, respectively. Four or five concentrations of inhib- itor were used. The u o data were obtained by extrapolating velocities of the substrate hydrolysis to zero time, using the plot of the logarithm of hydrolysis rate as a function of time (Main, 1967) (Figure 2). The inhibitor concentrations ranged between lo-“ and M , depending on solubility and potency; the actual range for each compound is in Table 11.
K , values (association constants of CTC between aryl methylcarbamates and TCNE) were determined by the Be- nesi-Hildebrand (1949) method in 1,2-dichloroethane a t 23’ (Hetnarski, 1964, 1965). The method involved the preparation of a series of concentrations of carbamates (acting as donors) in solvent, with mole fractions of from 0.003 to 0.007. Each was made 5 X M with respect to TCNE. The resultant absorption was measured and obeyed
J. Agric. Food Chem., Vol. 23, No. 4, 1975 709
HETNARSKI, O'BRIEN
Table I . Anticholinesterase Activity and Kinetic Properties of Aryl Methylcarbamates (R-OC(O)NHCHd
15df ound )/ No. R I,, (found)= 15,(calcd) k 2 , min" ck, k , , W' min-' c k ,
1 2 3 4 5 6 7 8 9
10 11 12 13 14 15 16 17 18 19 20 21 22 23
4 -Fluorophenyl 2.3 x 4 -Chlorophenyl 2.4 x lo-' 4 -Bromophenyl 8.8 x 4 -1odophenyl 2.0 x 10'4 Phenyl 2.0 x 1 0 - ~ 4 -Tolyl 1.0 x 10⁻⁴ 4 -Anisyl 8.0 x 10-~ 4 -Ethylphenyl 7.0 x 1 0 - ~ 4 -Isopropylphenyl* 7 .0 x 4 -Butoxyphenyl 2.0 x 10⁻⁵ 1 -Naphthyl 9.0 x 10⁻⁷ 3 -Fluorophenyl 8.5 x 10⁻⁵ 3 -Chlorophenyl 5.0 x 10⁻⁵ 3 -Bromophenyl 1.3 x 10⁻⁵ 3 -1odophenyl 7.0 x 3 -Tolyl 1.4 x lo-' 3-Ethylphenyl 3.8 x lo-' 3 -1sopropylphenyl 3.4 x l o - ' 3 -Anisyl 2.2 x 10⁻⁵ 3 -1sopropoxyphenyl 9.2 x 3 -Dimethylaminophenyl 8.0 x 3,5 -Dimethylphenyl 6.0 x 3 , 5 -Dimethyl -4 -
methylthiophenyl
0.5 1.1 0.5 0.8 1.4 1.6 0.4 0.8
0.8 1.8 0.9 1.9 1.1 1.5 9.5
23.8 3.9 0.6 9.3 3.0 0.6
1.11 f 0.10 -0.43 1.28 i 0.10 -0.37 1.44 i 0.01 4 . 3 2 0.99 i 0.14 -0.49 3.02 i 0.11 0.00 4.41 f 0.06 0.16 1.52 i 0.10 -0.30 2.45 i 0.04 0.09
171 -0.47 2 84 -0.25 379 -0.12 298 -0.22 499 0.00
1,125 0.45 322 -0.19 770 0.19
1.01 i 0.05 4 . 4 8 1.83 f 0.03 -0.22 1.97 i 0.05 -0.19 4.78 i 0.42 0.20 4.60 i 0.21 0.18 1.85 i 0.10 -0.21 7.01 i 0.43 0.37 1.57 f 0.10 4 . 2 8 1.90 * 0.10 4 . 2 0 3.42 i 0.39 0.05 1.47 * 0.12 -0.31 1.10 * 0.14 -0.44 1.00 * 0.05 -0.48 1.93 i 0.05 4 . 1 3
2,971 0.78 140,759 2.45
784 0.20 2,555 0.17
16,818 1.49 4,705 0.97
46,176 1.97 678,571 3.13
1,965 0.60 73,500 2.17 27,500 1.74
7,142 1.16
5,974 1.09
128,667 2.4
a 150 found data were reported by Metcalf and Fukuto in 1965. Traces from the recording spectrophotometer, under conditions applied here. had inadequate curvatures for tangent drawing; the solubility of the compound was very poor and consequently its concentration was the lowest of all para-substituted phenyl methylcarbamates investigated. As a result, k z and k, for that compound are not reported.
V (arb i t rary)
Figure 1. Progressive inhibition of acetylcholinesterase. A trace from the recording spectrophotometer is displayed. The origin corre- sponds to the moment of injecting 3,5-dimethyl-4-thiomethylphenyl methylcarbamate (final concentration 5 X M). Reaction veloci- ties at various times were found by means of tangents.
the Benesi-Hildebrand equation (for a 1-cm pathlength):
where A is the observed absorption and M A is the molar concentration of acceptor, tC is the molar extinction coeffi- cient of the complex, K , is the association constant of donor and acceptor, and CD is the concentration of donor (carbamate) in mole fractions. A plot of M*/A as a function of 1/Cn permitted the calculation of K,, for which the least-squares method was used.
K , values for compounds 21 and 23 (Table 11) were not determined because the electron-donor site is located on
> 14-
0 - x '3- 0
11-
10.-
9-
\.,
t (min)
Flgure 2. Analysis of tangent data from Figure 1. (Top) Logarithms of the reaction velocities were plotted as a function of time for four values of i (inhibitor concentration). Points of the intersection of plots with the Y axis are zero-time velocities (YO) ; v, denotes the veloci- ties in the absence of inhibitor. (Inset) Plot of i = f(vJv0 - l) , from which the Kd value was found.
the highly electron-positive atoms of nitrogen and sulfur (Hetnarski and Grabowska, 1969) rather than on the aro- matic ring, as in the case with the remaining compounds.
RESULTS AND DISCUSSION Comparison with the Literature. Kinetic data have
been published for many of the compounds reported here-
710 J. Agric. Food Chem., Vol. 23, No. 4, 1975

INHIBITION OF AChE BY CARBAMATES
Table 11. Affinity for AChE and Some Physicochemical Properties of Aryl Methylcarbamates (ROC(O)NHCH3)
Range of carbamate concns
applied f o r Kd K,(calcd), &lax,
No. determinations, 121 &(found), mdV1 mMa C, K,(mole fract1-l nm CT 7
1 2 3 4 5 6 7 8 9 10 11 12 13 14 15 16 17 18 19 20 21 22 23
1 o - ~ -1 o . ~
10-~-1 o - ~ 1 0 - ~ - 1 0 - ~ 10-~-1 o - ~ 10-~-10-~ 10-~-10-~ 10-~-10-~ 10-~-1 o - ~
10-~-10-~ 10-~-1 o - ~ 10-~-1 o - ~ 10-~-10-~ 10-~-1 o - ~ 10-*-1 o - ~ 2.5 ~10-~-10-~ 10-~-10-~ 10-~-10-~ 10-~-10-~
10-~-10’~ 10-~-10-~
10-3-10-4
5~10-~-7.5~10-~
2.5 x x
6.49 1 1.30 4.51 10.96 3.80+0.16 3.32 i 0.23 6.05 * 0.85 3.92 f 0.36 4.71 i 0.26 3.18i0.07 0.85 1 0.22 0.34 1 0.01 0.013 f 0.001 2.51 1 0.16 1.87 1 0.12 0.77 i0.08 0.1210.01 1.49 i 0.49 0.35 *0.06 0.0028 * 0.0003 1.74 1 0.03 0.020 i 0.0001 0.04i0.001 0.14 * 0.01 0.015 i 0.0002
6.91 4.97 3.33 3.07 5.88 3.78 4.56 2.80 1.00 0.49 0.38 2.70 1.61 0.60 0.36 1.09 0.42 4.25 1.78 0.24
-0.03 0.13 0.20 0.25 0.00 0.19 0.11 0.28 0.85 1.25 2.67 0.38 0.51 0.90 1.74 0.61 2.25 3.33 0.54 2.48 2.18 1.63 2.61
5.5 * 2.1 7.6 1 1.5 12.91 1.0 l O . O * 6.2 14.2 1 3.6 23.1 f 3.9 36.4 * 3.1 19.9 k 3.5 31.1 1 1.7 39.1 i 3.0 75.51 10.6 5.61 1.4 4.21 1.9 14.2 1 1.1 10.3 i 1.6 27.7 13.7 17.7 + 2.6 18.5 i 6.4 31.91 8.2 30.2 1 2.3
46.6+3.4
3 57 3 60 400 420 365 405 510 405 405 525 540 3 60 365 390 395 400 4 00 4 00 495 490
430
-0.41 4.27 4.04 4.15 0.00 0.21 0.41 0.15 0.34 0.44 0.73 -0.42 -0.53 0.00 4.14 0.29 0.10 0.12 0.35 0.33
0.51
a K d found was calculated from eq 10.
in; we now compare our findings with them. Table I lists, for all except compound 23, the values of ZSO reported by Metcalf and Fukuto in 1965 for a 10-min incubation time. If decarbamylation is negligible, then using the symbols of the present paper, one can rewrite eq (6) of Main (1964) which was applied to the precisely parallel case of organo- phosphates:
( 3)
where i is the inhibitor concentration, t is the incubation time, and h log V is the change in the logarithm of the en- zyme velocity a t time t . For 50% inhibition, i is the 1 5 0 and V is halved, so A log V = 0.3, and:
l/i = 1/Kd[(tk2/2.3 A log 19 - 11
Z,,(calcd) = Kd/[(tk2/0.69) - 11 (5) In view of the fact that in a 10-min period decarbamylation plays a significant role, the agreement of our calculated 1 5 0 with the literature values is surprisingly good: for the 21 cases which can be compared, the ratio (literature data/cal- culated data) averages 3.1, and is usually (Le. in 15 cases) within the range of 0.5-2.0.
Hastings et al. (1970) report for compounds 5, 11, and 18 values of lzz which are greater than ours by factors of 2, >11, and 42, and values of Kd which are greater than ours by factors of 4, >38, and 0.2. We are unable to account for these differences. Our values agree quite well with those we reported previously (O’Brien et al., 1966) for seven methyl- carbamates (1, 2, 5, 6, 7 , 11, and 22) using a quite different method: those Kd values averaged l.7-fold less than re- ported herein, and those k z values averaged 1.2-fold less.
Relations between S t r u c t u r e and Enzyme Activity. As a measure of the electron donor capacity of aromatics we have proposed the CT value (Hetnarski and O’Brien, 1975) which is a new constant, defined similarly to the Hammett u constant. as follows:
CT = log K, - log KH
0.15 0.70 1.02 1.26 0.00 0.52 4.04 0.97 1.40 1.46 1.12 0.13 0.76 0.94 1.15 0.51 1.30 1.30 0.12 0.92
1.02
( 6)
where K , is the association constant for CTC formation with tetracyanoethylene of the substituted compound and K H is that for the unsubstituted compound, in this case phenyl methylcarbamate. There is a general parallelism be- tween substituent effects upon CT and Hammett’s 0, in that electron-withdrawing substituents will tend to deplete the electrons of the whole x system, and hence reduce CTC formation and affect CT, and also to reduce the electron density a t a reaction center, and hence reduce (r. But the substituent effects upon CT are more sensitive to steric fac- tors, and so the parallelism is incomplete; thus, bromine in the meta position had no effect on CT (Table 11) but had a substantial effect upon u. CT provides a more direct com- parison if one’s interest is in TT complexes of any kind; fur- thermore, it can be applied to compounds not suited for (r
evaluation, such as ortho-substituted compounds and ex- tended three-dimensional molecules. The measurement of CT is particularly simple when a compound forms com- plexes which absorb in the visible region.
We found that the variation in affinity for the enzyme could be largely accounted for in terms of two factors only: variations in hydrophobicity and ability to donate x elec- trons to form CTC’s, as measured with a model acceptor (tetracyanoethylene) (Table 11). The relative contribution of these two factors varies in the series of inhibitors on which we presently report. We measured the hydrophobici- ty of each substituent by Hansch’s constant x (Leo et al., 1971), defined in a fashion analogous to the Hammett cr constant:
77, = log P, - log PH ( 7) where P, and PH are the partition coefficients (usually in the octanol-water system) of the substituted and the un- substituted phenyl methylcarbamates, respectively.
In order to examine whether a linear free-energy rela- tionship holds for complex formation between AChE and
J. Agric. Food Chem., Vol. 23, No. 4, 1975 711

HETNARSKI. O'BRIEN
I I
1 * . C T
Figure 3. Dependence of affinity for acetylcholinesterase, CA (eq 8), upon hydrophobicity, T (eq 7), and ability to form CTC, C, (eq 6).
60\,, 2 3 4 5 6 7 8 Kd calcd
Figure 4. Relation between calculated and found dissociation con- stants for the enzyme-inhibitor complex. & calculated values were obtained by eq 9 and 10: (0) meta-substituted compounds: (0) para- substituted compounds.
an inhibitor with respect to charge-transfer complex forma- tion, we defined the affinity constant for complex forma- tion, CA, as follows:
c, = log K," - log KaH ( 8) where K," is the affinity (l/Kd) of the substituted com- pound and K a H is that of the phenyl methylcarbamate.
We explored the dependencies of CA upon CT and T for para- and meta-substituted phenyl methylcarbamates and found that a linear free-energy relationship is satisfied in both cases over limited ranges; however, in each of them, graphs plotted on a three-dimensional device consisted of two planes. For example, in the case of meta-substituted phenyl methylcarbamates for the first four compounds (F, C1, CH30, and CH3 derivatives) the correlation coefficient was 0.999 and for the second five [Br, I, CzH5, (CH3)2CHO, and (CH3)&H] it was 0.956. These good correlations con- trast with r = 0.831 for the whole series. Because 7r and CT are independent vectors which vary in the same direction, it was possible to observe the two planes of the three-di- mensional model as two lines in a two-dimensional plot of CA = f(T + CT), Figure 3.
The broken-plane three-dimensional plots are well lin- earized by a semilogarithmic plot. With a computerized least-squares method we found for para-substituted phenyl methylcarbamates the following relatiohs:
.5 I t16
0' .5 C- W 8 - .5 ,
Figure 5. Lack of correlation between carbamylation constants (Ck2, eq 11) and ability to form CTC (CT, eq 6).
'5 -1 16 I ' .
/ Figure 6. Relation between carbamylation constant ( c k , , eq 11) and affinity of carbamates for enzyme (CA, eq 8).
K , =-(3 .476 i 0.359)CT - (2.645 i 0 . 2 2 1 ) ~ + 5.880 (9)
Y = 0.989, 17 = 11, s = 0.367 For meta-substituted phenyl methylcarbamates we found:
Kd = -(la228 0.357)CT - (1.960 0 . 2 7 1 ) ~ + 2.444 (10)
Y = 0.958, 12 = 9, s = 0.322 where r is the correlation coefficient, n is the number of compounds, and s is the standard deviation. From these equations we were able to calculate values of Kd for all 20 compounds, and compare them with the measured values. Figure 4 shows that there was an excellent correlation ( r = 0.990).
Relations between Structure and Carbamylating Activity. One might expect that electron-donating ring substituents would reduce the electrophilic character of the carbamyl carbon, and hence reduce kp. If so, attempts to improve the overall potency k , = kp/Kd, by introducing electron-donating substituents to improve Kd, might be offset by adverse effects on k2. Once again we defined a term, in this case ChL, to compare the relative kz values:
where k2X is the kp value for a substituted compound and h2H is for the parent phenyl methylcarbamate. A plot of
712 J. Agric. Food Chem., Vol. 23, No. 4, 1975

INHIBITION OF AChE BY CARBAMATES
Compounds whose K , is less than that for phenyl meth- ylcarbamate (i.e., with CA less than l), a series which con- tains virtually all the para-substituted and half of the meta-substituted compounds, showed a sharp positive cor- relation between C k g and CA, The remaining compounds all showed a less sharp positive correlation, and it is particu- larly noteworthy that Ck: , drops precipitously as CA passes through 1. The two series of compounds appear to follow two completely different dependencies. In both cases, im- proved affinity gives improved k2, suggesting that a close fit improves the effectiveness of the carbamylation step. The two kinds of dependence might imply two ways of fit- ting onto the enzyme surface.
In view of the fact that Ck2 is correlated with CA, which in turn is correlated with (C, + x ) , it was not surprising to
.find that c k 2 shows a relation to (CT + K) (Figure 7); the same broken line dependency is seen, but the scatter is much greater, suggesting that the primary effect upon k2 is determined by affinity, rather than that CTC-forming abil- ity and hydrophobicity exert a direct effect upon kp.
Relation between Structure and Overall Potency. For the designer of toxicants, the question of special impor- tance is the role of CT and K in determining overall poten- cy, measured by ki . In order to express ki in a relative loga- rithmic form we use the term Cki which we define as:
/ + 1 ’ 5 CT. II 1 1 5
0 8 , .15 18.
Figure 7. Approximate broken-line dependence of carbamylation constant (Ck2) upon hydrophobicity and CTC-forming ability (K + CT).
3 t
1 8 /I
I I
‘T Il. 20
17 9 I
I
Figure 8. Relation between overall anticholinesterase activity (Ck,, eq 12) and affinity of carbamate for enzyme.
I ; 11 I
I 2 0 .I
)I a 1 7
I , 15 /I
*I
12 I’ ..,’
14,‘
16,,f
19 ,’ 9
,I 0 6
J 3 o 6 ,’
X Z 2 , I
,610
/
Figure 9. Dependency of C,, vs. (G + K). Ck, is defined in eq 12.
C h r against CT (Figure 5 ) showed no correlation between these parameters, yet 122 was strongly sensitive to changes in affinity, showing a most unusual relationship (Figure 6). Values of Chr increased with increases in CA (the reverse of expectation).
(12) Cki = log k,X - log k,H
where kix is the ki value of a substituted compound, where- as kiH is that of the parent phenyl methylcarbamate. Be- cause ki = k 2 / K d , the outcome is determined by the combi- nation of the effects of CT and A upon k2 and K d . Figure 8 shows that the effect of CT upon ki is clearly different for para- and meta-substituted compounds. Figure 9 shows that insertion of K as well as CT greatly improves the ac- counting for variation in ki , and the effects upon para- and meta-substituted compounds again differ greatly, there being no overlap between the two series. The “broken-line” relationship, evident in the effect on CA (Figure 3), is still visible here.
ACKNOWLEDGMENT
ful laboratory assistance. The authors wish to thank Nancy Hogan Sayles for skill-
LITERATURE CITED Bender, M. L., Thomas, R. T.,J . Am. Chem. Soc. 83,4183 (1961). Benesi, H. A., Hildebrand, J. H., J . Am. Chem. SOC. 71, 2703
Ellman, G. L., Courtney, K. D., Andres, V., Jr., Featherstone, R.
Hart, G. J., O’Brien, R. D., Biochemistry 12,2940 (1973). Hastings, F. L., Main, A. R., Iverson, F., J . Agric. Food Chem. 18,
Hetnarski, B., Dokl. Chem. (Engl. Transl.) 156, 525 (1964). Hetnarski, B., Bull. Acad. Pol. Sci. Ser. Sci. Chim. 13,515 (1965). Hetnarski, B., Grabowska, A,, Bull. Acad. Pol. Sci. Ser. Sei. Chim.
Hetnarski, B., O’Brien, R. D., Pestic. Biochem. Physiol. 2, 132
(1949).
M., Biochem. Pharmacol. 7,88 (1961).
497 (1970).
17,333 (1969).
(19721. HetnaFski, B., O’Brien, R. D., Biochemistry 12,3883 (1973). Hetnarski, B., O’Brien, R. D., J . Med. Chem. 18, 29 (1975). Leo, A,, Hansch, C., Elkins, D., Chem. Reu. 71,525 (1971). Main, A. R., Science 144,992 (1964). Main, A. R., Proc. Conf. Struct. React. D F P Sensitive Enzymes,
1966 (1967). Metcalf; R. L., Fukuto, T. R., J . Agric. Food Chem. 13, 220 (1965). O’Brien, R. D., Mol. Pharmacol. 4, 121 (1968). O’Brien, R. D., Hilton, B. D., Gilmour, L., Mol. Ph~rmacol. 2, 593
(19GFl). \ _ _ _ _ , .
Wilson, I. B., Harrison, M. A,, Ginsburg, S., J . Rid. Chem. 236, 1498 (1961).
Received for review October 1, 1974. ’Accepted April 14, 1975. Fi- nancial assistance is gratefully acknowledged from Rockefeller Foundation Grant No. RF-69037, from the National Institutes of Health Grant No. ES 00901-14, and from National Institutes of Health Training Grant No. ES 98.
J. Agric. Food Chem., Vol. 23, No. 4, 1975 713