electrochemical workstation zive sp1 - edaq _potentiostat.pdfelectrochemical workstation zive sp1...
TRANSCRIPT

Electrochemical WorkstationZIVE SP1
ForCorrosion
Material TestingSensor/BioElectrochemistry
Battery/Fuel CellSuper Capacitor/Solar Cell
Including Internal FRA10Volts/1Amp
Designed by

Electrochemical Workstation ZIVE SP1
Corrosion
Free software upgrade
Internal 350,000 data point storage & continuing experiment regardless of PC failure.
3 measurement/control voltage ranges & 8 measurement/control current ranges
Optional software package- corrosion test software package- EIS test software package- electrochemical analysis software package- battery test software package
Multichannel configuration available
Voltage pulse or current pulse charge/discharge test(GSM,CDMA etc.), sine wave function for ripple simulation in battery test package(option) & pulse plating available
Bipolar pulse capability
High speed data sampling time- 50usec/sample in burst mode- 1msec/sample in normal mode
Capable of multitude of applications- corrosion, general electrochemistry, sensor, battery, fuel cell, supercapacitor, solar cell, etc.
12 EIS techniques capability(option) including multisine
Built-in FRA : enables EIS tests by using optional software
Wide current ranges(1A to 100nA) for various applications
±10V@1Amp control range
Compact size with full functionsEconomic high quality potentiostat/galvanostat/impedance analyzer
Application
Features
The ZIVE SP1 electrochemical workstation is ideal for fundamental research in electrochemistry, development and quality assurance of new sensors, corrosion/coatings, electrode material, membrane, conducting polymer, evaluation power device research such as battery materials, fuel cells, super capacitors and solar cells.
The ZIVE SP1 is an outstanding potentiostat/galvanostat/FRA offered at affordable price. This powerful model is a perfect choice for the complete DC and impedance characterization of various electrochemical applications.
The ZIVE SP1 is equipped with a frequency response analyzer(FRA) for system as standard and it provides high performance impedance measurements over the frequency range 10uHz to 1MHz. The ZRA(zero resistance ammeter) function can measure max. 1 Amp in galvanic corrosion technique. The ZIVE SP1 can be easily upgraded with adding optional application software package without returning the system to the factory for upgrade.
Solar Cells
Solar cell development and production require extensive material and device testing to improve efficiency and match individual cells for panel construction. The ZIVE SP1 is the best solution forphotovoltaic cell characterization.
Super Capacitors
The ZIVE SP1 has a fast potentiostat circuit with high speed data acquisition(50usec/point in burst mode). This function is well applicable to super capacitor testing. Charging/discharging capability is used for this application.
Fuel Cells
The ZIVE SP1 is ideal for characterizing the fuel cells and anodic/cathodic process mechanism at a development and research grade. This system can be directly used for PEMFC, DMFC, DEFC etc. Automatic current ranging potentiosatic/ galvanostatic IV curve is available.
Batteries
The system is very well adapted for researches on cycling behavior of battery. It provides various control modes for battery cycling and can supportEVS(electrochemical voltage spectroscopy) test. Fast pulse capability for GSM, CDMA test is included in battery test software package. Pulse profile measurement function to check pulse shape is available. For ripple simulation test, sine wave charging/discharging is available.
Sensors
The ZIVE SP1 can be used for sensor research using with DNA chips or screen printed electrodes. The system’s minimum current range is 100nA. Cyclic voltammetry, chronoamperometry and EIS measurement can be used for this application.
The system is suitable for measuring low corrosion rates(corrosion software package is needed.) and providing EIS test(EIS option) to evaluate corrosion. The ZRA function is supplied for galvanic corrosion measurement.
General Electrochemistry
The ZIVE SP1 is also suitable for the development of bio-research, electron transfer kinetic studies or electrochemical analysis of compounds at low trace levels, where multi-channel DC and impedance analysis is beneficial in providing highthroughput of results.

Electrochemical Workstation ZIVE SP1
The above functions can be used sequentially by step control function.
Basic Techniques
User can design his/her experiment procedure using TASK sequential routine editor.
1) Control task parameter
Sequence Editor
1) Potentiostatic2) Galvanostatic3) Voltage sweep4) Current sweep5) Cyclic voltammetry
Basic Technique with Standard Functions
Smart Manager(SM) Software
The Smart Manager(SM) provides user defined test sequence using sequence file, technique menu and batch file. The batch file allows the user to do a serial test by combining sequence files and/or technique files.
Th SM software is easy to use and supports various electrochemical experiments including functions of system control, schedule file editor, real time graph, analysis graph, user calibration, and data file treatment etc.
Each software package’s upgrade will be provided at free of charge.
50 usec data sampling
4) Flow view This displays sequence flow at a glance.
DC graph Peak find module
3) Sampling condition - time, |dI/dt|, |dV/dt|, |dA1/dt|, burst time
2) Cut-off(Vertex) condition - Time(step, test, loop, cycle) - Current, current density - Voltage - Capacity -.. -dV - |dV/dt| - |dI/dt| - Aux1 - Eoc etc.
- Constant potential, current, C-rate, power, load, OCP- Sweep potential, current- Step potential, current- EIS control- ZRA control- Pulse control- Rest (voltage monitoring only)- Loop(cycle) control
Batch Function
User can design batch file including multiple technique files and/or sequence files. With this batch file, user can do experiments as several techniques/sequence in series automatically.
YesYesNoNoNoNoPSINE
YesYesNoNoNoNoGSINE
YesYesNoNoNoNoIpulse
YesYesNoNoNoNoVpulsePulse
NoNoYesNoNoNoZRA
YesYesYesYesYesYesRest
NoNoNoNoYesNoMsineP
NoNoNoNoYesNoMsineG
NoNoNoNoYesNoHER P
NoNoNoNoYesNoHER G
NoNoNoNoYesNoPSUEDO
NoNoNoNoYesNoOCP
NoNoNoNoYesNoPSTAT
NoNoNoNoYesNoGSTATEIS
YesYesYesYesYesYesPSTAT
YesYesYesYesYesYesGSTATSweep
YesYesYesNoNoNoPSTAT
YesYesYesNoNoNoGSTATStep
NoNoYesNoNoNoOCP
YesNoNoNoNoNoLOAD
YesNoNoNoNoNoPOWER
YesYesYesYesYesYesPSTAT
YesNoNoNoNoNoCrate
BATEASCORFRAEISstandard
constant
software package name
YesYesYesYesYesYesGSTAT
Electrochemical Workstation ZIVE SP1
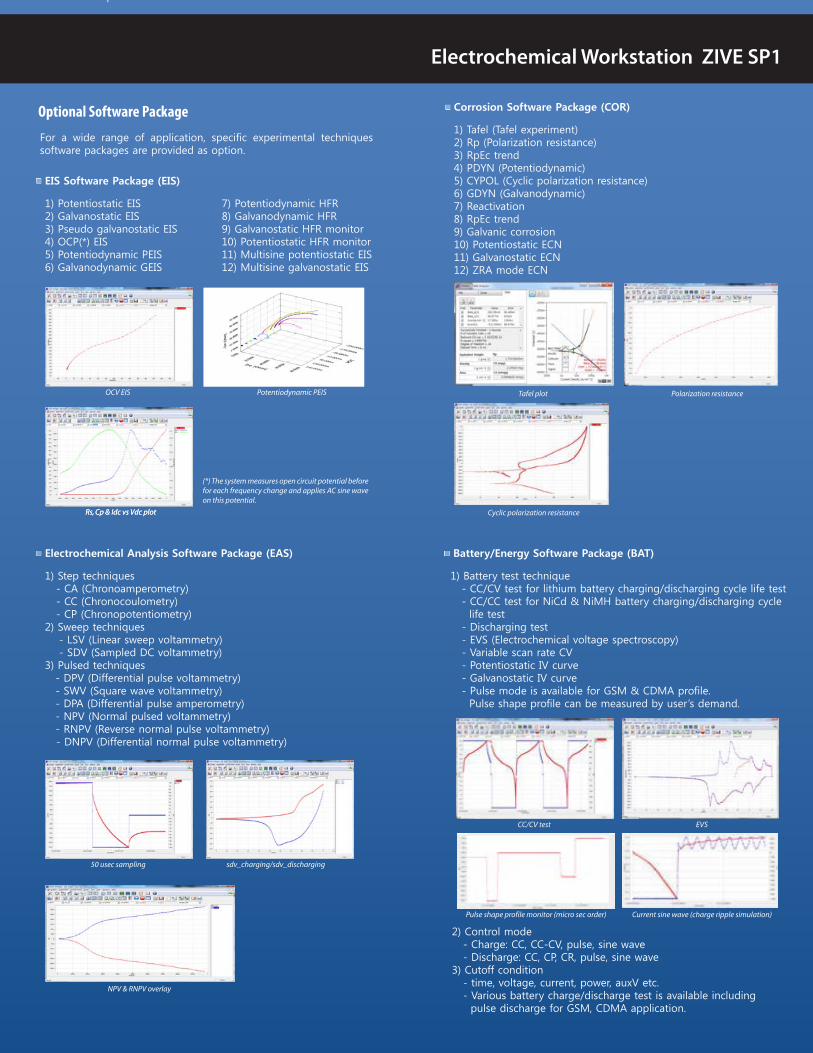
Optional Software Package
Basic Technique with Standard Functions
1) Step techniques - CA (Chronoamperometry) - CC (Chronocoulometry) - CP (Chronopotentiometry)2) Sweep techniques - LSV (Linear sweep voltammetry) - SDV (Sampled DC voltammetry)3) Pulsed techniques - DPV (Differential pulse voltammetry) - SWV (Square wave voltammetry) - DPA (Differential pulse amperometry) - NPV (Normal pulsed voltammetry) - RNPV (Reverse normal pulse voltammetry) - DNPV (Differential normal pulse voltammetry)
Electrochemical Analysis Software Package (EAS)
7) Potentiodynamic HFR8) Galvanodynamic HFR9) Galvanostatic HFR monitor10) Potentiostatic HFR monitor11) Multisine potentiostatic EIS12) Multisine galvanostatic EIS
1) Potentiostatic EIS2) Galvanostatic EIS3) Pseudo galvanostatic EIS4) OCP(*) EIS5) Potentiodynamic PEIS6) Galvanodynamic GEIS
EIS Software Package (EIS)
For a wide range of application, specific experimental techniques software packages are provided as option.
Rs, Cp & Idc vs Vdc plotRs, Cp & Idc vs Vdc plot
OCV EIS Potentiodynamic PEIS
(*) The system measures open circuit potential before for each frequency change and applies AC sine wave on this potential.
sdv_charging/sdv_discharging50 usec sampling
1) Tafel (Tafel experiment)2) Rp (Polarization resistance)3) RpEc trend4) PDYN (Potentiodynamic)5) CYPOL (Cyclic polarization resistance)6) GDYN (Galvanodynamic)7) Reactivation8) RpEc trend9) Galvanic corrosion10) Potentiostatic ECN11) Galvanostatic ECN12) ZRA mode ECN
Corrosion Software Package (COR)
NPV & RNPV overlay
1) Battery test technique - CC/CV test for lithium battery charging/discharging cycle life test - CC/CC test for NiCd & NiMH battery charging/discharging cycle life test - Discharging test - EVS (Electrochemical voltage spectroscopy) - Variable scan rate CV - Potentiostatic IV curve - Galvanostatic IV curve - Pulse mode is available for GSM & CDMA profile. Pulse shape profile can be measured by user’s demand.
Battery/Energy Software Package (BAT)
Cyclic polarization resistance
Tafel plot Polarization resistance
EVSCC/CV test
2) Control mode - Charge: CC, CC-CV, pulse, sine wave - Discharge: CC, CP, CR, pulse, sine wave3) Cutoff condition - time, voltage, current, power, auxV etc. - Various battery charge/discharge test is available including pulse discharge for GSM, CDMA application.
Current sine wave (charge ripple simulation)Pulse shape profile monitor (micro sec order)

Electrochemical Workstation ZIVE SP1
Basic Technique with Standard Functions
Graph
The Smart Manager’s graph function is to simplify the operation. There are 3 kinds of graphs per experiments. You can change X, Y1, Y2, Y3, Y4 axis parameter as you want. Each graph provides short buttons. When you click these buttons, graph format will be changed following short button format.
Strip Chart
The Strip chart recorder function is provided independently of real time graph function. You can monitor 2 Y axis data such as voltage, current, auxV1, power, capacity etc. in real time.
Control & Real Time Graph
Smart Manager program provides virtual control panel for control & data acquisition with real time graph.
Single channel control panel Multichannel real time graph
User can control and monitor in this control panel and he/she canmonitor data in VOI(value of interest) window and channel status in one window. Real time graph’s X Y axis format will be automatically changed per techniques. It can be
defined by user’s demand per techniques. For experiment using sequence file or batch file, user can select 3 real time graphs X, Y axis parameter.
1) DC graph - for general data display - 4 short buttons: I vs. V, E vs. LogI, V, I vs. time, V vs. Q - graph parameters: Time, Eref, I, Eoc, Id, Aux1, LogI, Load, ChQ, DchQ, ChQs, DchQs, Ch P, Dch P, Ch-Wh, Dch-Wh, Sum Wh, Sum Q, Sum |Q|, |Q|, Rp, Ch Q/Q0, dQ/dV, Q-Q02) EIS graph - for EIS data display - 3 short buttons: Nyquist plot , Bode plot, Cs vs. frequency - graph parameters: Frequency, Zre, -Zim, Zmag, Zph, Y’, Yimg, Y, |Y|, Yph, LogZ, LogY, Rs(R-C), Cs(R-C), Rp(R|C), Cp(R|C), Rs(R-L), Ls(R-L), Q(R-L), time, Vdc, Idc, Aux1
Multichannel real time graph
Each real time graphs format also can be selected. The real time graph and VOI will be changed depending on DC test or impedance test automatically. The Virtual control panel always display graph for recent test result. For impedance measure-ment, wave monitor will be displayed on real time graph to check wave quality. This monitor can be switched to Lissajous (I vs. E) plot.
3) BAT graph - for battery cycle data display - 3 short buttons: cycle capacity, cycle average, Log(cycle No) vs. depth of discharge plot. - graph parameters: cycle number, Ch Q, Dch Q, Sum Q, Coulomb Eff, Ch-Wh, Dch-Wh, Sum Wh, Energy Eff, MinV, MaxV, ChQs, DchQ, ChVavg, DchVavg, Vavg
Nyquist plotDC graph
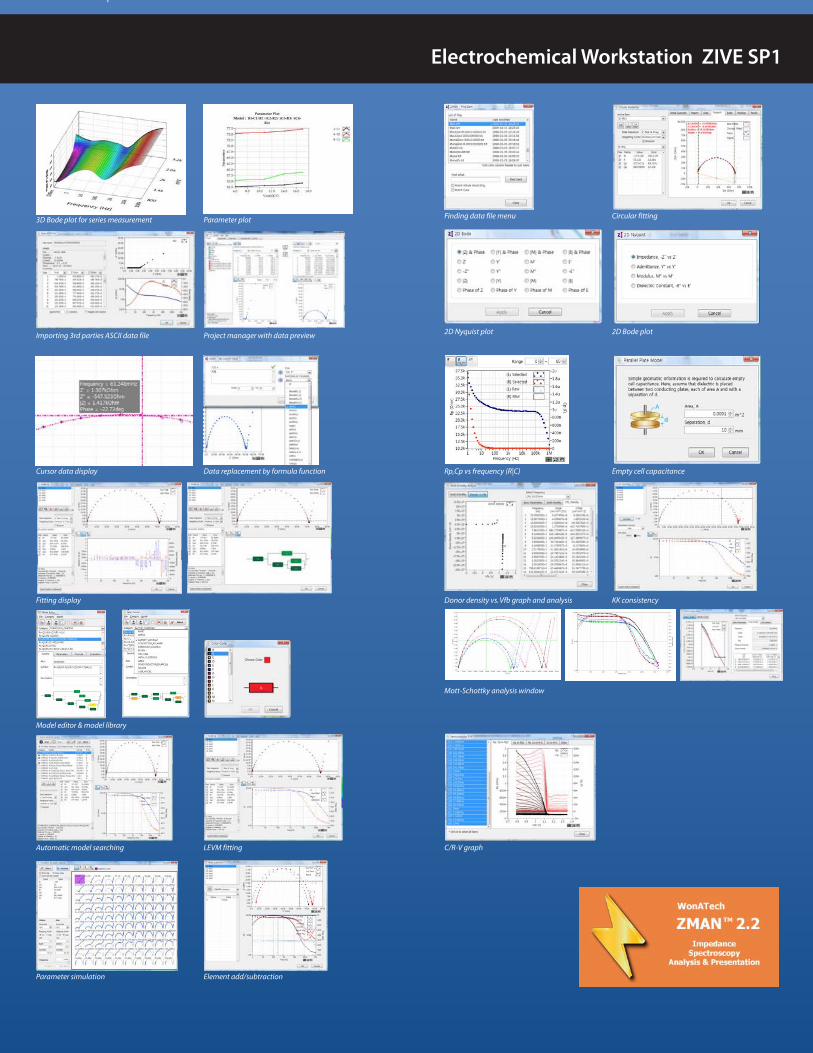
ZMAN EIS Data Analysis Software
Data Analysis Software
The ZIVE data file can be used for analysis using external IVMANsoftware for DC analysis, IVMANDA software for battery dataanalysis and ZMAN software for EIS data analysis without license.
TM
TM
TM
TM
• Model simulation and fitting• 2D- and 3D-Bode- and Nyquist plots• Automatic equivalent circuit model search function• Project concept to handle multiple EIS data analysis• Parameter plot from fitted elements value• Compatible with data format from Zahner, Gamry, Ametek etc. (License code is needed.)• Various weighting algorithm• Model library and user model• KK plot• Batch fitting for project data• Impedance parameter simulation• Interpolate bad data• Black-Nichols plot• 3D graph setting option• Improved model editor• Application model library for automatic searching• Parameter simulation of model• Genetic algorithm option for initial guessing• Automatic initial guessing• Trace movie function on fitting• Free for ZIVE’s data format(*.seo, *.wis) analysis (No license code required.)• Circle fitting• Data editing available (insert, delete, edit)• Add/subtract element parameters• Add/subtract model parameters• Impedance,Z in polar, admittance, Y in Polar, modulus, M in polar, dielectric constant, E in polar. data display• Empty cell capacitance calculation• Find file function• Data replacement by formula function• Cursor data display• Model finding result automatic sorting by Chi square value• R, C R,L R, Q preview & graphic• ZHIT function• Mott-Schottky analysis• Donor density vs. Vfb graph• C vs. voltage graph
Electrochemical Workstation ZIVE SP1
Basic Technique with Standard Functions
C/R-V graph
Mott-Schottky analysis window
KK consistencyDonor density vs. Vfb graph and analysis
Empty cell capacitanceRp,Cp vs frequency (R|C)
2D Bode plot2D Nyquist plot
Circular fittingFinding data file menu
Element add/subtractionParameter simulation
LEVM fittingAutomatic model searching
Model editor & model library
Fitting display
Data replacement by formula functionCursor data display
Project manager with data previewImporting 3rd parties ASCII data file
Parameter plot3D Bode plot for series measurement

Electrochemical Workstation ZIVE SP1
Basic Technique with Standard Functions
Tafel Analysis
• Independent peak finding software
Peak Find Module
• Independent peak finding software
Extractor
• Extracting data by cycle number or step• Exporting ASCII file
IVMAN Diff. SoftwareTM
• Battery test data analysis• Electrochemical voltage spectroscopy (dQ/dV vs. V)• Voltage vs. capacity analysis (V vs. Q)• Cycle graph (Q vs. cycle)• Differential voltage graph(dV/dQ vs. Q)
IVMAN SoftwareTM
IVMAN DC Data & Battery Test Data Analysis SoftwareTM
• Electrochemical analysis software• Ideal for DC corrosion data analysis and electro-analytical data analysis• Initial guessing function on Tafel analysis• Automatic Tafel fitting• Polarization resistance fitting• 3D graph• Find peak function• Interpolation, differentiation, integration etc.• Reporting function
IVMAN software package consists of• IVMAN software• IVMAN utilities - differential analysis (battery analysis) - Extractor - peak find module - Harmonic analysis - Tafel analysis
TM
V vs. QMeasured data
Tafel analysis resultTafel analysis
Export ASCII filedV/dQ vs. Q
dQ/dV vs. VCycle graph
Universal graphEdit data menu
3D graphCV graph
Find peak menuTime graph
Polarization analysis resultPolarization resistance fitting

Electrochemical Workstation ZIVE SP1
Basic Technique with Standard Functions
Specifications & software subject to change without notice. Windows is a registered trade mark of Microsoft Corporation.
Speci�cation
<0.02% f.s. @10V range Voltage accuracy
10V, 1V, 100mV Voltage range 16 bit0.3mV, 30uV, 3uV
Voltage resolution
0.02% f.sVoltage measurement Current accuracy
16 bit30uA,3uA,300nA,30nA,3nA,300pA,30pA,3pA
Current resolution
max. ±1A± full scale depending on selected range
Current control
Galvanostat Mode (current control)
Control current range
0.02% f.s Current accuracy
16 bit30uA,3uA,300nA,30nA,3nA,300pA,30pA,3pA
Current resolution
8 ranges(auto/manual setting)100nA~1A
Current rangeCurrent measurement
±10V vs. ref. E Max. scan range<0.02% f.s. Voltage accuracy16 bit per each range±10V, ±1V, ±100mV
Voltage control
Potentiostat Mode (voltage control)
Voltage resolution Control voltage range
10V/usecSlew rate5MHzBandwidth5eaControl speed selection±1A±15V15Watt (15V@1A)Power
Power Amplifier(CE)
DC & EIS mode automaticallyLCD Display350,000 pointsInternal data memory32 channels via USB connectionMax. channel No.0~200V/sec (10mV step@200V/sec)Scan rate4ea(5Hz,1kHz,500kHz, 5MHz)Filter2x16bit DAC(50MHz) for bias & scan DAC2x16bit ADCs(500kHz)for voltage, current ADC
Data acquisitionautomaticCalibrationDSP with FPGAControl
1 meter shielded type(standard)working, reference, counter,working sense, auxV1
Cell cable
System
one external dummy cell includedDummy cell
General
high speed 2.0USB1280x800 high colorDisplayPentium4, RAM 1GB or betterPC specificationWindowsXP/2000/Vista/7Operating system
PC Requirement
time, dv/dt, dI/dt etc.Sampling conditionunlimitedMax. sampling time20kHz(50usec), burst modeMax. sampling ratevoltage, current, temperature etc.Shutdown safety limits1000Max. step per experiment
Software
100nA~1A rangesZero Resistance Ammeter
1 analog input±10V
Auxiliary voltage input10uHz~1MHzAuxiliary port
Interfaces for System
0.1mV~5V rms (Potentiostatic)0.1~70% f.s. (Galvanostatic)
Amplitude
Static EIS: potentiostatic, galvanostatic, pseudogalvanostatic, OCPDynamic EIS: potentiodynamic, galvanodynamicFixed frequency impedance: potentiostatic, galvanostatic, potentiodynamic, galvanodynamicMultisine EIS: potentiostatic, galvanostatic
Mode
5000/decadeFrequency resolution0.01%Frequency accuracy10uHz~1MHzFrequency range
EIS(Internal FRA) for System
>110db(1Hz) >60db(1MHz)CMRR>16MHzBandwidth2x10 Ω||4pFInput impedance±10VMax. input voltage
Electrometer
15WattMax. output power160*324*76mm(W*D*H) / 2KgSize/weight24VPower adapter100~240VAC, 50/60Hz, 1AmpLine voltageUSB2.0 high speedPC communication
Main System
Max. currentCompliance voltage
13

Designing the Solution for Electrochemistry
Basic Technique with Standard Functions
http://www.zivelab.com
Designed by
WonATech Co., Ltd.69, Baumoe-ro 2-gil, Seocho-gu, Seoul, 137-900, KoreaPhone: +82-2-578-6516Fax: +82-576-2635e-mail) [email protected]: www.wonatech.com
WonATech Co., Ltd.
Local Distributor