electrochemical study of silver dissolution in cyanide solutions
TRANSCRIPT

J. Electrochem. Soc., Vol. 140, No. 7, July 1993 �9 The Electrochemical Society, Inc. 1921
image through the total depth of a typical 1.0 to 1.5 ~m thick photoresist. The system presented here only requires the top few thousand angstroms of photoresist be irradi- ated. Hence, the DOF is no longer an issue because this system is virtually a photoresist surface imaging and metallization technique. In addition, there is erosion from the top photoresist pattern when subjected to dry etch such as RIE. As a result, the pattern may not be faithfully trans- ferred to the underlying substrates. It has been demon- strated that this system allows Ni to be deposited on pho- toresist pattern, and this Ni deposit acts as a shield protecting the underlying photoresist from being etched.
The limitation of this system is that the Ni deposit must be thick enough to act as an etch barrier and thin enough that it does not significantly affect the dimension of the photoresist pattern, especially in the lateral direction. This deposit must be consistent and uniform across the pattern let alone from wafer to wafer. Furthermore, this technique is new to the IC industry and needs to be fully tested, par- ticularly with regard to metal contamination issue.
Conclusion 1. Two mechanisms of metal deposition are involved
when a Pd-Sn colloidal catalyst system is used to promote electroless metal plating. The first mechanism governs the metal growth on each catalytic site (island) unt i l these is- lands merge and form a continuous metal film. The second mechanism is responsible exclusively for the metal growth from the continuous metal film.
2. It is found that 55 A of Ni appear to be a minimum thickness for a perfectly continuous film which is effective as a plasma barrier in the oxygen magnetron-enhanced re- active ion etching environment.
3. The experimental results are within reasonable agree- ment with the predicted values using a mathematical model; Both suggest that radii of active sites range from 5 to 17 A.
4. The system presented is viewed as a possible tech- nique for reducing some of the difficulties which the IC industry currently experiences. Further feasibility study is required to fully test this system.
Acknowledgment The author wishes to thank Dr. S. Bobble of Microelec-
tronics Center of North Carolina (MCNC) for performing oxygen MERIE, Dr. J. Calvert and the technical staff of Naval Research Laboratory (NRL) for determination of the microscopic rate of metal deposition, Dr. G. S. Calabrese of Shipley Company for helpful discussions and review of this paper. Last but not least, the author wants to thank J. F. Bohland of Shipley Company, Professor W. K. Chu, and his graduate students in the Physics Department of University of North Carolina at Chapel Hill for all the RBS work.
Manuscript submitted Dec. 14, 1992; revised manuscript received March 9, 1993.
Shipley Company assisted in meeting the publication costs of this article.
REFERENCES 1. W. M. Moreau, Semiconductor Lithography, Princi-
ples, Practices, and Materials, pp. 364-365, Plenum Press, New Yor5k (1988).
2. M. Gulla, and P. Sricharoenchaikit, U.S. Pat. 5,053,318 (1991).
3. L. N. Abali, S. M. Bobbio, J. E Bohland, G. S. Cal- abrese, M. Gulla, E. K. Pavelchek, and R Sricharoen- chaikit, in Proceedings of Microcircuit Engineering, International Conference on Microlithography, Leu- ven, Belgium, Sept. 18-20, 1990; Microelect. Eng., 13, 93 (1991).
4. G. S. Calabrese, L. N. Abali, J. F. Bohland, E. K. Pavelchek, P. Sricharoenchaikit, G. Vizvary, S. M. Bobbio, and R Smith, SPIE, 1466, 528 (1991).
5. K. Radigan and S. Liddicoat, SPIE, 1672, 394 (1992). 6. J. M. Schnur, M. C. Peckerar, C. R. Marrian, J. M.
Schoen, and J. H. Georger, U.S. Pat. 5,079,600 (1992). 7. J.M. Calvert, C. S. Dulcey, M. C. Peckerar, J. M. Schnur,
J. H. Georger, J. S. Calabrese, and P. Sricharoen- chaikit, Solid State Technol., 34, 77 (1991).
8. J. M. Calvert, M. S. Chen, C. S. Dulcey, J. H. Georger, M. C. Peckerar, J. M. Schnur, and R E. Schoen, This Journal, 139, 1677 (1992).
9. R. L. Meek, ibid., 122, 1177 (1975). 10. J. R Marten and M. Schlesinger, ibid., 115, 16 (1968).
Electrochemical Study of Silver Dissolution in Cyanide Solutions
Jun Li and Milton E. Wadsworth Department of Metallurgical Engineering, College of Mines and Earth Sciences, University of Utah,
Salt Lake City, Utah 84112
ABSTRACT
Rate processes of the anodic dissolution of silver in cyanide solutions were studied by various electrochemical tech- niques using a rotating disk electrode. Both the process mechanism and rate-influencing factors such as agitation, cyanide concentration, and temperature were examined. Anodic silver dissolution may be separated into two elementary steps: an electrochemical reaction followed by a chemical reaction. Considering charge transfer plus diffusion of cyanide ions from the bulk solution to the silver surface as being rate limiting, the rate of anodic silver dissolution was calculated using the combined Butler-Volmer and Levich equations.
The introduction of cyanide leaching in 18871 revolution- ized the processing of gold and silver ores. Since then, the process has remained the common practice of recovering gold and silver throughout the world. The leaching reaction was recognized by early investigators to be electrochemical in nature. 2 Although the kinetics of silver cyanidation has been the subject of many investigations, there has been little consistent work done on the reaction mechanism.
Using the potential-step method, Vielstich and Geris- cher 3 succeeded in verifying the Butler-Volmer equation
with a transfer coefficient ~ = 0.5 for [CN-] > 0.2M and ~ = 0.44 for [CN ] < 0.1M. In their study, the predominant com- plex ion of silver was assumed to be Ag(CN)~-, and it did not change with the cyanide concentration. Nechaev and Bek 4 studied the discharging of silver in cyanide solutions by measuring the Faraday impedance. They found that, in the entire region of potentials more negative than -0.45 V, silver was deposited as a result of the discharging of Ag(CN)~ ions independent of the composition of the solu- tion and the conditions of electrolysis.
) unless CC License in place (see abstract). ecsdl.org/site/terms_use address. Redistribution subject to ECS terms of use (see 128.252.67.66Downloaded on 2014-07-02 to IP

1922 J. Electrochem. Soc., Vol. 140, No. 7, July 1993 �9 The Electrochemical Society, Inc.
Since it was found that a surface enhanced Raman scat- tering (SERS) spectrum could be obtained from cyanide 5'6 adsorbed on a silver electrode, silver has become reestab- lished as an electrode of particular interest. Many studies in the last decade have concentrated on this method and attempts to correlate SERS with electrochemical tech- niques predominate. Voltammograms for the silver cyanide system with the corresponding SERS spectra of adsorbed silver cyanide were presented by Benner et al. 7 SERS spec- tra of 12CN- and ~3CN- adsorbed on silver electrodes were obtained by Fleischmann and co-workers. ~ The spectra were shown to arise from a complex species whose coordi- nat ion number did not change with the electrode potential. This species was suggested to be Ag(CN)~. A quantitative determination of pyridine and cyanide adsorption on silver by a radiochemical technique was undertaken by Blondeau et al. 9 They found that after several dissolution-redeposi- tion cycles the quant i ty of cyanide adsorbed remained con- stant and the silver-cyanide reaction was reversible.
Because of the new information from SERS spectra, Bal- truschat and Vielstich TM studied the system again using the potentiostatic pulse method. By using an exact mathemati- cal solution instead of extrapolating, they were able to ob- tain better accuracy for exchange current densities. Their results showed that neither the anodic dissolution of silver in cyanide solutions nor its reverse process involved simple charge-transfer reactions: (i) the reaction orders were not integers, (it) the apparent transfer coefficient was depen- dent on concentration or potential, and (iii) the rate deter- mining step was not purely charge-transfer controlled. They also showed that pH had no influence on the process.
From the literature surveyed it appears that (i) the re- search done so far has focused on concentrated cyanide solutions (typically above 0.1M); (it) the mechanism is still ambiguous; (iii) the combined effects of intrinsic kinetics and physical processes (e.g., diffusion) are yet to be meas- ured; and (iv) the adsorption of cyanide ions on silver sur- faces is a steady-state phenomenon.
Experimental The working electrode was pure silver metal (99.99%)
and had an apparent area of 0.46 cm 2. Techniques similar to those used in the preparation of metallographic specimens were employed to clean the electrode surface; the electrode was polished with successively finer grades of alumina powder of sizes 1, 0.3, and 0.05 ~m. After rinsing with wa- ter, then with ethyl alcohol, and then water again, the elec- trode was finally washed with the test solution. A plat inum sheet of about 5.0 cm 2 area was used as the counterelec- trode. Both saturated calomel electrodes (SCE) and silver- silver chloride electrodes (double junction type) were em- ployed as reference electrodes.
All the chemicals used in the experiments were of analyt- ical grade. All solutions were made with distilled and deionized water. The test solutions contained 0.5M KNO3 as the indifferent electrolyte and had an adjusted pH of about 11 with the addition of KOH. Cyanide was added as KCN. Cyanide concentrations used in this study were in the range of 0 - 0.01M. To stabilize the rest potential the electrolyte also contained 5 • 10-SM AgNO3. The solution was purged with argon for more than 1 h before each experiment, and argon was kept flowing over the electrolyte during the test.
Experiments were conducted in a constant temperature bath. The temperature setting of the bath could be adjusted between -10 and 100~ with a temperature stability of -+0.01?C at 60~ The hydrodynamics of the system were controlled by a disk rotator with the rotation speed ad- justable from 50 to 10,000 rpm at an accuracy of better than 1% dial setting. A Princeton Applied Research (PAR) Model 273 potentiostat was used for the electrochemical experi- ments. Coupled with a Mode] 5301 EC lock-in amplifier, it was also used for impedance measurements. The experi- mental apparatus was a double-chamber reactor made of Pyrex glass. Two 500 ml compartments were connected through a fine frit, which permits ions to pass but sup- presses transport of gases. An air-water seal was con-
Table I. Coordination number obtained from experiment and calculation.
Temperature Experimental RT/F m (~ Data a • 1000 (Calculated)
0 46.58 23.52 1.98 10 48.86 24.39 2.00 24 50.78 25.59 1.98 40 53.04 26.67 1.99 60 55.40 28.69 1.93
Slopes from the plot of E (in mV) vs. in [CN-].
structed around the well through which the working elec- trode was inserted. The distance between the working electrode and the Luggin capillary was about 2 mm.
Results and Discussion Coordination number of silver-cyanide complexes . -
Four cyanide complex species of silver have been reported in the literature: AgCN, Ag(CN)2, Ag(CN)~-, and Ag(CN)~-, with each species being stable or dominant depending on the specific condition. 11 Assuming that the electrochemical reaction between silver and cyanide with the coordination number m is given by
Ag(CN)~ -m + e- ~ Ag + mCN- [1]
the Nernst equation for reaction 1 will be
[CN_lm E = E ~ - in [Ag(CN)~_~] [2]
where E is the EMF of the reaction, E ~ the standard EMF of the reaction, R the gas constant, F the Faraday constant, and T the absolute temperature.
The potentials of silver electrodes immersed in oxygen- free cyanide solutions were measured at various tempera- tures and were found to be proportional to In [CN-] for constant [Ag(CN)~-'~]. Slopes, obtained from linear regres- sion of the data are listed in Table I along with the calcu- lated values of RT/F for the temperatures 0, 10, 24, 40, and 60~ Calculated values of m are close to 2 for each temper- ature for the cyanide concentration range used in this study. Therefore the coordination number of the silver- cyanide complex can be presumed to be 2.
The proportional changes of various simple or complex silver ions with pH can be calculated based on thermody- namic data. 12 The predominant complex ion of silver- cyanide in alkaline solutions is Ag(CN)2 (over 90% for pH higher than 5) according to the calculation. For Ag(CN)~- to be the predominant species at pH 11, the concentration of cyanide in solution must be above 0.1M while Ag(CN)~- does not predominant for cyanide concentration as high as 2.5M. In conc]usion, the following silver dissolution reac- tion is proposed to be predominant and will be used throughout the analysis
Ag + 2CN- ~ Ag(CN)~ + e- [3]
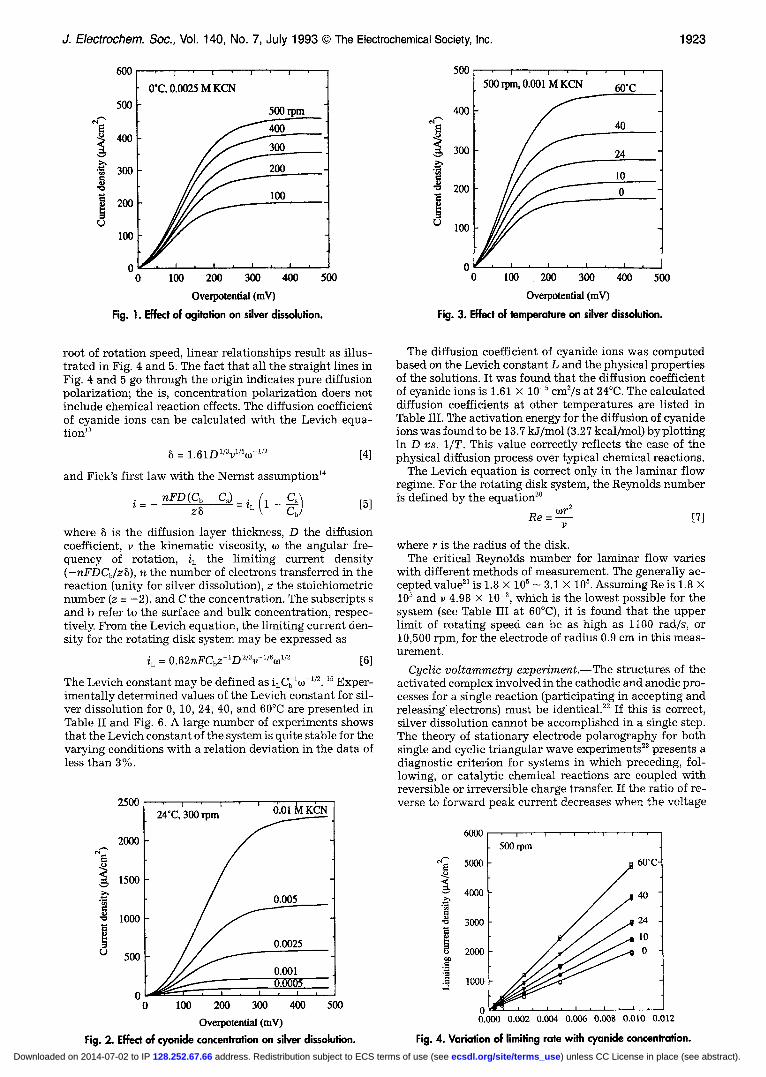
Steady-state polarization curve.--The steady-state po- larization curves of silver dissolution in cyanide were ob- tained by the potentiodynamic technique with slow voltage scan rates (0.1 - 0.5 mV/s). Several typical curves are pre- sented in Fig. 1 through 3. In these figures the effects of agitation (Fig. 1), cyanide concentration (Fig. 2), and tem- perature (Fig. 3) are shown, respectively. The rate of silver dissolution increases with rotation speed, cyanide concen- tration, and temperature.
All of the polarization curves demonstrate similar fea- tures. The horizontal sections of these curves clearly indi- cate a limiting current caused by concentration polariza- tion. The shapes of the curves also suggest that the rate of silver dissolution at small overpotentials is mainly due to the charge-transfer control.
Diffusion of cyanide ions.--By plotting the limiting cur- rent density against cyanide concentration or the square
) unless CC License in place (see abstract). ecsdl.org/site/terms_use address. Redistribution subject to ECS terms of use (see 128.252.67.66Downloaded on 2014-07-02 to IP
d. Electrochem. Soc., Vol. 140, No. 7, July 1993 �9 The Electrochemical Society, Inc. 1923
v
~J
6 0 0 i l i l
O'C, 0.0025 M KCN
500 500 rpm
400 400 300
300 200
200
100
0 ' ' ' '
0 100 200 300 400 500
Overpotential (mV)
Fig. ! . Effect of agitation on silver dissolution.
500
4OO
+oo "~ 200
~ 100
0 0
' I ' l �9 I I
500 rpm, 0.001 M KCN 60"C
40
24
100 , 200 300 400 500
Overpotential (mY)
Fig. 3. Effect of temperalure on silver dissolution.
root of rotation speed, linear relationships result as illus- trated in Fig. 4 and 5. The fact that all the straight lines in Fig. 4 and 5 go through the origin indicates pure diffusion polarization; the is, concentration polarization doers not include chemical reaction effects. The diffusion coefficient of cyanide ions can be calculated with the Levich equa- tion 13
= 1.61D1/~vl/+oJ -1/2 [4]
and Fick's first law with the Nernst assumption 14
i = n F D ( C b - C,) iL (1 -- Ca) z~ - ~ [5]
where S is the diffusion layer thickness, D the diffusion coefficient, v the kinematic viscosity, co the angular fre- quency of rotation, i L the limiting current density ( - n F D C b / z 3 ) , n the number of electrons transferred in the reaction (unity for silver dissolution), z the stoichiometric number (z = -2), and C the concentration. The subscripts s and b refer to the surface and bulk concentration, respec- tively. From the Levich equation, the limiting current den- sity for the rotating disk system may be expressed as
iL = 0.62nFCbz-lD2/%-l /%o in [6]
The Levich constant may be defined as iLC~Ir -~/2. I5 Exper- imentally determined values of the Levich constant for sil- ver dissolution for 0, 10, 24, 40, and 60~ are presented in Table II and Fig. 6. A large number of experiments shows that the Levich constant of the system is quite stable for the varying conditions with a relation deviation in the data of less than 3%.
2500 24"C, 300 rpm ().0l 1~I KCN
~ 1500
.0 ,~ 1000
0.0025 c9 5OO
0.001
0 0 100 200 300 400 500
Overpotential (mY)
Fig. 2. Effect of cyanide concentration on silver dissolution.
The diffusion coefficient of cyanide ions was computed based on the Levich constant L and the physical properties of the solutions. It was found that the diffusion coefficient of cyanide ions is 1.61 • 10 _5 cm2/s at 24~ The calculated diffusion coefficients at other temperatures are listed in Table III. The activation energy for the diffusion of cyanide ions was found to be 13.7 kff/mol (3.27 kcal/mol) by plotting in D vs. 1 /T . This value correctly reflects the ease of the physical diffusion process over typical chemical reactions.
The Levich equation is correct only in the laminar flow regime. For the rotating disk system, the Reynolds number i's defined by the equation 2~
R e = r176 [7]
where r is the radius of the disk. The critical Reynolds number for laminar flow varies
with different methods of measurement. The generally ac- cepted value zl is 1.8 • 105 - 3.1 • 105. Assuming Re is 1.8 • 105 and v 4.98 • 10 -3, which is the lowest possible for the system (see Table III at 60~ it is found that the upper limit of rotating speed can be as high as 1100 rad/s, or 10,500 rpm, for the electrode of radius 0.9 cm in this meas- urement.
Cyc l i c v o l t a m m e t r y e x p e r i m e n t . - - T h e structures of the activated complex involved in the cathodic and anodic pro- cesses for a single reaction (participating in accepting and releasing electrons) must be identical. 22 If this is correct, silver dissolution cannot be accomplished in a single step. The theory of stationary electrode polarography for both single and cyclic tr iangular wave experiments 23 presents a diagnostic criterion for systems in which preceding, fol- lowing, or catalytic chemical reactions are coupled with reversible or irreversible charge transfer. If the ratio of re- verse to forward peak current decreases when the voltage
60O0
50oo
4000
~ 3ooo
i~_ looo
o
. . . . . 61.+t / : 24
lO o
i
0.000 0.002 0.004 0.006 0.008 0.010 0.012
Fig. 4. Variation of limiting rate with cyanide concentration. ) unless CC License in place (see abstract). ecsdl.org/site/terms_use address. Redistribution subject to ECS terms of use (see 128.252.67.66Downloaded on 2014-07-02 to IP

1924 ,1. Electrochem. Soc., Vol. 140, No. 7, July 1993 �9 The Electrochemical Society, Inc.
1800 . . . . 0.0025 M KCN
1500 60"C
1200 40
900 . ~24
10 600 0
300
0 0 2 4 6 8 10
o in (to in rad/sec)
Fig. 5. Variation of limiting rate with agitation.
scan ra te of a cyclic vo l t ammogram increases, the cr i te r ion suggests a mechan i sm for which an e lec t rochemical reac- t ion is fol lowed by ano ther chemical react ion (the EC mechanism), both of which are reversible. 23
To character ize the possible coupled chemical react ions accompanying the e lectron t ransfer step, cyclic vo l t amme- try exper iments were performed. The rat ios of cathodic to anodic peak current decreased wi th the vol tage scan ra te for s i lver dissolut ion in cyanide. Accordingly, 23 the re la- t ionship indicates an EC mechanism. In accordance wi th these exper iment results, the fo l lowing mechan i sm for sil- ver dissolut ion is t en ta t ive ly assumed
Ag + CN- ~- AgCN + e [8]
AgCN + CN- ~ Ag(CN)~ i9]
Potentiostatic experiment.--A typical cu r ren t - t ime curve inc luding boundary diffusion, obta ined using the po- tent ios ta t ic technique, is shown in Fig. 7. The kinet ics of an e lec t rochemical reaction, expressed by the But ler-Volmer e q u a t i o n is 24
[ i = z0 ~ exp \ ~ - Co~ exp
where i is the current density; i0 the exchange current den- sity; a the t ransfer coefficient; and ~ the overpotent ia l . Subscr ipts o and r refer to the oxidized and reduced form of the species involved, and subscripts s and b the surface and bulk concentrat ion, respectively.
At high posi t ive overpotent ia ls the second te rm of Eq. 10 may be neglected. Therefore the ra te express ion can great ly be s impli f ied because the chemical react ions fo l lowing the charge- t ransfer step have no effect on the process. Subs t i - tu t ing Eq. 5 and 6 into 10, w i th the back reac t ion being neglected, a new equat ion, descr ibing both diffusion and intr insic kinet ics of the e lec t rochemical reactions, is ob- ta ined
1 1 1.61zv ~/6 1 + ~anF.q) nFDZ/3Ce ~col/2 [11]
i- - i0 exp \ RT
According to Eq. 11 a s t ra ight line should be obta ined by p lo t t ing the reciprocal of current against the reciprocal of
Table II. Levich constant of silver cyanide reaction.
Temperature (~ Mean Standard deviation
0 26.4 0.58 10 33.2 0.60 24 41.4 1.20 40 53.1 1.19 60 68.8 1.32
0
9 0 i i I
80 L = i L CCN "1 O -1/2
70 ~ % ~ n ~ ~ q ~ u ~ d ~ m O 60"C
60
" 24 40 ~ v ~ ~ %~'w~'w~v~v
10
3 0 - ~ o ~ 0
20 , i , I , I ,
0 20 40 60
Number of experiments
Fig. 6. Levich constant of silver cyanide reaction.
80
the square root of the rotation speed at a fixed overpoten- tial. A typical plot is given in Fig. 8 by taking the data from current-time curves obtained from potentiostatic experi- ments such as those shown in Fig. 7.
The straight lines from plots of i/i vs. to -I/2 provide im- portant information. First, the theoretical relationship suggested by Eq. ii is confirmed. Second, the pure kinetic current without the diffusion effect is obtained from the intercept of the line, as this is the case when co-I/2 __> 0 or co --~ ~. Third, the slope gives the limiting current, which can be used to check with the data from other experiments such as the potentiodynamic technique. The Levich con- stant calculated from the slope of Fig. 8 is close to those obtained directly from potentiodynamic experiments.
To estimate the exchange current and transfer coeffi- cient, the Butler-Volmer equation, TM neglecting the second term, in the Tafel form is
Rr ~ = - ~ l n i0 + In i [12]
The Tafel p lot for si lver dissolut ion in cyanide is shown in Fig. 9. The apparen t kinet ic pa ramete rs at 24~ are esti- ma ted based on the Tafel plot. The exchange current densi- t ies are 22, 33, 56, 89, and 127 ~A/cm 2, respectively, for cyanide concent ra t ions of 5 • 10 -~, 1 • 10 -~, 2.5 • 10 -3, 5 • 10 -3, 1 • 10-2M. The t ransfer coefficient is about 0.48.
The results obta ined f rom the P0tent ios ta t ic exper iments are satisfactory. They suppor t the assumpt ions made so far. However, they are still preliminary. To use the Tafel equa- t ion wi th more confidence, the current usual ly must span at least three decades according to the general ly accepted rule. Besides, this par t of the exper imenta l analysis only holds for the high overpotent ia l region. Fur the r proof is needed before the mechan i sm is f inal ly confirmed.
Impedance measurements.--Impedance measurements were pe r fo rmed on the system under var ious conditions. Some of the results are shown in the Nyquis t plot form in
Table III. Selected physical properties of pure water and solutions for calculating diffusion coefficient of cyanide ions.
Pure water Solution
T Density~ ~6 Viscosity 17 Density_ TM Viscosity a D N ~ (~ (gcm -3) (gcm ls-1) tgcm -3) (gcm-ls-1) (cm~s 1)
0 0.9998679 0.01788 1.03231 0.01933 9.70 x 10 -6 10 0.9997277 0.01305 1.03098 0.01407 1.26 • 10 -5 24 0.9973256 0.00923 1.02750 0.00993 1.61 x 10 -s 40 0.9922455 0.00653 1.02156 0.00701 2.15 • 10 5 60 0.98324 0.00470 1.01171 0.00504 2.93 N 10 -5
a Calculated with Pochtarev-Kozhemyakin equation) 9 b Diffusion coefficient of cyanide ions, obtained with Eq. 6.
) unless CC License in place (see abstract). ecsdl.org/site/terms_use address. Redistribution subject to ECS terms of use (see 128.252.67.66Downloaded on 2014-07-02 to IP

J. Electrochem. Soc., Vol. 140, No, 7, July 1993 �9 The Electrochemical Society, Inc. 1925
# o
100 0.36 i i i
24"C, 0.0025 M KCN, ~1 = 125 mV
8o
60
4O S 600
........ I 300 . . . .
20 [ i N
0 , I ~ I , I ,
0 200 400 600
Time ( s e e )
rpr
800
Fig. 7. Variation of current density with rotation speed.
i i i i i
a 0.01 M KCN 0.32 - 0.005
v 0.0025 �9 o.ool / ~ / , ; / 2 o
o �9 v
~ 0.12 ~" ~ " ~
24"C
0.08 ' ' ' ' ' ' ' ' ' ' ' 6 7 8 9 10
In i (i in pA/cm 2)
Fig. 9. Tafel plot of silver cyanide reaction.
,-, 0.28
N 0.24
~ 0.20
O 0.16
ll
Fig. i0 and 11, which depict the influences of the rotation speed and cyanide concentration, respectively. For silver dissolution in alkaline cyanide solutions, the proposed re- action mechanism is a two-step process given by reactions 8 and 9. If the charge-transfer step is rate-limiting, then the Faraday impedance, Zf, of the system may be defined by the following equation ~2'25
Z~ = ~ = R~t 1 + ~ th(a2 ~[~) [131
where m is the frequency, j = ~2~, Re t = RT/ioF, a~ = 2io/ Fco~ ,~ , a~ = ~ / , ~ .
With Eq. 13, various parameter values may be calculated from measured impedance values of silver dissolution. One simulation comparison is shown in the Bode plot form in Fig. 12. For the rotating disk system, the diffusion layer thickness is well-defined (see Eq. 4). From Eq. 4 and 13 it may be seen that the coefficient a2 should change with ~o -~/2 linearly. Their relationship is plotted in Fig. 13. From the slope of the regression line the diffusion coefficient of cyanide ions may be found
{1.61~0 (161V_ D = v \ ~ } =V\s lope] - 1 " 5 6 • 10 -~cm2/s
which is close to the value 1.61 • 10 -5 cm2/s obtained from potentiodynamie experiments (see Table III).
Mechanism of silver dissolut ion.--Aceording to the po- tentiostatic and impedance experiments, silver cyanida-
0.05 ' i ' ~ ' i '
0.04
0.03
=_
"~ 0.02
0.01
V
0 . 0 0 , I , I , t ,
0.0 0.1 0.2 0.3 0.4
r "1/2 (co i n rad/sec)
Fig. 8. Variation of reciprocal of current density with reciprocal of square root of rotation speed at fixed overpotential.
tion occurs as suggested by the two consecutive reactions 8 and 9. The impedance measurements also indicate that the charge-transfer step, in conjunction with the diffusion of cyanide ions, is rate-limiting while the influence of subse- quent chemical reactions can be neglected, Given these facts, the rate expression for silver dissolution involving the various experimental factors can be derived using the Butler-Volmer equation 1~ and the Fick's first law with the Nernst assumption (Eq. 5). Combining the two equations, an expression for the rate for anodic silver dissolution in cyanide was obtained as follows
4000
3000
i i i
o 0rpm 24"C, 71 = 0 V v 500 0.0025 M KCN a 1 0 0 0
A 2000
O 2000 / 0
0 /
1| : "-. ~ "-,,
0 1000 2000 3000 4000
Real component (~)
Fig. 10. Variation of impedance with rotation speed.
1800 i i i I i
o 0.0005 M KCN 24"C, • = 0 V v 0.001 2000 rpm a 0.0025
1500
1200
~ 900
�9 ~ 600 ~- o..O.O~~176176 O- "O~
~.~ t O " W ' V V - v . O ~ O" v " - - V v
i o ; ~ o o
N, % o W . . . . . ~ , ,~ ' , , ,
300 600 900 1200 1500 1800
Real component (~) Fig. 11. Variation of impedance with cyanide concentration.
) unless CC License in place (see abstract). ecsdl.org/site/terms_use address. Redistribution subject to ECS terms of use (see 128.252.67.66Downloaded on 2014-07-02 to IP

1926 d. Electrochem. Soc., Vol. 140, No. 7, July 1993 �9 The Electrochemical Society, Inc.
}
1500 I . �9 , . . , �9 �9 , . �9 , . . t % Imaginary Component [ �9 % o Experiment
1000 r ~ * Calculation
5000 t200 r~m, n = 0 ? ~ ]
24~ 0.0025 M KCN 4000 '' I '' I :' ', :'~"""""~, : '
Real component " 3000 �9 o Experiment-
| § Calculation 2000 �9
t
1000 " ~ q ~ e l t l ~
0 * I , __
0.01 0.1 1 10 100 1000
log m (co in Hz)
Fig. 12. Impedance simulation with Eq. 17.
2,0 , i �9 i i
D = 1.616a26vr "3
-~ = 1.61 6 slope "6
u 1.5
"~ 1.0
i ~ 0.5
24~ = o v 0 . 0 , J , I , I ,
0.0 0.1 0.2 0.3 0.4
to l a (co in rad/sec)
Fig. 13. Variation of a2 defined in Eq. 17 with agitation.
exp ( ~ T ~ ) - e x p [ ( 1 R T ) F 4 ]
= + . - e x p ~ 1 ~'0 ~L(CN)
With Eq. 14, the steady-state polarization curves obtained by potentiodynamic measurements may be fitted for the parameters: exchange current density i0, limiting current density in, and transfer coefficient a.
The calculated rate and the experimental results agree well as shown in Fig. 14 through 16, respectively, for vari- ous rotation speed, cyanide concentration, and tempera- ture. The close correlation suggests that the reaction mech- anism expressed by reactions 8 and 9 describe the data; and that the rate-determining step is the electron transfer reac- tion plus the slow diffusion of cyanide ions from bulk solu- tions to the surface.
The kinetic parameters determined with Eq. 14 are tabu- lated in Table IV. Within the temperature range studied, the apparent activation energy was found to be 21.12 kJ/ mol (5.05 kcal /mol) for the exchange current densi ty i0. Compar ing the data in Table IV wi th the results f rom the potent ios ta t ic t echn ique and impedance measurements , the three methods provide a sa t is factory check of the model.
Conclusion Elec t rochemica l techniques were used to examine the ki-
netics of si lver cyanida t ion in oxygen-f ree a lkal ine solu- tions. The overal l react ion be tween si lver and cyanide m a y be separa ted into the two e lementary steps: a charge- t rans- fer react ion fo l lowed by a chemica l reaction. With the
charge- t ransfe r step plus the diffusion of cyanide ions from bulk solutions to the si lver surface be ing ra te- l imi t ing , the ra te of dissolut ion can be ca lcula ted using the combined But ler-Volmer and Levich equations.
F rom the e lec t rochemical measurements the diffusion coefficient of cyanide ions in 0.5M KNO3 solutions (pH 11, [Ag] t = 5 • 10-SMand [CN] t = 5 x 10 -4 - 1 • 10-2M)is found to be 1.6 • 10 -5 cm2/s at 24~ and the ac t iva t ion energy
100 , t , , . , o 100 rpm ~ Calculated �9 200
80 v 300 .4oo a 500
~ v �9 �9 �9 v . v �9 - -
6 0 �9 _ w ~ v v ~ v ~
40
u 20
0~ 0.0005 M KCN 0 I I I I i
0 100 200 300 400 500 600
Overpotential (mV)
Fig. 14. Compar i son of calculated and exper imenta l rate for vari- ous rotation speeds.
4000 , , , , ,
t a 0.01 M KCN 24"C, 500 rpm �9 0.005 Calculated v 0.0025
3000 �9 0.001 ! �9
~ 1000
0 i ,
0 100 200 300 400 500 600
Overpotential (mV)
Fig. 15. Comparison of calculated and experimental rate for vari- ous cyanide concentrations.
800
1000 , o O'C �9 10 v 24 �9 40 a 60
400
2OO
0
I I I I
500 rpm, 0.0025 M KCN Calculated
I i I I I i I
0 100 200 300 400 500 600
Overpotential (mV)
Fig. 16. Comparison of calculated and experimental rate for vari- ous temperature.
) unless CC License in place (see abstract). ecsdl.org/site/terms_use address. Redistribution subject to ECS terms of use (see 128.252.67.66Downloaded on 2014-07-02 to IP

J. Electrochem. Soc., Vol. 140, No. 7, July 1993 �9 The Electrochemical Society, Inc. 1927
Table IV. Kinetic parameters determined from steacly-stete polarization curves.
T i0 (P.A/cm 2) at various cyanide concentration (M) Transfer (~ 5 • 10 -4 1 • 10 -3 2.5• 10 -3 5 • 10 -3 1• 10 -2 coefficient
0 10.6 16.7 23.1 33.2 52.0 0.46 10 17.1 22.6 30.6 48.4 77.3 0.48 24 25.9 35.9 58.4 85.1 118.1 0.48 40 38.4 51.2 80.7 119.2 177.4 0.50 60 54.0 77.7 112.2 170.2 250.9 0.53
is 13.7 kJ/mol (3.27 kcal/mol). The apparent exchange cur- rent density in the solutions has an activation energy of 21.1 kJ/mol (5.05 kcal/mol). The transfer coefficient is close to 0.5 but changes with temperature, falling in the range 0.46-0.53.
Manuscript submitted Sept. 18, 1992; revised manuscript received March 1, 1993. This was Paper 391 presented at the St. Louis, MO, Meeting of the Society, May 17-27, 1992.
The University of Utah assisted in meeting the publica- tion costs of this article.
REFERENCES 1. J. V. N. Dorr, Cyanidation and Concentration of Gold
and Silver Ores, Chap. 1, McGraw-Hill, Inc., New York (1936).
2. V. Kudryk and H. H. Kellog, J. Metals, 6, 541 (1954). 3. W. Vielstich and H. Gerischer, Z. Physik. Chem. (New
Series), 4, 10 (1955). 4. E. A. Nechaev and R. Yu. Bek, Electrokhimiya, 2, 150
(1966). 5. A. Otto, Surf. Sci., 75, L392 (1978). 6. J. Billmann, G. Kovacs, and A. Otto, ibid., 92, 153
(1980). 7. R. E. Benner, R. Dornhaus, R. K. Chang, and B. L.
Laube, ibid., 101, 341 (1980). 8. M. Fleischmann, I. R. Hill, and M. E. Pemble, J. Elec-
troanal. Chem., 136, 361 (1982). 9. G. Blondeau, J. Zerbino, and N. Jaffrezic-Renau]t,
ibid., 112, 127 (1980).
10. H. Ba]truschat and W. Vielstich, ibid., 154, 141 (1983). 11. I. A. Ammar, S. Darwish, and K. Rizk, Electrochim.
Acta, 12, 647 (1967). 12. J. Li, Ph.D. Thesis, University of Utah, Salt Lake City,
UT (1991). 13. Yu. V. Pleskov and V. Yu. Filinovskii, The Rotating Disc
Electrode, Chap. 2, Consultants Bureau, New York (1976).
14. T. Erdey-Grfiz, Kinetics of Electrode Processes, Adam Hilger, London (1972).
15. A. J. Bard and L. R. Faulkner, Electrochemical Meth- ods: Fundamentals and Applications, Wiley, New York (1980).
16. E. W. Washburn, International Critical Tables of Nu- merical Data, Physics, Chemistry and Technology, Vol. 3, p. 24, McGraw-Hill, Inc., New York (1928).
17. A. L. Horvath, Handbook of Aqueous Electrolyte Solu- tions: Physical Properties, Estimation and Correla- tion Methods, p. 501, Ellis Horwood, Chichester, England (1985).
18. E. W. Washburn, International Critical Tables of Nu- merical Data, Physics, Chemistry and Technology, Vol. 3, p. 389, McGraw-Hill, Inc., New York (1928).
19. A. L. Horvath, Handbook of Aqueous Electrolyte Solu- tions: Physical Properties, Estimation and Correla- tion Methods, p. 358, Ellis Horwood, Chichester, England (1985).
20. R. Greef, R. Peat, L. M. Peter, D. Pletcher, and J. Robinson, Instrumental Methods in Electrochem- istry, p. 120, Ellis Horwood, Chichester, England (1985).
21. E Opekar and R Beran, J. Electroanal. Chem., 69, 1 (1976).
22. L. Kiss, Kinetics of Electrochemical Metal Dissolution, p. 144, Elsevier, Amsterdam {1988).
23. R. S. Nicholson and I. Shain, Anal. Chem., 36, 706 (1964).
24. K.J. Vetter, Electrochemical Kinetics: Theoretical and Experimental Aspects, p. 157, Academic Press, Inc., New York (1967).
25. C. Gabrielli, Identification of Electrochemical Pro- cesses by Frequency Response Analysis, Chap. 1, So- latron Instruments, England (1980).
Transpassive Oxidation of Pyrite Ximeng Zhu, Jun Li, David M. Bodily, and Milton E. Wadsworth
College of Mines and Earth Sciences, University of Utah, Salt Lake City, Utah 84112
ABSTRACT
The electrochemical behavior of mineral and coal pyrites in basic borate/sulfate solutions was investigated using cyclic voltammetry with both stationary and rotating disk electrodes. Emphasis was centered on transpassive oxidation. In the transpassive region, 0.4 to 0.8 V (SCE), aggressive oxidation of pyrite occurred. The reaction products in this region are Fe(III) oxides, sulfate ion, and partially oxidized sulfur intermediates. The formation of sulfur and polysulfides was identified by in situ Raman spectroscopy. Exposure of pyrite to anodic potentials higher than the transpassive region resulted in rapid oxidation of sulfur intermediates to sulfate ion. The effect of electrode rotation speed, electrode precon- dition time, and upper potential of the scan in the transpassive region was observed to be critical to the formation of sulfur intermediates. Sulfur intermediates, formed in the transpassive region, dramatically affected subsequent oxidation reac- tions occurring in the lower potential region. The magnitude of two dominant oxidation peaks, a ferrous hydroxide peak and an iron sulfide peak, observed in this region correlated directly with the quanti ty of sulfur intermediates formed in the transpassive region. This effect was less pronounced for coal pyrites compared to mineral pyrite.
The electrochemistry of pyrite has been extensively stud- ied, but most investigations have addressed anodic oxida- tion of pyrite in acid solutions. Only limited attention has been directed to the anodic behavior of pyrite in alkaline solutions, TM especially in the anodic transpassive region.
Hamilton and Woods ~ studied the surface oxidation of pyrite and pyrrhotite in 0.05M Na2B407 solutions (pH 9.2) and 0.1M NaOH solutions (pH 13.0) by linear potential sweep voltammetry. The potential scan range used was about -0 .8 to +0.8 V (SHE). In solutions at pH 9.2, an an- odic peak at about 0.0 V (SHE) was observed. The proposed
oxidation reactions were
FeS2 + 3H20 ---> Fe(OH)3 + 2S ~ + 3H § + 3e- [1]
FeS2 + l lH20 --> Fe(OH)3 + 2SO~ + 19H § + 15e- [2]
The proportion of sulfate formed was found to increase with an increase in the upper potential limit of the sweep. The sulfate route is the dominating reaction in alkaline solutions and the formation of elemental sulfur is restricted to the order of a monolayer at pH 9.2 and 13.
) unless CC License in place (see abstract). ecsdl.org/site/terms_use address. Redistribution subject to ECS terms of use (see 128.252.67.66Downloaded on 2014-07-02 to IP