electro-mobility modelling
TRANSCRIPT

ELECTRO-MOBILITY MODELLING
Christian Thiel and Gillian Harrison
Joint Research Centre, Institute for Energy and Transport
University of Leeds 29/04/15

OUTLINE
• BACKGROUND
• Joint Research Centre
• Electro-mobility
• ELECTRO-MOBILITY MODELLING
• Market Agent Model
• Background
• Description
• Fleet Impact Tool
• Geospatial Allocation
• SUMMARY AND DISCUSSION
2

Commissioner Tibor Navracsics Education, Culture, Youth & Sport
President Jean-Claude Juncker 28 Commission Members
Director Giovanni F. De Santi JRC Institute for Energy and Transport
Director-General Vladimír Šucha Joint Research Centre
7 JRC Institutes
BACKGROUND
European Commission Joint Research Centre
3

• Renewable energy
• Sustainable and safe nuclear energy
• Energy security, system and markets
• Energy technologies modelling and assessment
• Alternative fuels
• Hydrogen and fuel cells
• Sustainable transport
• Energy efficiency
BACKGROUND
JRC IET Key Activities
4

BACKGROUND
Key activities
• Technology assessment (techno-socio-economics)
• Modelling of technologies, sectors and the energy system
• Reference technology databases
• Monitoring of technological innovation and of various sectors
Themes
• Low-carbon technologies
• Energy intensive industry
• Critical materials
• E-mobility
• Innovation capacities
Energy Technology Policy Outlook Unit
Support the development and assess the impact of energy technology innovation on the transition to a low carbon society, in support of the
energy, transport, industrial and innovation policies of the EU.
Policies
• Energy Technology
• Industry
• Transport
• Research & Innovation
• Eco-Innovation
5

BACKGROUND
• Perform integrated electro-mobility
modelling activities in order to assist the
design and implementation of electro-
mobility/ transport related policy initiatives
at European and regional/urban level
• EMM will perform comprehensive
multidisciplinary model-based analyses of
technological, market, behavioural aspects
and policy options for electro-mobility
6
Electro-Mobility Modelling Project (EMM)

BACKGROUND
7
EMM Suite of Models TRANSPORT ENERGY
EU/N
atio
nal
R
egio
nal
Market Agent
Model
Lead Market Model
Fleet Impact Model
EV Technologies
Simulator
Travel Behaviour Model
Spatial EV Charging Model
JRC-EU-TIMES
Dispatch Model
Smart Grid
Model
TECHNOLOGY ACTIVITIES
Activity Data
Fleet average CO2, Energy Demand, Technology Costs
Energy Mix, Cost
Real travel values (V, park)
Act
ivit
y p
ater
ns
Spatial/Time Energy Needs
EV Measured Data
(e-VELA)

0
0.5
1
1.5
2
2.5
2010 2015 2020 2025
Pro
jec
tio
n o
f P
HE
V/ E
V n
ew
sa
les
in
Eu
rop
e (
M u
nit
s/y
ea
r)
ERTRAC roadmap
ACEA 2010
Communication,
San Sebastian*
Total sum of member
state targets (per IEA 2009)
*assumption: total car market in Europe: ~15 million new sales per year
current sales (21 models)
Sales projections from 2009 SET-Plan workshop on Electrification of Road
Transport
BACKGROUND
Electro-mobility
8

Based on the corrected EEA CO2 monitoring DBs: http://www.eea.europa.eu/data-and-maps/data/co2-cars-emission-7
BACKGROUND
9
EU Electric Vehicle Sales

BACKGROUND
Source GeM: Combination of slow and fast chargers, most cars not privately owned.
10
Electric Vehicle Grid Power Requests
Power requested per charge
Time of the day (h)
P (
in K
W)
0.0
0.5
1.0
1.5
2.0
2.5
3.0
0 5 10 15 20
Average 1.45 KW
Total power requested
Time of the day (h)
P (
in M
W)
01
02
03
04
0
0 5 10 15 20
Average 20 MW

Electro-mobility as a Flexible Load option
Electric vehicle load shift potential, avoiding peaks during peak time
scenario with 10% electric vehicles in the car fleet
without load shifting with load shifting
Source: JRC Report (2013).ISBN 978-92-79-30388-3
BACKGROUND
11

What do the car drivers know? Familiarity
Low level of familiarity
Source: JRC Report (2013).ISBN 978-92-79-27389-6
COUNTRY
BACKGROUND
AGE
12

Low familiarity yet overall perception in line with actual EV features
Source: JRC Report (2013).ISBN 978-92-79-27389-6
BACKGROUND
Perception of EV Features
8.6
7.8
7.6
9.0
8.9
9.1
8.9
7.9
8.0
6.3
3.8
13

MARKET AGENT MODEL
System dynamics modelling with market agent approach
14
Background Studies the interaction between, and influence of, the
market agents of the automobile sector on possible
powertrain technology transitions within Europe, for
each of the MSs and across the period 1995 to 2050
ADVANTAGES DISADVANTAGES
• Dynamic
• Can include other models
• Captures unexpected non-linear
feedback between elements
• Many scenarios in short time
• Subscription of parameters
• Simplified version of reality
• Dependent on quality/availability
of input data
• For scenario comparison rather
than prediction

Not physically within model, but form decision rules that CLDs are based on
USERS Evaluate, purchase and dispose
vehicles
AUTHORITIES Conceive, implement and monitor
policy and regulation
INFRASTRUCTURE Invest, build, operate and
decommission infrastructure and
maintenance services
MANUFACTURER Produce, price and market
vehicles, and invest in capacity/R&D
15
Overview
MARKET AGENT MODEL

USERS Evaluate, purchase and dispose
vehicles
AUTHORITIES Conceive, implement and monitor
policy and regulation
INFRASTRUCTURE Invest, build, operate and
decommission infrastructure and
maintenance services
MANUFACTURER Produce, price and market
vehicles, and invest in capacity/R&D
Fleet
Sales
+
Forecast sales+
Performancemetrics Emissions
-
-
KEY OUTPUT INDICATORS FOR ALL MARKET AGENTS
15
MARKET AGENT MODEL
Overview

Fleet
Willingness toconsider
+
Sales+
+
Choice
Attractiveness ofPowertrain
+
+
Popularity
Forecast sales+
Performancemetrics
+
Emissions
-
Total Cost ofOwnership -
+
-
+
Convenience +
+
+
+
EnvironmentalImpact
-
AUTHORITIES Conceive, implement and monitor
policy and regulation
INFRASTRUCTURE Invest, build, operate and
decommission infrastructure and
maintenance services
MANUFACTURER Produce, price and market
vehicles, and invest in capacity/R&D
KEY USER ELEMENTS
15
MARKET AGENT MODEL
Overview

Fleet
Willingness toconsider
+
Sales+
+
Choice
Attractiveness ofPowertrain
+
+
Popularity
Forecast sales+
Performancemetrics
+
Emissions
-
Total Cost ofOwnership -
Fuel and recharginginfrastructure
+
Forecast fuel andrecharging infastructure
revenue
+
+
Fuel andrecharging price
+
-
+
Convenience +
++
+
Maintenancenetwork
+
-
+
EnvironmentalImpact
-+
AUTHORITIES Conceive, implement and monitor
policy and regulation
MANUFACTURER Produce, price and market
vehicles, and invest in capacity/R&D
KEY INFRASTRUCTURE PROVIDER ELEMENTS
15
MARKET AGENT MODEL
Overview

Fleet
Willingness toconsider
+
Sales+
+
Choice
Attractiveness ofPowertrain
+
+
Popularity
Revenue
Marketing
+
+
+
Forecast sales+
ComponentR&D
+
Performancemetrics
+
+
Emissions
-
Forecast emissionpenalties
+
+
Profits
+
Production
Productionexperience
+
Costs-
Price
+
Total Cost ofOwnership
+
-Fuel and recharging
infrastructure
+
Forecast fuel andrecharging infastructure
revenue
+
+
Fuel andrecharging price
+
-
+
Forecastprofits
+-
+
+
Convenience +
++
+
-
+
Maintenancenetwork
Componentcost
-
+
+
-
++
EnvironmentalImpact
-
-
+
+
Productioncapacity
+
+
+
AUTHORITIES Conceive, implement and monitor
policy and regulation
KEY AUTOMOBILE MANUFACTURER ELEMENTS
15
MARKET AGENT MODEL
Overview

Fleet
Willingness toconsider
+
Sales+
+
Choice
Attractiveness ofPowertrain
+
+
Popularity
Revenue
Marketing
+
+
+
Forecast sales+
ComponentR&D
+
Performancemetrics
+
+
Emissions
-
Forecast emissionpenalties
+
+
Profits
+
Production
Productionexperience
+
Costs-
Price
+
Total Cost ofOwnership
+
-
Authoritysubsidies
-
Fuel and recharginginfrastructure
+
+
Forecast fuel andrecharging infastructure
revenue
+
+
Fuel andrecharging price
+
-
+
Forecastprofits
+-
-
+
+
Convenience +
++
+
-
+
Maintenancenetwork
+
Componentcost
-
+
+
Fleet EmissionPenalties
+-
++
EnvironmentalImpact
-
-
+
-
+
Productioncapacity
+
+
+
KEY AUTHORITY ELEMENTS
15
MARKET AGENT MODEL
Overview

Fleet
Willingness toconsider
+
Sales+
+
Choice
Attractiveness ofPowertrain
+
+
Popularity
Revenue
Marketing
+
+
+
Forecast sales+
ComponentR&D
+
Performancemetrics
+
+
Emissions
-
Forecast emissionpenalties
+
+
Profits
+
Production
Productionexperience
+
Costs-
Price
+
Total Cost ofOwnership
+
-
Authoritysubsidies
-
Fuel and recharginginfrastructure
+
+
Forecast fuel andrecharging infastructure
revenue
+
+
Fuel andrecharging price
+
-
+
Forecastprofits
+-
-
+
+
Convenience +
++
+
-
+
Maintenancenetwork
+
Componentcost
-
+
+
Fleet EmissionPenalties
+-
++
EnvironmentalImpact
-
-
+
-
+
Productioncapacity
+
+
+
1549 ELEMENTS WITH UP TO 10,000 SUBSCRIPTS
2972 DATA INPUTS
707,720 ELEMENTS OVERALL AT EACH TIME STEP
=
+
63,668 CONSTANT VALUES
641,079 SIMULTANEOUS EQUATIONS
+
Including….
15
48 VENSIM VIEWS
+
MARKET AGENT MODEL
Overview

16
Name Elements
Powertrain
Petrol ICEV; Diesel ICEV;
LPG ICEV; CNG ICEV; Biodiesel ICEV; Bioethanol ICEV;
Petrol HEV; Diesel HEV; Biodiesel HEV; Bioethanol HEV;
Petrol PHEV; Diesel PHEV; Biodiesel PHEV; Bioethanol PHEV;
BEV;
FCV
Vehicle Class Passenger, Light Commercial
Vehicle Size Small, Medium, Large
Vehicle Age Under 2 Years; 2 to 5 Years; 5 to 10 Years; Over 10 Years
Country Each member state
Powertrain Class BEV; FCV; HEV; ICEV
Fuel Biodiesel; Bioethanol; CNG; Diesel; Electric; Hydrogen; LPG; Petrol
Users Private, Fleet, Public
Geography Urban, Non-Urban
Utility Criteria Environment; Performance; Reliability; Safety;
Convenience; Popularity; Choice; Cost
Component Electric drive system; BEV battery; HEV battery; PHEV battery; IC engine;
Hydrogen storage tank; Body materials; Fuel cell system
Primary Energy
Source Renewables, Oil; Gas; Solids; Nuclear
MARKET AGENT MODEL
Subscripts
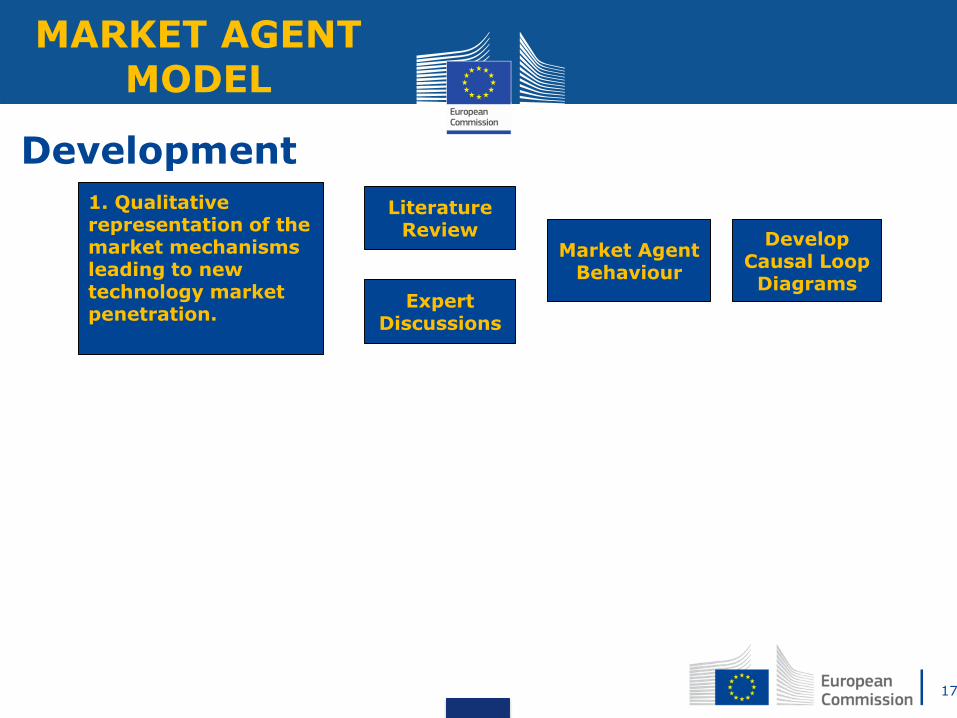
1. Qualitative representation of the market mechanisms leading to new technology market penetration.
Literature Review
Expert Discussions
Develop Causal Loop
Diagrams
Market Agent Behaviour
MARKET AGENT MODEL
Development
17

1. Qualitative representation of the market mechanisms leading to new technology market penetration.
2. Development of a quantitative simulation model from the established causal loop diagrams.
Literature Review
Expert Discussions
Develop Causal Loop
Diagrams
Market Agent Behaviour
Stocks and Flows
Subscripts Underlying Equations
Data Collection
Assumptions and
compromises
Boundaries
MARKET AGENT MODEL
Development
18

19
1. Qualitative representation of the market mechanisms leading to new technology market penetration.
2. Development of a quantitative simulation model from the established causal loop diagrams.
3. Establishment of a baseline scenario and conduct of scenario analyses.
Literature Review
Expert Discussions
Develop Causal Loop
Diagrams
Market Agent Behaviour
Stocks and Flows
Subscripts Underlying Equations
Data Collection
Assumptions and
compromises
Reality Checks
Calibration Sensitivity
Testing
Boundaries
MARKET AGENT MODEL
Development

20
3. Establishment of a baseline scenario and conduct of scenario analyses.
Reality Check
Calibration Sensitivity
Testing
MARKET AGENT MODEL
Development
Basic checks that the model is performing
logically
"For a model to be reasonable when I ___________ it should _______"
Name Test Input Description Outcome
No population no sales
No population If population is zero, then there should be zero vehicle demand
Initially failed as scrappage schemes did not account for population size. Minor technical
adjustment to ensure no sales if no population
No willingness to buy no sales
No willingness to buy
If willingness to buy a powertrain is zero, then there should be no sales
Initially failed as willingness to buy was influencing indicated market share which is then
smoothed to provide an actual market share. This is an error as willingness to purchase should
be an immediate impact. This was rectified by including willingness to buy after the smoothing
function

27
3. Establishment of a baseline scenario and conduct of scenario analyses.
Reality Checks
Calibration Sensitivity
Testing
Experiments to determine
coefficients that relate variables to historical patterns.
MARKET AGENT MODEL
Development
1. Need historical data and relationship to parameter to be determined 2. Historical time series data sets are inputs in a separate model to
establish a Vensim data set to use as a "payoff definition" 3. These data sets are used in Vensim optimisation routines to
determine unknown values of parameters within the main model by running model many times at different (bounded) values until a best fit is achieved
eg Vehicle Registrations

21
Population
GDP per capita
coeff 1
coeff 2
Initial GDP per
capita
Average
Household Size
coeff 3
Number of
Households
Initial Historic
passenger demand
initial passenger
demand
GDP Ratio
indicated calibrated
passenger new
registrations
initial
households
household ratio
Passenger Vehicle Registrations
4 M
3 M
2 M
1 M
0
22
2 2 2
2 2 2
2 2 2
22
21 1 11 1 1 1 1 1
11
1 1 1 1
1996 1998 2000 2002 2004 2006 2008 2010 2012
Time (Year)
Veh
icle
/Yea
r
calibrated passenger new registrations[United Kingdom] : Baseline to 2012 1 1 1 1 1 1 1Eurostat 2 2 2 2 2 2 2 2 2 2 2 2 2 2 2
MARKET AGENT MODEL
Calibration
New Registrations = Initial Demand x coeff 1 x GDP Ratiocoeff 2 x Household Ratiocoeff 3
Coeff 1 = 0.9344 Coeff 2 = 0.5083 Coeff 3 = 0.01
22
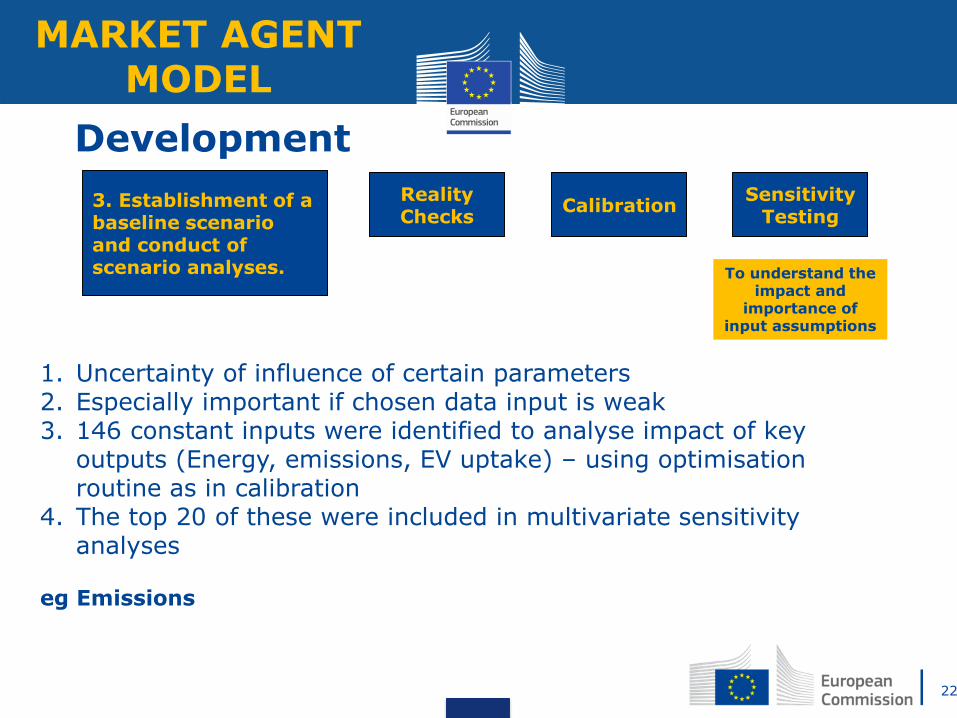
3. Establishment of a baseline scenario and conduct of scenario analyses.
Reality Checks
Calibration Sensitivity
Testing
To understand the impact and
importance of input assumptions
1. Uncertainty of influence of certain parameters 2. Especially important if chosen data input is weak 3. 146 constant inputs were identified to analyse impact of key
outputs (Energy, emissions, EV uptake) – using optimisation routine as in calibration
4. The top 20 of these were included in multivariate sensitivity analyses
eg Emissions
MARKET AGENT MODEL
Development
23
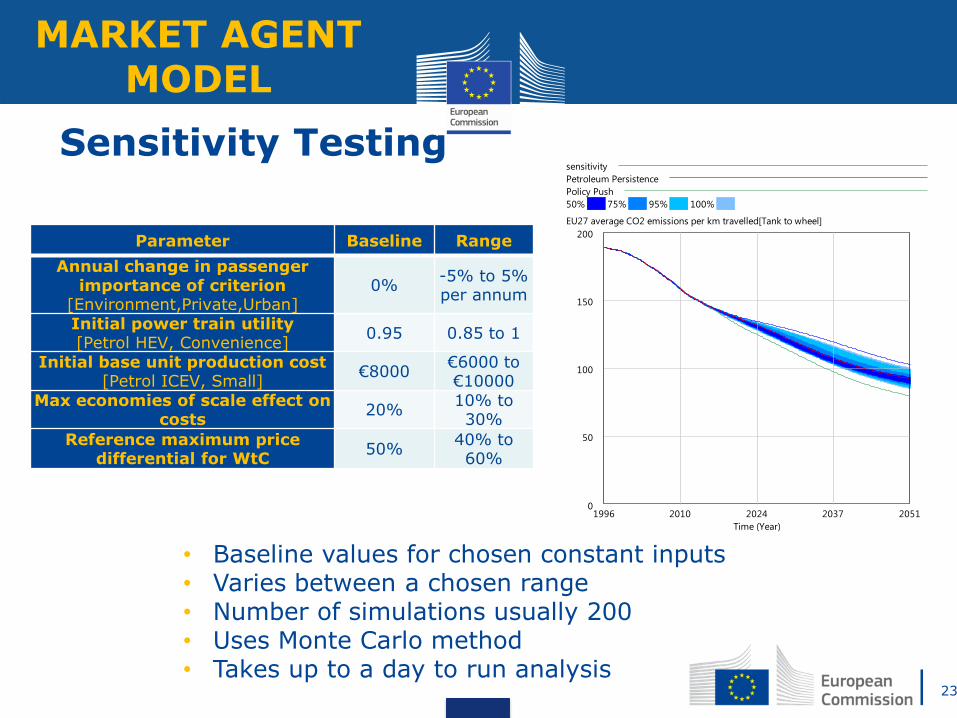
sensitivity
Petroleum Persistence
Policy Push
50% 75% 95% 100%
EU27 average CO2 emissions per km travelled[Tank to wheel]
200
150
100
50
01996 2010 2024 2037 2051
Time (Year)
• Baseline values for chosen constant inputs • Varies between a chosen range • Number of simulations usually 200 • Uses Monte Carlo method • Takes up to a day to run analysis
Parameter Baseline Range
Annual change in passenger importance of criterion
[Environment,Private,Urban]
0% -5% to 5% per annum
Initial power train utility [Petrol HEV, Convenience]
0.95 0.85 to 1
Initial base unit production cost [Petrol ICEV, Small]
€8000 €6000 to €10000
Max economies of scale effect on costs
20% 10% to 30%
Reference maximum price differential for WtC
50% 40% to 60%
MARKET AGENT MODEL
Sensitivity Testing

Development of baseline scenarios based on market conditions (oil
price, GDP growth rate, R&D learning rate) and government policies
(EV purchase subsidies, fleet emission regulation targets)
Policies have greater influence on EV success than market
conditions
25
MARKET AGENT MODEL
Baselines

Scenarios of exploring interaction between fleet emission regulations
targets, EV purchase subsidies and infrastructure provision subsidies
Policies aimed at users can make significant short term impacts
(depending on timing and length)
Policies aimed at manufacturers (fleet emission regulation) have
greater influence on EV market share over the long term
Infrastructure subsidies appeared to have an impact only when
complemented with other policies (subsidies; fleet emission
regulation)
Important interactions between EV types were identified
26
MARKET AGENT MODEL
Policy Analysis

27
2030
BASELINE: CURRENT EMISSION TARGET, NO SUBSIDIES
MARKET AGENT MODEL
Results

2030
SUBSIDIES 1: CURRENT EMISSION TARGET, LOW SUBSIDIES
83%
308%
27
MARKET AGENT MODEL
Results

2030 2030
EXTENDED CO2 1: PROPOSED EMISSION TARGET, LOW SUBSIDIES
6%
NEGLIGIBLE
27
MARKET AGENT MODEL
Results
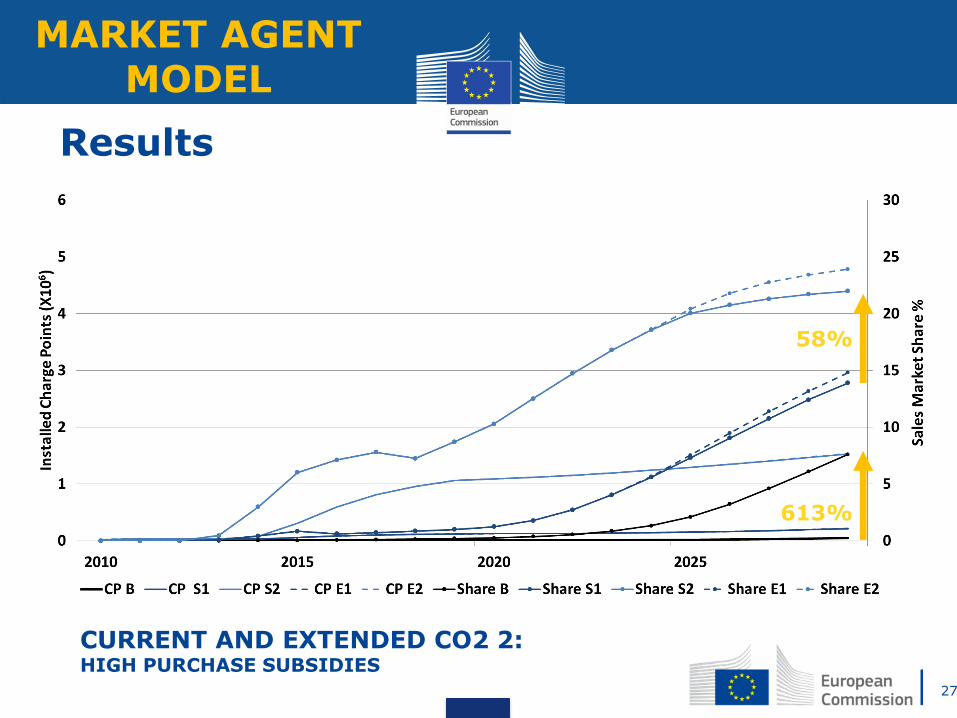
2030
CURRENT AND EXTENDED CO2 2: HIGH PURCHASE SUBSIDIES
58%
613%
27
MARKET AGENT MODEL
Results

2030
CURRENT AND EXTENDED CO2 3: HIGH INFRASTRUCTURE SUBSIDIES
683%
NEGLIGIBLE
27
MARKET AGENT MODEL
Results

2030
CURRENT AND EXTENDED CO2 4: HIGH SUBSIDIES
11,153%
27
MARKET AGENT MODEL
Results

Sensitivities of EV uptake to the desired ratio of EV to charging point
Reducing ratio below 10EV/CP significantly increases costs for
limited additional success
Sales market share is relatively independent of infrastructure
provision until stock share is over 5%
28
MARKET AGENT MODEL
Infrastructure

• Ongoing model development: • Data • Structure • Scenarios • User preferences
• Development of analysis regarding
individual countries • Integration with other EMM models –
especially Dione (Fleet Impact Model)
29
MARKET AGENT MODEL
Current Research

• Tool for vehicle stock projection and scenario evaluation
• Contains up-to-date vehicle stock datasets and energy and emission
factors of all vehicle types in each EU MS and EU28
• Calibrated baseline
• Fuel consumption and emission calculations
• Can be used for Defining and Running scenarios
• Output from PTTMAM can be input to Dione
30
DIONE (Fleet Impact)
Overview

31
INPUTS OUTPUTS
• Vehicle stock • New registrations • Survival rates • Activity • Efficiency • Allocation of mileage to different
fuels for flex-fuel vehicles • Fuel pathways for energy
consumption and emissions • Biofuel admixture shares for
conventional fuels • Driving patterns • Custom Vehicles … for single or groups of EU Member States or custom regions
• Vehicle Stock and Scrappage • Activity • Energy Consumption (by Fuel) • GHG and Air Pollutant Emissions
Display Options: As time series or for specific years, for single vehicle types or aggregate, graphics or data, for baseline and/or one or several user defined scenarios,…
DIONE (Fleet Impact)
Overview

• German 2050 PC fleet composition ("Electric Vehicle dominated” Scenario*)
5% ICE 35% PHEV 35% BEV 25% FCEV
• Linear development of stock towards 2050 target
• Roughly keeping Baseline 2050 overall PC fleet size (ca. 37m) and LPG/CNG
vehicles (ca. 1m)
*Source: ‘A portfolio of power-trains for Europe’ (McKinsey 2010)
ENERGY CO2 EMISSIONS
DIONE (Fleet Impact)
Example
32

• Urban planning spatial analysis approach
• Use of GIS software tools (ArcGIS, QGIS, GRASS…)
• The required input data may vary, depending on the purpose, needs and the examined area but may include:
• Road network grid
• Parking areas and lots
• Residential and labor statistics
• Traffic density
• Electric power distribution network
• Existing charging points
• Service areas (gas stations, restaurants etc)
• Public transport stations
• Landscape morphology
33
GEOSPATIAL ALLOCATION
Overview

SUMMARY
34
Modelling is an important research tool in gathering scientific support for policy
There are many types of electro-mobility modelling activities being carried out in the JRC to help inform policy decision making in the European Commission
We welcome opportunities for networking or collaboration and hosting visiting scientists
THANK YOU
The Commission's Strategic Energy Technologies Information System:
http://setis.ec.europa.eu