electro-drawn polymer microneedles for transdermic ... microneedles.pdf · list of symbols and...
TRANSCRIPT

Dipartimento di Ingengeria Chimica, dei Materiali e della Produzione
Industriale
ELECTRO-DRAWN POLYMER MICRONEEDLES FOR
TRANSDERMIC DELIVERY OF LIPOPHILIC AND
HYDROPHILIC COMPOUNDS
Philosophical doctorate thesis in materials and structures engineering
Coordinator:
Ch.mo Prof. Giuseppe Mensitieri
Tutor: Candidate:
Ch.mo prof. Paolo Antonio Netti Eliana Esposito
Supervisor:
Ing. Raffaele Vecchione, PhD
March, 2014

to Parish,
to my family,
because they have always
encouraged me to not give up.

ELECTRO-DRAWN POLYMER MICRONEEDLES FOR
TRANSDERMIC DELIVERY OF LIPOPHILIC AND
HYDROPHILIC COMPOUNDS

Index
iii
Index
Summary pag. vi
List of symbols and abbreviation pag. viii
Introduction pag. 1
CHAPTER 1
State of art on transdermal drug delivery
1.1 Controlled drug delivery pag.3
1.2 Transdermal Drug Delivery pag. 6
1.2.1 Skin: the first barrier pag. 7
1.2.2 Devices and technologies for transdermal delivery pag. 9
1.3 Microneedles pag. 14
1.3.1 Metallic and silicon microneedles pag. 15
1.3.2 Polymeric microneedles pag. 19
1.3.2.1 Replica molding pag. 20
1.3.2.2 Free mold fabrication pag. 27
1.4 Applications pag. 31

Index
iv
CHAPTER 2
Experimental method
2.1 New manufacturing technique pag. 32
2.2 Materials pag. 35
2.2.1 PLGA pag. 36
2.3 Fabrication steps pag. 39
2.3.1 PDMS support pag. 39
2.3.2 Electro-drawing of dissolvable microneedles pag. 40
2.3.3 Microneedles by stamp pag. 42
2.4 Morphological analysis pag. 43
2.4.1 Chromophore distribution pag. 43
2.4.2 Porosity pag. 44
2.5 Mechanical characterization pag. 45
2.5.1 Analysis of mechanical properties pag. 45
2.5.2 Indentations in skin pag. 46
2.6 Drug release kinetics pag. 48
2.6.1 Samples preparation pag. 50
2.6.2 Determination of acquisition parameters pag. 52
2.6.3 Drug loaded quantification pag. 54

Index
v
CHAPTER 3
Results and discussion
3.1 Electro-drawn microneedles pag. 56
3.2 Microneedles on pillars pag. 60
3.3 Hydrophobic and hydrophilic drugs loading pag. 64
3.3.1 Porous microneedles pag. 67
3.3.2 Double drop deposition pag. 69
3.3.3 Porous microneedles by stamp pag. 70
3.4 Quantification of model drug loaded pag. 74
3.5 Drug release kinetics pag. 76
3.6 Indentations pag. 80
3.6.1 Preliminary tests pag. 80
3.6.2 Indentation in skin pag. 82
3.6.3 Nanoindentation pag. 84
3.7 Conclusions pag. 87
Appendix Instruments pag. 89
A.I.1 Confocal Microscope pag. 89
A.I.2 Multiphoton fluorescence microscopi pag. 92
A.I.3 Immersion sonicator pag. 93
A.I.3 Fluorescence Spectroscopy pag. 95
A.I.4 Nano Indenter pag. 97
A.I.5 Cryo UltraMicrotome pag. 99
A.I.6 Scanning Electron Microscope pag. 100
References pag.102
Acknowledgements pag.110

Summary
vi
Summary
Transdermic drug delivery is emerging more and more since it overcomes
some disadvantages of classical route of administration. Indeed, kinetics of
delivery can be controlled, avoiding bolus release, and environment in which drugs
diffuse is safer way than gastro-intestinal tract. The systems currently used for
transdermic delivery, like electroporation, iontophoresis and penetration
enhancers, are very complex and relatively dangerous for patient. These systems
destabilize the structure of stratum corneum to increase skin permeability, or
using chemical substances that interact with lipids, or through the passage of
electrical currents in the skin.
By using patches with microneedles, it has been proved that it is possible to solve
mechanically problems related to the permeability of the stratum corneum, also
for molecules with large size; indeed, microneedles create micro holes in skin,
without destabilizing chemically its structure. By various research groups both
metallic and polymeric microneedles have been manufactured, using different
techniques of production. Polymeric biodegradable microneedles allow obtaining a
better control of kinetics release and to load an higher drug’s amount.
The purpose of this work was to develop a new manufacturing technique which
overcomes the constraints of the techniques already used, preserving the
effectiveness of the final device obtained. The new method exploits the electric
field, generated by a pyroelectric crystal, for the formation, through the drawing of
a polymer solution, of micro conical tips able to cross the stratum corneum. The
entire production process takes a few minutes at mild temperatures, without
creating any contact between the polymeric solution and other things that may be
contaminated. The shaping effect of the electric field can be run on both simple
polymer solutions (PLGA in dimethyl carbonate) and on water in oil emulsions. In
the latter case it was possible to load both hydrophobic compounds in the polymer
matrix, and hydrophilic molecules in the aqueous phase emulsified in the polymer
solution. To limit the presence of drug only in the cone and minimize wastage of

Summary
vii
active compounds, it was used a double drop deposition. It means that a drop of
simple solution of PLGA is used like base, and then a smaller drop loaded with drug
is deposited on it.
Another important objective of this project was the manipulation microneedles
morphology. To produce several degrees of porosity in the polymeric matrix, it was
changed the water content in the emulsion. By increasing water phase, it was
possible to obtain higher release rates and degradation of PLGA matrix. However,
the maximum amount of water is limited by mechanical properties: microneedles
have to preserve enough resistance to indent the skin.

List of symbols and abbreviations
viii
LIST OF SYMBOLS AND ABBREVIATIONS
BSA-TRITC = Albumin, Tetramethylrhodamine isothiocyanate bovine
CLSM = confocal laser scanning microscopy
CMC = carboxymethyl cellulose
d = distance
Dc = critical distance
DCJIs = disposable cartridge jet injectors
DCM = dicholomethane
DDS = Drug Delivery System
DMC = Dimethylcarbonate
DNA = Deoxyribonucleic acid
DP = driving plate
EHD = Electrohydrodynamic
FDA = Food and Drug Administration
h = needle height
LT = Lithium tantalite
MPM = multiphoton microscopy
MUNJIs = multi-use nozzle jet injectors
NIR = near infrared
NR = Nile Red
PBS = phosphate buffered saline
PDMS = Polydimethylsiloxane
PEGDA = poly (ethylene glycol) diacrylate
pi = the pyroelectric coefficient
PLA = poly-lactic acid

List of symbols and abbreviations
ix
PLGA = Poly(lactide-co-glycolic acid)
PVP = polyvinylpyrrolidone
Rh6G = Rhodamine 6G
RNA = Ribonucleic acid
SC = stratum corneum
UV = ultra violet
V = volume
ΔPi = coefficient of the polarization vector
ΔT = temperature variation
θ = contact angle
Introduction
1
Introduction
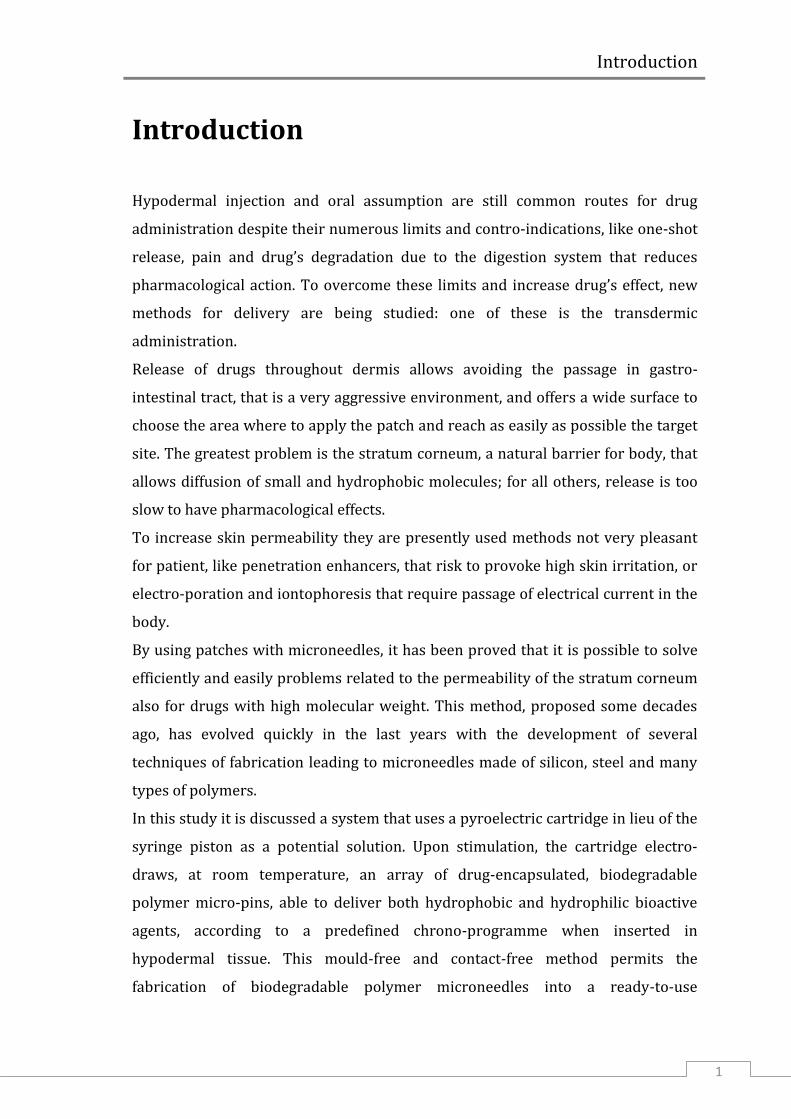
Hypodermal injection and oral assumption are still common routes for drug
administration despite their numerous limits and contro-indications, like one-shot
release, pain and drug’s degradation due to the digestion system that reduces
pharmacological action. To overcome these limits and increase drug’s effect, new
methods for delivery are being studied: one of these is the transdermic
administration.
Release of drugs throughout dermis allows avoiding the passage in gastro-
intestinal tract, that is a very aggressive environment, and offers a wide surface to
choose the area where to apply the patch and reach as easily as possible the target
site. The greatest problem is the stratum corneum, a natural barrier for body, that
allows diffusion of small and hydrophobic molecules; for all others, release is too
slow to have pharmacological effects.
To increase skin permeability they are presently used methods not very pleasant
for patient, like penetration enhancers, that risk to provoke high skin irritation, or
electro-poration and iontophoresis that require passage of electrical current in the
body.
By using patches with microneedles, it has been proved that it is possible to solve
efficiently and easily problems related to the permeability of the stratum corneum
also for drugs with high molecular weight. This method, proposed some decades
ago, has evolved quickly in the last years with the development of several
techniques of fabrication leading to microneedles made of silicon, steel and many
types of polymers.
In this study it is discussed a system that uses a pyroelectric cartridge in lieu of the
syringe piston as a potential solution. Upon stimulation, the cartridge electro-
draws, at room temperature, an array of drug-encapsulated, biodegradable
polymer micro-pins, able to deliver both hydrophobic and hydrophilic bioactive
agents, according to a predefined chrono-programme when inserted in
hypodermal tissue. This mould-free and contact-free method permits the
fabrication of biodegradable polymer microneedles into a ready-to-use

Introduction
2
configuration. The aim is to realize a device efficacy and user-friendly for patient,
with fabrication steps that save drug’s integrity.

Chapter 1 – State of art on transdermal drug delivery
3
Chapter 1
State of art on transdermal drug delivery
1.1 Controlled drug delivery
Conventional pharmacotherapy involves the use of drugs whose absorption
and therefore bioavailability depends on many factors, such as solubility,
molecular weight, and chemical stability. All these parameters can hinder the
achievement of a therapeutic response. Especially a low molecular weight confers
them the capability to cross different body compartments and reach numerous cell
types. However, this indiscriminate distribution leads to the occurrence of side
effects and to the need for higher doses of the drug to elicit a satisfactory
pharmacological response [1]. Drug delivery system (DDS) is a broad term for
technologies that send drugs to the appropriate target site and release them with a
time-controlled kinetics, for generating therapeutically desirable effects reducing
drug dose required. DDS are usually high molecular weight carriers, such as nano-
and micro-particles or capsules, micelles and dendrimers, in which the drug is
embedded or covalently bound. Polymeric carriers aim is to transport drugs until
target site protecting them from interaction with others molecules which could
cause a change in the chemical structure of the active ingredient causing the loss of
pharmaceutical action, especially in case of protein drugs or DNA [2]. By changing
polymer and design of carriers, stability of drugs in specific body sections and
release kinetics can be modulated [3]. Release control technology has many
advantages compared to traditional systemic administration. With traditional
systems drugs are administered at once, this means that the concentration of drug
in the body may exceed the limit of toxicity. As the concentration of drugs decays
over time, to maintain it for a clinically significant time in the therapeutic window
the administration of drug should be repeated. Therapeutic window is defined as

Chapter 1 – State of art on transdermal drug delivery
4
drug level range in plasma between the minimum effective level, below which
there is no therapeutic effect, and the maximum desired level, above which drug
becomes toxic for the body. New controlled release devices can provide a release
profile valid for a period as long as included in the therapeutic window, therefore
reducing number of administrations (figure 1.1) [4].
Fig 1.1: Comparison between drug concentration in plasma with a conventional delivery system (a) and with a controlled release system (b).
The choice of the polymer used to realize the device, has to be made carefully. An
ideal material should be without impurities, biocompatible and easy to be
processed. The type of material also depends on the kind of issues that one would
accomplish and the type of drug incorporated.
There are several mechanisms by which drugs are delivered from devices. Drugs
can be loaded inside polymeric matrix and delivered through diffusion or by
degradation of polymer; some systems are formed by capsules with polymeric
coating, which permeability dictates release of drugs. These devices realize an
extended (or prolonged) release, in which drug release is not necessary constant
but extend duration of therapeutic action more than one-shot delivery as
represented in figure 1.2.

Chapter 1 – State of art on transdermal drug delivery
5
Fig 1.2: Plot of drug concentration versus time for different release system.
Other types of devices provide a kinetic profile of zero-order, i.e. drug
concentration in plasma remains constant in time for a long period of time, until
depletion of drug cargo. In these cases drug outflow is controlled by osmotic
potential gradients across semi-permeable polymer barriers. After immersion in
water, the system hydrates causing an increase in pressure that pushes out,
through orifice in membrane, drug solution [5] (figure 1.3).
Fig 1.3: Operation scheme of an osmotic drug delivery system.

Chapter 1 – State of art on transdermal drug delivery
6
The development of functional delivery systems is strictly correlated to the
administration route chosen. In the last years, transdermal delivery is emerging as
a high performing and minimally invasive pharmacological treatment.
1.2 Transdermal Drug Delivery
Drug can be administered through the most common routes like the oral,
parenteral, ophthalmic and transdermal route, each one with specific merit and
disadvantages. The parenteral route is the most direct way of getting molecules
into the body circulation. Injection of therapeutics through the skin into the blood
stream or surrounding tissues produces high delivery efficiency within a very
short administration time. This method of delivery is accomplished almost
exclusively by needle-syringe system. However, the sharp hypodermic needle
generates pain, leading to low patient compliance and needle phobia [6].
Moreover, it entails risk of infection due to the damage induced in the skin. It can
be difficult to obtain a sustained drug concentration in plasma, requiring repeated
administration carried out by specialized personnel. Especially in case of
prolonged care, it becomes even more difficult to make sure that the patient
assumes drugs in determined times to ensure continuity in therapeutic effect. Oral
drug delivery systems, although very simple, have the great disadvantage of drug
degradation in gastro-intestinal tract, which makes it not suitable for release of
protein or DNA based compounds, and a variable absorption for each patient,
depending on several factors like pH, food, mucus layer[7].
Transdermal drug delivery is an alternative to classical methods of administration.
Its key advantages include easy accessibility of skin, which aids in high patient
compliance, avoidance of gastrointestinal tract and ability to achieve sustained
release. Since skin has a structure that allows passage of only small and
hydrophobic molecules, several technique have been developed to temporary
increase permeability of stratum corneum. To better understand difficulties
involved it is necessary to consider the structure of skin.

Chapter 1 – State of art on transdermal drug delivery
7
1.2.1 Skin: the first barrier
Skin is the first barrier for the body against pathogen agent and anything
that can be dangerous for the organism. It also provides resistance to shocks for
the more sensitive tissues underneath. At the same time, however, skin needs to be
supple and able to stretch to accommodate movements.
As showed in figure 1.4, skin can be divided into three layers: (1) the epidermis,
which contains the stratum corneum, (2) the middle layer, dermis, and (3) the
inner most layer, hypodermis.
Fig 1.4: Structure of skin.
The dermis, an integrated fibro-elastic structure measuring 1-2 mm, gives
mechanical strength to the skin. There is a rich capillary bed in the superficial
dermis, just below the epidermis, which is the primary site of drug uptake into
systemic circulation. Thus, successful transdermal drug delivery typically involves

Chapter 1 – State of art on transdermal drug delivery
8
drug transport across the epidermis to the superficial dermal capillary bed. The
pain associated with parenteral drug delivery is due to possible damage to the
nerves endings within the dermis [8]. The epidermis layer is 150-200 μm thick and
is made up of viable cells with no vascular networks. There is a basement
membrane at the base of epidermis and there are tight junctions in the viable
epidermis [9], both of which may offer resistance to the transport of molecules
across the epidermis. The outermost layer of the epidermis (10-20 μm) consists of
dead cells, known as the stratum corneum (SC), which act as a rigorous barrier and
protect body from water loss. It is composed of layers of corneocytes which
overlap. The major constituent of stratum corneum cells is the keratin and is
rather dense in composition. The SC is dynamic in nature and renews itself every
14 days [10], it is constantly maintained by reproduction of inner living epidermal
keratinocytes which undergo a process of terminal differentiation and then
migrate to the surface as interlocking layers of dead stratum corneum cells.
SC structure is akin to a wall built from bricks and mortar (figure 1.5), the
keratinized layer also consists of hard building blocks (the individual corneocytes)
stuck together with space-filling mortar (intercorneocyte lipids) [11]. Barrier
function of epidermis depends on the good state of its bricks and mortar. There are
two main pathways by which drugs can cross the skin and reach the systemic
circulation. The more direct route is known as the transcellular pathway. By this
route, drugs cross the skin by directly passing through both the phospholipids
membranes and the cytoplasm of the dead keratinocytes. The drugs encounter
significant resistance to permeation, because they must cross the lipophilic
membrane of each cell, then the hydrophilic cell body containing keratin; these
steps have to be repeated numerous times to traverse the full thickness of the
stratum corneum. The other more common pathway through the skin is via the
intercellular route. Drugs must pass through the small spaces between the cells of
the skin, making the route more tortuous. Although the thickness of the SC is only
about 20 µm, the actual diffusional path of most molecules crossing the skin is on
the order of 400 µm [12]. In any case, for almost all drugs, these types of diffusion
are too slow to allow enough diffusion and obtain a therapeutic effect.

Chapter 1 – State of art on transdermal drug delivery
9
Fig 1.5: Possible pathways for delivery of compounds across the stratum corneum.
By destabilizing this structure it is possible to increase skin permeability also for
those molecules that would never be able to cross the stratum corneum.
1.2.2 Devices and technologies for transdermal delivery
From a global perspective, advances in transdermal delivery systems can be
categorized in three different generations. The first generation is mainly based on
today’s patches produced by judicious selection of drugs that can cross the skin at
therapeutic rates with little or no enhancement. In addition to patches, in this class
are included liquid spray, gel and other topical formulation. The second generation
is characterized by additional advances for the delivery of small-molecules by
means of an increase of skin permeability and the use of driving forces for
transdermal transport; an example is provided by chemical enhancers conjugated
to drug. At the end, the third generation is meant to enable transdermal delivery of
small-molecule drugs, macromolecules (including proteins and DNA) and virus-

Chapter 1 – State of art on transdermal drug delivery
10
based and other vaccines through targeted permeabilization of the skin’s stratum
corneum [13].
The type of technology used by transdermal devices can be divided into passive or
active methods based on whether or not an external source of energy is used for
skin permeation enhancement. Passive methods include use of chemical
enhancers, emulsions and lipid assemblies, that increase stratum corneum
permeability through different mechanisms. They may act on the desmosomes, a
type of proteic junctional complex localized spot-like on the lateral sides of plasma
membranes, forming cohesion between keratinocytes, or modify the intercellular
lipid domains to reduce the barrier resistance of the bilayer lipids [14](figure 1.6).
but are often associated with higher skin irritation.
Fig. 1.6: Action of penetration enhancers within the intercellular lipid domain.
Chemical approaches have emphasized formulations that selectively disrupt lipid
bilayer structures in the stratum corneum to avoid effects in the viable epidermis
in order to prevent skin irritation. In this way, the increase of permeability is
limited to SC but do not address the barrier of the full epidermis, reducing release
efficiency [15].
Chapter 1 – State of art on transdermal drug delivery
11
Active methods, like electroporation and iontophoresis, increase transport across
the skin by physically disrupting the barrier or using a driving force for drug
transport, through an external energy source.
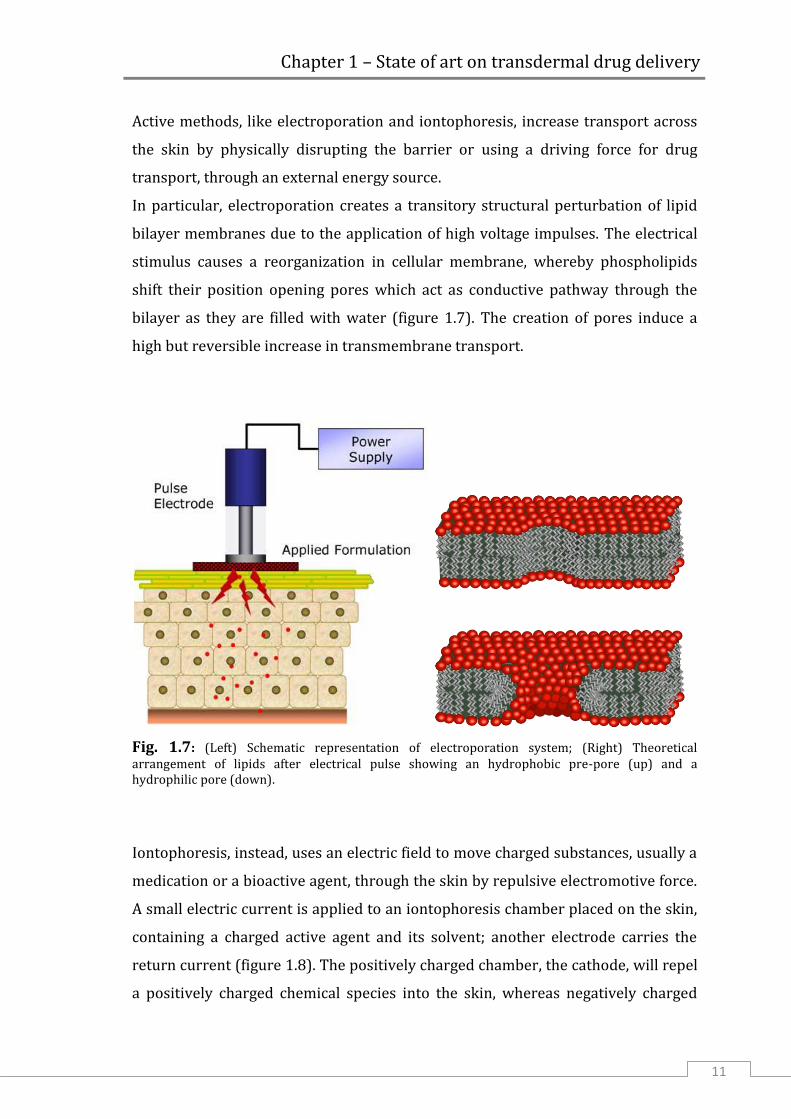
In particular, electroporation creates a transitory structural perturbation of lipid
bilayer membranes due to the application of high voltage impulses. The electrical
stimulus causes a reorganization in cellular membrane, whereby phospholipids
shift their position opening pores which act as conductive pathway through the
bilayer as they are filled with water (figure 1.7). The creation of pores induce a
high but reversible increase in transmembrane transport.
Fig. 1.7: (Left) Schematic representation of electroporation system; (Right) Theoretical arrangement of lipids after electrical pulse showing an hydrophobic pre-pore (up) and a hydrophilic pore (down).
Iontophoresis, instead, uses an electric field to move charged substances, usually a
medication or a bioactive agent, through the skin by repulsive electromotive force.
A small electric current is applied to an iontophoresis chamber placed on the skin,
containing a charged active agent and its solvent; another electrode carries the
return current (figure 1.8). The positively charged chamber, the cathode, will repel
a positively charged chemical species into the skin, whereas negatively charged

Chapter 1 – State of art on transdermal drug delivery
12
substances have to be loaded on the anode. These devices are equipped with a
power supply, which adds to the cost and the complexity of the treatment, and
requires the passage of current in the body of the patients, resulting annoying or
even painful for them [16]. Furthermore, both these methods need the presence of
trained sanitary personnel.
Fig 1.8: Scheme of iontophoresis system.
Another active method is liquid jet injection, which use a high-speed jet to
puncture the skin and deliver drugs with no use of a needle (figure 1.9). Jet
injectors can be broadly classified into multi-use nozzle jet injectors (MUNJIs) and
disposable cartridge jet injectors (DCJIs), depending on the number of injections
carried out with a single device.

Chapter 1 – State of art on transdermal drug delivery
13
Fig 1.9: Schematic depiction of the jet injection process. A) Impact of a piston on a liquid reservoir in the nozzle increases the pressure, which shoots the jet out of the nozzle at high velocity (velocity >100 m s–1). B) Impact of the jet on the skin surface initiates formation of a hole in the skin through erosion, fracture or other skin failure modes. C) Continued impingement of the jet increases the depth of the hole in the skin. If the volumetric rate of hole formation is less than the volumetric rate of jet impinging the skin, then some of the liquid splashes back towards the injector. D)| As the hole in the skin becomes deeper, the liquid that has accumulated in the hole slows down the incoming jet, and the progression of the hole in the skin is stopped.
Liquid jet injections for immunization were first carried out using MUNJIs, which
allowed repeated injections of vaccine from the same nozzle and reservoir at a rate
of up to 1,000 immunizations per hour. They were successfully adopted for rapid
mass immunization using vaccines against a large number of diseases, including
measles, smallpox, cholera, HBV, influenza and polio [17]. But after problems of
cross-contamination, due to splash back of interstitial liquid from the skin onto the
nozzle, it has gone to use DCJIs that have its own sterile orifice and nozzle and is
discarded between patients.
All these systems increase skin permeability by disrupting or altering temporary
structure of stratum corneum. Unfortunately, after drug delivery has been
completed, it takes on the order of several hours or days to recover its integrity
and this cause discomfort to the patient and can increase risk of infections
specially if treated area is extended[18].
Therefore, it remains a need for an ideal transdermal drug delivery system that a)
is safe by maintaining skin permeability only during the desired period of drug
delivery, b) can create sustained or bolus delivery profiles, c) can deliver
therapeutic volumes/doses of drug quickly with minimal discomfort, d) has

Chapter 1 – State of art on transdermal drug delivery
14
rapidly responsive pharmacokinetics and pharmacodynamics, e) causes minimal
pain and irritation, and f) is simple, inexpensive, and self-administrable [19].
All requirements listed above seem to be satisfied by using microneedles. These
devices are needles with micron dimension, able to puncture stratum corneum, as
to create microchannel that allow also the passage of hydrophilic macromolecules,
without stimulation of nerves ending in dermis.
1.3 Microneedles
The research on microneedles and their applications began at the end of last
century, the aim was to find a safe, viable and pain-free alternative to the over 16
billions of injections per year. By incorporating techniques adapted from
microelectronics industry they have been fabricated the first microneedles made
of silicon or glass, for drug delivery through cellular membrane or inside tissue
[20]. Little by little thanks to advances of the technology, devices have been
improved in shape and fabricated in a variety of materials for different
applications.
Microneedles have a tipical length above 200 μm, in order to perforate epidermis,
and below 1 mm, to not stress too much nerves ending in the dermis. If the target
of release is systemic circulation, microneedles that penetrate more deeply in
epidermis have a greater success in drug delivery, since drugs reach easier
capillary in dermis. Thanks to their small dimensions, microneedles leave only
micro damages in stratum corneum therefore limiting permeation of
microorganism of several magnitude order respect to the injection with
hypodermic needle, reducing risk of infection [21].
Before designing a microneedles array it is important to consider all geometric
parameters that allow a good degree of penetration. Width, length and distance
between microneedles can be optimized to obtain desired permeability and
penetration capability[22], for example if microneedles are too near each other
there is a “fakir’s bed” effect which prevents indentation. Moreover, even if

Chapter 1 – State of art on transdermal drug delivery
15
microneedles are spaced, the elastic nature of skin can inhibit microneedles from
penetration by folding around the needles during the application, especially in case
of blunt and short microneedles. Due to the robustness of the skin, microneedle
insertion forces may exceed the ultimate tensile force and thereby determine a
breakage of the microneedles, particularly for longer ones, or for those with a large
tip’s radius, and for microneedles made of relatively weak materials [23,24]. So it
is needed to consider both material and geometric parameters in the designing
phase, to obtain microneedles with mechanical strength enough to pierce skin.
Another factor conditioning skin penetration is the insertion rate. Indeed, when
microneedles are pushed into the skin slowly by hand, it is obtained a partial
penetration; instead, applying microneedles with higher velocity, a deeper level is
reached. This is explicable by skin’s increased mechanical compressive resistance
at higher strain rates. Greater resistance to deflection provides for greater
penetration of microneedles [25].
1.3.1 Metallic and silicon microneedles
Initially microneedles were made from silicon wafers, using techniques of
photolithography and ion etching. Although silicon is attractive for its mechanical
properties and for the well-established knowledge, coming from the
microelectronic field, it is relatively expensive and requires clean room processing.
In contrast, metal and glass microneedles have been found to be equally effective
in skin penetration and can be produced at relatively much lower cost than silicon
ones. Various metals, such stainless-steel, titanium, palladium, palladium-cobalt
alloys, and nickel have been used as structural materials for MN fabrication[26].
They have been developed with multiple geometries and can be divided into two
major groups: in-plane, formed in parallel with machined surface, and out-of-plane
microneedles, perpendicular to the surface [27] as illustrated in figure 1.10.

Chapter 1 – State of art on transdermal drug delivery
16
Fig. 1.10: Exsamples of fabrication in-plane and out-of-plane: (Up) Array of five stainless microneedles in-plane; (Down-A) Silicon microneedle (150 μm tall) from a 400-needle array etched out of a silicon substrate (B).
Microneedles can be designed to approach delivery following different criteria
(figure 1.11). At first, microneedles were designed to make pre-treatment on cute.
This approach, called “poke and patch” consists in applying microneedles on skin,
so as to increase permeability by creation of micro holes in stratum corneum, and
then, after removing array, resting a patch with drug reservoir on the treated area.
In this way it is possible to increase penetration capability of macromolecules by
up to more than four orders of magnitude [28]; this type of approach is already
realized with Dermaroller® [29]. This is a very easy method to realize, but the
release from patch lasts until closure of holes, that is not more than 72h after
treatment with microneedles preventing any longer release.
Chapter 1 – State of art on transdermal drug delivery
17
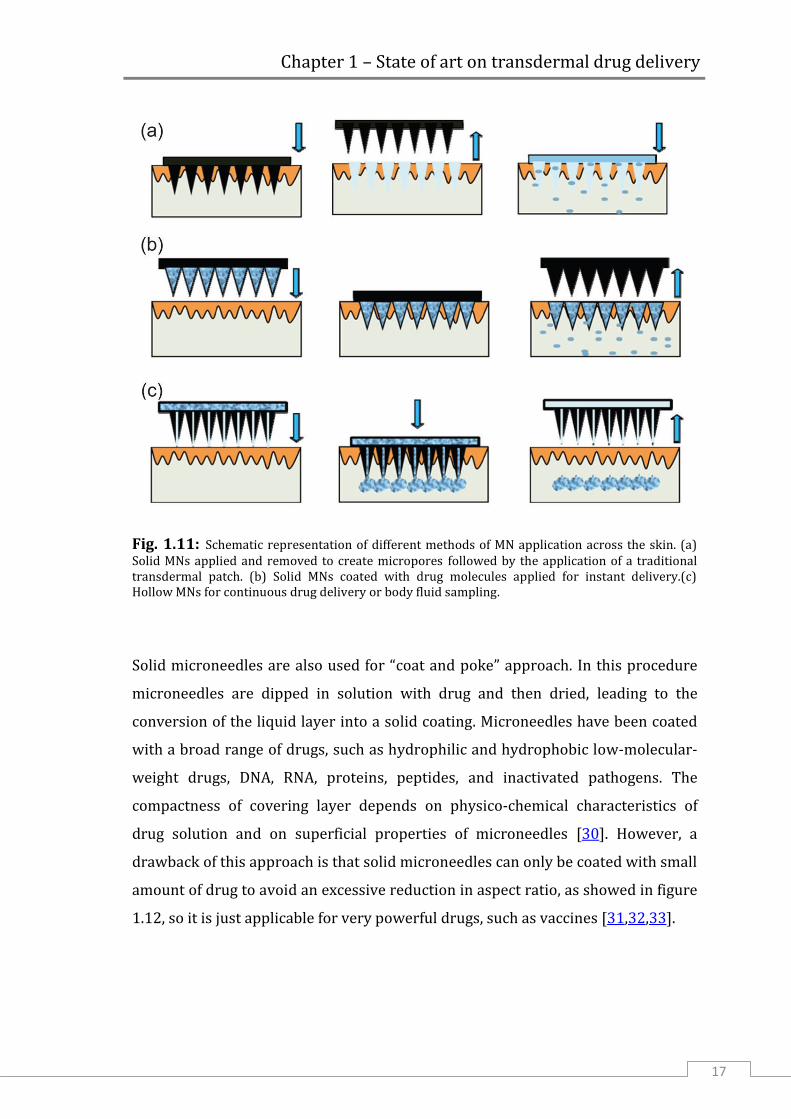
Fig. 1.11: Schematic representation of different methods of MN application across the skin. (a) Solid MNs applied and removed to create micropores followed by the application of a traditional transdermal patch. (b) Solid MNs coated with drug molecules applied for instant delivery.(c) Hollow MNs for continuous drug delivery or body fluid sampling.
Solid microneedles are also used for “coat and poke” approach. In this procedure
microneedles are dipped in solution with drug and then dried, leading to the
conversion of the liquid layer into a solid coating. Microneedles have been coated
with a broad range of drugs, such as hydrophilic and hydrophobic low-molecular-
weight drugs, DNA, RNA, proteins, peptides, and inactivated pathogens. The
compactness of covering layer depends on physico-chemical characteristics of
drug solution and on superficial properties of microneedles [30]. However, a
drawback of this approach is that solid microneedles can only be coated with small
amount of drug to avoid an excessive reduction in aspect ratio, as showed in figure
1.12, so it is just applicable for very powerful drugs, such as vaccines [31,32,33].

Chapter 1 – State of art on transdermal drug delivery
18
Fig. 1.12: Bright-field micrographs of a microneedle coated with red-fluorescent inactivated influenza virus before (left) and 10 min after (right) insertion into human cadaver skin
Gill and Prausnitz have extended this approach fabricating microneedles with
“pokets” in metallic structure. In this manner it is possible to localize drug and
release it at target depth, or to load different drug, with a multi-step process and
obtain a sequential delivery (figure 1.13) [34].
Fig. 1.13: Pocketed microneedles. (A) Representative microneedle with a large central pocket. Microneedles with pockets of different sizes and shapes filled with (B) sulforhodamine, (C) fluorescein and (D) plasmid DNA as model drugs. (E) Microneedle with a composite coating that sequestered sulforhodamine within the microneedle pocket and coated fluorescein on the microneedle surface by a multi-step process.

Chapter 1 – State of art on transdermal drug delivery
19
In the case of hollow microneedles (figure 1.14), the release approach is called
“poke and flow”. Often this microneedles array is combined with a syringe or
another external system able to regulate pressure and to drive flow inside dermis.
Pumping system can be electrically powered, in this case the presence of trained
personnel is required. Other systems, operated by compressed air or osmotic
pressure, can be integrated inside the administration device, but in this way
structure device is very complex. Furthermore, the dose of the desired drug in
solution can be more easily controlled according to the need of the patient.
However, to avoid pain is necessary apply flow rate very low (about 100 µl/min)
especially when it’s necessary dispense large volume (> 1 ml) [35].
Fig. 1.14: Some examples of hollow microneedles with different geometries.
1.3.2 Polymeric microneedles
One of the main problems with metallic and silicon microneedles would be
if some of them break inside skin, the organism would not be able to remove them.
For this reason it is preferred to use biodegradable or dissolvable materials.
Certain types of polymers have optimal properties, as biocompatibility,
biodegradability and mechanical strength, to be used for realization of
microneedles. Some of these, like poly(lactic-co-glycolic) acid (PLGA), poly-lactic

Chapter 1 – State of art on transdermal drug delivery
20
acid (PLA) [36], carboxymethyl cellulose (CMC) [37], polyvinylpyrrolidone (PVP)
[38] are already widely used for these applications. By changing polymer matrix,
or using a double inclusion, i.e. drug in nano/microparticles incorporated in
microneedles, it is possible to manage drug release kinetics and drive the drug to
the target site.
1.3.2.1 Replica molding
The classical method to produce polymeric microneedles is a multistep
process. There are three phases: 1) manufacturing of a master; 2) mold
production; 3) replica molding of the final polymeric device.
Masters have to possess the same shape of final device and they are typically
manufactured in photosensitive resins, as SU-8, or in silicon by combining UV
lithography and a proper chemical etch.
A common UV lithography process, using SU-8, is illustrated in figure 1.15. The
substrate is coated with few hundred microns of photoresist by using a spin coater and
then it is soft baked in order to remove the solvent and improve resist-substrate
adhesion. UV lithography consists in radiating a photoresist through a chrome
mask. In particular, by using a mask with an array of circular or square dots it is
possible to obtain microstructures having the shape of needles. After irradiation, a
post-exposure bake is performed to increase the cross-linking degree of the
irradiated areas and stabilize them against the action of solvents during the
development step. Development is performed by immersing the substrate in
propylene glycol methyl ether acetate at room temperature, followed by a rinsing
step in water or isopropanol [39].

Chapter 1 – State of art on transdermal drug delivery
21
Fig. 1.15: Photolitography standard protocol to create SU-8 master molds.
Through elaboration of the lithographic technique J.-H. Park et al. were able to
obtain microneedles with different shaped tips. In one case, spaces between
cylinders are filled by a sacrificial polymer, then the tip of cylinders are
asymmetrically covered with a thin copper layer in order to selectively remove part of
the tip by using a reactive ion etching obtaining cylindrical microneedles with beleved
tip. In another case, in order to obtain microneedles with pyramidal tips, SU-8 is spun
on a wafer on which inverted pyramid-shaped holes have been previously patterned. A
second mask with square dots is then aligned on the first structure before irradiating the
photoresist. Another special case is based on the exploitation of microlenses for
focusing the UV light. Microlenses are fabricated by etching glass substrate masked
with metal, on which SU-8 is spun [36] (fig. 1.16).

Chapter 1 – State of art on transdermal drug delivery
22
Fig. 1.16: Schematic of process to fabricate beveled-tip (1), pyramidal tip (2) and conical (3) microneedles. Scanning electron microscope image of beveled-tip (A), chisel-tip (B) and tapered cone (C) microneedlesi
A B
C

Chapter 1 – State of art on transdermal drug delivery
23
The second step consists in the fabrication of a mold from which polymeric
microneedles will be replicated. Polydimethylsiloxane (PDMS) is the most used
silicon-based polymer for the fabrication of stamps; it is considered to be inert and
non-toxic. Thanks to its low interfacial free energy, polymers molded in such a
stamp do not adhere irreversibly, and its flexibility helps in the detachment phase
of the array of microneedles from the stamp. Preparation process, showed in figure
1.17, is very simple and fast. PDMS precursor is mixed with the treating agent, in
ratio 10:1, and kept under vacuum to remove air bubbles. To make molds, master
structure arrays of needles is coated with liquid PDMS and allowed to cure in oven.
After polymerization and cross-linking, solid PDMS presents a hydrophobic surface and
this facilitates the separation from hydrophilic materials.
Fig. 1.17: Schematic procedure for fabrication of PDMS stamp.
The last phase of production is the replica molding of the final polymeric device.
Depending on the polymer chosen, microneedles are created by melting a polymer
on the stamp, by drying an aqueous polymer solution or by UV-curing a polymer
precursor.

Chapter 1 – State of art on transdermal drug delivery
24
Usually, if a thermo-plastic polymer, like PLGA, is chosen, first PDMS stamp is
loaded with a solution containing drug or encapsulated drug. Evaporation of the
solvent leaves solid drug particles partially filling the mold; residual particles
remaining on the surface of the mold can be removed using adhesive tape, and
then, after drying, polymer is melted on the stamp, that is filled with the help of
vacuum. Next the mold is recovered with powder of biocompatible polymer and placed
in a vacuum oven. Vacuum is necessary to remove entrapped bubble and help pull the
polymer melt into the grooves of the mold (figure 1.18).
Fig. 1.18: Method to fabricate polymer microneedles that encapsulate drug for controlled release.
As showed in figure 1.19, this procedure gives an inhomogeneous distribution of
drug inside needle. Indeed the most of it is accumulated towards the tip, and this,
even if entail release of entire amount of drug, implies a fast release.

Chapter 1 – State of art on transdermal drug delivery
25
Fig. 1.19: Polymer microneedles bevel-tip (left) and tapered-cone (right) made of PLGA and encapsulating calcein within their tips.
Although this fabrication method is very simple and cheap to realize, it is not
suitable for all drugs. Indeed, generally, thermoplastic polymers with mechanical
strength enough for this application, require an high melting temperature, that is
incompatible with a wide drug’s variety.
Otherwise photocurable polymers, like PEG and PVP, liquid before reticulation, or
hydrogels modeled starting from aqueous solutions can also be used. In this case it
is easier to mix the drug directly in the polymer matrix, obtaining an homogeneous
distribution. By loading model drug into dissolving microneedles in different ways,
one is able to design systems that can achieve rapid or extended release from a
microneedle patch. Drug can be selectively incorporated into the microneedles
themselves and not into the backing layer. A small volume of solution with drug is
cast into the holes of the micromold to form microneedles. After wiping off excess
solution from the micromold surface, polymer without drug is added onto the
micromold and solidified. To administer larger drug doses as an extended release
over at least hours, drug can be incorporated into both the microneedles and
backing layer or, alternatively, just the backing layer [37] (figure 1.20).

Chapter 1 – State of art on transdermal drug delivery
26
(a) (b) (c)
Fig. 1.20: Schematic representation of drug loaded in entire device’s volume (a), into microneedles (b) and in back layer but not in microneedles (c).
Also these fabrication have some limits related to the substances utilized and to
the process conditions. Indeed, photoinitiators, needed to start UV reticulation,
often are toxic for the body, and UV irradiation can degrade drug loaded in matrix.
In case of production with aqueous solutions, it is required a long time to dry
microneedles before pulling them away from the mold.
All fabrication techniques above illustrated require use of a PDMS mold to form
microneedles. The re-use of the same mold to shape several microneedles-array,
can create problem of cross-contamination between devices.
The advantage of this approach is to obtain in a very simple way an array with
hundreds of microneedles, all with the same shape. This process is also easily
scalable to an industrial level further lowering the cost, so several research groups
have focused their attention on these methods, trying to improve efficiency. Chu,
Choi and Prausnitz have developed a system to insert an air bubble in the base of
microneedles to concentrate drug towards needle’s tip, as to minimize drug
wastage. Moreover they have incorporated a pedestal at the base of microneedles
in order to insert tips more fully in the skin. More complete insertion of the
microneedles allowed a higher fraction of the encapsulated drug to be delivered
[40]. In some cases, because of long degradation time of PLGA, microneedles array
are designed in order to leave tips inside skin, so drug release can continue after
removal of the supporting patch, to reduce patient nuisance. This is possible
coupling PLGA needles with a polymeric base quickly dissolvable [41], pushing
arrowhead needles inside skin with metal shaft [42], or creating complex structure
that rest stuck in tissue [43]. In other cases they are used hydrogel microparticles

Chapter 1 – State of art on transdermal drug delivery
27
that by means of a swelling mechanism, cause microneedles breackage and
acceleration of drug release [44].
Rimarcherei i limiti di temperature in un caso e i tempi lunghi di evaporazione
nell’altro caso.
1.3.2.2 Free mold fabrication
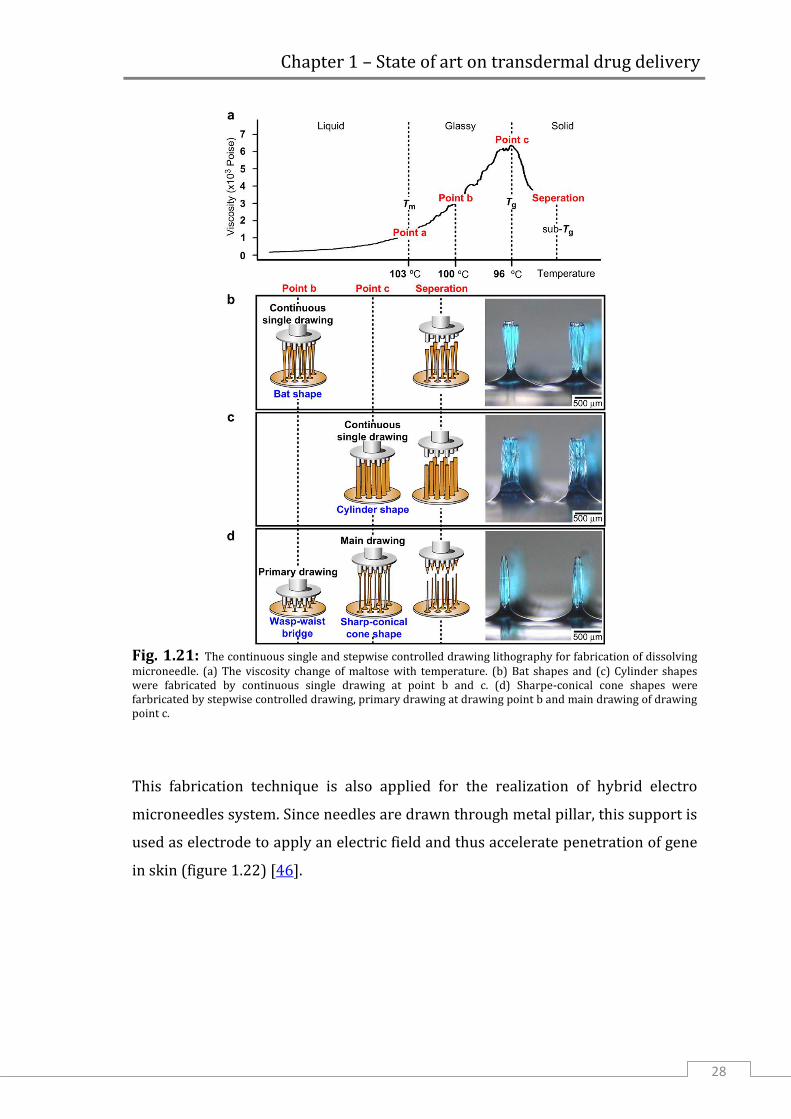
In recent years K. Lee et al. have developed a different approach that does
not use molds for fabrication of microneedles. This method consists in drawing
melt maltose through an array of metal micro-pillars. Maltose is chosen since it is
very easy to control its state (liquid, glassy, solid), and thus viscosity, manipulating
temperature during drawing phases.
The exact needle’s shape, as showed in figure 1.21, is obtained by stepwise
controlled drawing, changing temperature, in a two steps process [45].
Chapter 1 – State of art on transdermal drug delivery
28
Fig. 1.21: The continuous single and stepwise controlled drawing lithography for fabrication of dissolving microneedle. (a) The viscosity change of maltose with temperature. (b) Bat shapes and (c) Cylinder shapes were fabricated by continuous single drawing at point b and c. (d) Sharpe-conical cone shapes were farbricated by stepwise controlled drawing, primary drawing at drawing point b and main drawing of drawing point c.
This fabrication technique is also applied for the realization of hybrid electro
microneedles system. Since needles are drawn through metal pillar, this support is
used as electrode to apply an electric field and thus accelerate penetration of gene
in skin (figure 1.22) [46].

Chapter 1 – State of art on transdermal drug delivery
29
Fig. 1.22: Fabrication of a HEM by drawing lithography with antidromic isolation. (A) Liquid maltose, melted at a temperature greater than its Tm, was contacted with electrodes of the HEMs as a drawing pillar. (B) The glassy maltose between Tm and Tg was elongated by drawing of electrodes. (C) After lowering the temperature to sub-Tg, the elongated 3D structures were cured to a solid state. (D) The coating surface was melted at a temperature greater than Tm to isolate elongated 3D structures from 2D coating surface. (E) A bell-shaped dissolving microneedle of the HEM had an ultra-sharp tip diameter of 5 mm and a length of 400 mm. (F) A 5 X 5 array of fabricated HEMs.
Although this fabrication process eliminates the mold and allows a fast delivery,
due to the fast dissolution of maltose in water, it requires yet high temperature to
melt polymer, making system unusable for thermo-sensitive drugs. Moreover, if
prolonged releases are required it is not suitable at all.
Another mold-free fabrication method was contrived by J.S. Kochhar et al., who
have developed a simple photo-polymerization method to fabricate microneedles
with poly (ethylene glycol) diacrylate (PEGDA) owing to its known
biocompatibility and FDA approval for human use. The process consists in two
steps: first a thin backing layer and then microneedles are formed. Set-up for
fabrication is very simple: the thickness of PEGDA’s layer is determined by spacers
on which a coverslip is placed. Back layer is produced by irradiating the first
polymeric layer through glass, while, to form microneedles is used a photomask,
with transparent circle, placed between glass and UV source (figure 1.23) [47].

Chapter 1 – State of art on transdermal drug delivery
30
Fig. 1.23: (A) Schematic representation of the fabrication process. PEGDA is attached to TMSPMA coated coverslip via free radical polymerisation using UV irradiation, forming the backing for microneedles. (B) Using glass slides as support, the PEGDA backing is mounted onto the set-up with PEDGA filled in the enclosed cavity. Subsequently, the set-up is irradiated with UV light. UV light is only able to pass through the clear regions on the photomask, forming microneedles.
Compared with the other cross-linkable monomers, already mentioned above, the
macromer PEGDA can be cross-linked in short time under UV (few seconds). This
allows to protect most of the drugs from photo-degradation, but remains the
problem of toxicity of photoinitiator.

Chapter 1 – State of art on transdermal drug delivery
31
1.4 Applications
The ability of microneedles to release efficiently both small and large
molecules has encouraged study of various applications.
Several studies, regarding vaccination through microneedles for influenza [31, 42]
and Hepatitis B [49], have demonstrated that with this new method is obtained a
clinical response higher than hypodermal injection [50] using a lower drug dosage
[51]. Also for other bioactive macromolecules, like insulin, heparine and growth
hormone, that cannot be delivered orally because of proteolitic degradation,
microneedles represented a valuable alternative. Zosano Pharmahas developed a
parathyroid hormone coated microneedle patch system that is now under phase-3
clinical trial. These patches show an ideal plasma profile, indicative of efficient
parathyroid hormone therapy in osteoporosis using microneedles [52].
Another, less common, application is drug delivery into eyes through sclera,
fibrous membrane containing eyeball, for glaucoma treatment. This administration
route has been proved to be more effective than topical administration or systemic
delivery [53].
Also in cosmetic and cosmeceutical fields the majority of products can
lendthemselves to microneedles technology. So it is possible to apply release
through microneedles for treatment against ageing (wrinkles, lax skin), scarring
(acne, surgical), photodamage and hyperpigmentation (age/brown spots)[54].
Microneedles can be used, not only to administer drugs, but also to withdraw body
fluids for diagnostic purposes. An example is blood withdrawal for glucose
estimation: in this way it is possible to reduce blood sample required while making
the procedure painless [55].

Chapter 2 – Experimental method
32
Chapter 2
Experimental method
2.1 New manufacturing technique
In this work a new fabrication method that uses an electric field to shape
microneedles is discussed. This technique exploits the principle of Taylor’s cone
formation, for which when an electrically conductive liquid is exposed to an
electric field, the shape of the liquid starts to deform. By increasing the voltage, the
effect of the electric field becomes greater and a greater and acts on the surface
tension of the liquid at the exit of a capillay forming a cone. When it overcomes a
certain threshold voltage the tip emits a jet of liquid or breaks in drops (figure 2.1).
Fig. 2.1: Schematic representation of Taylor Cone formation.
This electro-hydro-dynamic (EHD) system for liquid dispensing has been already
applied in many fields, like blood plasma separation, drop-on-demand printing of
conductive ink and for fabrication of drug delivery systems [56]. Recently the
classical configuration, in which the high voltage between the dispensing nozzle
and the receiving substrate has applied through an electric generator, has been

Chapter 2 – Experimental method
33
changed. As source of the electric field a polar dielectric crystal, which exhibits the
pyroelectric effect has been exploited [57]. Pyroelectricity is the ability of certain
materials to generate a voltage when they are heated or cooled. The change in
temperature modifies the position of the atoms slightly within the crystal
structure, such that the polarization of the material changes. This polarization
change gives rise to a voltage across the crystal. Polarization in crystal is
proportional to temperature variation, according to ΔPi = pi ΔT, where ΔPi is the
coefficient of the polarization vector and pi is the pyroelectric coefficient (figure
2.2) [58]. If the temperature stays constant at its new value, the pyroelectric
voltage gradually disappears.
Fig. 2.2: Schematic view of the periodically poled pyroelectric crystal sample cross section with the charge distribution exhibited (A) at the equilibrium state; (B) in case of heating (top) and (bottom) cooling process.

Chapter 2 – Experimental method
34
In our case electro-drawing is not used to dispense material, in the form of drops
or fibers. The process is stopped at the end of Taylor’s cone formation, before tip
begins to jet liquid. At this point it is essential to be able to lock the structure in the
form obtained, in order to preserve a needle shape after removal electric field
(figure 2.3).
Fig. 2.3: Schematic representation of microneedle formation, by using electric field, starting from
a polymeric drop deposited on a substrate.
To consolidate the microneedle shape at the end of the electro-drawing step,
polymeric material has to become solid enough as much quickly as to prevent its
collapse. This is possible by evaporating the solvent if a polymer solution is used,
or crosslinking the polymer if using an UV photocurable material.
With this approach main limitations of the classical fabrication methods were
avoided. Polymeric solution was deposited directly from the dispensing system to
the substrate that will be part of the final device. There is no contact with other
elements that can increase risk of cross contamination, like the mold used in the
most of fabrication procedures. It is a very fast production that allows obtaining a
complete system in few minutes. Moreover the overall procedure is performed at

Chapter 2 – Experimental method
35
ambient or bland temperature, thus preserving the integrity of the drug preloaded
in the polymeric matrix.
2.2 Materials
Poly(lactic-co-glycolic acid) 50 : 50 (PLGA RESOMER® RG 504H), 38000 -
54000 Dalton, was obtained by Boeringer Ingelheim and used as received.
Dimethyl Carbonate (DMC, D152927), as solvent of the PLGA, as well as all the
chromophores used as model drug like Nile Red (NR, N3013), Rhodamine 6G
(Rh6G, R4127) and BSA-TRITC (Albumin, Tetramethylrhodamine isothiocyanate
bovine, A2289) and finally 4% Agarose gel (A6689) and Paraffin wax (327204)
were obtained by Sigma Aldrich. Poly(dimethyl-siloxane) (PDMS), used as flexible
support, was provided by Sylgard® (184 Silicone Elastomer Kit, Dow Corning).
Gelatin B, functionalyzed with diacrylates group (substitution degree 64%) was
provided by prof. Peter Dubreil from Ghent University. Lithium tantalate crystal
was supplied by Roditi International Corporation Ltd (Optical grade LiTaO3 wafer,
z- cut, 0.5 mm thickness, both side polished). Pig cadaver skin was kindly provided
by dott.ssa Antonelli Carmela of ASL Napoli 2 Nord, taken from the butchery
implant ICS (Industria Carni Sud) of Caivano, Naples (IT). Agarose gel (0.4%) was
used as model material for the indentation test. The gel was prepared on the day of
use by dissolving agarose (Sigma Aldrich Corp, St. Louis, MO) in deionized water.

Chapter 2 – Experimental method
36
2.2.1 PLGA
The structure of polymeric matrix influences drug release kinetics, so
polymer choice depends also on the type of drug that one wants to administer and
its optimum release kinetics. In this work the attention was focused on poly(lactic-
co-glycolic) acid (PLGA), a polymer widely used for microneedles fabrication [36,
40, 43, 44]. Indeed PLGA is a copolymer used in a host of Food and Drug
Administration (FDA) approved therapeutic devices, thanks to its biodegradability
and biocompatibility. It is synthesized by means of random ring-opening co-
polymerization of two different monomers, the cyclic dimers (1,4-dioxane-2,5-
diones) of glycolic acid and lactic acid. Depending on the ratio of lactide to
glycolide used for the polymerization, different forms of PLGA can be obtained,
each one with different mechanical properties and degradation times. PLGA
degrades by hydrolysis of its ester linkages in the presence of water (figure 2.4).
Fig. 2.4: Chemical structures of glycolide (1) and lactide (2); the corresponding polymers polyglycolide (PGA) (3) and polylactide (PLA) (4); and glycolic acid (5) and lactic acid (6).

Chapter 2 – Experimental method
37
Figure 2.5 illustrates the steps involved in the biodegradation processes. In the
first step water wets the surface and diffuses into the polymer. The rate of the
diffusion depends on porosity, pore size and surface tension. In the second step,
ester linkage hydrolysis cleaves the chain into smaller chain lengths (polymer
degradation). As the degradation proceeds, smaller chain segments (<100 g/mole)
start to dissolve and polymer erosion takes place (step 3). The solubilized
monomers/oligomers are then excreted via the kidney or metabolized into carbon
dioxide and water (step 4). PLGA has been successful as a biodegradable polymer
because it undergoes hydrolysis in the body to produce the original monomers,
lactic acid and glycolic acid. These two monomers under normal physiological
conditions, are by-products of various metabolic pathways in the body. Since the
body effectively deals with the two monomers, there is minimal systemic toxicity
associated with the use of PLGA for drug delivery or biomaterial applications.
Fig. 2.5: PLGA degradation phases: (1) Wetting and water diffusion, (2) Decrease of the molecular weight = Polymer degradation (3) Mass loss = Polymer erosion and (4) Renal excretion or metabolism to carbon dioxide and water.

Chapter 2 – Experimental method
38
The complete disappearance of biodegradable polymers after the duration of their
lifecycle is a highly desired feature. It has been shown that the time required to
degrade PLGA is related to the monomers ratio used in production: the higher the
content of glycolide units, the lower the time required for degradation. An
exception to this rule is the copolymer with 50:50 monomers ratio which exhibits
the faster degradation (complete in about two months). In addition, polymers that
are end-capped with esters (as opposed to the free carboxylic acid) demonstrate
longer degradation half-lives. The possibility to tailor the polymer degradation
time by altering the ratio of the monomers used during synthesis has made PLGA a
common choice in the production of a variety of biomedical devices, such as, grafts,
sutures, implants, prosthetic devices, surgical sealant films, micro and
nanoparticles. Works by the groups of Siepmann, and others show that (i)
degradation is often heterogeneous and occurs faster in the central part of the
delivery systems, (ii) acidic pH environments are also present in microparticles
and (iii) therapeutic agents and/or buffering substances can modify the
microclimate and, therefore, the kinetics of polymer degradation and drug release
[59, 60].

Chapter 2 – Experimental method
39
2.3 Fabrication steps
2.3.1 PDMS support
A flexible support for microneedles array was fabricated in PDMS. Its
superficial hydrophobicity allows drop deposited to assume an emispherical shape
that promote electro-drawing. Both flat layer and layers with protruding
micropillars were used as base for microneedles. The negative of micropillars
array was tooled from a PMMA substrate by using the micro-milling technique
[Mini-Mill/GX, Minitech Machinery Corporation], to form cylindrical cavity with a
diameter between 500 and 900 µm and 200 µm depth, even though different other
sizes are possible. Then, a flexible layer with micropillars was obtained by pouring
PDMS, mixed in ratio 10:1 with curing agent, on the above described master and
under vacuum until complete disappearance of the air bubbles (figure 2.6).
Instead, simple flat layers were obtained by pouring liquid PDMS precursor on a
flat glass support for few minutes. Finally PDMS was cured in both cases at 80 °C
for 30 min and peeled off from PMMA master or glass.
Fig. 2.6: Scheme of an array of micropillars made of PDMS as the substrate underneath.

Chapter 2 – Experimental method
40
2.3.2 Electro-drawing of dissolvable microneedles
Drops of polymer solution at a concentration of 25% w/v were deposited
on PDMS or PDMS pillars using a syringe pump (Harvard apparatus – Plus 11),
with imposed rate 0.1 µl/min, connected to a capillary of inner diameter 150 µm,
and then were positioned on platform of translation stage under a lithium tantalate
crystal which was locally heated until 80 °C in correspondence to the drops in
order to draw them and create the cone like shape (figure 2.7).
Fig. 2.7: Scheme of electro-drawing process: drops are deposited on PDMS strip, LiTaO3 plate is heated with metal tip in correspondence of drops, which are deformed under action of electric field. So are obtained microneedles on flexible substrate.
A 5x microscope objective and a high-speed digital CMOS camera (pixel size 12x12
mm2, frame rate of 500 frames/s with 1280(H) x 1024(V) spatial resolution) were
used to capture side view pictures and videos during microneedle formation.
Viscosity of PLGA solutions was measured with Ubbelohde viscosimeter to identify
concentration range employable to fabrication. It is a fundamental parameter, as a
too high viscosity does not allow drops to deform under action of electric field,
while a too low viscosity causes loss of needle shape before structure is
consolidated.
As DMC has a partial polarity, it was possible to produce microneedles preloaded
with hydrophobic, as NR, and hydrophilic, as Rh6G, model drugs, at 0.1%, 0.2%
and 0.4% w/w respect to PLGA, to study their distribution inside needle.
LiTaO3 plate
PDMS strip with PLGA drops
Biodegradable microneedles onto a flexible strip
Electro-Drawing of microneedles

Chapter 2 – Experimental method
41
To obtain porous microneedles a water solution was prepared with lecithin,
a phopholipid used as surfactant, and TRITC-albumin, used as a model drug. This
aqueous phase was emulsified in the PLGA solution by using an immersion
sonicator (Ultrasonic Processor VCX500 Sonic and Materials) for 20 s at 30% of
power, keeping the sample in ice bath. Moreover, to avoid wasting of drug, it was
developed a method which allowed to confine it only in the cone which is the part
of needle that enters in skin. This was made possible through a double drop
deposition: in this way, at first it is deposited a drop of simple solution of PLGA,
and then, it is dispensed a second drop of emulsion with drug, with a volume
approximately one-tenth of the first one. Successive steps are unchanged (figure
2.8).
Fig. 2.8: Schematic representation of double drop deposition process.
After the electro-drawing process, microneedles can be kept in temperature at
about 40 °C for 10 min, to accelerate solvent evaporation and fix needle shape.

Chapter 2 – Experimental method
42
2.3.3 Microneedles by stamp
As reference, some PLGA microneeedles were produced in a conventional
way by replica onto a master. The master utilized was in Cyclic Olefin Polymer
(COP) and presented an array of protruding microneedles each one 100 x 100 µm
wide and high 250 µm high, with pyramidal tip (figure 2.9).
Fig. 2.9: Master of microneedles with square base and pyramidal tip.
The final mold was replicated by pouring PDMS, mixed in ratio 10:1 with curing
agent, on the master and by curing at 80 °C for 30 min.
Different PLGA solutions were prepared, varying content of water and
concentration of lecithin: specifically, water solutions with lecithin concentration
of 20, 40 and 60 mg/ml have been used, while the amount of water was about 30
wt%, 60 wt% and 80 wt%, respect to the PLGA mass. These solutions were casted
on a PDMS mold, and after few seconds under vacuum to facilitate filling of

Chapter 2 – Experimental method
43
cavities, they were rest at 40 °C for 1h and then dried for a day at ambient
conditions.
2.4 Morphological analysis
Several analyses were performed to study morphological aspects of
microneedles, and correlated properties, especially kinetics of drug release and
mechanical resistance.
2.4.1 Chromophore distribution
To understand how hydrophilic and hydrophobic chromophores were
distributed inside the microneedle, in consequence to their interaction with the
electric field, electro-drawn microneedles were incorporated in PDMS, cured for
48 h at room temperature, and then frozen at -130 °C in Leica CryoUltra Microtome
EM-FC7-UC7. Samples were sectioned at a thickness of 5 µm for confocal analysis
in axial direction. Slices of samples were analyzed with a confocal Leica TCS at 543
nm using a 25X water immersion microscope objective. While cutting, slices tend
to bend so they are not perfectly outstretched on cover glasses. For this reason, as
surface is not included entirely in the same focal plane, to acquire entire slice, stack
acquisitions were made on thick layers using 2 µm Z-step. Acquired images were
added all together and analyzed using ImageJ (Java-based image processing
program developed at the National Institutes of Health) studying fluorescence
profile in axial direction and transverse at certain distances from tip, as showed in
figure 2.10.

Chapter 2 – Experimental method
44
Fig. 2.10: Schematic illustration of section plane direction (left) and line direction for acquisition of chromophore intensity.
2.4.2 Porosity
Microneedles porosity is of fundamental importance since it affects
mechanical proprieties and drug release kinetics. Microneedles were sectioned as
described above at a thickness of 10 µm. A morphological analysis was performed
using scanning electron microscope (SEM) (field emission Ultra plus Zeiss), on
both porous and non-porous microneedle slices, to study how emulsion
parameters influences porosity in microneedles matrix. Samples were sputter
coated with a 15 nm thick gold layer and to avoid damage inside them, it was
imposed a voltage (EHT) of 5 kV. Morphological analysis of porosity was carried
out both on electro-drawn microneedles and on microneedles produced by mold,
to check if, by using a PLGA solution with same composition, it was possible to
obtain in the same morphology even though with different fabrication methods.

Chapter 2 – Experimental method
45
2.5 Mechanical characterization
The fundamental requirement for microneedles is mechanical resistance
adequate, that allows to puncture stratum corneum. For this reason is very
important to evaluate mechanical properties of material used to fabricate
microneedles and their capability to indent skin.
2.5.1 Analysis of mechanical properties
To guarantee a good efficiency in skin indentation the safety factor, defined
as the ratio of failure force to insertion force, has to be always above unity. This
means that polymer used to fabricate microneedles have to be a Young’s modulus
greater than 1GPa [36]. PLGA elastic modulus was analyzed through nano-
indentation tests, using Nano Indenter G-200, from Agilent Technologies equipped
with berkovich tip, a three-sides pyramidal diamond tip, with a semi-angle of
65.03°.
To verify through nanoindentation that matrix, porous and non-porous, of
microneedles have enough mechanical resistance, they were prepared small
polymeric blocks with same composition used to fabricate microneedles. Several
drops were deposited on a microscopy glass and consolidated by keeping glass at
40 °C for 1h and then in vacuum overnight. Last step, to ensure complete solvent
evaporation, was lyophilisation.
The test was carried out at 25 °C, by keeping temperature at constant value using a
circulating bath (PolyScience). The indentation was performed in dynamic mode,
with tip’s frequency fixed at 40 Hz and oscillation amplitude of 2 nm. When a value
of Harmonic Contact Stiffness higher than 100 N/m was detected during surface
approaching phase, the surface of the sample was recognized and the test starts.

Chapter 2 – Experimental method
46
2.5.2 Indentations in skin
At first, indentation tests were performed in agarose and paraffine wax.
Thin layers were prepared using these materials on a microscope slide, which was
connected to a computer-controlled x, y axes translation stage, with movement
velocity of 0.7mm/s facing down the polymer strip with the microneedle. The
indentation experiment was visualized in situ in real time by an optical set-up. A
conventional blue collimated led light (wavelength of 470 nm and beam power
around 400 mW) illuminated the cross section of the microneedle while a digital
CMOS video camera (pixel size 12X12 µm2; frame rate of 500 frames/s with
1280(H)X1024(V) spatial resolution) was used for recording the process. A 5X
microscope objective was adopted to image the process on the CMOS sensor. By
controlling the distance in real time the agarose block was put in contact with the
needle tip until reaching the needle base.
Then, a series of three microneedles was inserted in a full thickness cadaver pig
skin without subcutaneous fat layer. It was shaved with depilatory cream and
washed in a phosphate buffered saline (PBS) solution; finally it was placed on
absorbing paper few minutes to eliminate water in excess. The indentation test
was carried out with a system emulating the application of the microneedles patch
through a bracelet.
Pig skin was positioned onto a cylindrical tube, with diameter of about 5 cm, and
gently stretched by hand. Microneedles, previously attached on the plastic plate of
the bracelet, were pressed on skin and kept close by means of elastic bands and
Velcro for 10 min (figure 2.11).

Chapter 2 – Experimental method
47
Fig. 2.11: System, tube and bracelet, to simulate application of microneedles-patch in a possible final device.
The pressure exerted by tightening the cuff was measured by introducing a
pressure sensor (CZN-CP1, TME electronic components) between the cuff and the
flexible layer supporting microneedles.
After indentation, microneedles were removed and the skin was fixed in a solution
of 10% neutral buffered formaline for 24 h, dehydrated in an incremental series of
alcohol (75 %, 85 %, 95 % and 100 %, and 100 % again, each step 20 min at room
temperature) treated with xylene and then embedded in paraffin. Successively,
samples were sectioned at thickness of 6 µm, and stained with hematoxylin and
eosin, and finally the sections were mounted with Histomount Mounting Solution
(INVITROGEN) on coverslips and the morphological features of constructs were
observed with a light microscope (BX53; Olympus).

Chapter 2 – Experimental method
48
2.6 Drug release kinetics
The kinetics of drug release was studied in vitro by confocal laser scanning
microscopy (CLSM), to follow the release of albumin-TRITC from single
microneedles in a gelatin matrix. In this study a new analysis approach was
considered, differently from the conventional ones that do not reproduce real
release conditions. For example, diffusion tests with Franz Static Diffusion Cell
account only for skin permeabilization due to the treatment with microneedles,
without considering drug’s diffusion time throughout polymeric matrix of needles
[36]. From the other side, “in vitro” characterization, using PBS solutions, gives a
lower degradation rate than “in vivo”. The faster degradation under “in vivo”
conditions is due to the autocatalytic effect of the acidic degradation products
which are released from the polymer matrix but accumulated in the medium
surrounding the device [62]. On the contrary, characterization in vitro using a
“solid” matrix of gelatin, allowed approximating more precisely the delivery
conditions in skin. Moreover, this is a non-destructive method that allows
acquiring, at scheduled times, images on the same sample. The aim was to
understand how porosity influences kinetic release.
CLSM analysis was carried out with a Leica TCS SP5 confocal microscope using a
25x/0.95 water immersion microscope objective. Settings, in terms of laser power,
pinhole aperture and detector gain, were optimized at zero time on microneedles.
To analyze fluorescence on the entire volume of the microneedle, acquisitions
were carried out in z-stack. Fluorescence signal was collected on several slices,
spaced by 5 µm, until they covered the whole volume.
Preliminary experiments showed that bleaching, investigated at the highest laser
intensity used for the acquisition, was extremely low even after 5 min of
continuous irradiation. Therefore, since stack acquisition on microneedle lasts
maximum 30 seconds, chromophore degradation due to the laser radiation was
considered to be negligible in the following experiments. This means that it is
possible to consider fluorescence reduction of microneedles with time, as an effect
due only to diffusion of model drug in gelatin. In order to obtain a good signal
while diffusion continues, causing concentration reduction of model drug in

Chapter 2 – Experimental method
49
microneedles, for the whole period under examination, AOTF (Acousto Optical
Tunable Filter) value was changed. Indeed, by increasing laser intensity, it
increases the number of chromophore’s molecules excited, so it is possible to
collect a signal with greater intensity.
In figure 2.12 it is showed the ratio between AOTF value and fluorescence
collected from a standard reference. Since to an higher laser intensity corresponds
an higher signal collected, at the end of delivery experiment, it was necessary to
bring back all fluorescence signals, to the same laser intensity, in order to compare
them. This was possible by making a proportion between intensity (showed in
table below) corresponding to two laser intensities of interest, and scaling
microneedle’s fluorescence to the first laser intensity.
Fig. 2.12: Fluorescence signal from standard obtained changing laser intensity (% AOTF). Approximation of experimental points with trend curve (right).
% AOTF Intensity
0 34
1 40
2 45
3 53
4 62
5 74
10 164
20 489
30 971
40 1532
50 2096
y = 49.07x - 421.7
0
500
1000
1500
2000
2500
0 10 20 30 40 50 60
Inte
nsi
ty
AOTF (%)

Chapter 2 – Experimental method
50
This procedure is justified because a linear relationship exists between laser
intensity and fluorescence signal collected; this is true until chromophore
saturation is reached. The saturation phenomenon occurs when all chomophore’s
molecules are excited, so increasing laser intensity, does not provide any increase
in the signal collected. Since in these tests low laser intensities were used,
saturation has not been reached, thus preserving linearity.
2.6.1 Sample preparation
For simplicity, preliminary studies of release kinetics were performed on
microneedles obtained by mold. PLGA solutions were prepared with different
water content (30 %, 60 % and 80 % respect PLGA mass), in which the
concentration of TRITC-albumin was conformed for all of them at 0.625 mg/ml
(w/v) respect to final volume of microneedles.
Before starting delivery tests, preliminary experiments were performed, to ensure
the preservation of hydratation of gelatine matrix during the release period, to
exclude any alteration of diffusion. Gelatin B (DS 64 %), dissolved in a water
solution with 5 % DMSO, was prepared at 10 % w/w, and after addition of dare-
cure (0.75 % w/w respect to gelatin), about 250 µl was poured in Petri dish’s well,
closed with cover-glass and cured by UV exposition at 365 nm for 20 min.
The bottom part of the Petri dish and the cover glass above gelatine were sealed.
To find the best system to limit water loss they were tested three different
sealings: Norland optical adhesive, that was UV cured; picodent twinsil, a bifasic
silicon, and hot glue (figure 2.13).
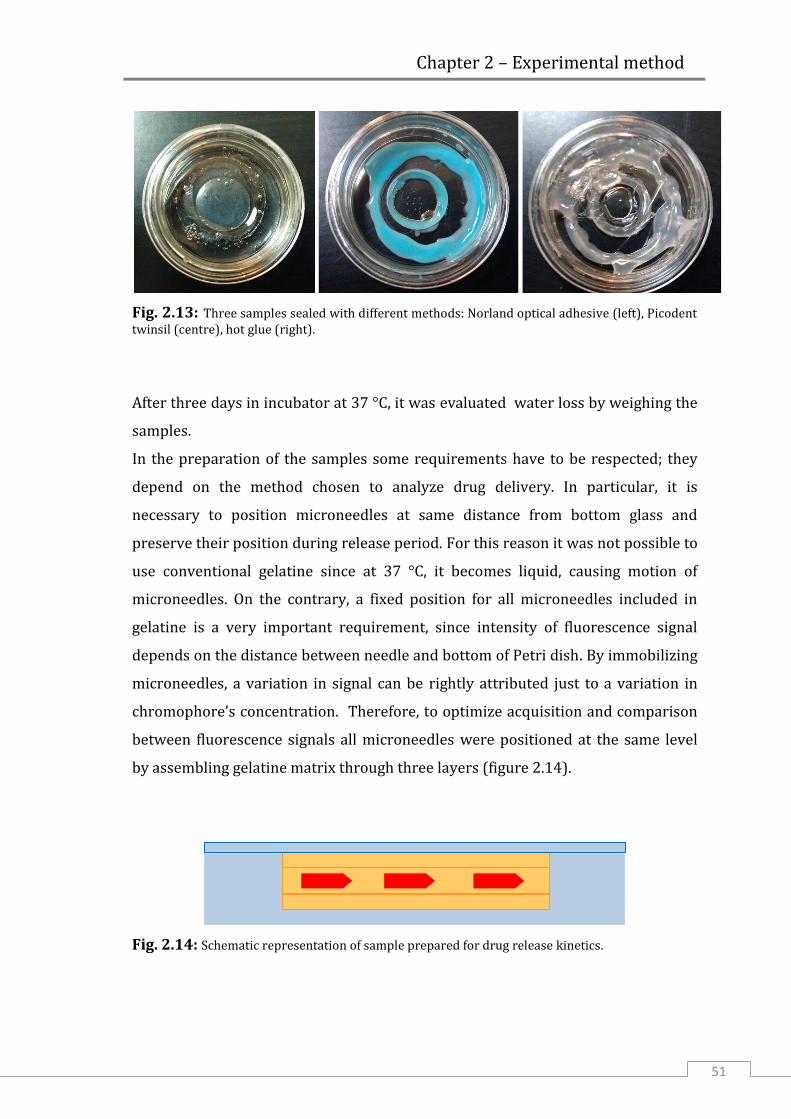
Chapter 2 – Experimental method
51
Fig. 2.13: Three samples sealed with different methods: Norland optical adhesive (left), Picodent twinsil (centre), hot glue (right).
After three days in incubator at 37 °C, it was evaluated water loss by weighing the
samples.
In the preparation of the samples some requirements have to be respected; they
depend on the method chosen to analyze drug delivery. In particular, it is
necessary to position microneedles at same distance from bottom glass and
preserve their position during release period. For this reason it was not possible to
use conventional gelatine since at 37 °C, it becomes liquid, causing motion of
microneedles. On the contrary, a fixed position for all microneedles included in
gelatine is a very important requirement, since intensity of fluorescence signal
depends on the distance between needle and bottom of Petri dish. By immobilizing
microneedles, a variation in signal can be rightly attributed just to a variation in
chromophore’s concentration. Therefore, to optimize acquisition and comparison
between fluorescence signals all microneedles were positioned at the same level
by assembling gelatine matrix through three layers (figure 2.14).
Fig. 2.14: Schematic representation of sample prepared for drug release kinetics.

Chapter 2 – Experimental method
52
First, 40 µl of gelatine were poured in the central well of a microscopy dish, that
has a diameter of 12 mm, and partially photocured for 10 min. On a second layer,
that was completely cured, ten microneedles were positioned and finally this layer
was turned upside down and kept on the first layer. Liquid gelatine was then
added to completely fill the well, closed with a cover glass and again UV cured at
365 nm but this time for 20 min.
2.6.2 Determination of acquisition parameters
For quantification analysis it is important to reduce as much as possible the
noise and distinguish the signal of interest from everything else. Moreover,
especially when there is a low concentration of chromophore, autofluorescence of
polymeric matrix can overlap and hide the signal.
Considering excitation band of albumin-TRITC (figure 2.15), used as model drug, to
obtain a good signal from chromophore, samples were excited using a laser at 543
nm.
Fig. 2.15: Excitation (left) and emission (right) spectra of albumin-TRITC.

Chapter 2 – Experimental method
53
Then, in order to maximize signal/noise ratio, auto-fluorescence of PLGA was
analyzed between 450 and 700 nm which is the emission frequency band
corresponding to BSA-TRITC emission, thus determining the best frequency band
to acquire fluorescence. This test was carried out with a Leica TCS MP-SP5 confocal
microscope in two-photon mode, at 950 nm. In this mode each photon carries
approximately half the energy necessary to excite the molecule, which emits a
fluorescence photon if reached by two photons simultaneously. Using laser in
infrared range, far from frequency band investigated for autofluorescence, it is
possible to acquire it completely. While, using a laser, whose wavelength is
included in band analyzed, we should avoid frequencies nearly close to the laser,
where the signal would be covered by light emission. Autofluorescence emission
spectrum was collected using an acquisition band 10 nm wide. The peak resulted
at 660 nm; it means that this wavelength has to be avoided during analysis of
release kinetics to minimize noise (figure 2.16). So the detected fluorescence
emission bands were set between 560 and 610 nm during measurements.
Fig. 2.16: Autofluorescence spectrum of PLGA.

Chapter 2 – Experimental method
54
2.6.3 Drug loaded quantification
To measure the effective amount of drug loaded in microneedles it was
used Enspire 2300 Multimode Reader Fluorometer.
A calibration line was calculated by analyzing fluorescence of BSA-TRICT water
solution at known concentrations (figure 2.17). Different concentrations were
chosen, from 0 to 2.5 µg/ml of model drug. Then, 150 µl of solution were loaded in
a 96-well plate, each sample in triplicate to mediate results of analysis. The
chromophore was excited at 550 nm and emission signal was collected at 570 nm.
Fig. 2.17: Calibration line for BSA-TRITC obtained from spectrofluorometric analysis.
Once obtained the relation between fluorescence signal and BSA-TRITC
concentration, it was possible to calculate the amount of drug present in a
microneedles array. As microneedles are too small to contain enough cromophore
to be detected by the instrument, an entire array, composed by microneedles and
back-layer was used to calculate BSA concentration.
Emulsion remains stable during preparation and drying, so it was assumed that
water phase compartments have an homogeneous distribution between
microneedles and support layer. Consequently also BSA-TRITC was considered

Chapter 2 – Experimental method
55
uniformly distributed in entire sample. To quantify model drug loaded, PLGA
samples were completely dissolved in 500 µl of dichloromethane (DCM), and then
it was added 1ml of water. As BSA-TRITC is water soluble, it diffused from DCM
towards water. Finally solutions were centrifuged for 5 min at 5000 rpm; 600 µl of
water were collected from each sample and analyzed with spectrofluorometer. At
the end, the concentration of BSA-TRITC, detected in solutions, was normalized
respect to the mass of entire sample dissolved. To calculate the only mass of the
microneedles, 60 of them were cut by hand from a piece of array, weighing sample
before and after the cut. In this way it was possible to evaluate the mass of a single
microneedle and BSA included in it.

Chapter 3 - Results
56
Chapter 3
Results and discussion
3.1 Electro-drawn microneedles
The electro drawing system is relatively easy to assemble and consists
basically of a polar dielectric crystal (lithium tantalate - LT) facing the polymer
reservoir deposited onto PDMS strip. The deposition of a multiple base drop allows
the formation of microneedles under an array-like configuration. The reservoir
drops dispensed, using a syringe pump, directly onto the substrate, are subjected
to the electro-drawing process under the action of the pyro-electrohydrodynamic
(EHD) force. The local heating induced onto the drop reservoir by the termal
stimulus applied to the crystal was measured during the experiment by color
change using a termo camera (Flir i7) and it is < 40 °C. During the drawing process,
the liquid cone becomes solid thanks to the evaporation of the solvent, that blocks
the electro-drawn cone, thus giving to microneedles the desired shape. A post
thermal treatment (40 °C for 10 min), performed by holding microneedles with tip
downwards, can be applied to the microneedles to accelerate and complete solvent
removal. With a fast evaporation, polymeric solution has no time for relaxation
which would lead to a loss of aspect ratio and a bigger basement. In this way,
instead, it is obtained a shrinkage of the base of cone with an improvement of
microneedle’s aspect-ratio.

Chapter 3 - Results
57
Fig. 3.1: Shrinkage obtained with fast evaporation solvent .
The process described above shows for the first time, to the best of our
knowledge, the usage of EHT force for drawing a drop of polymer solution directly
into a microneedle shape. A preliminary investigation was performed on the
formation of a single microneedle from PLGA solution in order to characterize the
main conditions that regulate the microneedle formation. Typically, the base drop
was deposited onto a PDMS strip and had a volume ≤ 0.1 µl. The distance between
the reservoir and the crystal was crucial and depended on both the volume and the
contact angle of the base drop. The driving plate was heated locally in
correspondence of the base drop, while approaching the base reservoir. Since the
EHD force depends on the viscosity of the fluid, the control of this parameter was
crucial for the successful formation of microneedles with the necessary shape. A
proper range of polymer concentrations was chosen, from 20 to 30% w/v, to
guarantee suitable viscosities. From experimental tests, it was concluded that the
best operation condition is defined by 25% w/v of polymer solution. Viscosity was
measured by Ubbelohde viscometer (figure 3.2), which uses a capillary based
method. The solution was introduced into the reservoir (3) until filling between
levels B and C, and then was sucked through the capillary (2). By looking at the
liquid travelling back through the measuring bulb it was then taken the time to
move from level B and A which allowed to measure the viscosity. In general, the
pressure head in this kind of instrument only depends on a fixed height and no
100 m

Chapter 3 - Results
58
longer on the total volume of liquid, thanks to a third arm extending from the end
of the capillary and open to the atmosphere.
Fig. 3.2: Scheme of Ubbelhode viscometer, showing capillary of injection (1), reservoir (3), capillary to suck solution until complete filling of measure bulb (4)
Viscosity range, calculated from measuring the different times, and suitable for
this fabrication method was around 80 to 240 mm2/s. In particular, the solution at
25% w/w of PLGA, used to fabricate microneedles for this work, showed a
viscosity of 125.75 mm2/s (figure 3.3).

Chapter 3 - Results
59
PLGA (%) Time (s) Viscosity (mm2/s)
10 1.53 13.53591
20 8.7 76.9689
30 27.14 240.10758
40 112.69 996.96843
Fig. 3.3: Plot of viscosities for solutions at different concentration (up) and relation between times, measured with Ubbelhode, and viscosity (down).
Electro-drawing method provides remarkable degrees of freedom in moulding the
shape of the microneedles. The polymer microneedle was formed in a single step
by controlling the distance d between the base (contact angle θ) and the DP. In
particular starting from the volume V of the drop reservoir we defined a critical
distance Dc so that the process takes place for values of distance shorter than the
critical one:
In this condition controlling the volume of the drop reservoir and the critical
distance it is possible to control the height of the needle produced.

Chapter 3 - Results
60
3.2 Microneedles on pillars
As regulation of volume is a fundamental factor for the determination of the
final microneedle’s height, PDMS micropillars were used as base to deposit drops
with hogh control on the volume uniformity. Micropillars were shaped from wells
worked in PMMA by using the micro-milling technique (figure 3.4). Wells were
drilled with the diameter in the range from 500 to 900 µm, to verify correlation
between deposited volume and resulting microneedle.
Fig. 3.4: Micro-wells drilled in PMMA, with increasing diameter, from 600 to 900 µm (up), and an array with 700 µm diameter (down, left). PDMS pillars replaced from wells-stamp (down, right).
Micro-drops were deposited by contacting the drop ejecting by the capillary
connected to syringe pump, with the surface of pillars (figure 3.5). In this way by
varying pillar’s diameter it was possible to control the amount of solution that can
be deposited forming reservoir for needle fabrication.

Chapter 3 - Results
61
Fig. 3.5: Schematic representation of deposition on pillar by contact
Referring to the needle height, h, it was measured considering only the cone
without the pedestal. For base drops of 0.05µl < V < 0.1 µl, the typical height of a
microneedles was 300 µm < h < 500 µm, which falls within the range used for
indentation applications. The method also allows controlling needle’s height and
aspect ratio as a function of droplets. As shown in figure 3.6, needle height
increases with the volume of the drop and aspect ratio h/b can be modulated
accordingly.

Chapter 3 - Results
62
Fig. 3.6: Measures performed on images obtained by digital CMOS camera (1280(H) x 1024(V) spatial resolution) showing correlation between final microneedle’s height (up) and aspect/ratio (down )and initial drop’s volume.
For instance, aspect ratios of 1.3 were obtained starting from a 0.1 µl drop
reservoir. The increase of the aspect ratio with the droplet volume is most
probably due to the fast consolidation of the walls with respect to the inner core
that feeds the increase of the height under the persistent electric field.
In figure 3.7 it is showed as increasing pillar’s diameter, it is possible to deposit a
larger drop that entails formation of taller microneedles.
Drop volume [ L]
Aspect ratio (h/b)
Drop volume [ L]
Height [ m]

Chapter 3 - Results
63
Fig. 3.7: Microneedles obtained by drops with increasing diameter, from 800 µm (left) to 1.1 mm (right).
Thanks to the use of PDMS pillars, the density of microneedles per area can be
dictated by the distance between pillars therefore it can be easily controlled.

Chapter 3 - Results
64
3.3 Hydrophobic and hydrophilic drugs loading
Initially a direct dissolution in the polymeric solution was proved both
using Nile Red, hydrophobic chromophore, and Rhodamine 6G, hydrophilic one, at
several concentrations. As summarized in table 3.1, it was possible to dissolve only
a very little amount of Rhodamine in DMC, while Nile Red was completely
solubilised also at higher concentrations.
Conc. w/w to PLGA Nile Red Rhodamine 6G
0.1% Solubilized Solubilized
0.2% Solubilized Few small residues present in
solution
0.4% Solubilized Residues present in solution
Table 3.1: Solutions proved for electro-drawing process.
Solutions with two chromophores had a different behaviour during drawing.
Rhodamine seemed to hinder cone formation, indeed we were able to form
microneedles only at lower concentrations. Instead, microneedles loaded with Nile
Red were obtained at all the tested concentrations. This difference is probably due
to a different interaction between electric field and two chromophores, polar and
apolar.
In fact, by confocal analysis on microneedle’s slices it was evident that the two
chromophores were distributed in different areas of microneedle. In the case of
Nile Red the longitudinal measurement clearly showed that a significant increase
in the fluorescence signal (around 12%) is revealed within a depth of about 150
μm from the tip of the microneedle. Additional measurements were performed
along three transversal scan directions at different depths from the tip (100 μm;
200 μm; 300 μm), that showed a constant profile (figure 3.8).

Chapter 3 - Results
65
(a)
(b) (c)
(d) (e)
Fig. 3.8: Cross‐sectional view of the scan directions used for confocal measure (a); emission measured on a thin sheet of the cut microneedle, in longitudinal (b) and transversal direction, at 100 (c), 200 (d) and 300μm of distance from the tip (e).
On the contrary, confocal image on slices of microneedles loaded with Rhodamine
showed a feeble fluorescent signal toward tip and a higher intensity at needle’s
base (figure 3.9).

Chapter 3 - Results
66
Fig. 3.9: Cross‐sectional view of the scan directions used for confocal measure on a microneedle loaded with Rhodamine 6G (up); emission measured in longitudinal direction (down).
This distribution is not efficient for delivery, since most of the model drug was
amassed outside cone.

Chapter 3 - Results
67
3.3.1 Porous microneedles
Since most of the therapeutics of interest are hydrophilic, it was attempted
to load a considerable amount of hydrophilic model drugs by dispersing water
phase in microneedle’s matrix.
In particular, TRITC-albumin was used as active compound. To make its dispersion
possible it was prepared an emulsion of water in oil where the water phase was
loaded with TRITC-albumin and the oil phase was the usual PLGA solution (figure
3.10). The opacity of solution resulting from emulsion depends on the formation of
thousand micro-droplets of water which refract light rays. This means that ice
jacket around sample was able to avoid evaporation of water, despite high
intensity of energy dispensed to solution. Indeed, without a system to control the
temperature, the water would have evaporated completely, leaving a clear
solution.
Fig. 3.10: PLGA dissolved in DMC at 25% and water solution loaded with Rhodamine before emulsification (left); solution resulting after sonication (right).
Even starting from an emulsion based droplet, it was possible to effectively form
PLGA microneedle. The electro-drawing was not affected by the presence of the
water, as reported in figure 3.11a, whereas a microneedle onto a 700 μm diameter
pillar was seen by optical microscope. The uniform distribution of the hydrophilic

Chapter 3 - Results
68
micro-compartments is clear by the SEM micrograph taken onto a slice of the same
microneedle, figure 3.11b.
a) b)
Fig. 3.11: Optical image of a microneedle electro‐drawn by water‐in‐oil emulsion (a); SEM micrograph on a slice of the microneedle on the left (b).
This is a very new and interesting result since it proves the capability to load
hydrophilic compounds in PLGA microneedles. Moreover, the presence of these
micro-cavities accelerate hydratation of microneedle and consequently the release
of drug loaded inside. Moreover, as pores are closer and closer, thanks to the effect
of degradation of PLGA matrix, it becomes even faster the formation of
microchannels between pores, allowing even faster diffusion of model drug
throughout microneedle.
However, the microneedle described so far present not optimal distribution of
bioactive agent. Indeed, drug is uniformly distribuited throughout the cone and the
pedestal region with obvious lost the drug encapsulated in the pedestal region.
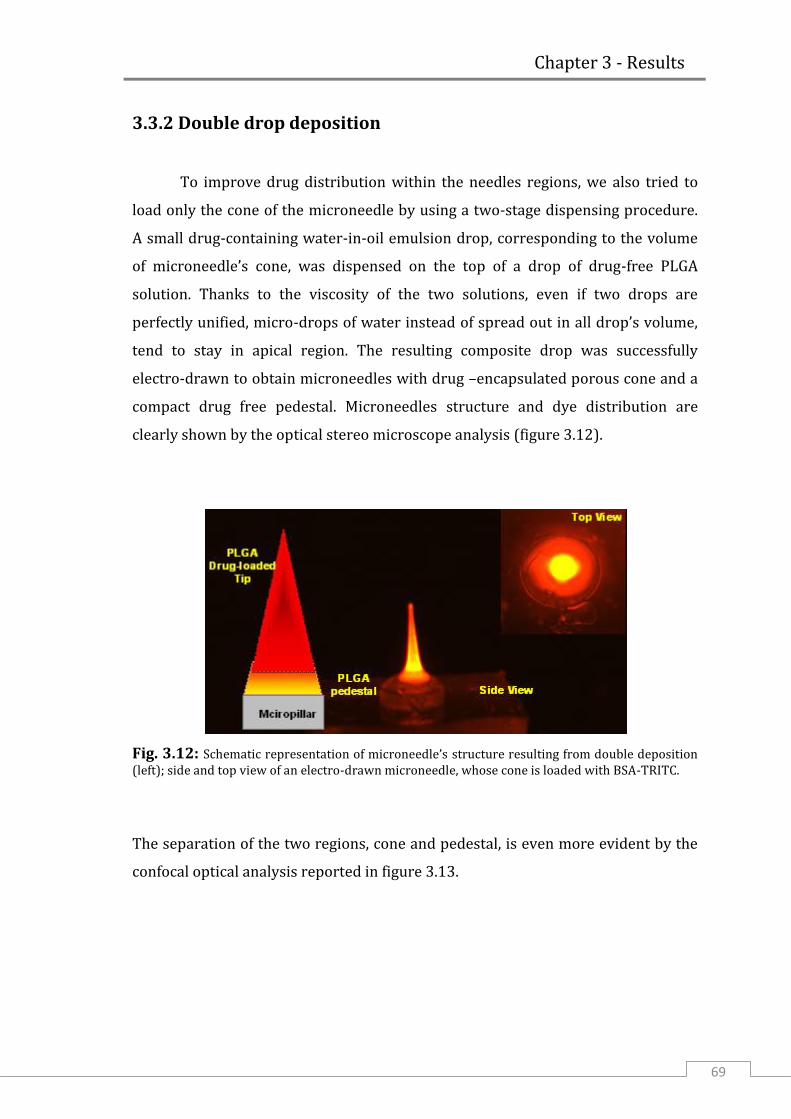
Chapter 3 - Results
69
3.3.2 Double drop deposition
To improve drug distribution within the needles regions, we also tried to
load only the cone of the microneedle by using a two-stage dispensing procedure.
A small drug-containing water-in-oil emulsion drop, corresponding to the volume
of microneedle’s cone, was dispensed on the top of a drop of drug-free PLGA
solution. Thanks to the viscosity of the two solutions, even if two drops are
perfectly unified, micro-drops of water instead of spread out in all drop’s volume,
tend to stay in apical region. The resulting composite drop was successfully
electro-drawn to obtain microneedles with drug –encapsulated porous cone and a
compact drug free pedestal. Microneedles structure and dye distribution are
clearly shown by the optical stereo microscope analysis (figure 3.12).
Fig. 3.12: Schematic representation of microneedle’s structure resulting from double deposition (left); side and top view of an electro-drawn microneedle, whose cone is loaded with BSA-TRITC.
The separation of the two regions, cone and pedestal, is even more evident by the
confocal optical analysis reported in figure 3.13.

Chapter 3 - Results
70
Fig. 3.13: Confocal images on microneedle sliced.
3.3.3 Porous microneedles by stamp
To study the relationship existing between microneedle’s porosity and
release kinetics a great number of microneedles was needed. So it was considered
more convenient to fabricate microneedles by replica molding instead of electro-
drawing, using same composition of starting emulsion, from which depends final
porosity. Microneedles were shaped using master, whose structures have a square
base of 100 x 100 µm, 250 µm height and spaced 400 µm (figure 3.14).

Chapter 3 - Results
71
Fig. 3.14: Stereoscopical image of master structure in COP (up); microneedles replicated from PDMS stamp.
Few seconds under vacuum was enough to fill the PDMS stamp. By simply drying
PLGA solution, perfectly shaped microneedles were obtained: there was no need to
centrifuge sample to compact polymer inside holes.
As preliminary check, a comparison was made between the porosity obtained from
the two fabrication techniques. Images of figure 3.15 show the porosity obtained
using a solution of PLGA emulsified with 30% water phase, containing 20 mg/ml
lecithin, respect to polymer mass. In both electro-drawn microneedle and
microneedle fabricated by mold there was a similar number of pores of 3-4 µm in
diameter.

Chapter 3 - Results
72
Fig. 3.15: SEM images on slices of microneedles included in PDMS and fabricated by electro-drawing (left) and by mold (right).
From the last evidence, it was supposed that release kinetics resulting from
pyramidal microneedles was comparable to the one obtained by using electro-
drawn structures.
Then, porosity degree was correlated to the amount of water emulsified inside
PLGA solution. From morphological studies on slices of microneedles it was
noticed a change in porosity by increasing water phase from 30% to 80% w/w

Chapter 3 - Results
73
respect to PLGA. As showed in figure 3.16 microneedles containing 60% of water
have a greater level of porosity, even if pore size is unchanged respect to
microneedles resulting from an emulsion with lower water content. This is
explainable since during the preparation of the samples, the concentration of
lecithin in water was kept constant, so increasing water content also lecithin
included in emulsion was increased. A greater amount of surfactant was therefore
able to stabilize larger surface, preserving pore size. Instead, at higher percentages
of water, as it is possible to see, some pores much wider than others were
obtained. This is probably due to aggregation of water drops at a later stage of the
emulsion formation.
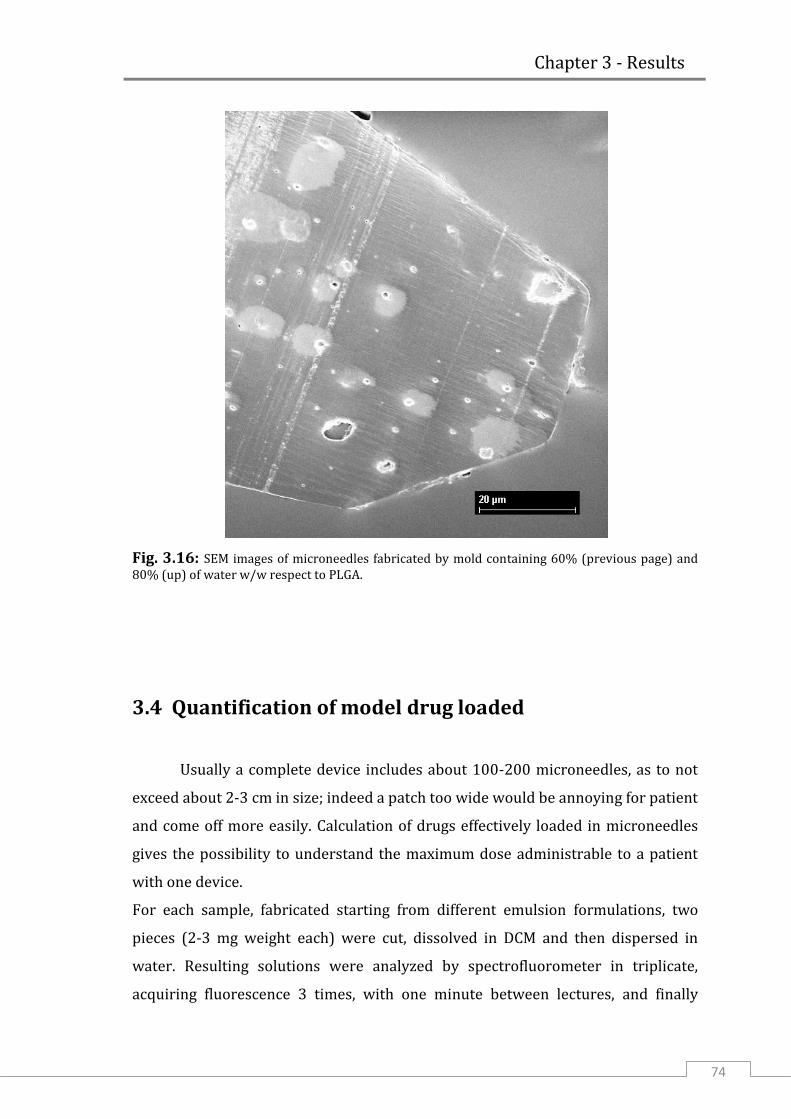
Chapter 3 - Results
74
Fig. 3.16: SEM images of microneedles fabricated by mold containing 60% (previous page) and 80% (up) of water w/w respect to PLGA.
3.4 Quantification of model drug loaded
Usually a complete device includes about 100-200 microneedles, as to not
exceed about 2-3 cm in size; indeed a patch too wide would be annoying for patient
and come off more easily. Calculation of drugs effectively loaded in microneedles
gives the possibility to understand the maximum dose administrable to a patient
with one device.
For each sample, fabricated starting from different emulsion formulations, two
pieces (2-3 mg weight each) were cut, dissolved in DCM and then dispersed in
water. Resulting solutions were analyzed by spectrofluorometer in triplicate,
acquiring fluorescence 3 times, with one minute between lectures, and finally

Chapter 3 - Results
75
averaging the values. Comparing the fluorescence signal with the calibration line
represented in chapter 2 (figure 2.17), it was possible to calculate for each sample,
based on an array of PLGA microneedles, the BSA-TRITC concentration in the
solutions where microneedles were dissolved. Knowing water volume added, it
was possible to calculate the amount of BSA-TRITC included in the cut array. This
value, obviously, depends on the dimension of the dissolved sample, so it was
normalized respect to the mass of PLGA (figure 3.17).
Fig. 3.17: Spectrofluorometric analysis for quantification of model drug.
For samples fabricated starting from solutions emulsified with different amount of
water phase, the amount of BSA-TRITC was in the range of 0.33-0.45 µg per
milligram of PLGA. From the difference in weight of the PLGA substrate, before and
after deprivation of all microneedles, it was calculated that the weight of each of
them was about 2.5 µg. This means that in an array of one hundred microneedles,
it would be possible to have about 0.1 µg of model drug, loaded only in
microneedles volume.
In some cases for release in vivo it is necessary to deliver some micrograms of
active drugs to have a pharmacological effect. However, increasing size of
microneedles and concentration of drug loaded in water phase, it could be
attempted to load a useful drug’s amount.
0.200
0.250
0.300
0.350
0.400
0.450
0.500
0.550
0% 20% 40% 60% 80% 100%
BSA
-TR
ITC
re
spe
ct t
o P
LGA
(µ
g/m
g)
Water content of originary emulsion

Chapter 3 - Results
76
3.5 Drug release kinetics
Release kinetics was quantified by including microneedles in a gelatine
matrix. Microneedles were cut by hand and separated from the back layer, to
consider only the contribution of elements that should penetrate inside skin. The
analysis by confocal microscope allows analyzing samples in a non-destructive or
invasive way. During test it was analyzed the average of fluorescence on the entire
volume of microneedles and the decrease of signal was attributed to diffusion in
gelatine over time.
For the preparation of samples, it was chosen Norland optical adhesive as sealant.
Indeed, in preliminary tests where different sealants had been used, to verify the
maintaining of hydration of gelatine, it was identified as the best sealing, with a
weight loss of the sample of just 8 mg after 3 days at 37 °C respect to about 200 mg.
After including the microneedles in the gelatine matrix and closing them in the
Petri’s well with coverglass and sealant, one millilitre of water was added before
locking the cover with parafilm (figure 3.18). Water was necessary to create an
environment saturated with water vapour to inhibit water-loss from gelatine.
Fig. 3.18: Sample prepared to study drug’s delivery kinetics.

Chapter 3 - Results
77
This optimized system preserved hydration of gelatine even after three weeks
from the beginning of the test. No any air bubble was formed inside the sample
during monitoring period, differently from what occurred with other sealing
systems and without water.
Since transdermal delivery with microneedles has a special attractiveness for
those drugs, with protein nature, too much wide to cross intact skin and too easily
degradable for gastro-intestinal ambient, it was used BSA-TRITC as model drug, a
molecule with 66 kDa molecular weight. This model drug is commonly used to
mimic diffusive behaviour of large size drugs. In figure 3.19 it is showed the release
profile from microneedles containing 30% and 80% of water respect to PLGA in
the first three days which are really important in most of the applications.
Fig. 3.19: Fluorescent signal over time collected during release period in gelatine at 37 °C. Are plotted fluorescence trend of microneedles fabricated from emulsion containing 30% (blue) and 80% (green) of water respect to PLGA. Each point is the average calculated on ten microneedles.
Typically, due to the very low degradation degree of the PLGA this time scale is not
enough to have significant drug release especially in the case of embedded and
large molecules. We saw that in both cases, even if slow, it was observed some
release of the BSA-TRITC. In particular, the release of the sample with higher
porosity was significantly higher than the other one even though corresponding to

Chapter 3 - Results
78
few tens of % respect to the total amount of embedded drug. Working on the
degree of porosity we expect to further improve the release of the PLGA
microneedles. Moreover, inspecting lower molecular weight molecules it is
possible to expect much higher release kinetics.
The increase in fluorescence visible after 24h in the first kind of samples is
probably an optical effect that depends on needles hydration. This evidence was
not found in the other sample, where maybe this increase is balanced by faster
diffusion.
Following the release until 14 days it was observed about 70% of model drug
released from microneedles with lower porosity degree, and about 85% of release
was reached from the ones with higher degree of porosity. This is a useful
information especially in the case of microneedles which are released after
insertion and that can continue the release of their cargo over time without being
annoying for the patient. In this case the release would be almost complete after
around two weeks.
After 14 days in gelatine matrix, it was visible a leakage of material from some
microneedles at 80% water content (figure 3.20). This was due to strong
degradation of PLGA: from the breakage of ester linkage smaller chain lengths are
formed and they can diffuse through microneedle matrix.
Fig. 3.20: Microscopy image in transmission mode showing small PLGA chain diffusing outside microneedle.

Chapter 3 - Results
79
At 21st days from the beginning of release test the polymeric matrix appeared even
more degraded, with some regions completely dissolved by hydrolysis (figure
3.21). Degradation stage was more advanced in microneedles with higher porosity,
this is most probably due to a fast hydration that accelerate degradation.
Fig. 3.21: Microneedle after 21 days in gelatine, with 30% (up) and 80% (down) of water
content.

Chapter 3 - Results
80
3.6 Indentations
3.6.1 Preliminar tests
To serve as substitute for a hypodermic needle, a microneedle should
penetrate the 10 ÷ 20 µm thick stratum corneum without breakage. Preliminary
indentation experiments were performed into model materials, such as wax and
agarose gel, that allows an easy visualization in real time, in order to test the
hardness of the microneedles. Figures 3.22 shows the microneedles while
penetrating the agarose and just after ejection. No any breakage or bending was
observed either in this case or for other lengths and aspect ratios of the
microneedles during the insertion tests.
Fig. 3.22: PLGA microneedles loaded with NR inserted in agarose (left) and after ejection (right).
Instead, a porous microneedle, containing a 30% of water, fabricated on a PDMS
pillar of 700 µm in diameter, was tested in paraffin. In figure 3.23 successivephases
of indentation are showed. Microneedle was forced in paraffin wax until the pillar
that respond elastically to compression, appeared deformed. Despite the applied
force, microneedle was ejected without bending or tip deformations.
Agarose

Chapter 3 - Results
81
Fig. 3.23: Photograms showing indentation in a paraffin layer carried out with a porous microneedle containing 30% water phase.

Chapter 3 - Results
82
3.6.2 Indentation in skin
Finally, indentation experiments were performed into real skin by inserting
the Nile Red loaded microneedles obtained with post-thermal treatment. This
analysis was carried out with the system showed in figure 3.24, that mimics the
application of a patch through a bracelet. Pig cadaver skin was kept on absorbing
paper, around tube that simulate the arm, to avoid shifts. A pressure sensor was
fixed to the plastic plate of bracelet, exactly with sensitive area under microneedles
in order to measure the force exerted on them. By tightening elastic cuff,
microneedles were inserted into pig cadaver skin and removed after 15 min.
Fig. 3.24: Set up for indentation in pig skin, showing plastic plate fixed to the elastic cuff, the pressure sensor used to measure pressure and pig skin kept on absorbing paper.
During indentation it was measured a force about 1N, that acting on all
microneedles in series, would correspond to 0.33N/microneedle. Specifically, the
necessary force to produce the indentation was of around 0.01 N per microneedle

Chapter 3 - Results
83
which is much lower than forces (> 1 order of magnitude) typically known to
produce PLGA microneedle breakage. The effectiveness of the indentation is
confirmed by the cross sectional image of the stained skin at the site of
microneedle penetration (figure 3.25).
Fig. 3.25: Cross-sectional image of the skin after microneedle removal and skin fixing in formaline at 10%, magnification of one indentation (left) and complete image (right).
The dermis was clearly reached by the microneedle, thus confirming the potential
use for drug delivery. The insertion depth was in agreement with the dimensions
of the microneedles used for test having respectively around 400, 500, 450 µm
length (figure 3.26).

Chapter 3 - Results
84
Fig. 3.26: Optical image of microneedles used for indentation with heights of (left) 400 μm, (middle) 500 μm, (right) 450 μm.
In particular, they were able to penetrate all the layers of the epithelium and part
of the papillary dermis. These results confirmed the effectiveness of these
microneedles which combined with the technological simplicity of the technique
could provide a significant breakthrough in the clinical development of the
biodegradable microneedles.
3.6.3 Nanoindentation
The mechanical resistance of the polymeric matrix used to fabricate
microneedles, is an essential factor to be considered in order to ensure the success
of indentation. A microneedle must withstand the force required to pierce stratum
corneum without reaching breaking load. The elastic modulus of polymeric matrix
was evaluated by indenting samples with a standard berkovich tip (figure 3.27).

Chapter 3 - Results
85
Fig. 3.27: Substrate tested with berkovich tip of nanoindenter.
Mechanical tests were accomplished on samples worked by different methods. As
it is showed in plot (figure 3.28), PLGA dried after dissolution in DMC has an elastic
modulus lower that the one obtained in case of sample fabricated by direct
melting. This is probably explainable with a different compression state of
polymeric chains, dissolution of polymer in a solvent, even after lyophilisation,
might have caused formation of a network with larger mesh. Despite this
significant loss of resistance electro-drawn microneedles, fabricated by a PLGA
solution, were able to indent.

Chapter 3 - Results
86
Fig. 3.28: Comparison between elastic modulus, calculated through nanoindentation, of PLGA worked by melting and dissolving, and different formulation of emulsion.
In addition, mechanical tests, performed by nanoindentation of samples obtained
by solution emulsified with different amounts of water, proved that there was no
significant difference between the different samples. Probably, this is due to the
kind of distribution of the pores which are small and not interconnected, therefore,
they do not affect the elastic modulus of the polymeric matrix. It is, therefore,
reasonable to suppose that also porous microneedles should be able to drill skin.

Chapter 3 - Results
87
3.7 Conclusion
Biodegradable microneedles are considered as a great alternative to
hypodermic injection and current system for drug delivery. Indeed, it is
established that with this new approach it is possible to obtain an efficient release
of vaccines and other drugs. Microneedles solve in a simple way the problems
related to permeability of stratum corneum, also for molecules with large sizes,
therefore are suitable for many applications. An attractive point for a future use in
human patients is the sharpness loss of microneedles after the first use. Both in the
case of good indentation with following hydration and drug release, and failed
indentation, in which microneedle’s tip is damaged, the disposable is not able to
pierce again. This limits the risk of disease transmission from one person to others.
This thesis project was focused on the development of a new fabrication method
that allows overcoming some limitations of common procedures. Some of these
limits originate from the fact that the drug is included in the polymer matrix, so if
process conditions are such to degrade it, then it is required a very large amount of
drug to obtain a pharmacological effect. This drug’s overload can make production
uneconomical.
In this work it is showed for the first time a fabrication method based on electro-
drawing. Electrical field is generated from a heated pyroelectric crystal. This is the
only element brought to high temperature, while the temperature of the polymeric
solution, in which is included the drug, never overcomes 40 °C. So this process
results very interesting especially for thermolabile drugs, such as proteins. To
shape microneedles it is not used any stamp: in the whole process the polymeric
solution comes into contact only with the flexible substrate, that is the support of
the microneedles array. So it is avoided any cross-contamination between devices
produced in series.
It has also been demonstrated the ability to form porous microneedles, by the
drawing of a drop of emulsion. This gives the possibility to load, also
contemporary, an hydrophilic and lipophilic drug in the same microneedle. In
addition, with double drop deposition, the active compound has been localized into

Chapter 3 - Results
88
the cone, or in other words in the only region that will be completely inserted in
skin. This is important since drug localization maximizes the efficiency of release.

Appendix Instruments
89
Appendix Instruments
A.I.1 Confocal Microscope
Illuminating and observing a sample, two physical processes significantly
limit the sharpness of the observed image:
1) by illuminating the entire sample, the light spreads in it disturbing the image
of the focus plane: to solve this problem it is needed to illuminate only small
areas of the sample.
2) while it is possible to observe a focus plane of the sample, also the light
reflected from the plans not in focus comes to the eyes, making a confusing
picture: the revolutionary idea compared to conventional microscopy is to
block as much as possible the information derived from the above and below
planes to the desired through a small opening.
Confocal microscopy allows overcoming the limits of conventional optical
microscopy. Indeed, it is an optical imaging technique used to increase optical
resolution and contrast of a micrograph by using point illumination and a spatial
pinhole, in input and in output, to eliminate out-of-focus light in specimens that are
thicker than the focal plane. The image therefore is not disturbed by unwanted
reflections or fluorescences by the plans not in focus and the points of focus plane
that are not observed. It enables the reconstruction of three-dimensional
structures from the obtained images.
As it is possible to see from the figure A.I.1, the beam excitation passes through the
illuminating pinhole, irradiating only a small region of the sample.

Appendix Instruments
90
Figure A.I.1: Simplified optics of a Laser Scanning Confocal Microscope (LSCM).
Before detection a second confocal aperture, a detector pinhole, reduces the
contributions of the above and below planes to the focus. By scanning techniques,
it is possible to study the entire sample surface. The fundamental principle of any
scanning microscope is to illuminate a point of the sample at a time; the signal
resulting from the interaction between the incident radiation and the sample is
recorded and processed to form a reproduction of the sample to visualize.
Compared to a conventional microscope that immediately provides the full image,
with the confocal microscope the sample is probed point by point.
In confocal microscopy, as excitation source it is often used a laser beam. This
provides a high intensity and monocromatic light source. It is first filtered and
attenuated so to use a correct intensity and proper excitation spectrum to produce
fluorescence that is the emission of a secondary photon upon absorption of a
photon of higher wavelength (figure A.I.2). Most molecules at normal temperatures
are at the lowest energy state, the so-called 'ground state'. Occasionally, a molecule
may absorb a photon and increase its energy to the excited state. From here it can
very quickly transfer some of that energy to other molecules through collisions
(red) and spontaneously emits the remaining energy by emitting a photon (green)
with a lower wavelength to return to the ground state.

Appendix Instruments
91
Figure A.I.2: Scheme of the fluorescence mechanism.
In fluorescence microscopy, fluorescent molecules, in order to increase the signal,
are designed to be attached to specific parts of a sample, thus identifying them
when imaged. Multiple fluorophores can be used to simultaneously identify
different parts of a sample. There are two options when using multiple
fluorophores:
fluorophores can be chosen that respond to different wavelengths of a multi-
line laser;
fluorophores can be chosen that respond to the same excitation wavelength
but emit at different wavelengths.
While the intensity of incident radiation can be increased, fluorophores may
become saturated if the intensity is too high. Moreover, they can present
photobleaching that is an irreversible fade when they are exposed to excitation
light for a long time being able to emit only a limited number of photons. This may
be due to reaction of the molecules’ excited state with oxygen or oxygen radicals.
Photobleaching can be limited by reducing the oxygen available or by using free-
radical scavengers. Some fluorophores are more robust than others, so choice of
fluorophore is very important.

Appendix Instruments
92
A.I.2 Multiphoton fluorescence microscopy
The multiphoton fluorescence microscope (MPM) uses pulsed long-
wavelength light to excite fluorophores within the specimen being observed. The
fluorophore absorbs the energy from two long-wavelength photons which must
arrive simultaneously in order to excite an electron into a higher energy state,
from which it can decay, emitting a fluorescence signal (figure A.I.3). It differs from
traditional fluorescence microscopy in which the excitation wavelength is shorter
than the emission wavelength, as the summed energies of two long-wavelength
exciting photons will produce an emission wavelength shorter than the excitation
wavelength.
Fig. A.I.3: Diagram indicating the absorption of two NIR photons to excite the fluorescent molecule to an excited state and the visible fluorescence emitted during relaxation.
Multiphoton fluorescence microscopy has similarities to confocal laser scanning
microscopy. Both use focused laser beams that scan the sample to generate images,
and both have an optical sectioning effect. Unlike confocal microscopes,
multiphoton microscopes do not contain pinhole apertures, which give confocal

Appendix Instruments
93
microscopes their optical sectioning quality. The optical sectioning produced by
multiphoton microscopes is a result of the point spread function of all elements
included in optical path, namely depends on how the system blurs the image of a
bright spot formed where the pulsed laser beams coincide.
Compared to similar optical imaging techniques, MPM holds inherent advantages
for imaging living tissues by improving depth penetration and reducing
photodamage. This is a direct result of employing near infrared (NIR) femtosecond
lasers to generate observable nonlinear signals in the visible range. The NIR
excitation enhances the ability to image deeper into a sample through a reduction
light scattering proportional to the fourth power of the excitation wavelength.
A.I.3 Immersion sonicator
One of the equipments used in the preparation of the water-PLGA emulsion
for porous microneedles fabrication, is the immersion sonicator. In figure A.I.4 it is
reported the one used in the thesis which was the Ultrasonic Processor VCX500
Sonic and Materials.
Fig. A.I.4: Picture of the Ultrasonic Processor VCX500 Sonic and Materials.

Appendix Instruments
94
The ultrasonic power supply converts 50/60 Hz line voltage to high frequency
electrical energy transmitted to the piezoelectric transducer within the converter,
where it is changed to mechanical vibrations. The vibrations from the converter
are intensified by the probe, creating pressure waves in the liquid. This rapid
changes in pressure causes the formation of cavities during phase of low pressure,
and their implosion during high pressure, that generate intense shock waves. The
sum of energy released by each individual implosion is minimal, but the
cumulative effect causes extremely high levels of energy to be released into the
liquid. Temperature is monitored therefore if a pre-fixed threshold is overcome,
sonication will stop. To avoid this condition it is possible to alternate pulse off
and/or more effectively create an ice jacket to improve heat dissipation and keep
temperature below the threshold. The Ultrasonic Processor is designed to deliver
constant amplitude. As the resistance to the movement of the probe increases,
additional power will be delivered by the power supply to ensure that the
excursion at the probe tip remains constant. Furthermore, the amplitude control
allows the ultrasonic vibrations at the probe tip to be set to any desired level.
Probes consist of two sections each having different cross-sectional areas. Brought
to resonant frequency, the probe expands and contracts longitudinally about its
center. Amplification factor increases with the mass ratio between the upper
section and the lower section. Probes with smaller tip (figure A.I.5.A) diameters
produce greater intensity of cavitation, but the energy released is restricted to a
narrower, more concentrated field. Conversely, probes with larger tip (figure
A.I.5.B) diameters produce less intensity, but the energy is released over a greater
area.

Appendix Instruments
95
Fig. A.I.5: Small (A) and large (B) types of probes.
High gain probes produce higher intensity than standard probes of the same
diameter, and are usually recommended for processing larger volumes. Probes are
fabricated from high grade titanium alloy Ti-6Al-4V because of its high tensile
strength, good acoustical properties at ultrasonic frequencies, high resistance to
corrosion, low toxicity, and excellent resistance to cavitation erosion. They are
autoclavable and available with threaded ends to accept replaceable tips, microtips
and extenders.
A.I.3 Fluorescence Spectroscopy
In this work, fluorescence spectroscopy was used to quantify the amount of
BSA-TRITC loaded in microneedles, through the intensity of fluorescence signal. In
following figure A.I. 6 is reported the EnSpire Multimode Plate Reader 2300-0000,
Perkin Elmer used in this work.

Appendix Instruments
96
Figure A.I.6: Picture of the spectrofluorimeter EnSpire Multimode Plate Reader 2300-0000, Perkin Elmer.
Fluorescence occurs when a substance that has absorbed light or other
electromagnetic radiation, emits light with different wavelength. When a substance
absorbs energy, the electronic state of the molecules changes from the ground
electronic state (low energy state) to a one of the vibrational states of the excited
electronic state. Excited molecule can collide with other molecules causing as a
result lose of energy until the molecule reaches the lowest vibrational state of the
excited electronic state, and finally, as consequence of collisions, the molecule
drops again into one of the various vibrational levels of the ground electronic state,
emitting a photon in the process. Because the molecules can drop in any of the
different vibrational levels of the ground state, the emitted photons will have
different energies and in consequence, different frequencies.

Appendix Instruments
97
A.I.4 Nano Indenter
To characterize PLGA matrix employed to fabricate microneedles, a Nano
Indenter G200 Agilent Technologies was used (figure A.I. 7). This instrument is
able to apply loads and to sense displacements in the micro and down to nano
scale.
Fig. A.I. 7: Picture of Nano Indenter G200, Agilent Technologies.
Indentation testing is a method that consists essentially of touching the material of
interest, whose mechanical properties such as elastic modulus are unknown, with
another material whose properties are known. The difference from others
conventional indentation hardness tests is the indirect measurement of contact
area. In nanoindentation tests, the size of the residual impression is of the order of
microns and too small to be conveniently measured directly. Thus, it is customary
to determine the area of contact by measuring the depth of penetration of the
indenter into the specimen surface. This, together with the known geometry of the
indenter’s tip, provides an indirect measurement of contact area. For this reason,
nanoindentation testing is referred to as depth-sensing indentation (DSI) [61].
Depending on the test that one wants to perform and on the type of sample,
different tip indenters can be used, some of which are showed in figure A.I. 8.

Appendix Instruments
98
Fig. A.I. 8: Rapresentation of geometries most used for indentation: Berkovich, Vickers, Cube-Corner, Cone and Sphere (from left).
A schematic representation of indenter’s elements is showed in figure A.I. 9. During
an indentation, corresponding values of load and displacement of the diamond tip
(indentation depth) are recorded, and from the resulting curve the hardness and
the E-modulus are calculated. The load is applied by running a current through the
load application coil. Magnetic field so generated interact with permanent magnet
mounted onto indenter shaft, thus pushing diamond tip. The indenter
displacement is measured by the capacitive displacement sensor.
Fig. A.I. 9: Diagram of the nanoindenter system used. The force imposed on the indenter is generated through a coil that sits within a circular magnet. The displacement sensing system consists of a three-plate (circular disks) capacitor.
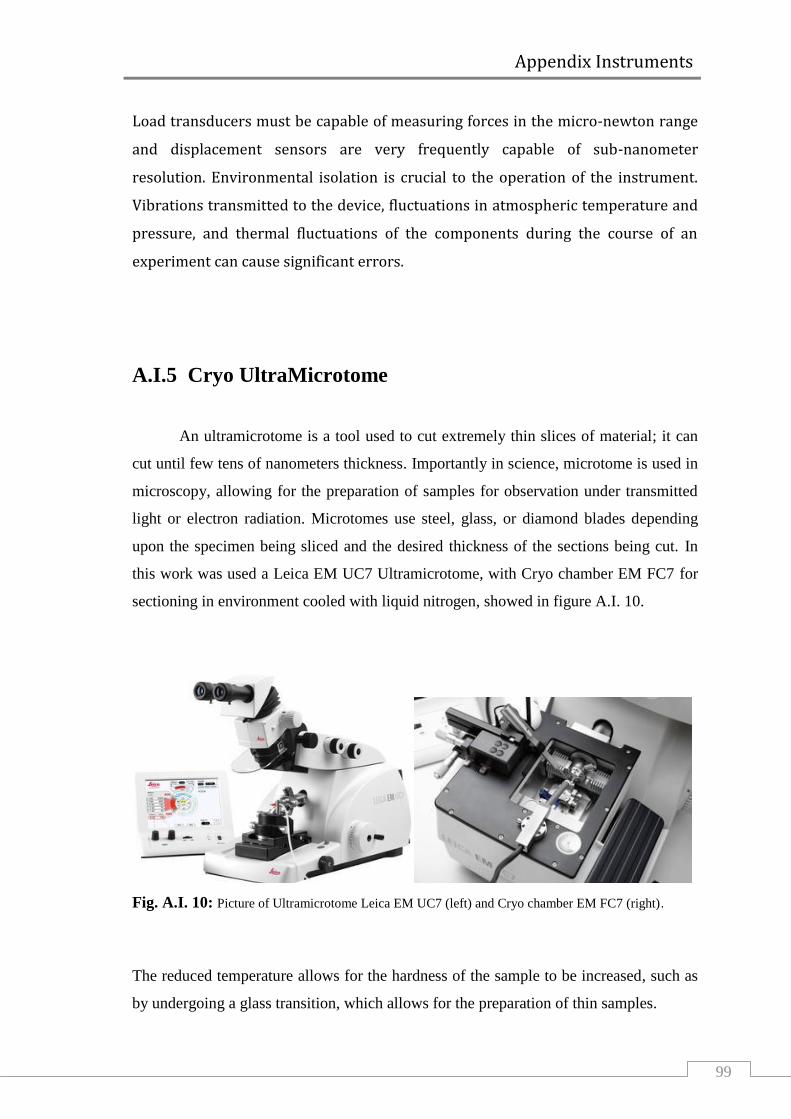
Appendix Instruments
99
Load transducers must be capable of measuring forces in the micro-newton range
and displacement sensors are very frequently capable of sub-nanometer
resolution. Environmental isolation is crucial to the operation of the instrument.
Vibrations transmitted to the device, fluctuations in atmospheric temperature and
pressure, and thermal fluctuations of the components during the course of an
experiment can cause significant errors.
A.I.5 Cryo UltraMicrotome
An ultramicrotome is a tool used to cut extremely thin slices of material; it can
cut until few tens of nanometers thickness. Importantly in science, microtome is used in
microscopy, allowing for the preparation of samples for observation under transmitted
light or electron radiation. Microtomes use steel, glass, or diamond blades depending
upon the specimen being sliced and the desired thickness of the sections being cut. In
this work was used a Leica EM UC7 Ultramicrotome, with Cryo chamber EM FC7 for
sectioning in environment cooled with liquid nitrogen, showed in figure A.I. 10.
Fig. A.I. 10: Picture of Ultramicrotome Leica EM UC7 (left) and Cryo chamber EM FC7 (right).
The reduced temperature allows for the hardness of the sample to be increased, such as
by undergoing a glass transition, which allows for the preparation of thin samples.

Appendix Instruments
100
The instrument used belongs to the class of rotary microtome. This device operates with
a staged rotary action such that the actual cutting is part of the rotary motion. In a rotary
microtome, the knife is typically fixed in a horizontal position. Through the motion of
the sample holder, the sample is cut by the knife position 1 to position 2), at which point
the fresh section remains on the knife. At the highest point of the rotary motion, the
sample holder is advanced by the same thickness as the section that is to be made,
allowing for the next section to be made (figure A.I. 11).
Fig. A.I. 11: Principle of sample movement for making a cut on a rotary microtome.
A.I.6 Scanning Electron Microscope
For morphological analysis of microneedles sectioned a field emission SEM (Ultra plus
Zeiss) was used. A scanning electron microscope (SEM) is a type of electron
microscope that produces images of a sample by scanning it with a focused beam of
electrons. The electrons interact with atoms in the sample, producing signals that can be
detected and that contain information about the sample's surface topography and
composition. In a typical SEM, an electron beam is thermoionically emitted from an
electron gun fitted with a tungsten filament cathode. The electron beam, which typically
has an energy ranging from 0.2 keV to 40 keV, is focused by one or two condenser

Appendix Instruments
101
lenses to a spot about 0.4 nm to 5 nm in diameter. The beam passes through pairs of
scanning coils or pairs of deflector plates in the electron column, typically in the final
lens, which deflect the beam in the x and y axes so that it scans in a raster fashion over a
rectangular area of the sample surface (figure A.I.12).
Fig. A.I.12: Functioning scheme of a scanning electron microscope.
When the primary electron beam interacts with the sample, the electrons lose energy by
repeated random scattering and absorption within a region of sample’s volume, whose
extension depends on the electron's landing energy, the atomic number of the specimen
and the specimen's density. The interaction between electron beam and surface sample
produce a great number of particles, like secondary electrons (SE), back-scattered
electrons (BSE), characteristic X-rays and transmitted electrons. In the standard
detection mode, secondary electron imaging or SEI, the SEM can produce very high-
resolution images of a sample surface. Instead, back-scattered electrons (BSE) are beam
electrons that are reflected from the sample by elastic scattering. BSE are often used in
analytical SEM along with the spectra made from the characteristic X-rays, because the
intensity of the BSE signal is strongly related to the atomic number (Z) of the specimen.
References
102
References
[1] Vilar,G., Tulla-Puche, J., and Albericio,F., Polymers and Drug Delivery Systems.
Current Drug Delivery, 2012 (9), 1-28.
[2] Moeller, E.H., Jorgensen, L., Alternative routes of administration for systemic
delivery of protein pharmaceuticals. Drug discovery today: technologies, 2008 (5),
e89-94.
[3] Langer, R. Drug delivery and targeting. Nature, 1998, 392-395.
[4] Uhrich, E.K., Cannizzaro, S.M., Lager, R.S., Shakesheff, K.M., Polymeric systems
for controlled drug release. Chemical Reviews, 1999 (99), 3181-3198
[5] Suman, Chauhan, M., Asymmetric Membrane Capsule: New Prospects in
Osmotic Delivery. International Journal of Drug Delivery, 2011 (3), 185-193.
[6] Deacon, B., Abramowiz, J., Fear of needles and vasovagal reactions among
phlebotomy patients. Anxiety Disorders, 2006 (20), 946–960.
[7] Gill, H.S., Prausnitz, M.R., Coated microneedles for transdermal delivery. Journal
of Controlled Release, 2007 (117), 227–237
[8] Baria, S.H., Gohel, M.C., Mehta, T.A., and Sharma, O.P., Microneedles: an
emerging transdermal drug delivery system. Journal and Pharmacy Pharmacology,
2012 (64), 11-29.
[9] Kirschner, N., Houdek, P., Fromm, M., Moll, I., Brandner, J.M., Tight junctions
form a barrier in human epidermis. European Journal of Cell Biology, 2010 (89),
839–842.

References
103
[10] Hadgraft, J., and Lane, M.E., Skin: the ultimate interface. Physical Chemistry
Chemical Physics. 2011 (13), 5215–5222.
[11] Nemes, Z., and Steinert, P.M., Bricks and mortar of the epidermal barrier.
Experimental and Molecular Medicine, 1999 (31), 5-19.
[12] Trommer, H., Neubert, R.H.H., Overcoming the Stratum Corneum: The
Modulation of Skin Penetration. Skin Pharmacology and Physiology, 2006 (19),
106–121.
[13] Prausnitz, M.R., Langer, R., Transdermal drug delivery. Nature Biotechnology,
2008 (26), 1261-1268.
[14] Fang, J-Y., Hong, C-T., Chiu, W-T., Wang, Y-Y., Effect of liposomes and niosomes
on skin permeation of enoxacin. International Journal of Pharmaceutics, 2001
(219), 61–72.
[15] Andrews, S.N., Jeong, E., Prausnitz, M.R., Transdermal Delivery of Molecules is
Limited by Full Epidermis, Not Just Stratum Corneum. Pharmaceutical Research,
2013 (30),1099–1109.
[16] Karande, P., Mitragotri, S., Enhancement of transdermal drug delivery via
synergistic action of chemicals. Biochimica et Biophysica Acta, 2009 (1788), 2362–
2373.
[17] Mitragotri, S., Current status and future prospects of needle-free liquid jet
injectors. Nature reviews, 2006 (5), 543-548.
[18] Gupta, J., Prausnitz, M.R., Recovery of Skin Barrier Properties after Sonication
in Human Subjects. Ultrasound in Medicine and Biology, 2009 (35), 1405–1408.

References
104
[19] Gupta, J., Microneedles for transdermal drug delivery in human subject.
Degree Doctor of Philosophy in the School of Chemical & Biomolecular Engineering,
2009.
[20] McAllister, D.V., Allen, M.G., and Prausnitz, M.R., Microfabricated microneedles
for gene and drug delivery. Annual Review of Biomedical Engineering, 2000 (02),
289–313.
[21] Donnelly, R.F., Singh, T.R.R., Tunney, M.M., Morrow, D.I.J., McCarron, P.A.,
O’Mahony, C., and Woolfson, A.D., Microneedle Arrays Allow Lower Microbial
Penetration Than Hypodermic Needles In Vitro. Pharmaceutical Research, 2009
(26), 2513–2522.
[22] Al-Qallaf, B., and Das, D.B., Optimizing Microneedle Arrays to Increase Skin
Permeability for Transdermal Drug Delivery. Annals of the New York Academy of
Sciences, 2009, 83-94.
[23] Park,J-H., Prausnitz, M.R., Analysis of the Mechanical Failure of Polymer
Microneedles by Axial Force. Journal of the Korean Physical Society, 2010 (56),
1223-1227.
[24] Davis, S.P., Landis, B.J., Adams, Z.H., Allen, M.G., Prausnitz, M.R., Insertion of
microneedles into skin: measurement and prediction of insertion force and needle
fracture force. Journal of Biomechanics, 2004 (37), 1155–1163.
[25] Crichton, M.L., Ansaldo, A., Chen, X., Prow, T.W., Fernando, G.J.P., Kendall,
M.A.F., The effect of strain rate on the precision of penetration of short densely-
packed microprojection array patches coated with vaccine. Biomaterials, 2010
(31) 4562-4572.

References
105
[26] Donnelly, R.F., Singh, T.R.R., and Woolfson, A.D., Microneedle-based drug
delivery systems: Microfabrication, drug delivery, and safety. Drug Delivery, 2010
(17), 187–207.
[27] van der Maaden, K., Jiskoot, W., Bouwstra, J., Microneedle technologies for
(trans)dermal drug and vaccine delivery. Journal of Controlled Release, 2012 (161),
645–655.
[28] Henry, S., McAllister, D.V., Allen, M.G., and Prausnitz, M.R., Micromachined
needles for the transdermal delivery of drugs. Micro Electro Mechanical Systems,
1998, 494-498.
[29] Badrana, M.M., Kuntschea, J., Fahra, A., Skin penetration enhancement by a
microneedle device (Dermaroller®) in vitro: Dependency on needle size and
applied formulation. European Journal of Pharmaceutical Sciences, 2009 (36), 511–
523.
[30] McGrath, M.G., Vrdoljak, A., O’Mahony, C., Oliveira, J.C., Moore, A.C., Creana,
A.M., Determination of parameters for successful spray coating of silicon
microneedle arrays. International Journal of Pharmaceutics, 2011 (415), 140– 149.
[31] Kim, Y-C., Quan, F-S., Compans, R.W., Kang, S-M., Prausnitz, M.R., Formulation
and coating of microneedles with inactivated influenza virus to improve vaccine
stability and immunogenicity. Journal of Controlled Release, 2010 (142), 187–195.
[32] Kim, Y-C., Quan, F-S., Compans, R.W., Kang, S-M., and Prausnitz, M.R.,
Formulation of Microneedles Coated with Influenza Virus-like Particle Vaccine.
AAPS PharmSciTech, 2010 (11), 1193-1201.
[33] Crichton, M.L., Ansaldo, A., Chen, X., Prow, T.W., Fernando, G.J.P., Kendall,
M.A.F., The effect of strain rate on the precision of penetration of short densely-

References
106
packed microprojection array patches coated with vaccine. Biomaterials, 2010
(31), 4562-4572.
[34] Gill, H.S., Prausnitz, M.R., Pocketed microneedles for drug delivery to the skin.
Journal of Physics and Chemistry of Solids, 2008 (69), 1537–1541.
[35] Gupta, J., Park, S.S., Bondy, B., Felner, E.I., Prausnitz, M.R., Infusion pressure
and pain during microneedle injection into skin of human subjects. Biomaterials,
2011 (32), 6823-6831.
[36] Park, J-H., Allen, M.G., Prausnitz, M.R., Biodegradable polymer microneedles:
Fabrication, mechanics and transdermal drug delivery. Journal of Controlled
Release, 2005 (104), 51–66.
[37] Lee, J.W., Park, J-H., Prausnitz, M.R., Dissolving microneedles for transdermal
drug delivery. Biomaterials, 2008 (29), 2113-2124.
[38] Sullivan, S.P., Murthy, N., and Prausnitz, M.R., Minimally Invasive Protein
Delivery with Rapidly Dissolving Polymer Microneedles. Advanced Material, 2008
(20), 933–938.
[39] del Campo, A., and Greiner, C., SU-8: a photoresist for high-aspect-ratio and 3D
submicron lithography. Journal of Micromechanics and Microengineering, 2007
(17), R81–R95.
[40] Chu, L.Y., Choi, S-O., Prausnitz, M.R., Fabrication of Dissolving Polymer
Microneedles for Controlled Drug Encapsulation and Delivery: Bubble and Pedestal
Microneedle Designs. Journal of pharmaceutical science, 2010 (99), 4228-4238.
[41] De Muth, P.C., Garcia-Beltran, W.F., Ai-Ling , M.L., Hammond, P.T., and Irvine,
D.J., Composite Dissolving Microneedles for Coordinated Control of Antigen and

References
107
Adjuvant Delivery Kinetics in Transcutaneous Vaccination. Advanced Functional
Material, 2013 (23), 161–172.
[42] Chu, L.Y., Prausnitz, M.R., Separable arrowhead microneedles. Journal of
Controlled Release, 2011 (149), 242–249.
[43] Park, J-H., Choi, S-O. Kamath, R., Yoon, Y-K., Allen, M.G., Prausnitz, M.R.,
Polymer particle-based micromolding to fabricate novel microstructures.
Biomedical Microdevices, 2007 (9),223–234.
[44] Kim, M.Y., Jung, B., Park, J-H., Hydrogel swelling as a trigger to release
biodegradable polymer microneedles in skin. Biomaterials, 2012 (33), 668-78.
[45] Lee, K., Lee, C.Y., Jung, H., Dissolving microneedles for transdermal drug
administration prepared by stepwise controlled drawing of maltose. Biomaterials,
2011 (32), 3134-3140.
[46] Lee, K., Kim, J.D., Lee, C.Y., Her, S., Jung, H., A high-capacity, hybrid electro-
microneedle for in-situ cutaneous gene transfer. Biomaterials, 2011 (32), 7705-
7710.
[47] Kochhar, J.S., Goh, W.J., Chan, S.Y., and Kang, L., A simple method of
microneedle array fabrication for transdermal drug delivery. Drug Development and
Industrial Pharmacy, 2012, 1-11.
[48] Kim, Y-C., Quan, F-S., Compans, R.W., Kang, S.M., Prausnitz, M.R., Stability
Kinetics of Influenza Vaccine Coated onto Microneedles During Drying and Storage.
Pharmaceutical Research, 2011 (28),135–144.
[49] Hirschberg, H.J.H.B., van de Wijdeven, G.G.P., Kraan, H., Amorij, J-P., Kersten,
G.F.A., Bioneedles as alternative delivery system for hepatitis B vaccine. Journal of
Controlled Release, 2010 (147), 211–217.

References
108
[50] Kim, Y-C., Quan, F-S., Yoo, D-G., Compans, R.W., Kang, S-M., Prausnitz, M.R.,
Improved influenza vaccination in the skin using vaccine coated microneedles.
Vaccine, 2009 (27), 6932–6938.
[51] Quan, F-S., Kim, Y-C., Compans, R.W., Prausnitz, M.R., Kang, S-M., Dose sparing
enabled by skin immunization with influenza virus-like particle vaccine using
microneedles. Journal of Controlled Release, 2010 (147), 326–332.
[52] Daddona, P.E., Matriano, J.A., Mandema, J., Maa, Y-F., Parathyroid Hormone (1-
34)-Coated Microneedle Patch System: Clinical Pharmacokinetics and
Pharmacodynamics for Treatment of Osteoporosis. Pharmaceutical Research, 2011
(28), 159–165.
[53] Jiang, J., Gill, H.S., Ghate, D., McCarey, B.E., Patel, S.R., Edelhauser, H.F., and
Prausnitz, M.R., Coated Microneedles for Drug Delivery to the Eye. Investigative
Ophthalmology & Visual Science, 2007 (48), 4038-4043.
[54] Preetha, J.P., Karthika, K., Cosmeceuticals-an evolutionInternational. Journal of
ChemTech Research, 2009 (1), 1217-1223.
[55] Mukerjee, E.V., Collins, S.D., Isseroff, R.R., Smith, R.L., Microneedle array for
transdermal biological fluid extraction and in situ analysis. Sensors and Actuators,
2004 (A114), 267–275.
[56] Chakraborty, S., Liao, I-C., Adler, A., Leong, K.W., Electrohydrodynamics: A
facile technique to fabricate drug delivery systems. Advanced Drug Delivery
Reviews, 2009 (61), 1043–1054.
[57] Coppola, S., Vespini, V., Grilli, S., Ferraro, P., Self-assembling of multi-jets by
pyro-electrohydrodynamic effect for high throughput liquid nanodrops transfer.
Lab on a Chip, 2011, 11, 3294-3298.

References
109
[58] Grilli, S., Miccio, L., Vespini, V., Finizio, A., De Nicola, S., Ferraro, P., Liquid
micro-lens array activated by selective electrowetting on lithium niobate
substrates. Optics Express, 2008 (16), 8084-8093.
[59] Klose, D., Siepmann, F., Willart, J.F., Descamps, M., Siepmann, J., Drug release
from PLGA-based microparticles: Effects of the “microparticle:bulk fluid” ratio.
International Journal of Pharmaceutics, 2010 (383), 123–131.
[60] Versypt, A.N.F., Pack, D.W., Braatz, R.D., Mathematical Modeling of Drug
Delivery from Autocatalytically Degradable PLGA Microspheres—A Review.
Journal of Control Release, 2013 (165), 29–37.
[61] Fischer-Cripps, A.C., Nanoindentation. Springer 2002.
[62] Lu, L., Peter, S.J., Lyman, M.D., Lai, H-L., Leite, S.M., Tamada, J.A., Uyama, S.,
Vacanti, J.P., Langer, R., Mikos, A.G., In vitro and in vivo degradation of porous
poly(DL-lactic-co-glycolic acid) foams. Biomaterials, 2000 (21), 1837-1845.

Acknowledgements
110
Acknowledgements
My PhD journey was magnificent as well as demanding and stressful, and I
would not be able to finish it without the help of many people. Here is a small tribute
to all them.
I would like to thank my tutor prof. Paolo Antonio Netti, for introducing me in
microneedle’s world. I am very proud to have had the opportunity to work in his
group. I am very grateful to my supervisor Ing. Raffaele Vecchione, for his patience,
motivation and enthusiasm. His guidance helped me all the time duting research and
writing of this thesis.
Moreover, I would like Pietro Ferraro and Sara Coppola, working at CNR-INO, for
having made available the instrumentation for microneedle’s electro-drawing. I would
also like to thank prof. Peter Dubreil from Ghent University and dr. Antonelli Carmela
of ASL Napoli 2 Nord to have readily supplied the materials needed for my work.
Then, I would like to thank Fabio Formiggini, which helped me to solve all my
problems with microscopy analyses, and all my lab-mates that have made unique this
period.
At last but not least I would like to thank very much my family and my love, for their
encouragement and support, and for putting up with me even in the hardest times.
Thanks to all!