electrification - department of electrical engineering...
TRANSCRIPT
1/14/2016
1
Power Electronics Circuits
Prof. Daniel Costinett
ECE 482 Lecture 1January 14, 2016
Transportation ElectrificationMotivation
• Improve efficiency: reduce energy consumption
• Displace petroleum as primary energy source
• Reduce impact on environment
• Reduce cost
US Energy Information Administration:
• Transportation accounts for 28% of total U.S. energy use
• Transportation accounts for 33% of CO2 emissions
• Petroleum comprises 90% of US transportation energy use
1/14/2016
2
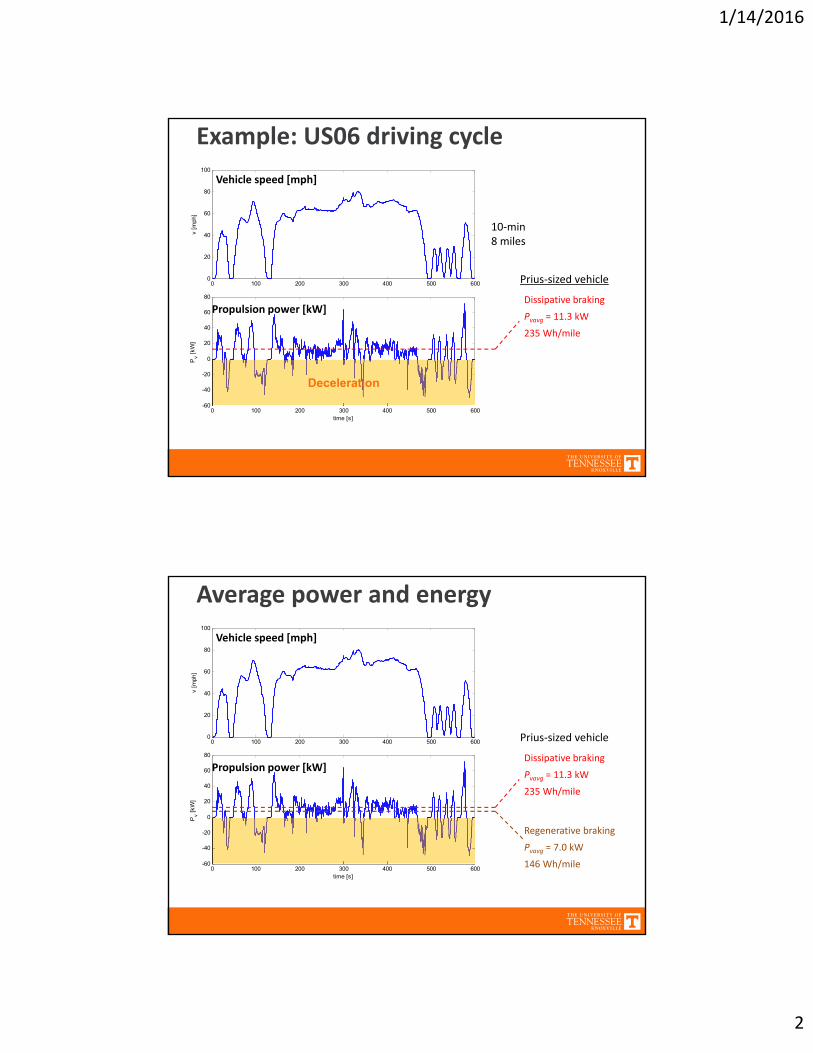
Example: US06 driving cycle
10‐min8 miles
Prius‐sized vehicle
Dissipative braking
Pvavg = 11.3 kW
235 Wh/mile
0 100 200 300 400 500 600-60
-40
-20
0
20
40
60
80
Pv [
kW]
time [s]
0 100 200 300 400 500 6000
20
40
60
80
100
v [m
ph]
Vehicle speed [mph]
Propulsion power [kW]
Deceleration
Average power and energy
0 100 200 300 400 500 600-60
-40
-20
0
20
40
60
80
Pv [
kW]
time [s]
Prius‐sized vehicle
Dissipative braking
Pvavg = 11.3 kW
235 Wh/mile
Regenerative braking
Pvavg = 7.0 kW
146 Wh/mile
0 100 200 300 400 500 6000
20
40
60
80
100
v [m
ph]
Vehicle speed [mph]
Propulsion power [kW]
1/14/2016
3
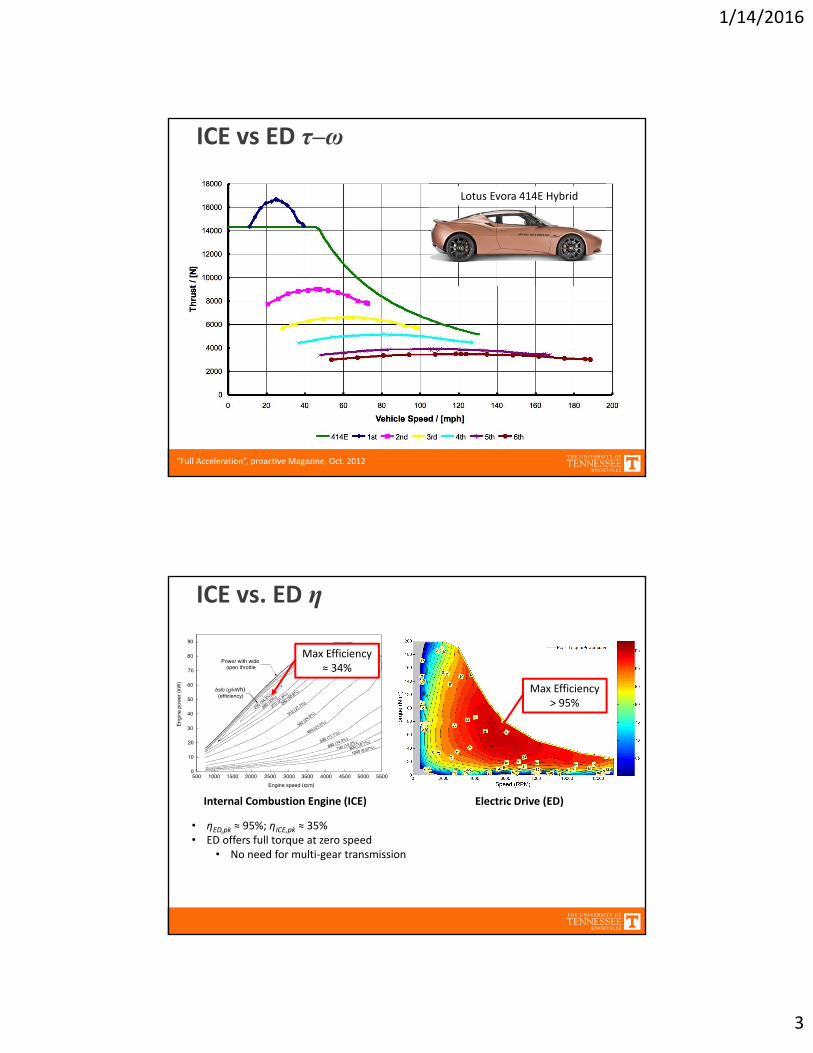
ICE vs ED τ‒ω
Lotus Evora 414E Hybrid
“Full Acceleration”, proactive Magazine, Oct. 2012
ICE vs. ED η
Internal Combustion Engine (ICE) Electric Drive (ED)
• ηED,pk ≈ 95%; ηICE,pk ≈ 35%• ED offers full torque at zero speed
• No need for multi‐gear transmission
Max Efficiency ≈ 34%
Max Efficiency > 95%
1/14/2016
4
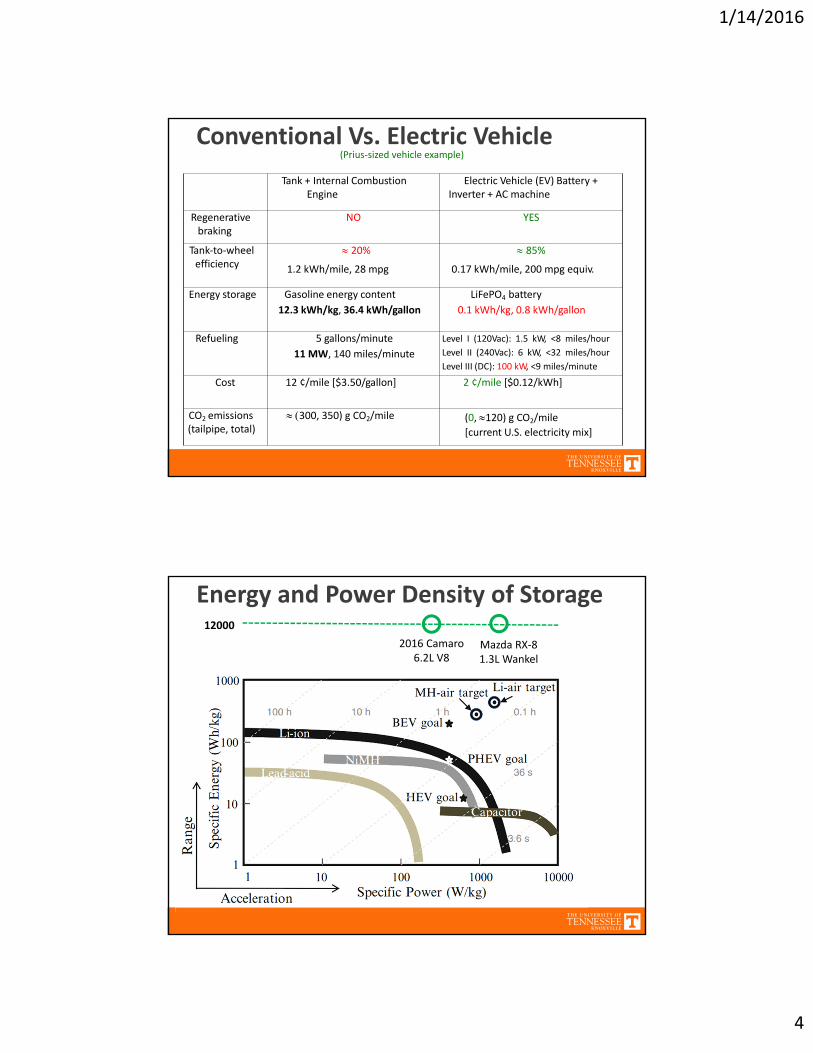
Conventional Vs. Electric Vehicle
Tank + Internal Combustion Engine
Electric Vehicle (EV) Battery + Inverter + AC machine
Regenerative braking
NO YES
Tank‐to‐wheel efficiency
20%
1.2 kWh/mile, 28 mpg
85%
0.17 kWh/mile, 200 mpg equiv.
Energy storage Gasoline energy content
12.3 kWh/kg, 36.4 kWh/gallon
LiFePO4 battery
0.1 kWh/kg, 0.8 kWh/gallon
Refueling 5 gallons/minute
11 MW, 140 miles/minute
Level I (120Vac): 1.5 kW, <8 miles/hour
Level II (240Vac): 6 kW, <32 miles/hour
Level III (DC): 100 kW, <9 miles/minute
Cost 12 ¢/mile [$3.50/gallon] 2 ¢/mile [$0.12/kWh]
CO2 emissions (tailpipe, total)
300, 350) g CO2/mile (0, 120) g CO2/mile
[current U.S. electricity mix]
(Prius‐sized vehicle example)
Energy and Power Density of Storage12000
2016 Camaro 6.2L V8
Mazda RX‐81.3L Wankel
1/14/2016
5
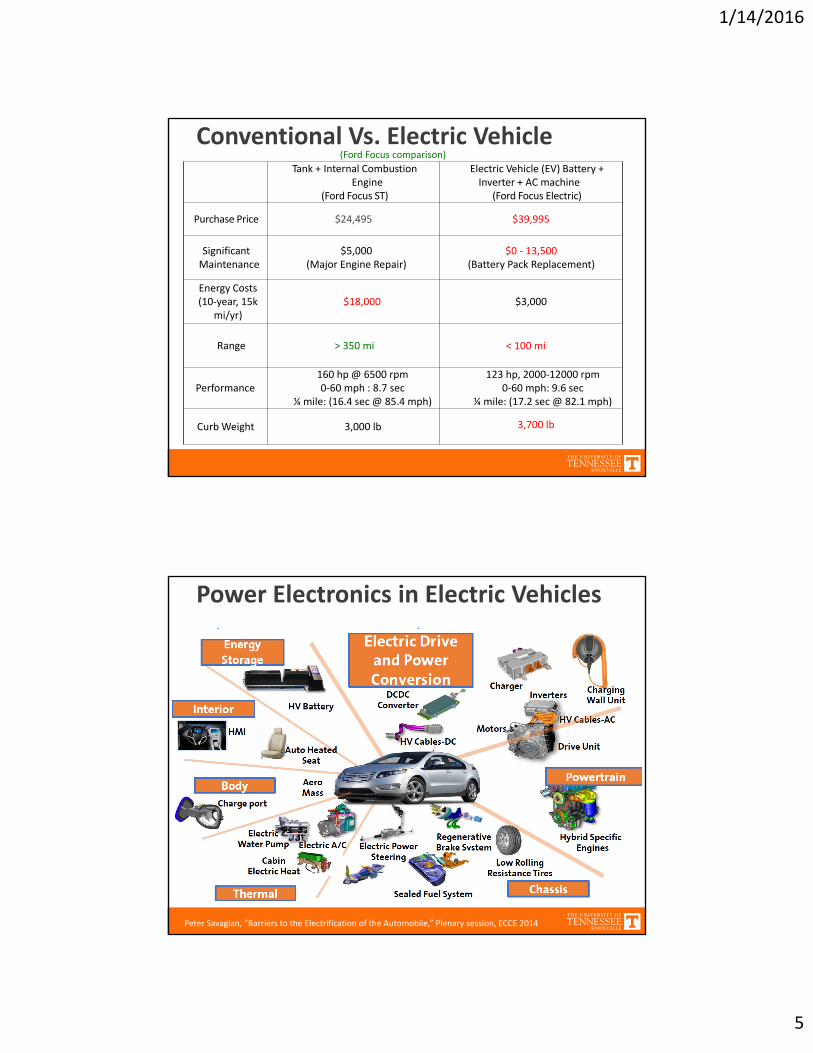
Conventional Vs. Electric VehicleTank + Internal Combustion
Engine(Ford Focus ST)
Electric Vehicle (EV) Battery + Inverter + AC machine
(Ford Focus Electric)
Purchase Price $24,495 $39,995
Significant Maintenance
$5,000(Major Engine Repair)
$0 ‐ 13,500(Battery Pack Replacement)
Energy Costs (10‐year, 15k
mi/yr)$18,000 $3,000
Range > 350 mi < 100 mi
Performance160 hp @ 6500 rpm0‐60 mph : 8.7 sec
¼ mile: (16.4 sec @ 85.4 mph)
123 hp, 2000‐12000 rpm0‐60 mph: 9.6 sec
¼ mile: (17.2 sec @ 82.1 mph)
Curb Weight 3,000 lb 3,700 lb
(Ford Focus comparison)
Power Electronics in Electric Vehicles
Peter Savagian, “Barriers to the Electrification of the Automobile,” Plenary session, ECCE 2014
1/14/2016
6
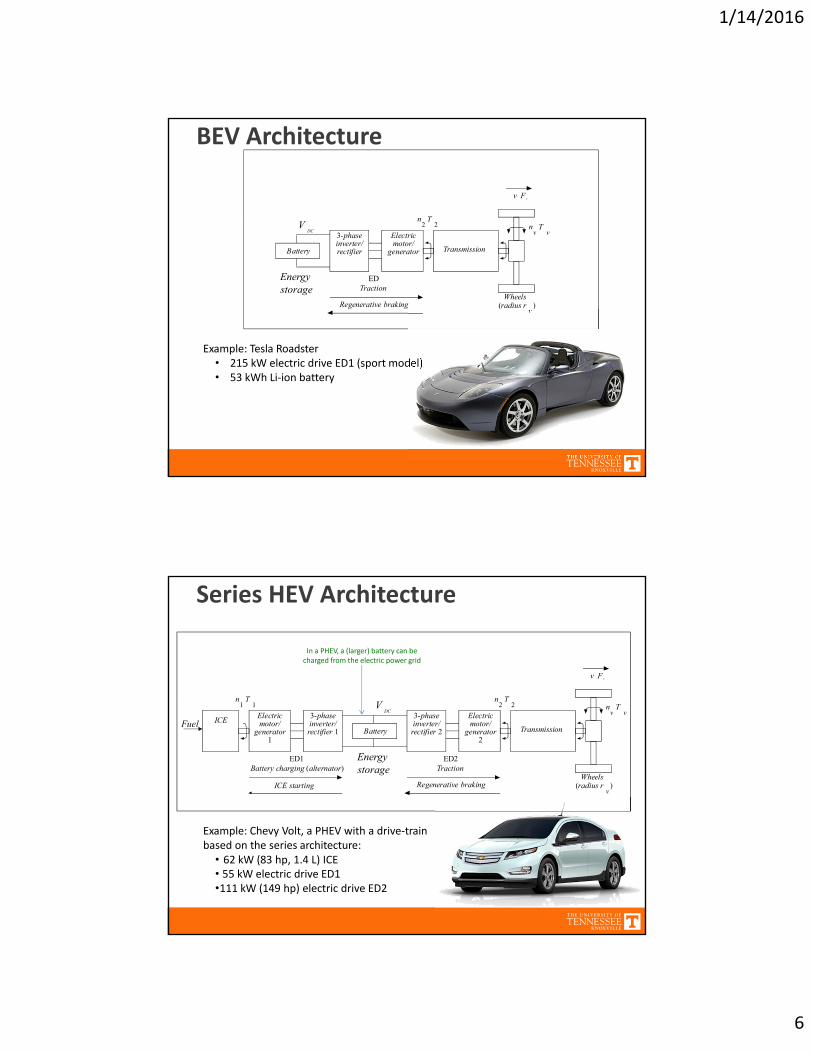
BEV Architecture
n T
v F v
Battery
3-phase inverter/ rectifier
Electric motor/
generator Transmission
EDTraction
Wheels(radius r )
v
VDC
Regenerative braking
2 2 n Tv v
Energy storage
Example: Tesla Roadster• 215 kW electric drive ED1 (sport model)• 53 kWh Li‐ion battery
Series HEV Architecture
n Tn T
v F v
In a PHEV, a (larger) battery can becharged from the electric power grid
ICE3-phase inverter/ rectifier 1
Electric motor/
generator 1
Battery
3-phase inverter/ rectifier 2
Electric motor/
generator 2
Transmission
ED2Traction
Wheels(radius r )
v
VDC
ED1Battery charging (alternator)
ICE starting Regenerative braking
2 2 n Tv v
1 1
Energy storage
Fuel
Example: Chevy Volt, a PHEV with a drive‐trainbased on the series architecture:
• 62 kW (83 hp, 1.4 L) ICE• 55 kW electric drive ED1•111 kW (149 hp) electric drive ED2
1/14/2016
7
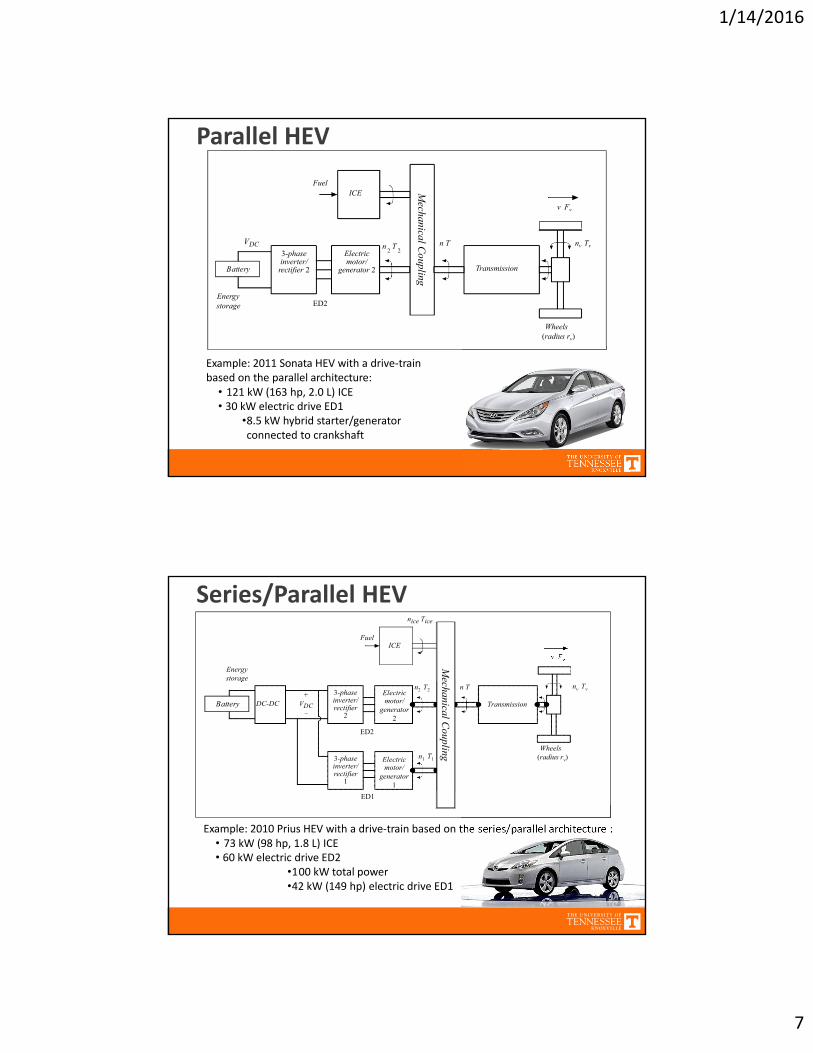
Parallel HEV
ICEFuel
v Fv
3-phase inverter/ rectifier 2
Electric motor/
generator 2 Transmission
ED2Energy storage
Wheels(radius rv)
VDC n T2 2
nv Tvn T
Mechanical C
oupling
Battery
Example: 2011 Sonata HEV with a drive‐trainbased on the parallel architecture:
• 121 kW (163 hp, 2.0 L) ICE• 30 kW electric drive ED1
•8.5 kW hybrid starter/generator connected to crankshaft
Series/Parallel HEV
ICE
Energystorage
Fuel
nice Tice
v Fv
3-phaseinverter/ rectifier
2
Transmission
ED2
Wheels(radius rv)
VDC
n2 T2
3-phaseinverter/ rectifier
1
n1 T1Electricmotor/
generator 1
DC-DC+
_
n T nv TvElectricmotor/
generator 2
Mechanical C
oupling
Battery
ED1
Example: 2010 Prius HEV with a drive‐train based on the series/parallel architecture :• 73 kW (98 hp, 1.8 L) ICE• 60 kW electric drive ED2
•100 kW total power•42 kW (149 hp) electric drive ED1
1/14/2016
8
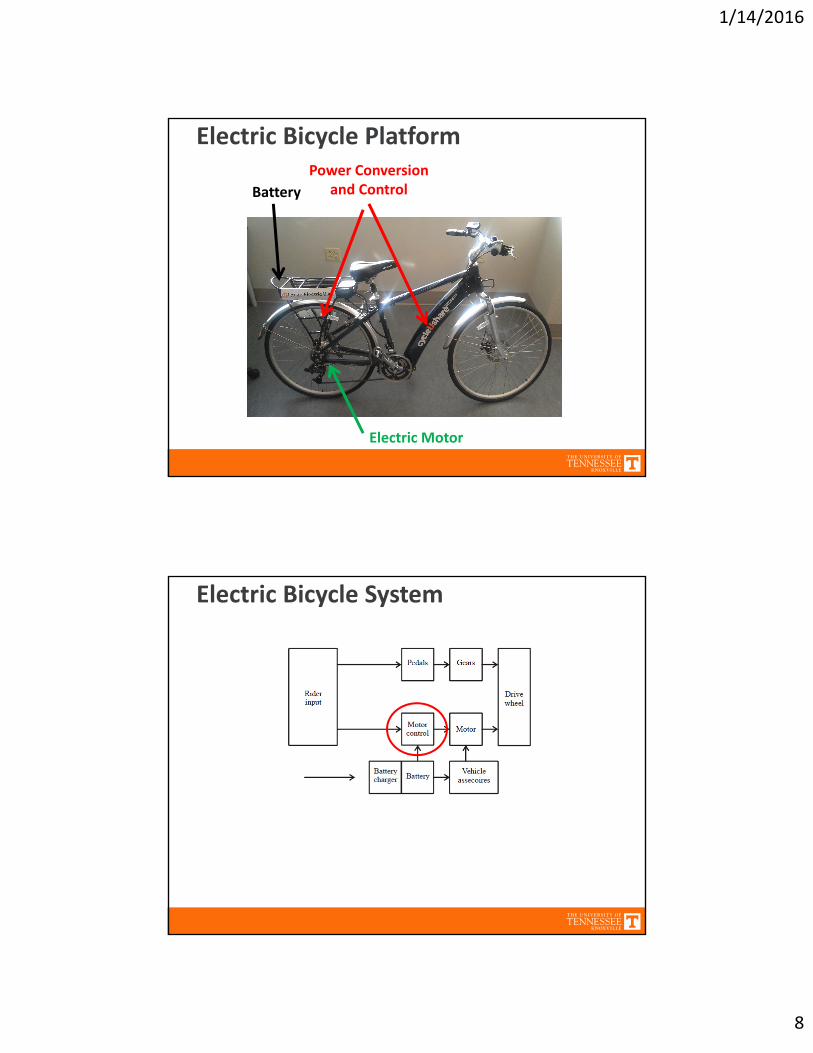
Electric Bicycle Platform
Battery
Power Conversion and Control
Electric Motor
Electric Bicycle System
1/14/2016
9
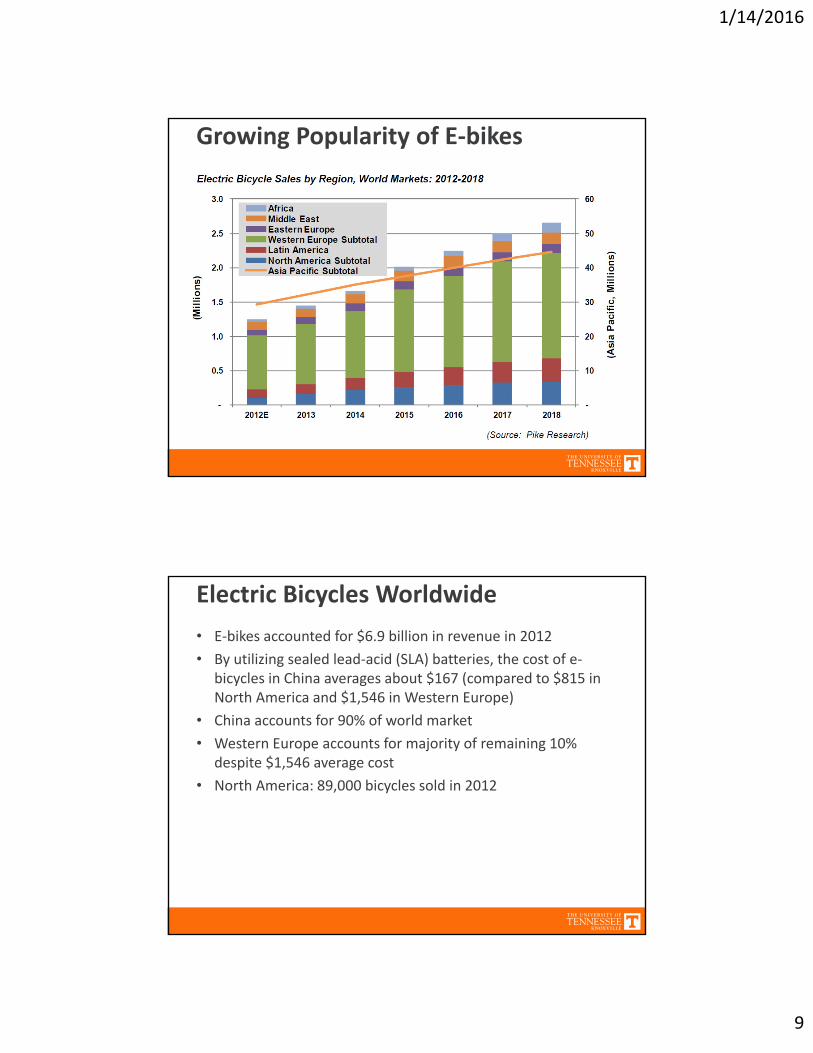
Growing Popularity of E‐bikes
Electric Bicycles Worldwide
• E‐bikes accounted for $6.9 billion in revenue in 2012
• By utilizing sealed lead‐acid (SLA) batteries, the cost of e‐bicycles in China averages about $167 (compared to $815 in North America and $1,546 in Western Europe)
• China accounts for 90% of world market
• Western Europe accounts for majority of remaining 10% despite $1,546 average cost
• North America: 89,000 bicycles sold in 2012
1/14/2016
10
Course Details
Course Introduction
• Hands‐on course in design and implementation of power converters
• Course website: http://web.eecs.utk.edu/~dcostine/ECE482
• Course uses electric bicycle platform as framework for the investigation of practical issues in SMPS construction
• Unlike ECE 481, this is not a theory‐focused course; expect to spend most of your effort on construction/debugging
• Goal of course is practical experience in designing, building, testing, and debugging power electronics
• System, components, architectures can be modified based on student initiative
• Course is difficult; will require design effort and significant hands‐on time outside of class. Expect to experience circuit failures.
• Prerequisites: undergraduate circuits sequence, Microelectronics, ECE 481 – Power Electronics

1/14/2016
11
Contact Information
• Instructor: Daniel Costinett
• Office: MK502
• OH during canceled lectures, in‐lab, individually scheduled
• E‐mail: [email protected]
• Email questions will be answered within 24 hours (excluding weekends)
• Please use [ECE 482] in the subject line
Course Structure
• Scheduled for one lecture and one 3‐hr lab session per week
− Lectures as needed; many weeks will have two lab sessions
− Check course website often for schedule
• Theory is presented as necessary for practical design
• Additional theory may be presented in brief sessions during lab time
• Plan to spend 9‐12 hours per week on course; mostly lab time
1/14/2016
12
Textbook and materials
• Portions of the Textbook R.Erickson, D.Maksimovic, Fundamentals of Power Electronics, Springer 2001
will be used. The textbook is available on‐line from campus network
• MATLAB/Simulink, LTSpice, Altium Designer, Xilinx ISE will be used; All installed in MK227 and in the Tesla Lab
• Lecture slides and notes, additional course materials, prelabs, experiments, etc. posted on the course website
• Lab kit is required (purchased from circuits store) in ~1‐2 weeks− Price: $100‐150 per group
− Additional resistors and capacitors, etc. purchased as needed
− Need to buy any replacement parts
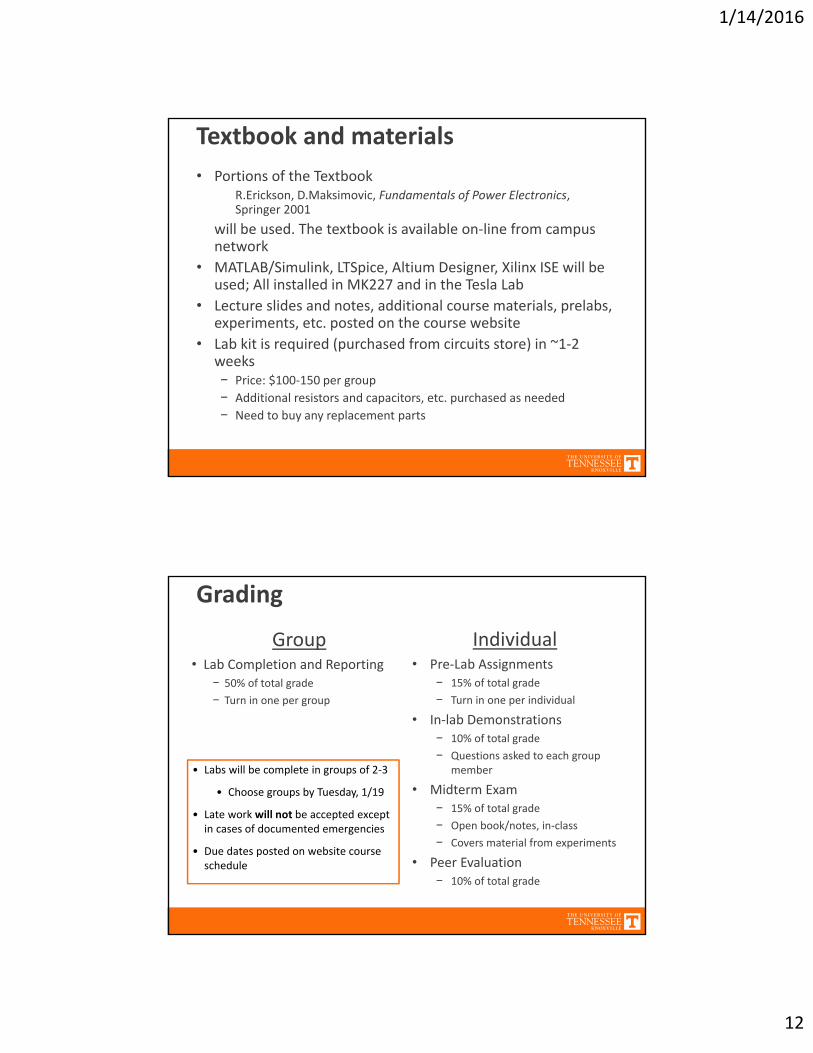
Grading
Group• Lab Completion and Reporting
− 50% of total grade
− Turn in one per group
Individual• Pre‐Lab Assignments
− 15% of total grade
− Turn in one per individual
• In‐lab Demonstrations− 10% of total grade
− Questions asked to each group member
• Midterm Exam− 15% of total grade
− Open book/notes, in‐class
− Covers material from experiments
• Peer Evaluation− 10% of total grade
• Labs will be complete in groups of 2‐3
• Choose groups by Tuesday, 1/19
• Late work will not be accepted except in cases of documented emergencies
• Due dates posted on website course schedule
1/14/2016
13
Use of Lab Time
• Attendance is required during all lectures and scheduled lab time − Make use of designated time with Instructor present
− Informal Q&A and end‐of‐experiment demonstrations
• Work efficiently but do not work independently − Understand all aspects of design
• Outside of normal lab hours, key access will be granted (one per group)
Topics Covered
• Course Topics− Battery Modeling
− Modeling and Characterization of AC Machines
− DC/DC Converter Analysis and Design
− Loss Modeling of Power Electronics
− Basic Magnetics and Transformers
− Feedback Loop Design
− Layout of Power Electronics Circuits
− Electric Motor Drivers
− BLDC and PMSM Control Methods
− System‐Level Control Design
1/14/2016
14
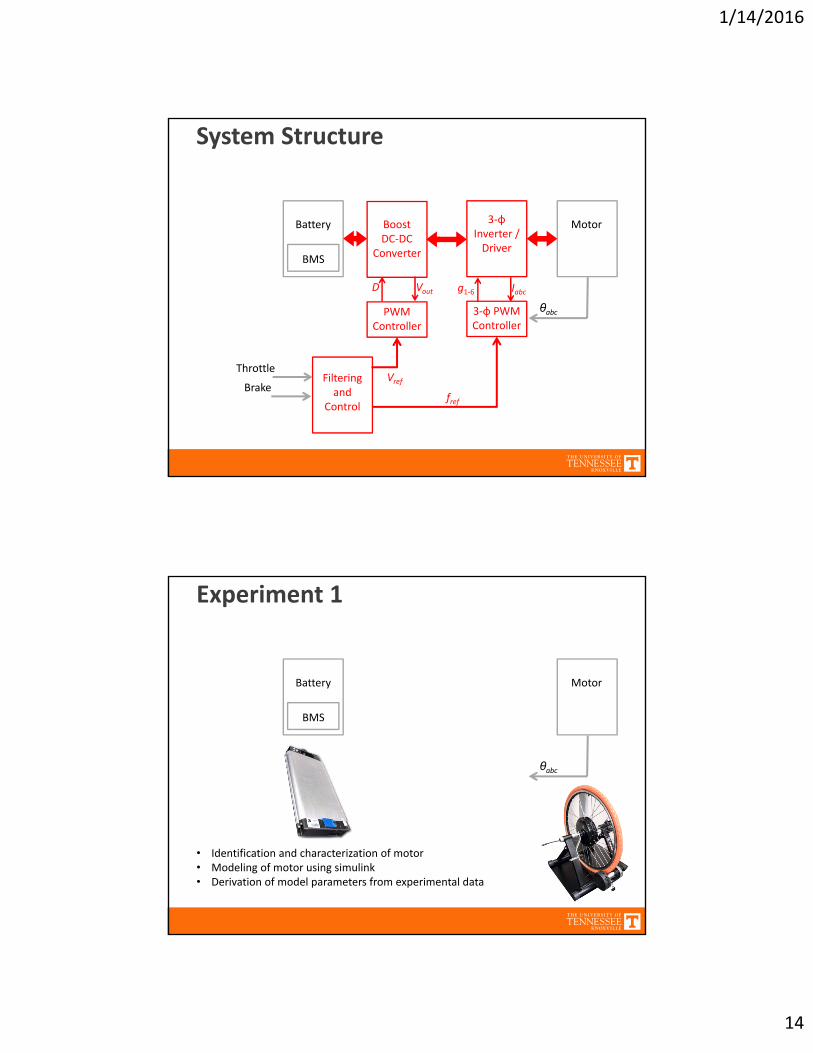
System Structure
ThrottleFilteringand
Control
Boost DC‐DC
Converter
3‐φInverter / Driver
Battery Motor
Vref
fref
PWM Controller
D Vout g1‐6 Iabc
3‐φ PWM Controller
Brake
θabc
BMS
Experiment 1
Battery Motor
θabc
• Identification and characterization of motor• Modeling of motor using simulink• Derivation of model parameters from experimental data
BMS
1/14/2016
15
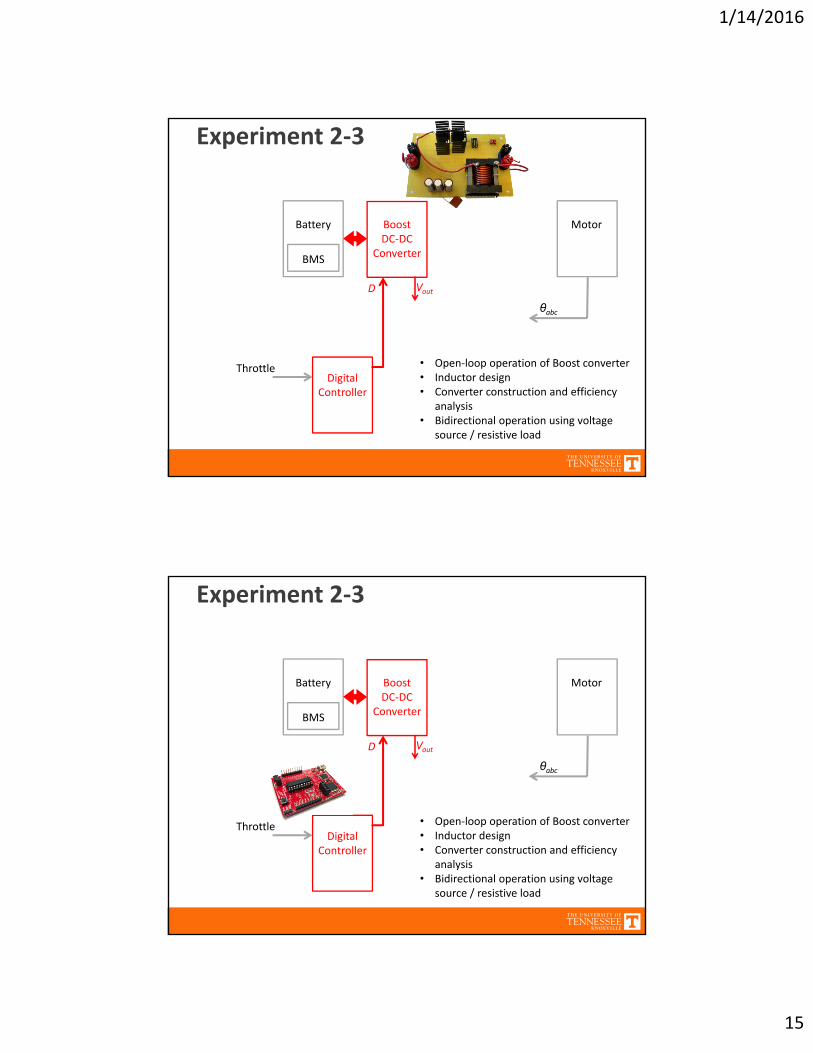
Experiment 2‐3
• Open‐loop operation of Boost converter• Inductor design• Converter construction and efficiency
analysis• Bidirectional operation using voltage
source / resistive load
ThrottleDigital
Controller
Boost DC‐DC
Converter
Battery
Vout
BMS
D
Motor
θabc
Experiment 2‐3
• Open‐loop operation of Boost converter• Inductor design• Converter construction and efficiency
analysis• Bidirectional operation using voltage
source / resistive load
ThrottleDigital
Controller
Boost DC‐DC
Converter
Battery
Vout
BMS
D
Motor
θabc
1/14/2016
16
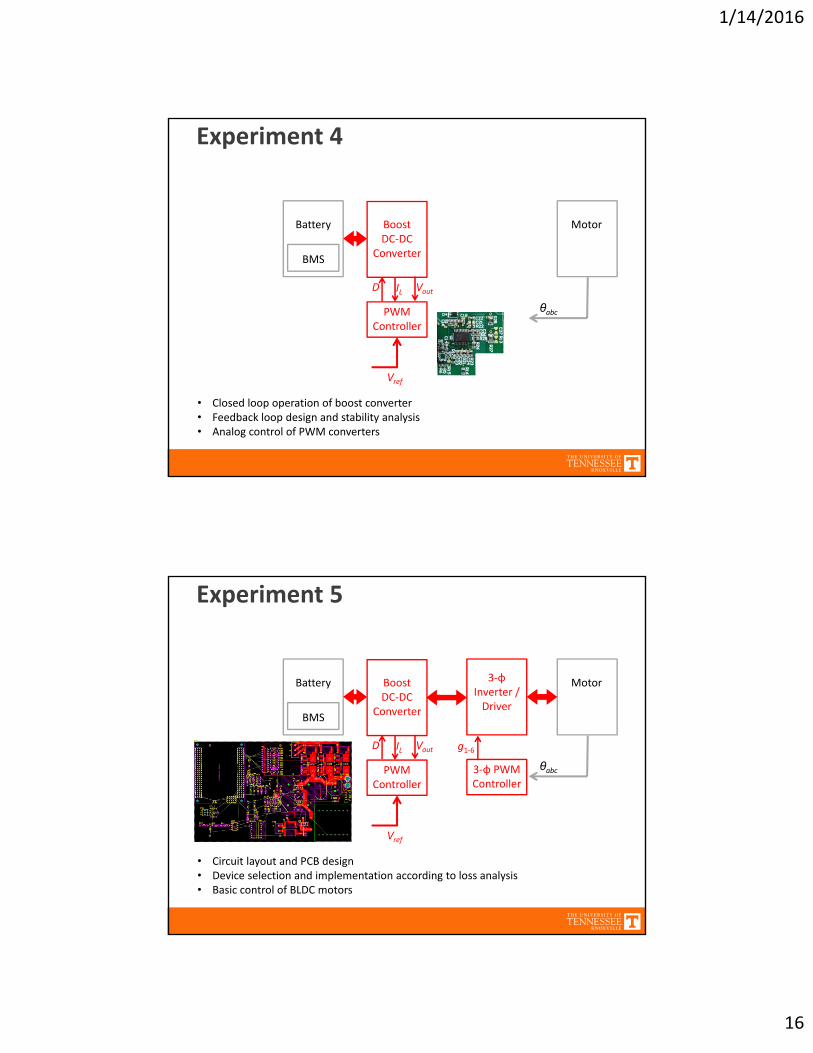
Experiment 4
Boost DC‐DC
Converter
Battery Motor
Vref
PWM Controller
D Vout
θabc
• Closed loop operation of boost converter• Feedback loop design and stability analysis• Analog control of PWM converters
BMS
IL
Experiment 5
Boost DC‐DC
Converter
3‐φInverter / Driver
Battery Motor
Vref
PWM Controller
D Vout g1‐6
3‐φ PWM Controller
θabc
• Circuit layout and PCB design• Device selection and implementation according to loss analysis• Basic control of BLDC motors
BMS
IL
1/14/2016
17
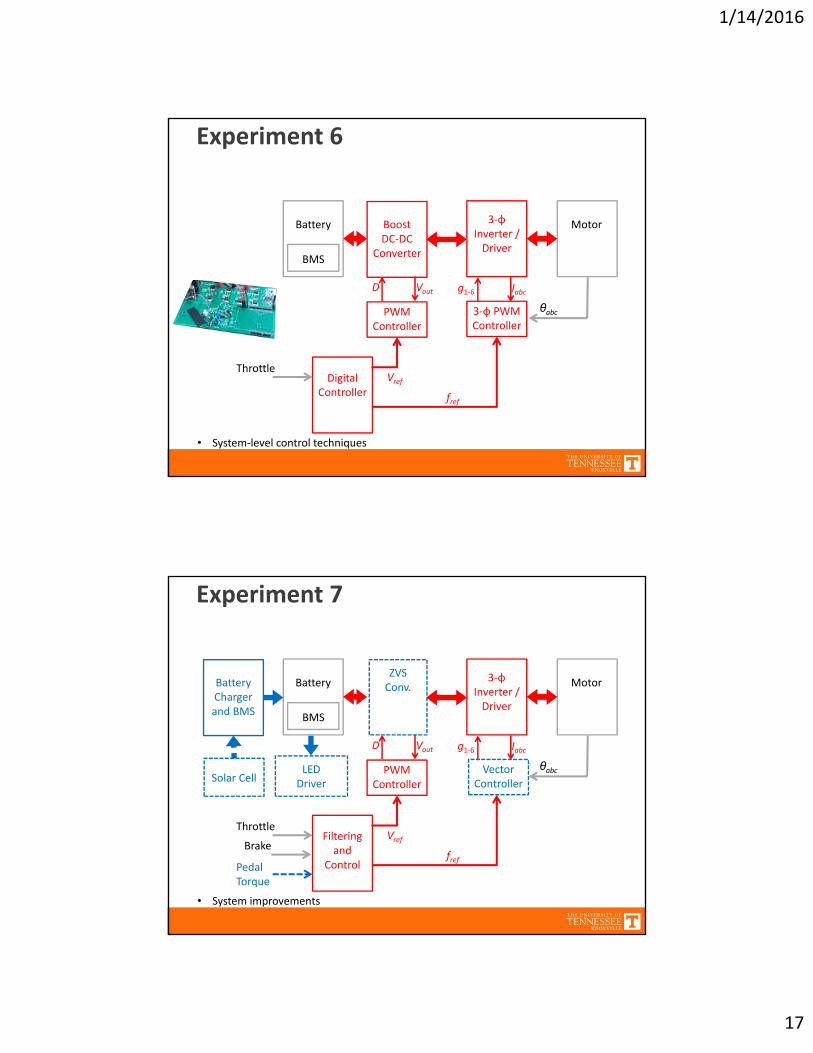
Experiment 6
ThrottleDigital
Controller
Boost DC‐DC
Converter
3‐φInverter / Driver
Battery Motor
Vref
fref
PWM Controller
D Vout g1‐6 Iabc
3‐φ PWM Controller
θabc
• System‐level control techniques
BMS
Experiment 7
Throttle
PedalTorque
Filteringand
Control
3‐φInverter / Driver
Battery Motor
Vref
fref
PWM Controller
D Vout g1‐6 Iabc
Solar Cell
Battery Charger and BMS
Brake
θabcLED Driver
ZVSConv.
Vector Controller
• System improvements
BMS
1/14/2016
18
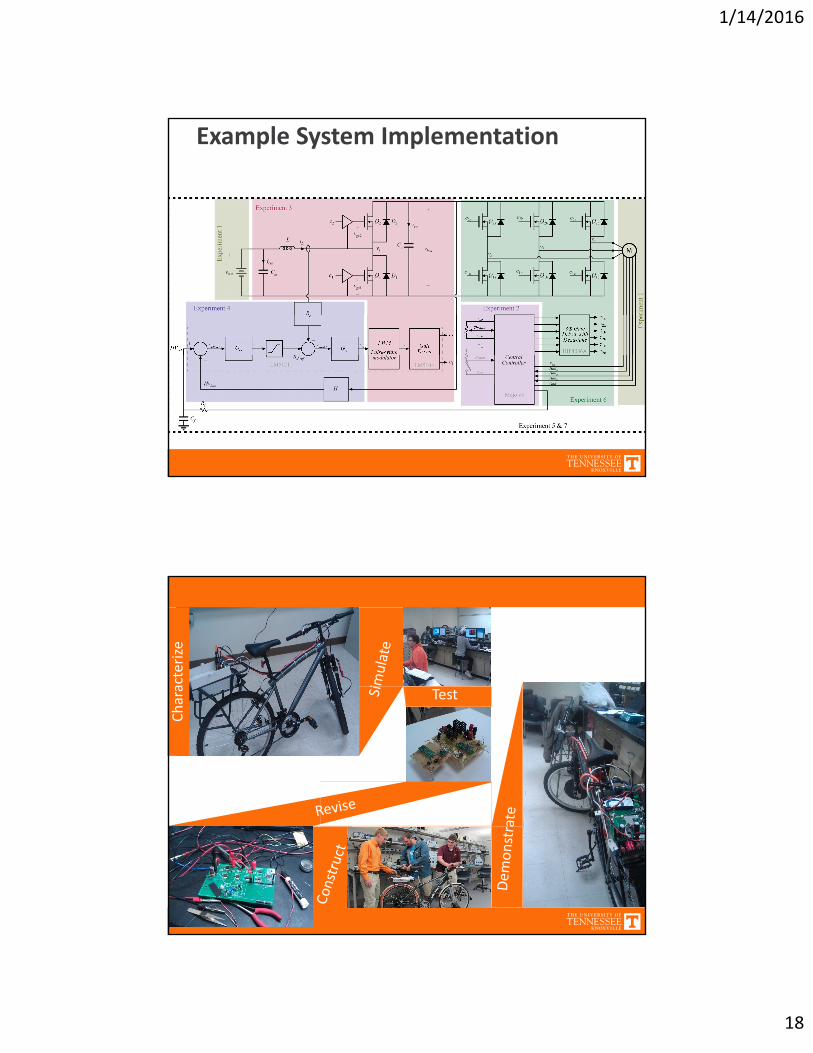
Example System Implementation
Characterize
Test
1/14/2016
19
Design Expo
• No final exam
• Demo operational electric bicycles
• Competition to determine the most efficient and robust system
Electric Bicycle Safety and Law
• Traffic Law:
• Electric motor with power output not more than1000 W
• Not capable of propelling or assisting at greaterthan 20 mph
• No helmet laws for riders over age 16; you may request one at any time
• Read Tennessee bicycle safety laws on website
1/14/2016
20
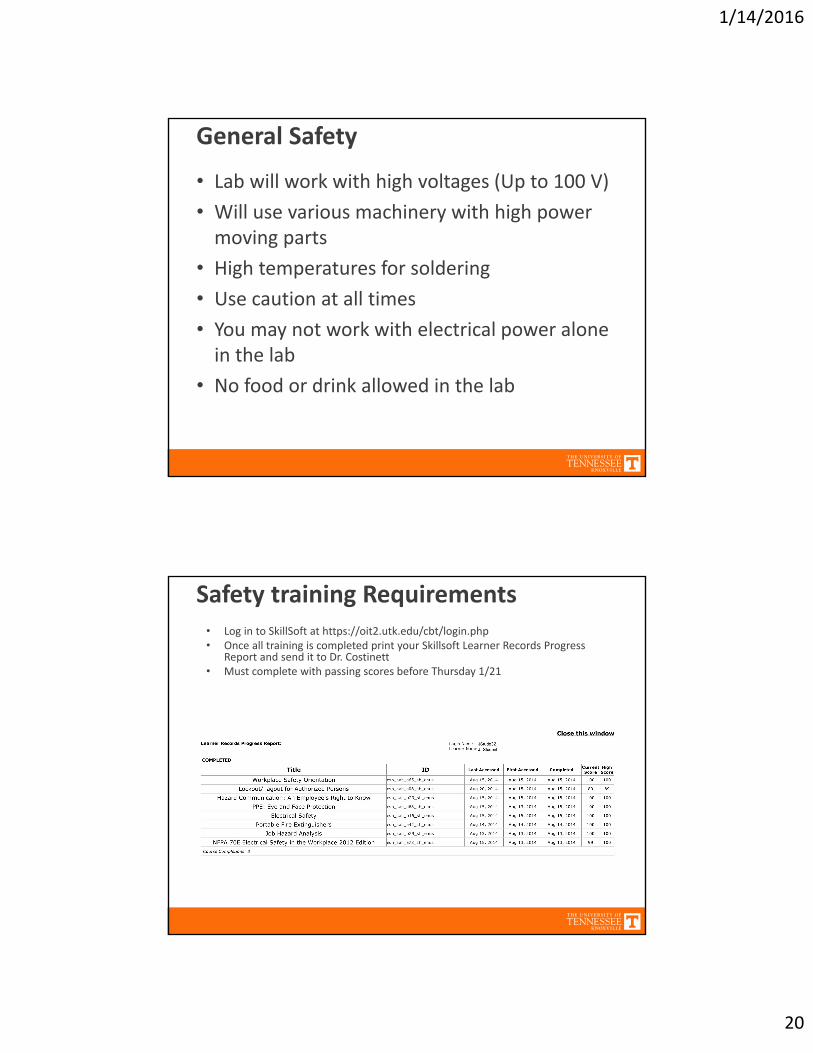
General Safety
• Lab will work with high voltages (Up to 100 V)
• Will use various machinery with high power moving parts
• High temperatures for soldering
• Use caution at all times
• You may not work with electrical power alone in the lab
• No food or drink allowed in the lab
Safety training Requirements• Log in to SkillSoft at https://oit2.utk.edu/cbt/login.php• Once all training is completed print your Skillsoft Learner Records Progress
Report and send it to Dr. Costinett• Must complete with passing scores before Thursday 1/21