electrically heated tube investigation of cooling channel
TRANSCRIPT
a
NASA Technical Memorandum 106985
AIAA-95-2500i ¢, J /
i
Electrically Heated Tube Investigation ofCooling Channel Geometry Effects
Michael L. MeyerLewis Research Center
Cleveland, Ohio
Prepared for the
31st Joint Propulsion Conference and Exhibit
cosponsored by AIAA, ASME, SAE, and ASEE
San Diego, California, July 10-12, 1995
NationalAeronauticsandSpaceAdministration
u_c_0
Iu_o_Z
..J,_lu_
U,,-,., Z
-.,_0
,_,, k,,IJ
30 z
,.DOuJ
¢.,'I, I,,,,-
Zu,.J
rg
UC
_L
,,l-
p-
_,LI A
LL _.LL
E
LJ
UC3 _..
rO
u.JZZ' ¢
•"r ._
_,1
Z
.._1 {'3
C3 Z
u_
0o
o


Electrically Heated Tube Investigation of Cooling Channel Geometry Effects
Michael L. Meyer*NASA Lewis Research Center
21000 Brookpark RoadCleveland, Ohio 44135
Abstract
The results of an experimentalinvestigation on the combined effects ofcooling channel aspect ratio and curvature forrocket engines are presented. Symmetricallyheated tubes with average heat fluxes up to 1.7MW/m2 were used. The coolant was gaseousnitrogen at an inlet temperature of 280 K (500°R) and inlet pressures up to 1.0xl07 N/m 2 (1500
psia). Two different tube geometries weretested: a straight, circular cross-section tube,and an aspect-ratio 10 cross-section tube with a45 ° bend. The circular tube results are
compared to classical models from theliterature as validation of the system. Thecurvature effect data from the curved aspect-ratio 10 tube compare favorably to the empirical
equations available in the literature for lowaspect ratio tubes. This latter result suggeststhat thermal stratification of the coolant due todiminished curvature effect mixing may notbe an issue for high aspect-ratio coolingchannels.
I.ntrvduction
The cooling passages of regenerativelycooled rocket engines have traditionally beendesigned with low height-to-widthdimensional aspect ratio. Recent experimentshave suggested that improved thrust chamberliner cooling could be achieved by using highaspect ratio (AR>4) passages.1 But, becauseonly limited data were obtained in theseexperiments, further parametric studies wererequired to fully understand the potentialbenefits.
The primary issue that remained fromthe previous work revolved around the
curvature heat transfer enhancement. Thisenhancement provides additional cooling inthe thrust chamber throat region, where thechamber liner receives the highest hot-gas sideheat loads. The enhancement occurs because,as the coolant curves through the throat, a pairof secondary flow vortices develop which not
only mix the coolant but also force cooler fluidto the hot wall. Since the previous experimentswere performed with straight passages, thecurvature effect was not investigated.Concerns have been raised that the tall thin
passages might break down the vortex pair andreduce the curvature enhancement. A
numerical investigation predicted that, if thesecondary flow mixing were reduced, thecoolant would become thermally stratified, and
the hot-gas wall temperatures would besignificantly higher.2
The issue was resolved in part by a flowvisualization study of the secondary flowdevelopment in a curving high aspect ratio (AR= 5) channel.3 The study showed qualitativelythat the secondary vortex pair developed. But
because the study was limited to low turbulentReynold's numbers and the strength of thesecondary flow was not quantified, the resultswere not conclusive.
In the current effort, a resistivelyheated tube experiment was initiated to obtainthe detailed data necessary to model thecurvature enhancement in high aspect ratio
cooling passages. The coolant was gaseousnitrogen. Since the existing gas correlationsare well founded for straight smooth-walledtubes, the investigation could be constrained tostudying only the test section geometry effects.This report presents the results from testswhich include validation of the experimental
*Member AIAA
Copyright © by the American Institute of Aeronautics and Astronautics, Inc. No copyright isasserted in the United States under Title 17, U.S. Code. The U.S. Government has a royalty-
free license to exercise all rights under the copy right claimed herein for Governmental
Purposes. All other rights are reserved by the copyright owner.
1
facility with a circular test section and limiteddata from tests using a curved high aspect ratio(AR = 10) test section. The results from the
circular test section are compared to theexisting models for straight, smooth-walledtubes, and the curvature effects observed in thehigh aspect ratio test section are compared to thecurvature factors offered in the literature.
Theory
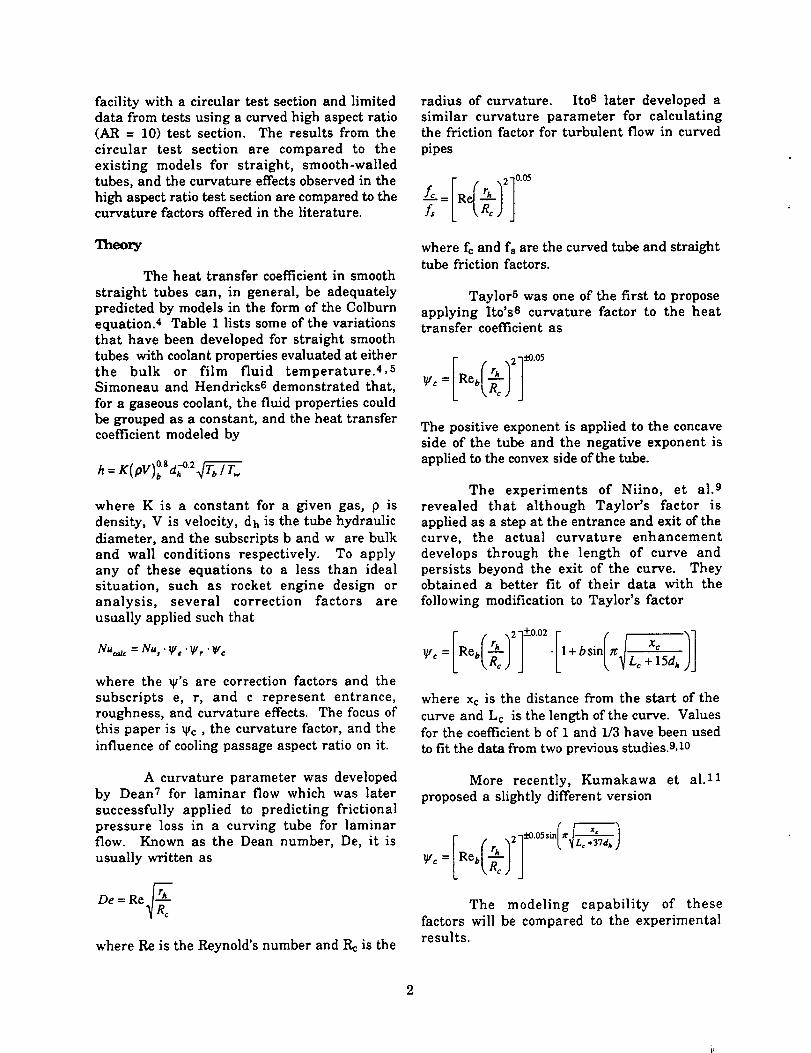
The heat transfer coefficient in smooth
straight tubes can, in general, be adequatelypredicted by models in the form of the Colburnequation.4 Table 1 lists some of the variationsthat have been developed for straight smoothtubes with coolant properties evaluated at eitherthe bulk or film fluid temperature.4, 5Simoneau and Hendricks6 demonstrated that,
for a gaseous coolant, the fluid properties couldbe grouped as a constant, and the heat transfercoefficient modeled by
08 -O2h= K(pV)b" dh " ._b/T,,
where K is a constant for a given gas, p isdensity, V is velocity, dh is the tube hydraulicdiameter, and the subscripts b and w are bulkand wall conditions respectively. To applyany of these equations to a less than idealsituation, such as rocket engine design oranalysis, several correction factors areusually applied such that
Nu,:,_ = Nu, •v/e • Ilt r "II/c
where the V's are correction factors and thesubscripts e, r, and c represent entrance,roughness, and curvature effects. The focus ofthis paper is V/c , the curvature factor, and theinfluence of cooling passage aspect ratio on it.
A curvature parameter was developedby Dean 7 for laminar flow which was latersuccessfully applied to predicting frictional
pressure loss in a curving tube for laminarflow. Known as the Dean number, De, it isusually written as
De = Re/-_-_/R_
where Re is the Reynold's number and Rc is the
radius of curvature. Ito s later developed asimilar curvature parameter for calculatingthe friction factor for turbulent flow in curved
pipes
where fc and fs are the curved tube and straighttube friction factors.
TaylorS was one of the first to proposeapplying Ito's8 curvature factor to the heattransfer coefficient as
r 2 _0.05
L CRo)j
The positive exponent is applied to the concaveside of the tube and the negative exponent isapplied to the convex side of the tube.
The experiments of Niino, et al. 9revealed that although Taylor's factor isapplied as a step at the entrance and exit of thecurve, the actual curvature enhancementdevelops through the length of curve andpersists beyond the exit of the curve. Theyobtained a better fit of their data with the
following modification to Taylor's factor
' 1]L tR=;J t Lo+ sa
where Xc is the distance from the start of the
curve and Lc is the length of the curve. Valuesfor the coefficient b of 1 and 1/3 have been used
to fit the data from two previous studies.9,1o
More recently, Kumakawa et al.Zl
proposed a slightly different version
r- 2 _i-0.05 sln(_l
v,: L t,R<) J
The modeling capability of thesefactors will be compared to the experimentalresults.

Apparatus and Operating Procedure
The flow system is shownschematically in figure 1. A vacuum jacketedrun tank is located partially below the floor,and the coolant flows vertically through thesystem. The tank's vacuum jacket allows forliquid nitrogen to be used as a coolant, but wasnot necessary for these tests because onlygaseous nitrogen was used. The flow rate isredundantly measured by two venturies placedin series in the run tank dip tube, and bulkcoolant conditions are obtained in mixing
chambers immediately before and after the testsection. The test section and mixing chambersare contained in a vacuum chamber to
minimize external heat transfer. Heating isaccomplished via the resistance of the tube withthe electrical power provided by a direct currentsupply.
Prior to a test, the run tank is charged tothe desired pressure. When the test is initiated,the flow rate and back-pressure are controlled
to set points by a programmable logic controlleroperating the respective valves. The powersupply is then increased to the desired heat rateand the test section temperatures are allowed tostabilize. Once the temperatures are steady, thedata are recorded, usually 10 cycles at 1 secondintervals. The power is then cut off, and thetube is allowed to cool before stopping the flow toprepare for the next test condition. Furtherdetails of the test rig and operating proceduresare described in reference 12.
Test Hardware
Figure 2 is a sketch of test section TS1and is representative of the instrumentation oftest section TS5. Table 2 provides thedimensional details of both test sections. Testsection TS1 had a circular cross-section andwas considered the checkout tube for validating
the rig and data analysis procedures. Copperelectrical busses were brazed to the tube for
power connection, and extensive thermocoupleand pressure tap instrumentation wereapplied. The thermocouples were spotwelded
directly onto the tube, so it was necessary totake care in aligning the junction such that the
test section voltage that is picked up by thethermocouple would be minimized. Adescription of the procedure used to correct this
test section voltage induced error is presentedin the analysis section.
Test section TS5 had a cross-sectional
aspect-ratio of 10 and a 45 ° curve in the plane ofthe larger dimension as depicted in figure 3.The curve radius to hydraulic radius ratio, Rc
/Rh, was 120, and the curve began 50 hydraulic
diameters downstream of the first copper bus.This insured that the flow was fully developedfrom both a thermal and velocity standpoint atthe entrance of the curve. Test section TS5 was
fabricated by machining a curved openchannel and electron beam welding the fourthside in place. One advantage of this techniqueover bending a straight tube is that the wallthickness is known, whereas it is not possible
to predict exactly where the wall material willflow during the bending process. The wallthickness is critical in this type of experimentbecause it determines the local resistance and,
hence, heat input to that portion of the tube, andultimately the surface temperature.
Analysis Procedure
An analysis was conducted to calculateexperimental convective heat transfercoefficients for the test sections from the
thermocouple data. The analysis began bycorrecting the experimentally measured tubesurface temperatures for errors due to the testsection voltage picked up by the thermocouples.An initial series of tests were conducted atidentical flow conditions but reversing the
polarity of the voltage applied to the test section.Direct comparison of the temperaturesindicated the extent of the error due to
misalignment of the junction and the resultingpotential picked up. Most of the thermocoupleshad negligible errors, but several requiredcorrection of the measured temperatures. Noeffort was made to measure the radiative orconductive losses from the thermocouple
junctions, but a cursory analysis predictedonly negligible losses.
The corrected surface temperatureswere then used to calculate inside wall
temperatures assuming one dimensionalconduction through the thickness of the wall.An iterative procedure that incorporates thevariation of the thermal conductivity andelectrical resistivity with temperature, similar
to that employedin reference13,wasusedtoobtain both inside wall temperaturesand thelocal heat generation rate. Although thevariation in heat generation rate along thelength of the tube was determinedfrom themeasurements,the heat generationrate wasassumed to be uniform through the wallthickness.Thebulk temperatureof thecoolantat eachstation wascalculatedfrom the localheat input and the fluid propertiesobtainedfrom the subroutine GASP.14A heatbalancebetween the electrical power input and thecoolant enthalpy gain was calculated as acheck,to ensurethat the heat lossesfrom thesystemwerenot significant. For most of thetests,therewaslessthan + 3% discrepancy, buta few tests had a difference as large as + 10%.It was believed the larger difference was due tothe exit mixer not reaching thermalequilibrium, because of its large thermalmass, and not the result of a heat loss. Once itwas determined that the heat balance was
acceptable, the local experimental heat transfercoefficient and bulk property experimentalNusselt numbers were calculated.
For test section TS5, the wall
temperatures around the perimeter of the testsection are not uniform, and the wall
thicknesses (0.127 cm) are equal to the tubewidth. Therefore, a comprehensive analysiswould incorporate three-dimensionalconduction in the walls. However, in the
present effort, the assumption of one-dimensional conduction was maintained.
The impact that this assumption will have canbe ascertained by considering the temperaturegradients between the walls. In the straightthermal entrance region, the shorter wallswere considerably hotter (on the order of 100 K)than the longer walls. Thus, heat will beconducted away from the shorter walls.However, the one-dimensional analysisassumes this conducted heat is convected to the
coolant, and will calculate convective heattransfer coefficients that are slightly high.But, because the focus of this effort is thecurvature effect, comparison of the curvedsection to the straight section should still bevalid.
Applying the assumption of one-dimensional conduction to the rectangular tube
also required special treatment for the heat
generated in the comers. This was handled byassuming that the heat generated in eachcorner was evenly distributed between the
adjacent walls, which resulted in highereffective heat generation rates for the shorterwalls, because the corner heat was distributedover a smaller area. This is in agreementwith the hotter surface temperatures measuredon the shorter walls. With these effective heat
generation rates, the experimental heattransfer coefficients and bulk property Nusseltnumbers couldbe calculatedforeach surfaceof
testsectionTS5.
Results and discussion
The objectives of these test were toverify the current test and analyticalprocedures and to compare the predicted heattransfer coefficient curvature enhancementmodels available in the literature to the
experimental enhancement in a high aspectratio cooling channel. Test section TS1, acircular cross section tube, was used for theformer and test section TS5, a curved,
rectangular cross-section tube of aspect-ratio10, was used for the latter. A D-Optimalexperimental test matrix was developed for thecontrolled experimental conditions: back-
pressure, flow rate, and applied voltage. ThisD-Optimal design provides the benefits andefficiency of a designed experiment, but can beapplied to an experiment where the designspace is constrained. 15 In this case, the highestpower input levels could not be operated with thelowest coolant flow rates without overheatingthe tube walls. The matrix also included
several repeated tests. The range of testoperating conditions for both test sections isshown in table 3.
A representative wall temperatureprofile for test section TS1 is plotted in figure 4.While the gradually increasing slope of thewall temperature in the central portion of thetube follows the increase in bulk temperature ofthe coolant, the drastic effects of the largecopper power busses and the flow's thermaldevelopment are clear near the ends of the 43cm heated section. The heat transfer
coefficients are also plotted in figure 4, and
although, as expected, the end effects arestrong, the behavior in the central portion of the
4
tubeis typical of a gas-cooled tube.
The raw data from twenty tests werereduced to obtain experimental Nusseltnumbers using bulk fluid properties. TheNusselt numbers were then compared to thosepredicted by Taylor's model in figure 5.Although the model included an entrancefactor, only the central portion of the tube (from5 cm to 35 cm) was used for this comparison, toavoid obscuring the results with end effects dueto the copper busses. The predicted Nusseltnumbers are consistently higher than theexperimental values, but fall within 20%.
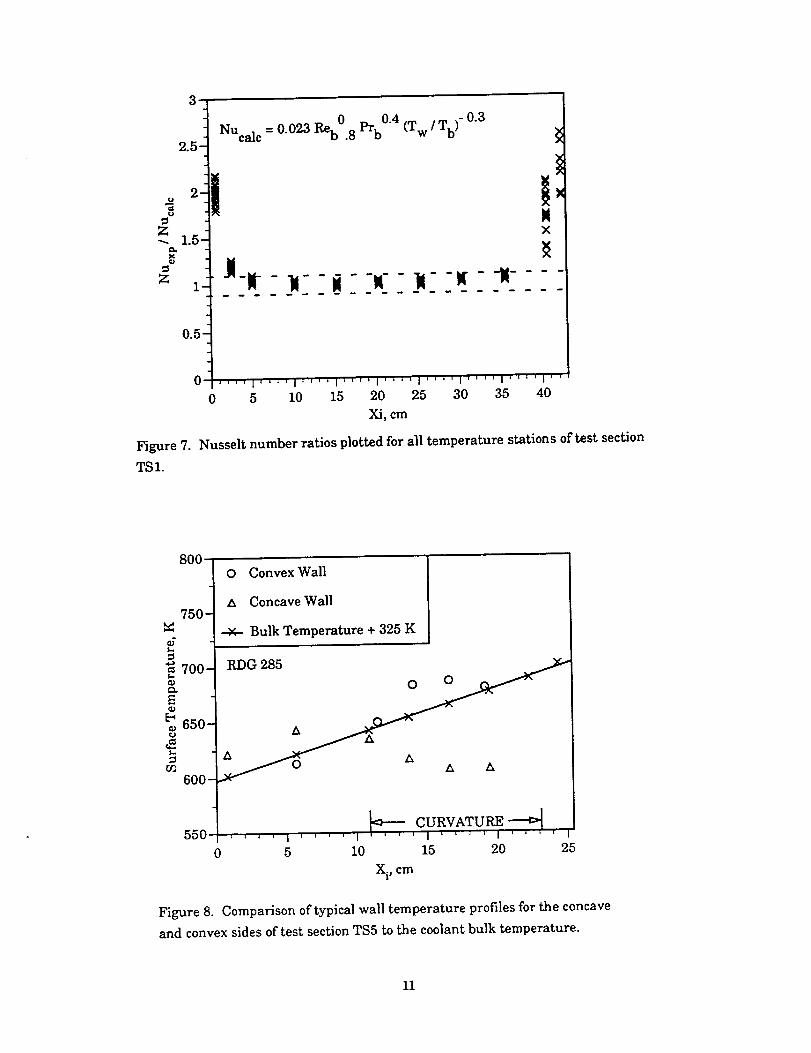
To improve the fit of the model to thedata, a linear regression was performed on thewall-to-bulk temperature ratio exponent, and avalue of-0.3 was obtained. The resultingmodel is compared to the data in figure 6 andshows excellent agreement. Examination ofthe data presented in reference 6 indicates thatan exponent of-0.3 would fit the data better forwall-to-bulk temperature ratios less than two,as in this experiment. The ratio ofexperimental-to-calculated Nusselt number
for the same model is plotted in figure 7 for allof the temperature stations, and shows the goodfit in the central portion of the tube but not nearthe ends.
Typical temperature profiles for theconcave and convex walls of test section TS5
are plotted in figure 8. For a straight tube, onewould expect the wall temperature profile tofollow the slope of the coolant bulk temperatureprofile, which is also plotted in figure 8.However, at the start of the curvature (~ Xi = 11cm), the concave wall temperature turns
dramatically downward. The convex wallprofile becomes steeper at this point, but the
change is not as dramatic. Unfortunately, theexit of the curve falls within the end effects of
the copper power bus and so the walltemperature recovery could not be observed.However, the trends in both profiles arecomparable to the curvature effects that have
been observed in lower aspect ratio tubes. Thisindicates that strong secondary flows arepresent, and the coolant thermal stratification
is not significant in the curve for theseconditions.
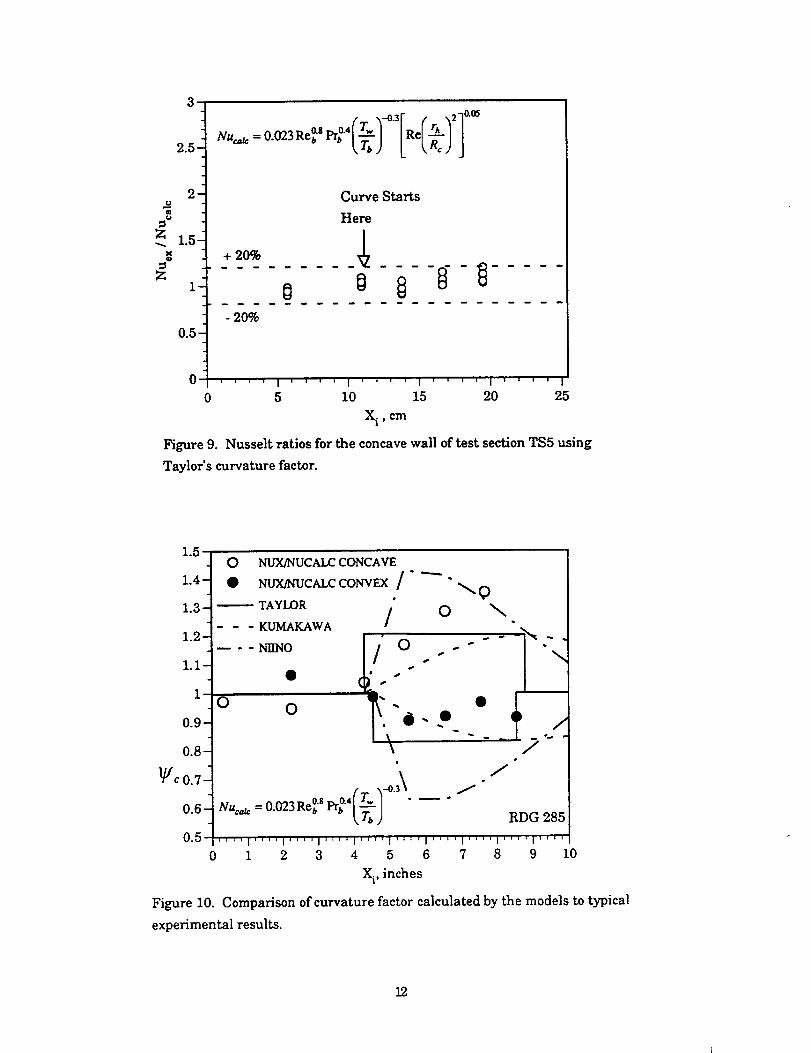
Finding an appropriate model for the
curvature effects is more difficult than
recognizing their presence. In figure 9 theratio of experimental Nusselt number tocalculated Nusselt number at the concave wall,including Taylor's curvature factor, is plottedfor five tests. Because the curvature
enhancement increased through the curve,Taylor's factor overcorrected at the entrance tothe curve and undercorrected near the exit of
the curve. However, the data all falls within +20%.
Figure 10 is a comparison of theexperimental curvature factor from arepresentative test to that predicted by themethods of TaylorS, Niino, et al.9 andKumakawa, et al.ll For the Niino et al.equation, the coefficient was assigned thevalue 1/3. Both the concave and convex surfacecurvature factors are shown. Note that the
predicted values for the two surfaces are notsymmetrical because the concave side of thecurve is longer than the convex side. Althoughboth the method Taylor and Kumakawa, et al.underpredict the experimentally derivedvalues for the concave surface, Kumakawa's
method models the development much better.The method of Niino, et al. over predicted thecurvature factor, even though the smaller valueof the coefficient b was used. No attempt wasmade to obtain a better fit of the data, because asnoted earlier, the one-dimensional analysisused to determine the experimental Nusseltnumbers may have introduced some errors.Therefore, it was not determined whether thediscrepancies were real or a result of thesimplified analysis. The curvature effect onthe convex surface is overpredicted by all threemodels.
Concluding Remarks
An electrically heated tube facility wasused to investigate the combined effects ofcooling channel aspect ratio and curvature.For all of the data presented, gaseous nitrogenwas the coolant.
To validate the facility, a singlecircular cross-section tube was tested, and theresults compared favorably with the classicalheat transfer correlations available in the
literature.

The results from a curved rectangularcross-section tube of aspect ratio 10 showed thata strong curvature induced heat transferenhancement was present even at this highaspect ratio. The implication of this result wasthat secondary flows developed that minimizedthe coolant thermal stratification. The dataalso indicated that Taylor's curvature factor,
Wc, underpredicted the experimental results by
up to 20%. However, the one-dimensionalanalysis that was applied to the data may havecalculated a higher experimental heat transfercoefficient than actually occurred and causedthe difference.
The development of an optimum factor
for accurately predictingthe curvature heat
transfer enhancement in high aspect ratiochannels willrequirefurthertestingand more
comprehensive analysis of the data, as theresults presented here were limited to a singlecurvature and a single aspect ratio. However,based on these results, the author recommendsthat, for coolants for which the Colburn typeNusselt number models apply, and up to anaspect ratio of 10, Taylor's factor, or themodified version suggested by Kumakawa,should be used to predict the curvatureenhancement in cooling channels.
References
1. Carlile, J. A., Quentmeyer, R. J., _AnExperimental Investigation of High-Aspect-Ratio Cooling Passages," AIAA-92-3154, NASATM 105679, 1992.
2. Kacynski, IZ_J., _Thermal StratificationPotential in Rocket Engine CoolantChannels," NASA TM-4378, Presented at theJANNAF Propulsion Meeting, Vol. 1, pp. 329-338, 1992.
3. Meyer, M. L. and Giuliani, J. E.,_Visualization of Secondary FlowDevelopment in High Aspect Ratio Channelswith Curvature," AIAA-94-2979, NASA TM-
106658, 1994.
4. Incropera, F. P. and DeWitt, D. P.,Fundamentals of Heat and Mass Transfer, 3rd
Edition, John Wiley and Sons, 1990, pp. 495-498.
5. Taylor,M. F.,_A Method ofPredictingHeatTransfer Coefficientsin the Cooling Passages
ofNERVA and PHOEBUS-2 Rocket Nozzles,"
AIAA-68-608,NASA TM X-52437, 1968.
6. Simoneau, I_ J. and Hendricks, IL C.,"A
Simple Equation forCorrelatingTurbulent
Heat Transfertoa Gas," AIChE and ASME,Heat Transfer Conference and Products Show,
Cleveland,Ohio,August 9-12,1964.
7. Dean, W. R., _Fluid Motion in a CurvedChannel," Royal Soc. Proc. A, Vol. 121, 1928,
pp. 402-420.
8. Ito, H., _Friction Factors for Turbulent Flowin Curved Pipes," J. Basic Engineering, Vol.81, No. 2, June 1959, pp. 123-134.
9. Niino,M., Kumakawa, A., Yatsuyanagi,
N., and Suzuki, A., "Heat Transfer
Characteristicsof LiquidHydrogen as aCoolantforthe LO2/LH2 Rocket Thrust
Chamber with Channel Wall Construction,"
AIAA-82-1107, 1982.
10. Hendricks, R. C., Niino, M., Kumakawa,A_, Yeroshenko, V. M., Yaskin, L. A.,Majumdar, A. K., and Mukerjee, T., "FrictionFactors and Heat Transfer Coefficients for
Hydrogen Systems Operating at SupercriticalPressures," Proceedings of BeijingInternational Symposium on HydrogenSystems, Beijing, China, May 7-11, 1985, ChinaAcademic Publishers, Distributed by
Pergamon Press, 1986.
11. Kumakawa, A., Sasaki, M., Niino, M.,Sakamoto, H., and Sekita, T., _ThermalConduction Characteristics of an ElectricallyHeated Tube Modeled after the LE-7 Main
Burner," Presented at the 30th Space Sciencesand Technology Conference, October 15, 1986,
(paper obtained from the author).
12. Green, J.M., Pease,G. M., and Meyer, M.
L.,_A Heated Tube FacilityforRocket Coolant
Channel Research,"AIAA-95-2936, 1995.
13. Hendricks, R. C., Graham, R. W., Hsu, Y.
Y., and Friedman, R., "Experimental Heat-Transfer Results for Cryogenic HydrogenFlowing in Tubes at Subcritical andSupercritical Pressures to 800 Pounds Per
6
SquareInch,"NASATN D-3095,1966.
14. Hendricks,R. C.,Baron,A. IL, andPeller,I. C.,"GASP- A Computer Code forCalculating the Thermodynamic andTransport Properties for Ten Fluids:Parahydrogen, Helium, Neon, Methane,
Nitrogen, Carbon Monoxide, Oxygen,Fluorine, Argon, and Carbon Dioxide," NASA
TN D-7808, 1975.
15. Federov, V. V., Theory of OptimalExperiments, New York, Academic Press,1972.
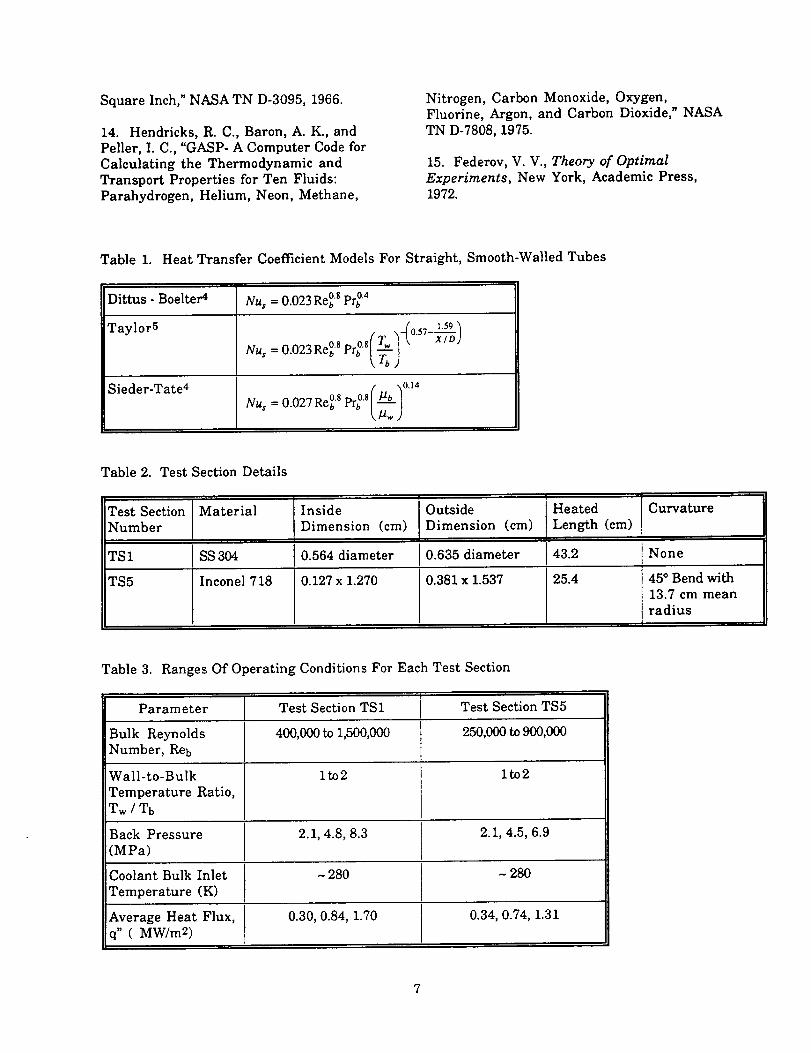
Table 1. Heat Transfer Coefficient Models For Straight, Smooth-Walled Tubes
Dittus - Boelter4
Taylor5
Sieder-Tate 4
Nu, 0.023 _ o s _o.4= Ke b" t-'rt_
-(o.57- 1.59
/ "xo.14
Nu, : 0.027 Re°S Pr°S| "b |
Table 2. Test Section Details
Test SectionNumber
TS1
Material
SS 3O4
TS5 Inconel 718
Inside OutsideDimension (cm) Dimension (cm)
0.564 diameter
0.127 x 1.270
0.635 diameter
0.381 x 1.537
Heated
Length (cm)
43.2
25.4
Curvature
None
45 ° Bend with
13.7 cm meanradius
Table 3. Ranges Of Operating Conditions For Each Test Section
Parameter
Bulk ReynoldsNumber, Reb
Test Section TS1
400,000 to 1,500,000
Test Section TS5
250,000 to 900,000
Wall-to-Bulk lto2 lto2
Temperature Ratio,Tw / Tb
(MPa)BackPressure I 2"1'4"8'8"3 l 2"1' 4"5' 6"9
Coolant Bulk Inlet ~ 280 - 280
Temperature (K)
Average Heat Flux, 0.30, 0.84, 1.70 0.34, 0.74, 1.31q" (MW/m2)

Back PressureCona_l V_lve
EInsurumemafionAccess Plate "..
R
u
Inlet Mixing ......Chamber
Outlet Mixing• Chamber
Test Section"" Vacuum
Enclosure
Test Section
"Assembly
I _3 To Electrical0. _
[ I Powe,Supply
;_ _._ _Vacoum
F1owo
ControlValveGN2 Vacuum-Jacketed
Supply LN2 Fill Line
- OptionalFoam
LN2 Bath
Entrance
Venturi
InsulatedContainer
Figure 1. Heated tube facility schematic.
PT2.54 cm
0.78 cm
2.54 cm
PT
10.2 cm 5.08 cm
I
0.75cmTC
I CTC5.08cm
CTCcm
5.08 cmI
PT - Pressure Tap J( TC
TC - Thermocouple ?VT - Voltage TapCTC - Control 5.08 cm
Thermocouple l' TC
5.08cm
5.08cm
17.1 cm 5.08 cm
2.54 cm
2.54 cm
2.54 cm _ 0.78 cm
i,'i15.2 cm Unheated
Entrance Length
Figure 2. Test section TS1 instrumentation.

260 rr_• i 115mm
9 = 45" :i::::..'.::i;_i!:_iii:.'
X CONVEX
CONCAVESECTION A-A
ENLARGEMENT
Figure 3. Test section TS5 geometry.
500
45o-
-400-
,_ 350
O
3OO
0.03
RDG 169
T 0 0 0 BE0 w 0 []
[]0 D
• 0 [] D 0
D_ n D Tb + lOOK •
C
OA A • • • • • A
hX
I I I I I I I I
0 5 10 15 20 25 30 35 40
X(i), cm
- 0.025
- 0.02
-0.015
-0.01
- 0.005
0
E
x
Figure 4. Typical experimental wall temperature (Tw), bulk temperature (Tb),
and heat transfer coefficient (h x) profiles for test section TS 1. Bulk temperature
is adjusted by a constant 100 K for the plot.

2000 _-1 f_ ,,-(o.57-_.sgDlx) /
o1200q ___ o-'-20%
_-_o_- /_o_ :.--8oo- __¢e---ooo-400- S- - -
200- . - -" , ............0- :' ' I' ' ' I' ' ' I'' ' I 1 i I l' ' ' I ' '
0 200 400 600 800 1000 1200 1400 1600 1800 2000
NUexp
Figure5. Comparison ofNusseltnumbers calculatedby Taylor'sequationforstraight
smooth-walledtubesto the experimentalvaluesfortestsectionTS1 cooledwith gaseous
nitrogen.
2000
1800-
1600.
1400-
12oo-
e_
:_ IO00-Z
800-
600"
400"
200-
0
Nu,._ 0.023Re°" Pr °'4( T'` "_-°'3 +10%": _tr_J ." .-"
• ,,_ •-I0%
• s
¢,
''' i''' I''' I'''1'''1'''1'''1 '''1'''1'''
0 200 400 600 800 1000 1200 1400 1600 1800 2000
NUexp
Figure 6. Comparison of Nusselt number calculated with a modified version of
Taylor's equation to the experimental values for test section TS1.
10
3
2.5-
Z--. 1.5-
e__X
Z1-
0.5-
0
NUcalc= 0.023Reb0.8Prb0"4
H-It - N N
(Tw /Tb)-0.3
-N- - jr- "N - -N
Nx
.... 1 .... I '" '"' I ' ' ' ' I .... i .... I .... I .... I ' '
0 5 10 15 20 25 30 35 40
Xi, cm
_gure 7. Nusseltnumberratiosplot_d _rall _mperaturesmtionsoftestsec_on
TS1.
800
750-
$.
700-
650-
600-
55O
O Convex Wall
,x Concave Wall
Bulk Temperature + 325 K
A 0 A A A
,_, CURVATURE.... I ' ' ' ' I ' I ' " ' ' I ' I
0 5 10 15 20 25
Xi, cm
Figure 8. Comparison of typical wall temperature profiles for the concave
and convex sides of test section TS5 to the coolant bulk temperature.
11
2.5"
.
2; 1.5-xQ
2;1-
0.5-
--03 2 0.05
Nu,_.=0.023Re°SPt°4(T--e-"1 kof_llkT,) L _R_j
+ 20%
0
Curve Starts
Here
o 8-20%
.... I .... I .... I .... I ' ' ' '
0 5 10 15 20 25
X i , cm
Figure 9. Nusselt ratios for the concave wall of test section TS5 using
Taylor's curvature factor.
1.5
1.4-
1.3-
1.2-
1.1-
1
0.9-
0.8-
_/c 0.7-
0.6-
O NUX/NUCALC CONCAVE!
NUX/NUCALC CONVEX 1"0
TAYLOR
- - - KUMAKAWA / 0 _
!io. --- - - NIINO .. --s
I
o o _.•/
/i
.-0.3\ / /
Nu_°_ = 0"023 Re°S Pr°'4 ('_'b ] "--" RDG 285
0.5 .... i .... I .... I .... i .... I .... I .... i .... I .... I ....
0 1 2 3 4 5 6 7 8 9 10
Xi, inches
Figure 10. Comparison of curvature factor calculated by the models to typical
experimental results.
12
Form Ap_v_REPORT DOCUMENTATION PAGE OMBNo. 0704-0188
Pulik: rq:x)rtingburdenf_ this cofkK:tk>nof informax_n is estimated,to average 1 hour per r_pons,e, inc_ud_gthe time for revlewirbl_,ins,tnJcllanrD,am4_¢hlngoxislillg _%rCe_hi _gathering and malntalnin_the data needed, and co.m_.ing _ reviewingthe .c_.lectlonof ,mormat=on._eno co,run.Is regatolng m_ ouroan .eEo many omer _asj_.e_..collection ol information,including suggestionsfor reduc,ngthis burden, to WashmgtonHeadquarters S_ervas, ur_ectont_ Ior_l_ _ a_l I_qpoas, 1215 JeffersonDavis Highway, Suite 1204, Arlington,VA 22202-431_. and to the Office of Management and Budge_.Pape¢workReauctionPrOjeCl(o7o4-Olaa}, waanmgton, L_ Zt,CmU.
1. AGENCY USE ONLY (Leave blank) 2. REPORT DATE 3. REPORT TYPE AND DATES COV.-HP..U
June 1995
4. TITLE AND SUBTITLE
Electrically Heated Tube Investigation of Cooling Channel Geometry Effects
6. AUTHOR(S)
Michael L. Meyer
7. PERFORMING ORGANIZATION NAME(S) AND ADDRESS(ES)
National Aeronautics and Space AdministrationLewis Research Center
Cleveland, Ohio 44135-3191
9. SPONSORIN_NITORING AGENCYNAME(S)ANDADDRESS(ES)
National Aeronautics and Space Administration
Washington, D.C. 20546-0001
Technical Memorandum
5. FUNDING NUMBERS
WU-_50--01
8. PERFORMING ORGANIZATIONREPORT NUMBER
E-9760
10. SPONSORING/MONITORINGAGENCY REPORT NUMBER
NASA TM- 106985
A/AA-95-2500
11. SUPPLEMENTARYNOTES
Prepared for the 31st Joint Propulsion Conference and Exhibit cosponsored by AIAA, ASME, SAE, and ASEE, San
Diego, California, July 10-12, 1995. Responsible person, Michael L. Meyer, organization code 5310, (216) 977-7492.
12a. DISTRIBUTION/AVAILABILITY STATEMENT
Unclassified - Unlimited
Subject Category 20
This publication is available from the NASA Center for Aero_ Information, (301) 621--0390.
12b. DI:_HIBUTION CODE
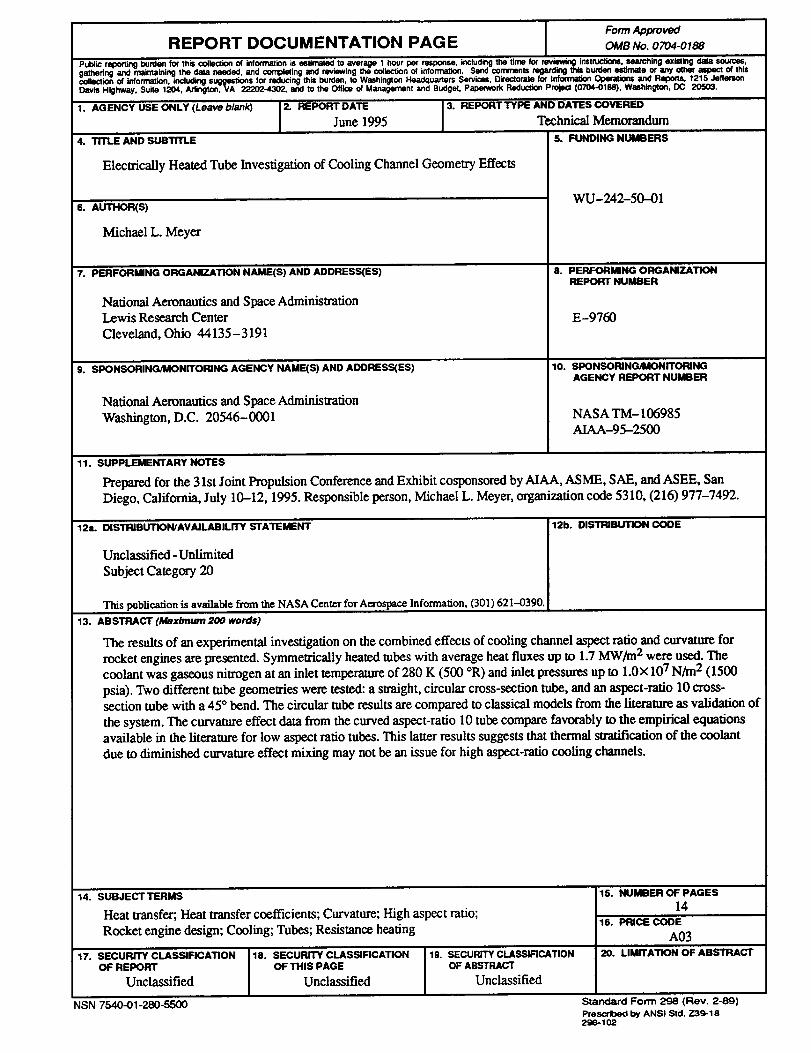
13. ABSTRACT (Maximum 200 words)
The results of an experimental investigation on the combined effects of cooling channel aspect ratio and curvature for
rocket engines are presented. Symmetrically heated tubes with average heat fluxes up to 1.7 MW/m 2 were used. The
coolant was gaseous nitrogen at an inlet temperature of 280 K (500 °R) and inlet pressures up to 1.0× 10⁷ N/m 2 (1500
psia). Two different tube geometries were tested: a straight, circular cross-section tube, and an aspect-ratio 10 cross-section robe with a 45 ° bend. The circular robe results are compared to classical models from the literature as validation of
the system. The curvature effect data from the curved aspect-ratio 10 tube compare favorably to the empirical equations
available in the literature for low aspect ratio tubes. This latter results suggests that thermal stratification of the coolant
due to diminished curvature effect mixing may not be an issue for high aspect-ratio cooling channels.
14. SUBJECTTERMS
Heat transfer; Heat transfer coefficients; Curvature; High aspect ratio;
Rocket engine design; Cooling; Tubes; Resistance heating
17. SECURITY CLASSIFICATION
OF REPORT
Unclassified
18. SECURITY CLASSIRCATION
OF THIS PAGE
Unclassified
19. SECURITY CLASSIFICATIONOF ABSTRACT
Unclassified
15. NUMBER OF PAGES
1416. PRICE CODE
A03
20. LIMITATION OF AB:_iHACT
NSN 7540-01-280-5500 Standard Form 298 (Rev. 2-89)
Prescribed by ANSI Std. Z39-18296-102
