electrical resistivity measurements on ice sheets€¦ · electrical resistivity measurements on...
TRANSCRIPT
JOllmal of Glaciolog)l, V o l. 6, ~o. 47. 1967
ELECTRICAL RESISTIVITY MEASUREMENTS ON
ICE SHEETS
By M. H OCH STEI N
(Geophys ical and Polar Research Genter, University of Wisconsin, Madison, Wisconsin , U.S.A. ) *
ABSTRACT. The electrica l resistivity of fim a nd ice of ice sheets is a function of the " base" resisti vity, the contact resista nce between the gra ins, and the temperature. At greater depths temperature is the predominant influence, and observed res isti vity curves can be expla ined by tempera ture va riat ions which agree pa rtly wi th the theories o f hea t conduction in ice shee ts.
RESUME. NIesllres des risislivites eLeclriqlles des catottes de gtace. La res isti vite du neve e t de la g lace des ca lo ttes g laciaires es t fon ction de la resist ivite de " base" , de la resistance de contact d es g ra ins et de la tempera ture. Pour de g randes profondeurs, la temperature est I'e lement determina nt ; les courbes de resistivile obtenues peuvent etre expliquees par d es va riat ions d e tempera ture qui sont en pa rtie en accord avec les theori es de la conduction thermique dans les ca lo ttes glaciaires .
Z USAM MENFASSUNG . Eleklrische W iderslandsmessllllgell auI Inlandeis. Del' spez ifische Widersta nd von Eis und Firn des Inla ndeises ist abhangig von der " Grundleitfahigke it" , dem K ontaktwiderstand im K orn verband und del' Tempera tur. In g rosseren Tiefen uberwiegt del' Tempera tureinfluss; di e Widerstandskurven konnen durch Temperaturanderungen erkl a rt werden , die mil den Theorien d el' vVarmeieilung im Inla ndeis leilweise i.ibereinslimmen.
I NTRODUCTION
During the Expedition Glaciologique Internationale au Groen land (E.G.I.G. ) in 1959 and the U.S. Antarctic Research Programs in [96 [- 62 and [962- 63, seve ral D.G. electrical resistivity measurements were made on the Green land I ce Sheet and in Antarctica on the small ice cap of Roosevelt Island and on the Ross Ice Shelf. These m easurements were made in order to study the variation of the specific resistivity with depth and to investigate the ex istence of low resistivity layers at the bottom of the ice shee t.
METHOD
The Schlumberger electrod e configuration was used throughout the inves tigations. In making the measurements, the current 1 was limited to 1- 2 mA. by the avai lab le voltage sources and a combined contact resistance of about 1- 2 MD. at the current electrodes. Because of these limitations and low resistivities at depth, the electrode spacing L/2 could only be increased to about I' 5 km. before the potential drop ~ V could no longer be m easured accurately above the background of extraneous potential changes at the potential electrodes.
Standard graphs and auxi liary diagrams given by GGG ([955) and Buchheim (1958) were used for interpretation of the data. One graph was computed according to a theorem of F lathe (1955).
BAC KGRO UN D
By [961 it was known that there must exist two different ranges of resistivity for glacier ice:
p > [ 0 MD.m . at about o°c. , i. e. on temperate glaciers, and
p ::: o · 1 MD.m . at - 10oG. on cold glaciers and ice sheets.
Locally resistivities between 1 and 2 MD.m. can be found on cold glaciers and thin ice shelves, as reported by Meyer and Rothlisberger (1962 ) and by Vogtli (Apollonio and others, 1961 ) .
* Present address: Geophysics Di vision , Department of Scientific a nd Industrial R esearch. Wellington, New Zealand.
JOURNAL OF GLACIOLOGY
Cold ice with similarly high resistivity was found on the Ross Ice Shelf near McMurdo Sound (Antarctica) by Robertson and Macdonald (1962). In the same area in 1961, the author measured a resistivity of 1 . 7 MD.m. in ice warmer than - 20°C.
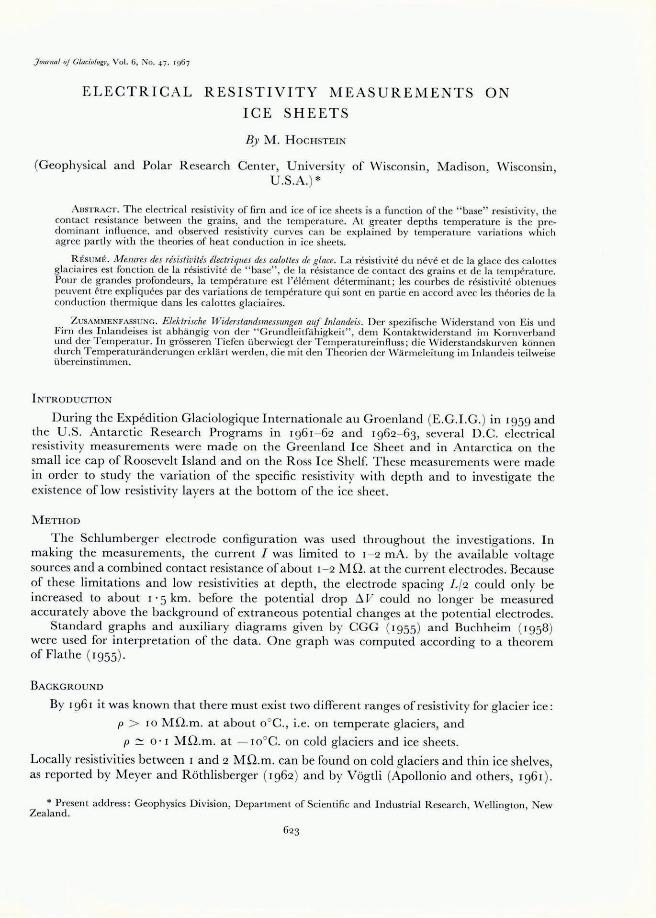
On the cold neve of continental ice sheets resistivity is a function of depth. The 1959 measurements on the Greenland Ice Sheet (Hochstein, 1965) showed that the resistivity decreased sharply, reaching an unexpectedly low value of less than o' I MO.m. at an electrode spacing of L/2 = 600 m. At greater spacings, Pa remained nearly constant (Fig. I). If the
Depth m. 10 20 40 5080100 1000
I I I I I
1.0 0.75 I 0.115 I 0.085 1",0.03 10 5nm.
1: c:: +
<0 -~
c-~
~ -.~ VI
&: 0.1 +
c: 0.08 '" '- 0.05 0 ~ Cl. Cl.
0.04 '" C-
0.02 I I I I I I I I I I I
10 20 40 50 80 100 1000 Electrode Spacing m.
Fig. J. Apparent resistiviry curve at "Station Centra le" (calculated resistiviry-depth column is shown in the upper part of the figure; crosses indicate the origin of the applied model curves )
decrease of resistivity is an effect of densification, it should also be found in cores. Kopp (1962) investigated the resistivity of some cores taken by the glaciological party of E.G.I.G. near "Station Dumont" (Greenland), but found no relation between the density y and the resistivity p. Furthermore, the resistivities of the cores were 10- 100 times greater than values obtained from field measurements. Samples of fresh compressed snow, however, showed a linear variation of log (pi /p) with y where Pi is the initial resistivity. Kopp also showed that the resistivity of firn cores and compressed snow samples was affected by the temperature, following the same law as the resistivity of pure ice:
p = pc exp (E/kT) ( I ) where pc is a constant, T the absolute temperature, E the activation energy, and k Boltzmann's constant (8·62 X 10- 5 eV. r C. = 1 '98 cal. /mole °C. ) . In all cases the activation energy for snow and firn was greater than the activation energy of pure ice.
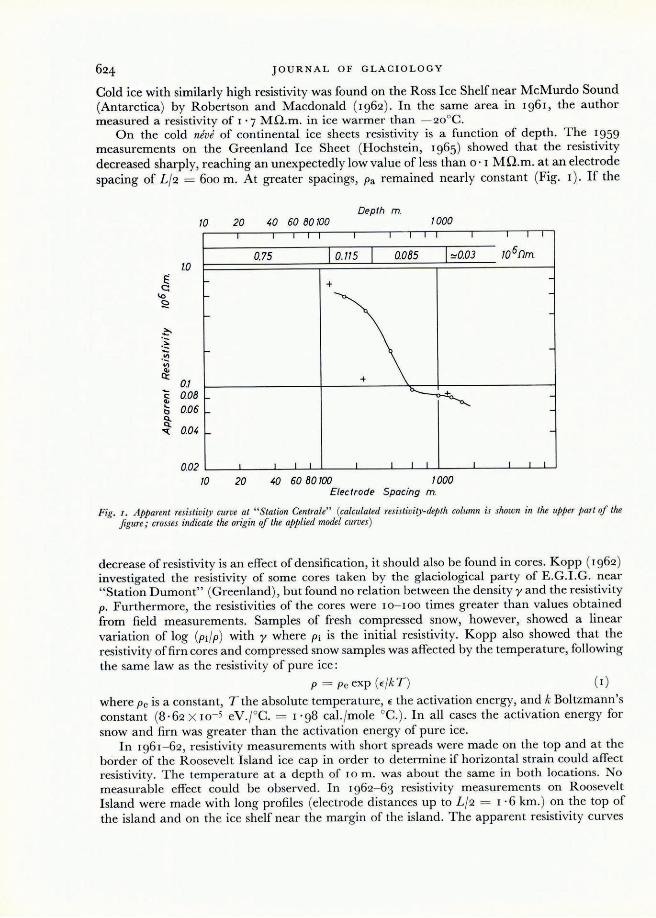
In 1961 - 62, resistivity measurements with short spreads were made on the top and at the border of the Roosevelt Island ice cap in order to determine if horizontal strain could affect resistivity. The temperature at a depth of 10 m. was about the same in both locations. No measurable effect could be observed. In 1962- 63 resistivity measurements on Roosevelt Island were made with long profiles (electrode distances up to L/2 = 1·6 km. ) on the top of the island and on the ice shelf near the margin of the island. The apparent resistivity curves
E L E C TR I CA L R ES I ST I V IT Y MEASU R E M ENTS ON ICE S H EE T S
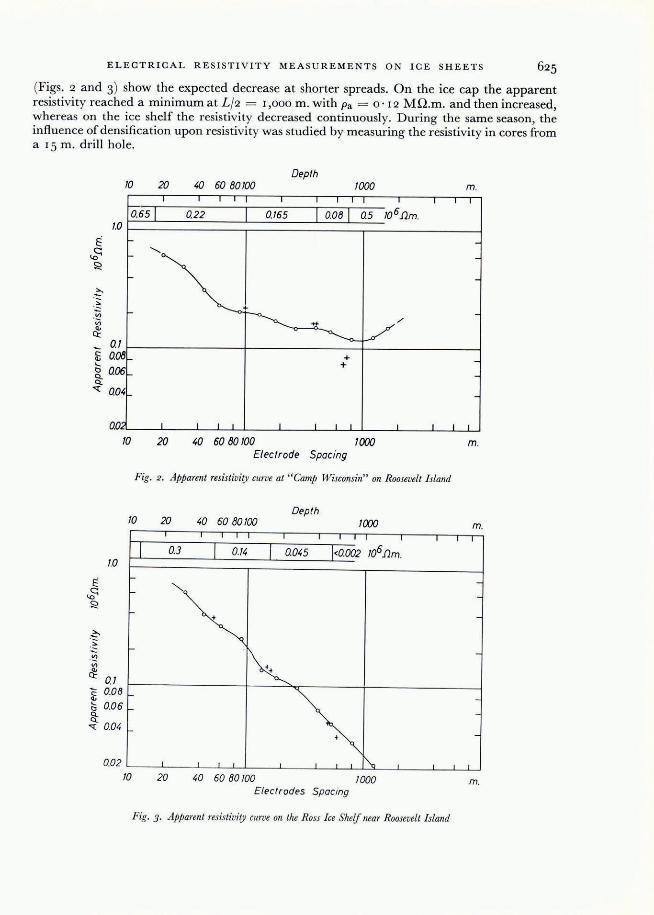
(Figs. 2 and 3) show the expected decrease a t shorter spreads. On the ice cap the apparent resistivity reached a minimum at L j2 = J ,000 m . with Pa = o · J 2 MO.m . and then increased, whereas on the ice shelf the resistivity decreased continuously. During the sam e season , the influence of densifica tion upon resistivity was studied by m easuring the resistivity in cores from a J 5 m . drill hole.
Depth 10 20 40 6080100 1000 m.
0.65 1.0 I------------r-----------r-------~
.~
.!2 / V)
'" 0::
o.lr--------------+--------------~------------~ ~ 0.08 '-2. Q06 Cl.
"<:( 004
OD 10 20
Fig. 2.
40 60 80100 Electrode
+ +
Spacing 1000
ApparCllt resistivity curve at "Camp Wisconsin" on Roosevelt Island
Depth 10 20 40 60 80100 1(X)()
1.0
E ""'" ~
S? +
~ .;: .;:: .!2 V)
~ 0.1
~ 0.08 '- 0.06 t:J
& "<:( 0.04
0.02 10 20 40 6080100 1000
Electrodes Spacing
Fig. 3. ApjJarent resistivity curve 011 the Ross Ice Shelf Ilear Roosevelt Island
m .
m.
m.
J OURNAL OF G L AC IO LOG Y
THE R ESISTIV ITY OF FIRN A N D I CE ON I CE SHEET S
From earlier m easurem ents, we can draw the conclusion that the resistivity of sedimentary ice is a fun ction of (I) the " base" resistivity, (2) the contact resistance between the gra ins, (3) the tempera ture. Other factors, such as the past history of the ice, m ay also be importan t but will not be discussed for lack of informa tion.
(I) According to recent theories (Jaccard , 1959; G ranicher, 1958) the conductivi ty of pure ice results from the presence of OH- and H 30 + ions together with lattice d efects.
In order to explain the difference in resistivity between cold and temperate glacier ice it was fi rst thought tha t the resistivity of sed imenta ry ice is genera ll y lowered b y chemical impurities (i. e. electrolytic conductivity) and that a different distribution of these impurities m ay cause the difference in resistivity. But in the case of electrolytic conductivity the activation energy E
of sedimentary ice should be smaller than measu red ; besides, near the freezing point of the " ice-electrolyte" a jump of resistivity should occur which was not observed (H ochstein, 1965) .
If the conductivity of sedimenta ry ice results from chemical and lattice d efects a different production of these defects can be responsible for the observed various resistivities . R ecrysta llization- which is the main difference between cold a nd tempera te glacier ice- could a ffect the equili brium of the d efects. Laboratory m easurem en ts by K opp (1962) indeed show an increase of the resistivity of compressed snow during recrysta llization . Field m easurem ents on the other ha nd g ive evidence of a layer with high resistivity at the bottom of cold glaciers in North G reenland and at the bottom of the ice sheet near the coast in mid Greenland (M eyer a nd R 6thlisberger, 1962 ; H ochstein , 1965) and since recrystallization should only occur a t the bottom of ice sheets the field results a lso support the conclusion that appa rently the difference of resistivity between cold and tempera te glacier ice is related to the ra te of recrysta llization.
(2) In firn a nd ice, resistivi ty also depends upon the con tact resistance between the grains which is a fu nction of gra in size and pressure. With increasing grain size a nd increasing pressure the contact area between gra ins must become la rger, the contact resista nce consequently must decrease.
The resistivity m easurements in G reenla nd during E .G.I.G. suggested tha t densification has a n influence upon resistivity. Labora tory m easurements made by Kopp (1962) gave proof for compressed snow samples; between the availa ble density range o ' 2 g. /cm ) < y < 0·6 g .Jcm .3 the varia tion of resistivity could be described by:
p = a exp (by) T = const. (2)
T he coeffi cient in the exponent was a ffected by the gra in size. K opp got the values - I 2' 3 for fresh snow, - 9 ' I for powder snow, and - 3 ' 9 for granula ted snow (tra nsfo rming his g raphs of log (pi/p) versus y into p = a exp (by)) . But resistivities offirn cores from Greenland scattered over a broad range a nd did not show a relationship between resistivity and density.
In order to check the influence of densification we measured resistivity and density of core samples directl y in the fi eld during the 1962 /63 season at " Camp Wisconsin" on R oosevelt I sla nd (la t. 79° 16' S.; long. 162 ° 15' W ., elevation 560 m ., accumulation ~ 16 g. /cm .' yr. , l o-metre temperature - 23 ' o°C.) . Since the work was done in a 3 m . pit the tempera ture t of the cores did not cha nge more than r or 2°C . from - 22°C . during the m easurements (t will be used throughout for Centigrade temperatures) . R esistivity a nd density were m easured immedia tely after drilling. The cores were stored in the pit and som e remeasu red after one a nd a ha lf months, but no significant difference could be found. Brass pla tes frozen to the ends of the cores were used as electrodes. The resistance R was measured with a K eithley electrom eter (model 6 10 A) and the resistivity calcula ted from: p = Rq/l, where q is the crosssectiona l area and l the length of the core. The experimen tal error of these m easurements was a bout 10- 25 per cent due to uncerta inty about contact resistance (about 2 MQ. ), a niso tropy, a nd pola rity . The fie ld streng th in the cores did not exceed 2 V ./cm. W e found tha t the
E L EC TRI CA L R ES I STI V I TY M EASU R E M EN T S ON I CE S H EE T S
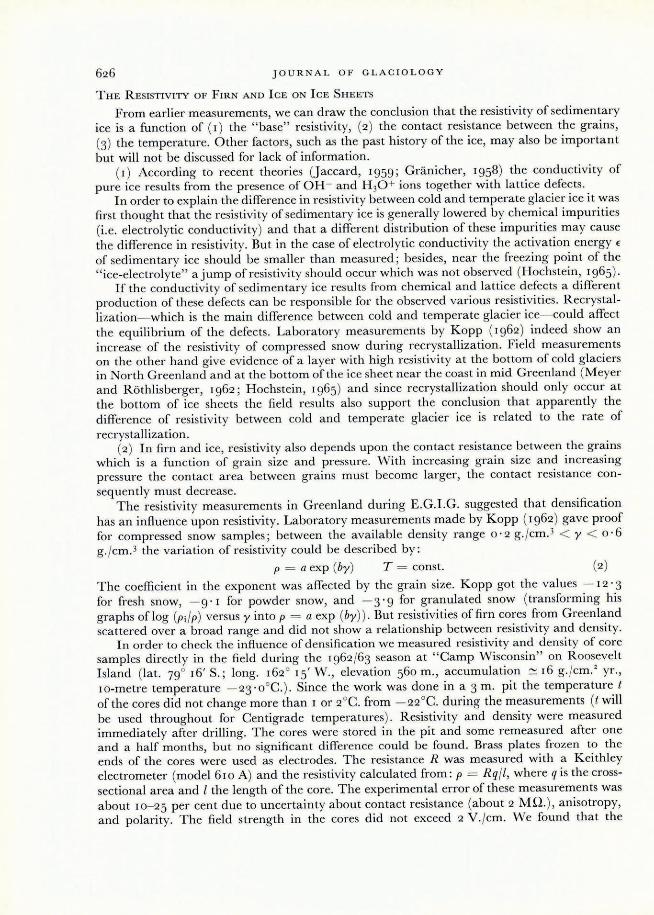
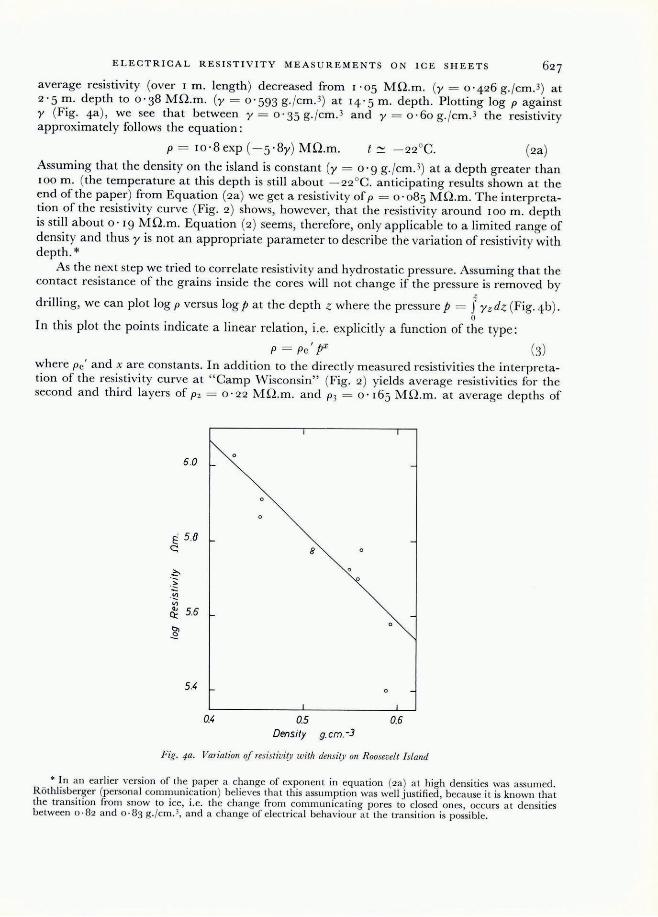
average resistivity (over 1 m. length) d ecreased from 1 · 05 MO.m . (y = 0 .426 g./cm .3) at 2· 5 m . depth to o· 38 MO.m. (y = o· 593 g ./cm .3) a t 14· 5 m . depth. Plo tting log P against y (Fig. 4a ), we see tha t between y = 0·35 g./cm .3 and y = 0 · 60 g. /cm .3 the resistivity approxima tely foll ows the equa tion:
P = 10·8 exp (- 5" 8y) MO.m . t ~ - 22 °C . (2a )
Assuming tha t the density on the island is consta nt (y = 0 · 9 g. /cm )) a t a depth greater than 100 m. (the tempera ture a t this depth is still about - 22 °C. anticipa ting results shown at the end of the pa per) from Equa tion (2a ) we get a resistivity of p = 0 . 085 MO.m . The interpreta tion of the resistivity curve (Fig. 2) shows, however, tha t the resistivity a round 100 m . d epth is still about o· 19 MO.m. Equa tion (2) seem s, therefore, only a pplicable to a limited range of density and thus y is not an appropriate parameter to describe the variation of resistivity with depth. *
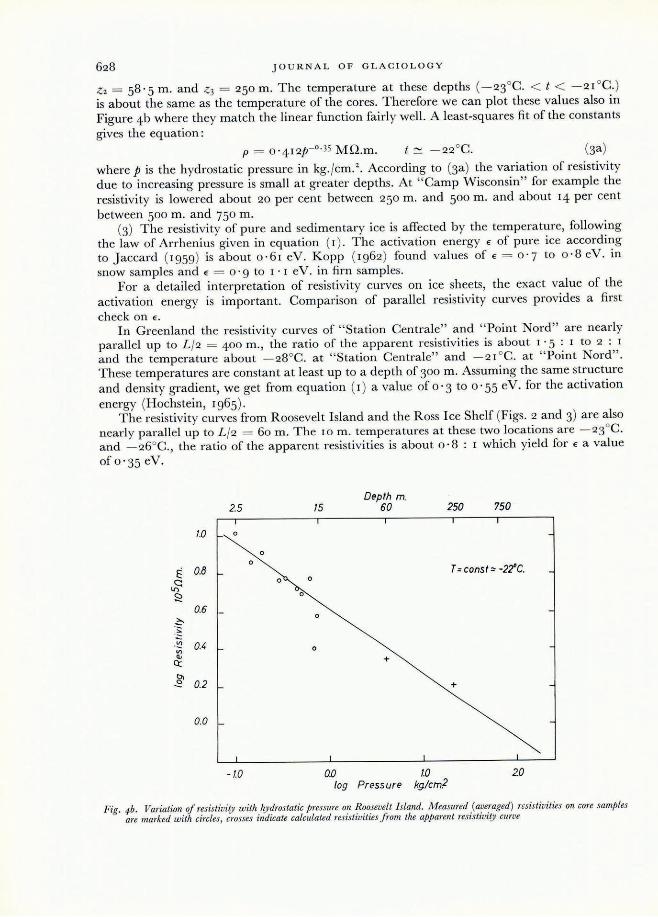
As the nex t step we tried to correlate resistivity and hyd ros tatic pressure. Assuming that the contact resistance of the grains inside the cores will not cha nge if the pressure is removed by , drilling, we can plot log p versus log p a t the d epth z where the pressure p = J y z dz (Fig. 4b) .
o In this plo t the p oints indicate a linear rela tion, i.e. explicitly a fun ction of the type :
P = pc' px where pc' a nd x are constants. In addition to the directly m easured resistivities the interpre ta tion of the resistivity curve at " Camp W isconsin" (Fig. 2) yields average resistivities for the second a nd third layers of P2 = 0 · 22 M O .m . a nd P3 = o · 165 M O .m . a t average depths of
6.0
E 5.0 c::
54
0.4
8
0.5 0.6 Densily g. cm. -3
Fig. 4a. Vm iatioll ~/ resistivifp with del1Si fp 01/ Roosevelt Islalld
* In a n ea rli er version of the paper a change of exponent in equation (2a) a t h igh dens ities was assumed. R othlisberger (persona l comm unication) bel ieves tha t th is assumption was well justifi ed , beca use it is known tha t the transition from snow to ice, i.e. the cha nge from commun ica ting pores to closed ones, occurs a t densities between 0·82 and 0·83 g./cm .3, a nd a change of e lec tri ca l beha viour at the transition is possible.
JOURNAL OF GLAC I OLOGY
<:2 = 58· 5 m. and <:3 = 250 m. The temperature at these depths (-23°C. < t < - 21 °C. ) is about the same as the temperature of the cores. Therefore we can plot these values also in Figure 4b where they match the linear function fairly well. A least-squares fit of the constants gives the equation :
p = 0 ·4 12P- O. 35 MQ.m. t ~ - 22 °C. (3a)
where p is the hydrostatic pressure in kg. /cm.'. According to (3a) the variation of resistivity due to increasing pressure is small at greater depths. At "Camp Wisconsin" for example the resistivity is lowered about 20 per cent between 250 m. and 500 m. and about 14 per cent between 500 m. and 750 m.
(3) The resistivity of pure and sedimentary ice is affected by the temperature, following the law of Arrhenius given in equation ( r). The activation energy E of pure ice according to J accard (1959) is about 0 ·61 eV. Kopp (1962) found values of E = 0'7 to 0 ·8 eV. in snow samples and E = o· 9 to 1'1 eV. in firn samples .
For a detailed interpretation of resistivity curves on ice sheets, the exact value of the activation energy is important. Comparison of parallel resistivity curves provides a first check on E.
In Greenland the resistivity curves of "Station Centrale" and " Point Nord" are nearly parallel up to L /2 = 400 m. , the ratio of the apparent resistivities is about I ' 5 : I to 2 : I
and the temperature about - 28°C. at " Station Centrale" and - 2 I QC. a t " Point Nord". These temperatures are constant at least up to a depth of 300 m. Assuming the same structure and density gradient, we get from equation (I) a value of o· 3 to o · 55 eV. for the activation energy (Hochstein, 1965) .
The resistivity curves from R oosevel t Island and the Ross I ce Shelf (Figs. 2 a nd 3) are also nearly parallel up to L /2 = 60 m. The IQ m . temperatures at these two locations are -23°C. and - 26°C. , the ratio of the apparent resistivities is about 0·8 : I which yield for E a value of 0'35 eV.
2.5
1.0 ° ° 0
E 0.8
~ S2
0.6 ~ :§ . ~ V)
0.4
'" Cl::
.? 0.2
0.0
-1.0
Depth m. 15 60
0 0
0
0
0
+
0.0 log Pressure
1.0 kg/cm!
250 750
T = const" -22°C.
+
20.
Fig . 4b. Variation of re5i5tivity with hydr05tatic IJre551lre on Ro05evelt I5land. Mea5ured (averaged ) r,'5i5tivitie5 on core 5ample5 are marked with circle5, cr055e5 indicate calclllated re5i5tivitie5 from the alJ/Jarellt re5i5tivity cnrve
E L EC TRI CA L R ES I ST I V I T Y M EASU R E M ENTS ON I CE SHEETS
An average value of " a t greater depths can be d erived from a single resistivity curve if, a t two different d epths Zr and Z2, the corresponding resistivities pr and P2 and tempera tures t, and t2 a re known .
On the ice shelf nea r R oosevelt I sla nd interpretation of the apparent resistivi ty curve (Fig. 3) gave the fo llowing values: a t 10 m . depth PI was a bout 0 · 65 M O .m ., while a t the bottom of the floating ice shelf a t 500 m. d ep th P2 was a bou t 0 · 02 to 0·035 MO.m. The tempera ture at these depths were a bout T r = 26°C . a nd T 2 = - 2°C. If we consider the influence of hydrosta tic pressure according to equa tion (3a) the resistivity PI would be lowered to about o · 135 MQ.m . at 500 m . d epth. From equation ( I) the corresponding activation energy is 0 · 38 ± 0· I eV . This figure agrees with the value of" = 0·3 to 0·55 eV. d erived from parallel curves. *
The variation of resistivity with temperature is nearl y the same in Greenland and Anta rctica. The activation energy of cold sedimenta ry ice of ice sheets is a bout 0 ·4 eV . a nd apparently does not change with depth. In both cases, the field results give a lower va lue for €
than the laboratory measurem ents of snow and firn samples which could have been disturbed by recrysta lliza tion .
As long as the exact inAuence of the structure and composition (impurity content) of firn and ice upon the resistivity is unknown, we cannot compare and interpret the absolute resistivity of fi rn a nd ice of ice sheets. For example, the ra tio of the resistivities a t g reater depths a t " Station Centra le" a nd R oosevelt I sla nd , a fter correction for pressure and temperature, is still about 2 : I . In the specia l case of two adjacent locations with nearly the sam e snow structure, accumula tion, and crystal orientation , it should be possible to interpret varia tions of the resistivity curve (insofar as they a re not due to the inAuence of the su bstra tum) in terms of pressure and temperature va riations a lone. In this way we could interpret the resistivity curves from " Camp Wisconsin" and R oss I ce Shelf (Figs . 2 a nd 3), as these locations a re only about 50 km. apa rt . R easona ble results were a lso obtained in Greenland at "Sta tion Centrale" and " Point Nord", which a re about 300 km. apar t. In this paper only a short review of the interpretation of " Station Centrale" is given ; for detailed informa tion see H ochstein (1965).
DISCUSSION O F M EASU R EMENT S I N A NTA R CTICA AN D GREENLAND
The interpreta tion of observed resistivity cUl-ves was undertaken by a pproximating the continuously d ecreasing resistivity by a multi-layered model, i.e. a step fun ction.
The a pparen t resistivity curves, determined from m easurem en ts a t the centre of R oosevelt I sland (Fig. 2) (lat . 79° 16' S., long. 162 ° IS' W ., elevation 560 m ., ice thickness 775 m. , accumula tion::: 16 g ./cm .2 yr ., IQ-m. tempera ture - 23°C .) and on the R oss Ice Shelf near the border of R oosevelt I sla nd (Fig. 3) (lat. 79° 03' S., long. 160° 49' W. , elevation 60 m. , ice thickness 4 75 m ., accumula tion ~ 30 g. /cm .2 yr. , IQ-m. tem pera ture - 26°C .) can be expla ined by the 5-layer m odels shown in T a ble I.
TAB LE I. L AYER M ODELS FOR R ESISTIVITY
R oosevelt i sland Depth Resistivity
m. MQ.m . 0 - 17
17- 100 100- 4 00
400- 750
below 750
p. = 0·65 p, = 0·22 Pl = 0- 165 P~ = 0·08 P; = 0- 50 (rock)
Depth n l,
0 - 12 12- 50 50- 150
15 0 - 500 below 500
R oss fee Shelf Resistivit)l MQ.m.
Pi = ( ,OD
P' = 0- 30 Pl = 0- 14 P4 = 0 - 045 P; ~ 0-002 (sea-wa ter)
Lacking informa tion about the effect of strain on the resistivity we will, in the following interp retation, treat the ice shelf in the same m a nner as a n ice cap.
* T he activat ion energy is not very sensitive to changes in the resistivity ra ti o ; if [or example we assume no furt her resistivity change d ue to p ressu re below about 70 m. we ob ta in a n act iva ti on energy of € = 0 -5 eV.
JO U RNAL OF G L A C I0LOGY
The two upper layers of these models a pproximate the steep decrease of resistivity to a depth of 100 m . on the island and 50 m . on the ice shelf. At these depths the rate of d ecrease apparently changes, causing a " plateau" in the apparent resistivity curve. The " plateaux" in the resistivity curves a re very likely not due to inhomogeneities in the surface layers since all other resistivity curves on the island for example are nearly parallel to Figure 2 . The slow resistivity decrease between 100 and 750 m. on the island and between 50 and 500 m. on the ice shelf can be approximated by two layers. The rate of decrease apparently changes at a d epth of 400 m. on the island and 150 m. on the shelf ice, causing a second " plateau" in the resistivity curves . Below these d epths, the apparent resistivity curves do not suggest fur ther resistivity changes within the ice column. Furthermore, the calculated ice thickness of 750 m . on the island and 500 m. on the ice shelf agree quite well with seismic results. These facts suggest that the resistivity varies slowly within these layers, compared with rapid changes in the upper layers. The rock resistivity of abou t o · 5 MO.m. on R oosevelt I sland is of the order of the resistivity of frozen rock m easured at D evon Island (Apollonio and others, 1961 ).
Assuming that the resistivities of the multi-layered m odel a re representa tive for the midpoint of each layer , i. e. coincidence of calculated and true resistivities at the mid-points, we should be able to estima te temperatures at these depths.
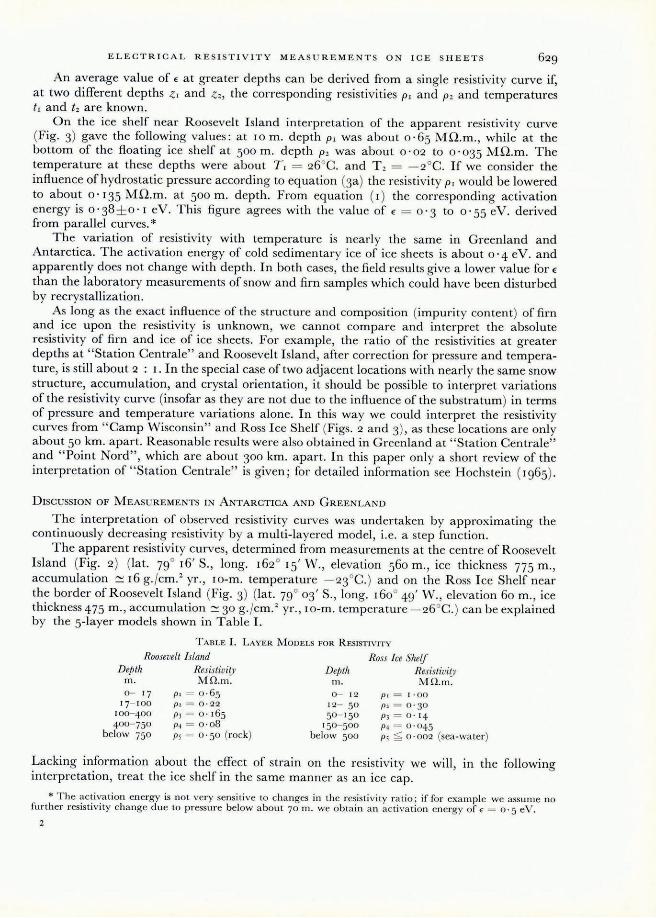
In Table II the d ep ths of the central point of each layer are listed in the first column. The h ydrostatic pressure a t these depths (based on average densities from Antarctic pits and drill holes showing similar accumula tion ra tes as R oosevelt I sland) is given in the second column. The corresponding resistivities given by equa tion (3a ) at surface tempera ture are shown in the third column. In the fourth column the calculated resistivities from the resistivity curves are listed. The difference between the two resistivities according to equation (I) gives the temperature difference b. T. A simple m ethod determining b. T consists of drawing a
TABLE n. I NTERPRETATION OF R ES ISTIVITY PROFILES
D epth Hy drostatic T heoretical Observed t,. T I (theorelical) pressure resistivity resistivity
( T = eonst. ) m . kg. jern .' MO.rn. MO.rn . °c. °c. °c .
Roosevell Island: 10 0 ' 53 0 ' 54 0 ' 54 0 - 23 - 23 60 3'98 0'26 0'23 - I - 22 - 23
250 20 · 8 o · 155 o · 165 +1 - 24 - 2 1 575 50 '0 o · I 15 0'08 - 4 - 19 - 16 750 65. 8 o · 105 0'05 ' - 10 - 13 - 12
R oss Ice Shelf near R oosevelt i sland: 10 0'53 0·65 - 26 - 26 3 1 1'77 0'4 1 0'30 - 5 - 2 1 - 25
100 7'44 0'25 o· 14 - 10 - 16 - 22 325 27. 6 0 ' 16 0'045 - 18 - 6 - 10 500 43'3 o· 135 0' 027' - 24 - 2 - 2
, Ex tra polated va lue.
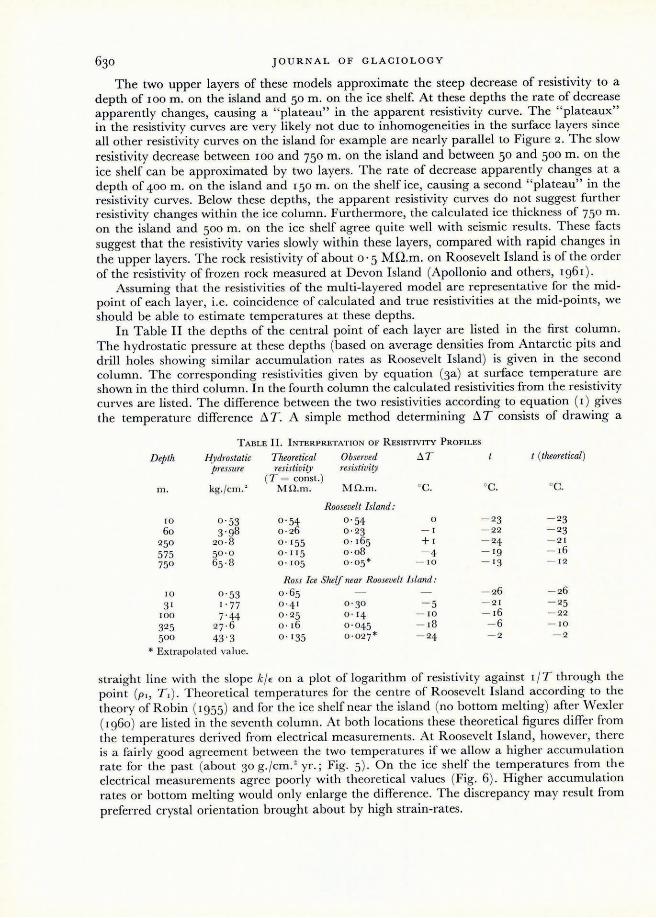
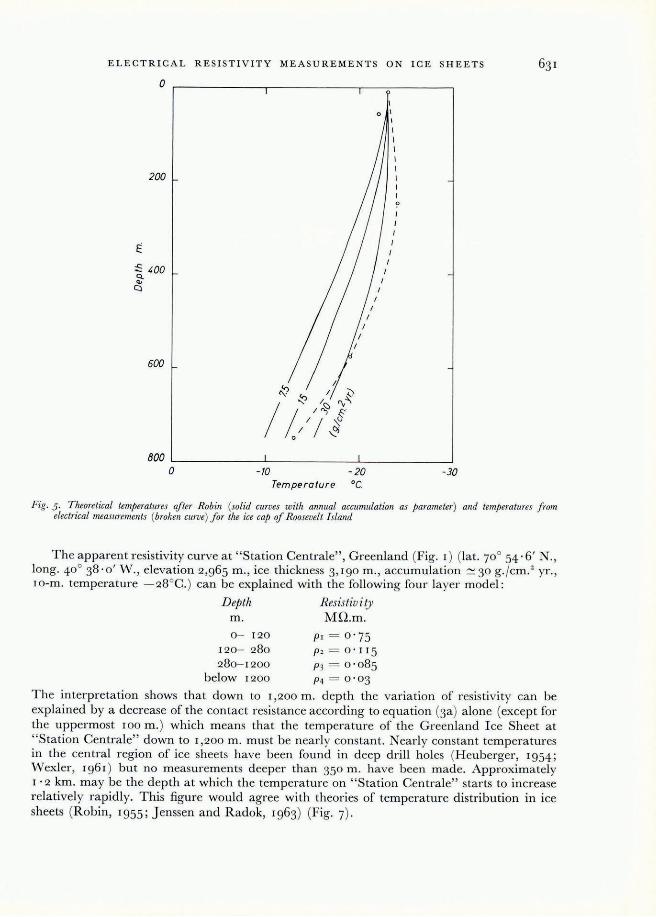
straigh t line with the slope k /t on a plot of logarithm of resistivity against I / T through the point (PI , TI )' Theoreti cal tempera tures for the centre of R oosevelt I sland according to the theory of Robin (1955) a nd for the ice shelf near the island (no bottom m elting) a fter W exler ( 1960) a re listed in the seventh column. At both locations these theoretical figures differ from the temperatu res derived from electrical m easurem ents. At R oosevelt I sla nd, however, there is a fa irly good agreem en t between the two temperatures if we a llow a higher accumula tio n rate for the past (about 30 g./cm .2 yr. ; Fig. 5) . On the ice shelf the temperatures from th e electr ical m easurements agree poorly with theoretical values (Fig. 6) . Higher accumulation rates or bottom melting would only enlarge the difference. The discrepa ncy may result from preferred crystal orientation brought about by high stra in-rates.
ELECTR I CAL RE SI STIVITY MEASUREMENT S ON I CE SHEE TS
o
o
200
600
800 '----_____ -'------_____ --'--_____ -'
o -10 -20 -30 Temperature 0c.
Fia. 5. Theoretical temperatures after Robin (solid curves with annual accumulation as parameter) and temperatllres from electrical measurements (broken curve) for the ice cap of Roosevelt Island
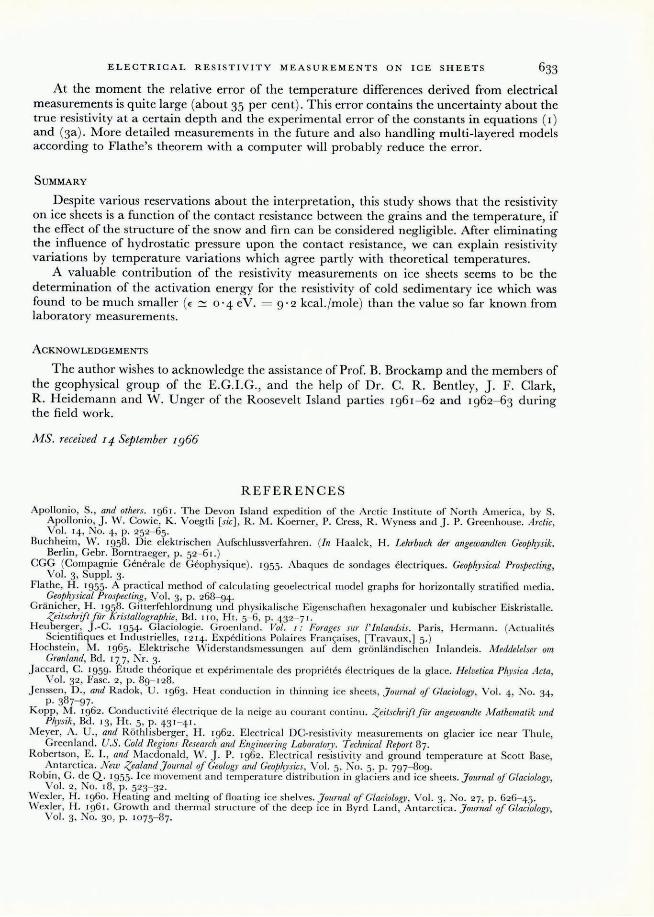
The apparent resistivity curve at " Station Centrale", Greenland (Fig. [) (1at. 70° 54 ' 6' N., long. 40° 38 . 0' W. , elevation 2,965 m., ice thickness 3, I90 m., accumulation ~ 30 g. /cm.' yr., l o-m. temperature - 28°C. ) can be explained with the following four layer model:
Depth Resistivity m . MQ.m .
0- 120 120- 280 280- 1200
p, = 0'75 p, = o · I I5 P3 = 0' 085
below 1200 P4 = 0'03
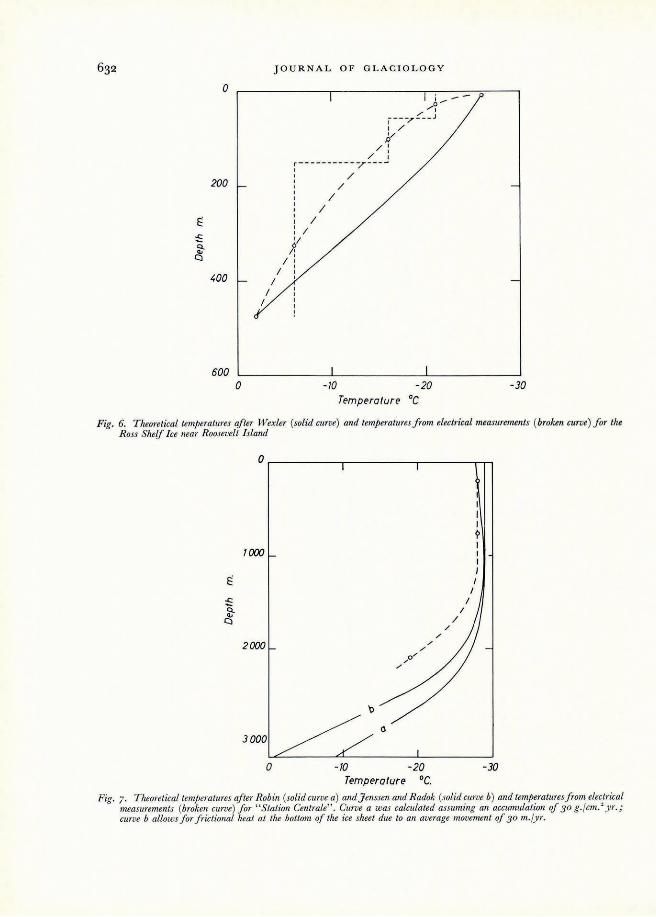
The interpretation shows that down to 1,200 m . depth the variation of resistivity can be explained by a d ecrease of the contact resistance accord ing to equation (3a) a lone (except for the uppermost 100 m. ) which means tha t the temperature of the Greenland I ce Sheet at " Station Centrale" down to 1,200 m. must be nearly constant. Nearly constant temperatures in the central region of ice sheets have been found in deep drill holes (H euberger, 1954 ; W exler, 196 1) but no m easurem ents deeper than 350 m . have been made. Approximately I' 2 km. m ay be the depth at which the temperature on "Station Centrale" starts to increase relatively rapidly. This figure would agree with theories of temperature distribution In Ice sheets (Robin, 1955; J enssen and R adok, 1963) (Fig. 7) .
o
200
400 /
/
600 o
JOURNAL OF GLACIOLOGY
/
i -0-/ ,
I _/~ __ J
, /
Y / ' ,
/ , ;--- --------7----
/ , / 6/
/ , / :
/
/
/ /
/
-/0 -20 Temperature °c
-30
Fig. 6. Theoretical temperatures after Wexler (solid curve) and temperatures from electrical measurements (broken curve ) for the Ross Shelf Ice near Roosevelt Island
0
I I I I ?
1000
E I I
.c: / Cl. '" Cl
2 000
3 000
o -10 -20 -30 Temperature 0c.
Fig. 7. Theoretical tem/Jeratures after Robin (solid curve a) and]enssen and Radok (solid curve b) and temperaturesfrom electrical measurements (broken curve) for "Station Centrale". Curve a was calculated assuming an accumulation of 30 g ./cm.' y r.; curve b allows/or frictional heat at the bottom of the ice sheet due to an average movement qf 30 m./yr.
ELECTRICAL RE S ISTIVITY MEA SU REMENT S ON I CE SHEETS
At the moment the relative error of the temperature differences derived from electrical measurements is quite large (about 35 per cent) . This error contains the uncertainty about the true resistivity at a certain depth and the experimental error of the constants in equations ( I) and (3a ) . More detailed m easurements in the future and a lso handling multi-layered models according to Flathe's theorem with a computer will probably reduce the error.
SUMMARY
Despite various reservations about the interpretation, this study shows that the resistivity on ice sheets is a function of the contact resistance between the grains and the temperature, if the effect of the structure of the snow and firn can be considered negligible. After eliminating the influence of hydrostatic pressure upon the contact resistance, we can explain resistivity variations by temperature variations which agree partly with theoretical temperatures.
A valuable contribution of the resistivity measurements on ice sheets seems to be the d etermination of the activation energy for the resistivity of cold sedimentary ice which was found to be much smaller (E ::: 0 '4 eV . = 9' 2 kcal. Jmole) than the value so far known from laboratory m easurements.
ACKNOWLEDGEMENTS
The author wishes to acknowledge the assistance of Prof. B. Brockamp and the m embers of the geophysical group of the E.G.I.G., a nd the help of Dr. C. R. Bentley, J. F. Clark, R. Heidemann and W. Unger of the Roosevelt I sland parties 196[- 62 and 1962- 63 during the field work.
MS. received 14 September 1966
REFERENCES
Apollonio, S., and others. 196 1. The Devon Island expedition of the Arcti c Institute of North America, by S. Apollonio, J . W. Cowie, K . \loegtli [sic ], R. M. K oerner, P. Cress , R. ' '''yness a nd J. P. Greenhouse. Antic, \101. 14, No. 4, p. 252- 65.
Buchheim, W . 1958. Die elek tri schen Aufschlussverfa hren. (Ill H aa lck, H . Lehrbuch der angewandten Geophysik. Berlin, Gebr. Borntraeger, p . 52- 6 1. )
CGG (Compagnie Genera le d e Geophysique) . 1955. Abaques de sondages electriques. Geophysical Prospecting, \101. 3, Suppl. 3·
Flathe, H. 1955. A practica l method of ca lcula ting geoe lectri ca l model g ra phs for horizonta ll y stratified med ia. Geo/lhysical Pros/Jecting, \101. 3, p. 268- 94.
Gra nicher, H . 1958. G itterfehlordnung und physika lische Eigenschaften hexagonaler und kubischer E iskrista lle. Zeitschriftfiir Kristallographie, Bd. 11 0, Ht. 5- 6, p . 432- 7 I .
H euberger, J.-C. 1954. Glaciologie. Groenl and . Vol. I : Forages sllr [' Inlandsis. Pa ris, H ermann. (Actua li tes Scientifiques et Industrielles, 12 14. Expeditions Polaires Fran<;aises, [Travaux,] 5. )
H ochstein , M. 1965. E lektrische Widerstandsmessungen a uf d em grbnla ndischen lnla ndeis . NIeddelelser om Gronland, Bd. 177, N r. 3.
J accard , C. 1959. Etude theor ique et experimentale des proprietes eIectriques de la g lace. Helvetica Physica Acta, \101. 32, Fasc . 2, p. 89- 128.
J enssen, D ., and R adok, U. 1963. H ea t conduct ion in thinning ice sheets, Journal of Glaciology, \101. 4, No. 34, p. 387-97.
K opp, M. 1962. Conducti vite elec trique de la neige au courant continu . Zeitschri{tfii,· angewandte Mathematik /llld Physik, Bd. 13, Ht. 5, p. 431 - 4 1.
M eyer, A. U. , and Rbthli sberger, H . 1962. Electri ca l DC-resisti vity measurements on glacier ice near Thule, Greenla nd. U.S. Cold Regions Research and E ngineering Laboratol)l. T echnical Report 87.
R obertson, E. 1. , and Macdonald, W. J. P. 1962. Electrical res isti vity a nd ground temperature at Scott Base, Antarctica. New Zealand J ournal rif Geology and Geo/J/rysics, \101. 5, No. 5, p. 797- 809.
Robin, G. de Q. 1955. Ice movement and tempera ture distribut ion in g laciers a nd ice sheets. J ournal of Glaciology, \101. 2, No. 18, p. 523- 32.
' '''ex ler, H. 1960. H eating a nd melting of floating ice shelves. Journal of Glaciology, Vol. 3, No. 27, p . 626- 45. vVexler, H . 196 I . Growth a nd therma l structure of the deep ice in Byrd Land, Antarctica. Journal of Glaciology,
Vol. 3, No. 30, p. 1075- 87.