ela- ancient history and early experiments · benthic algae 30 16 47 zooplankton 31 19 39 dipteran...
TRANSCRIPT

Lake Erie 1971
ELA- Ancient History and Early Experiments
DW Schindler
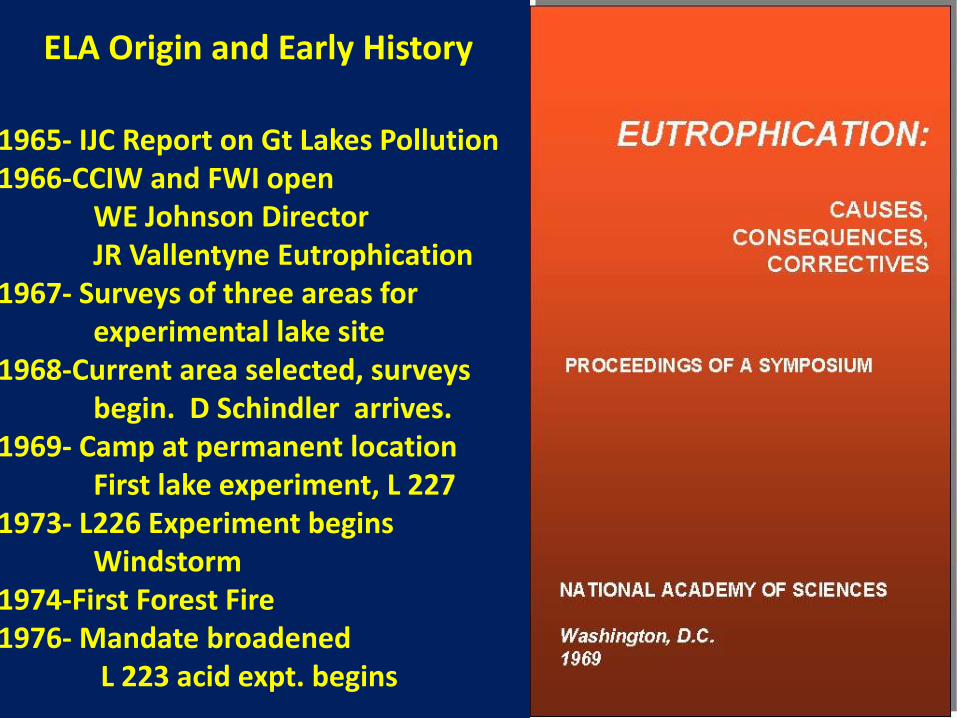
1965- IJC Report on Gt Lakes Pollution1966-CCIW and FWI open
WE Johnson DirectorJR Vallentyne Eutrophication
1967- Surveys of three areas for experimental lake site
1968-Current area selected, surveysbegin. D Schindler arrives.
1969- Camp at permanent locationFirst lake experiment, L 227
1973- L226 Experiment beginsWindstorm
1974-First Forest Fire1976- Mandate broadened
L 223 acid expt. begins
ELA Origin and Early History
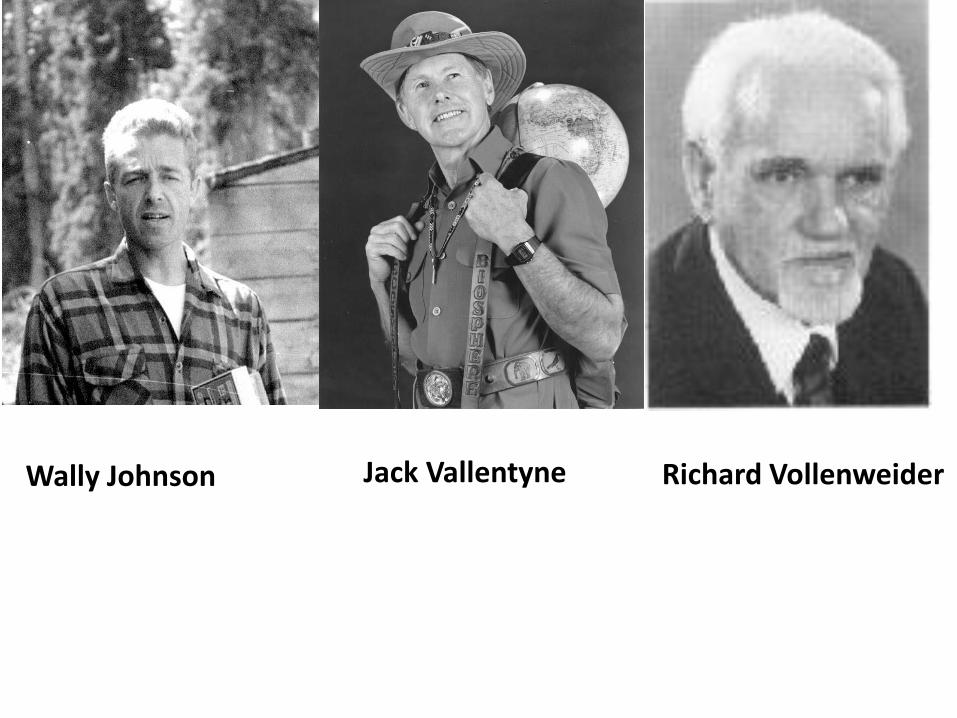
W. E. Johnson
.
J.R. Vallentyne R. A. Vollenweider
National and International Awards- ELA StaffFirst Stockholm Water Prize, Two Tyler Environmental Achievement Awards,Two GE Hutchinson Medalists (ASLO), One Rachel Carson Award, One Volvo Environment Prize, Two Naumann-Thienemann Medals (SIL),One Gerhard Herzberg Gold MedalTwo Members of the Royal Society of CanadaOne Member of the US National AcademyOne Member of the Royal Society of London
Wally Johnson Jack Vallentyne Richard Vollenweider


L227
L 223
L226
TeggauLake
Experimental Lakes Area (ELA)
WinnangeLake
L302
L303
L304
L261
L239
L114
L240
L382
ELA Station

Schindler tent Lake 132 island 1968
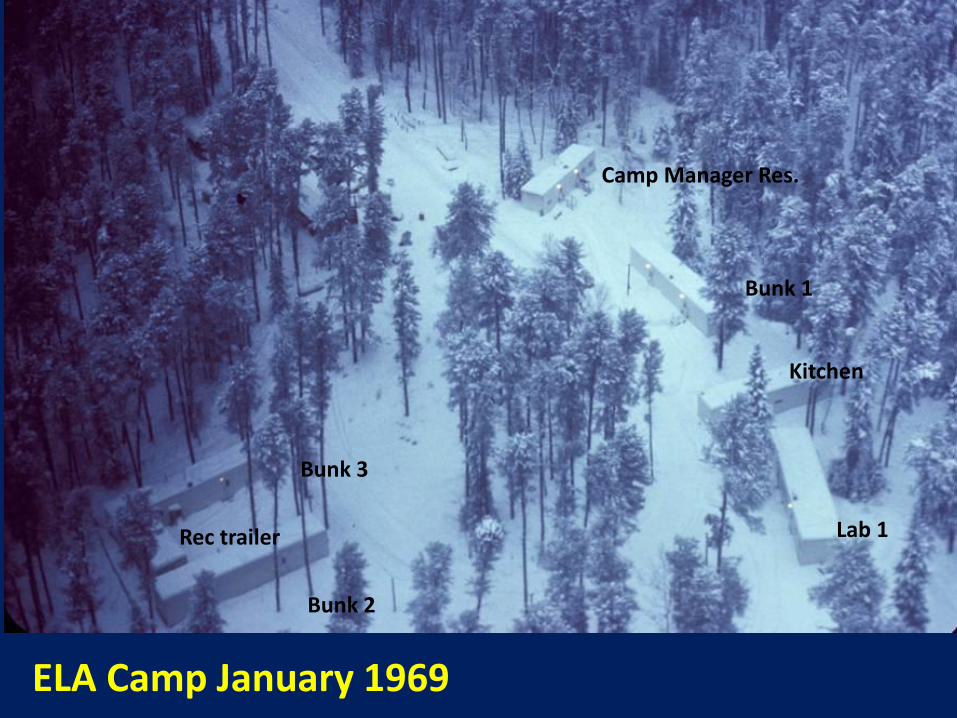
ELA Camp January 1969
Camp Manager Res.
Bunk 1
Kitchen
Lab 1
Bunk 2
Rec trailer
Bunk 3

Summer 1969

Schindler Cabin Summer 1969

24 June 1974

L 239 Basin 1975

Early June 1980

July 1980

THE CARBON LIMITATION THEORY
1967-1971

Lake 227
Before nutrient addition
After adding P+N


Schindler 1977 Science


L 226NP+N+C
L 226SN+C
Schin
dle
r Scien
ce 1
97
4

Low N:P Low N:P
High N:P
Levine and Schindler 1992 Limnol. Oceanogr. 37: 917-935.
10 Meter Diameter
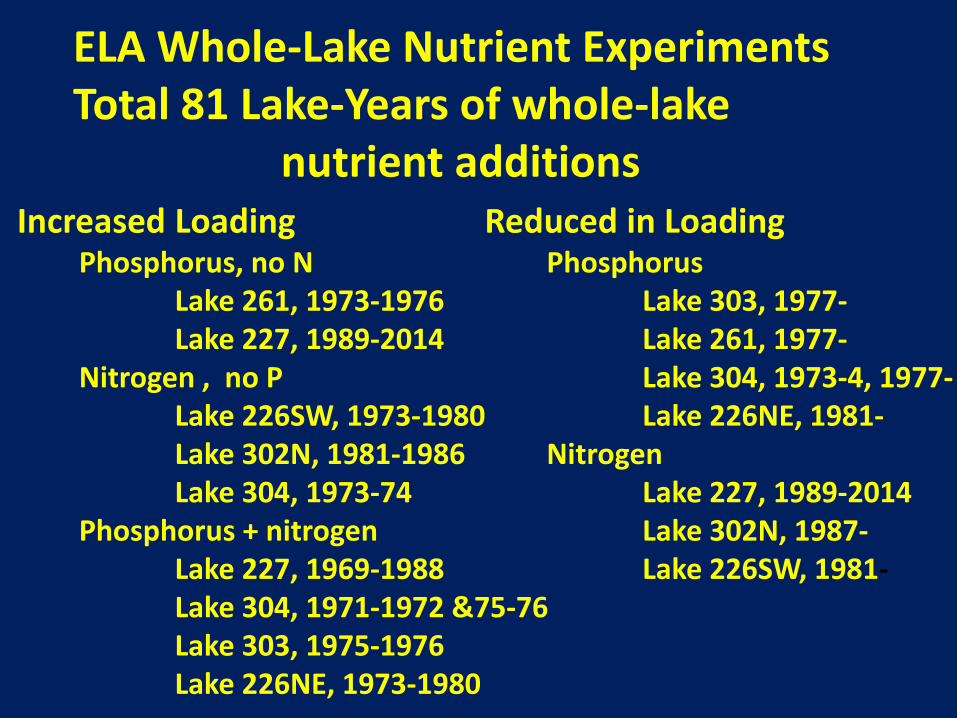
ELA Whole-Lake Nutrient Experiments Total 81 Lake-Years of whole-lake
nutrient additionsIncreased Loading
Phosphorus, no NLake 261, 1973-1976Lake 227, 1989-2014
Nitrogen , no PLake 226SW, 1973-1980Lake 302N, 1981-1986Lake 304, 1973-74
Phosphorus + nitrogenLake 227, 1969-1988Lake 304, 1971-1972 &75-76Lake 303, 1975-1976Lake 226NE, 1973-1980
Reduced in LoadingPhosphorus
Lake 303, 1977-Lake 261, 1977-Lake 304, 1973-4, 1977-Lake 226NE, 1981-
NitrogenLake 227, 1989-2014Lake 302N, 1987-Lake 226SW, 1981-

Control of Lacustrine Phytoplankton by Nutrients: Erosion of
the Phosphorus Paradigm. W. M. Lewis, Jr. and W. A.
Wurtsbaugh. 2008. Internat. Rev. Hydrobiol. 93 (4–5) 446–465.
Controlling eutrophication: Nitrogen and phosphorus.
DJ Conley et al. 2009. Science 323: 1014-1015.
Algal blooms: Noteworthy nitrogen.
H. Paerl et al. 2014. Nature 346: 175. .
It takes two to tango: When & where dual nutrients (N & P)
reductions are needed to protect lakes and downstream
ecosystems. H. Paerl et al. 2016. Env. Sci. Technol. ***
.
Nitrogen Control Theory resurfaces
like a Phoenix in the New Millenium
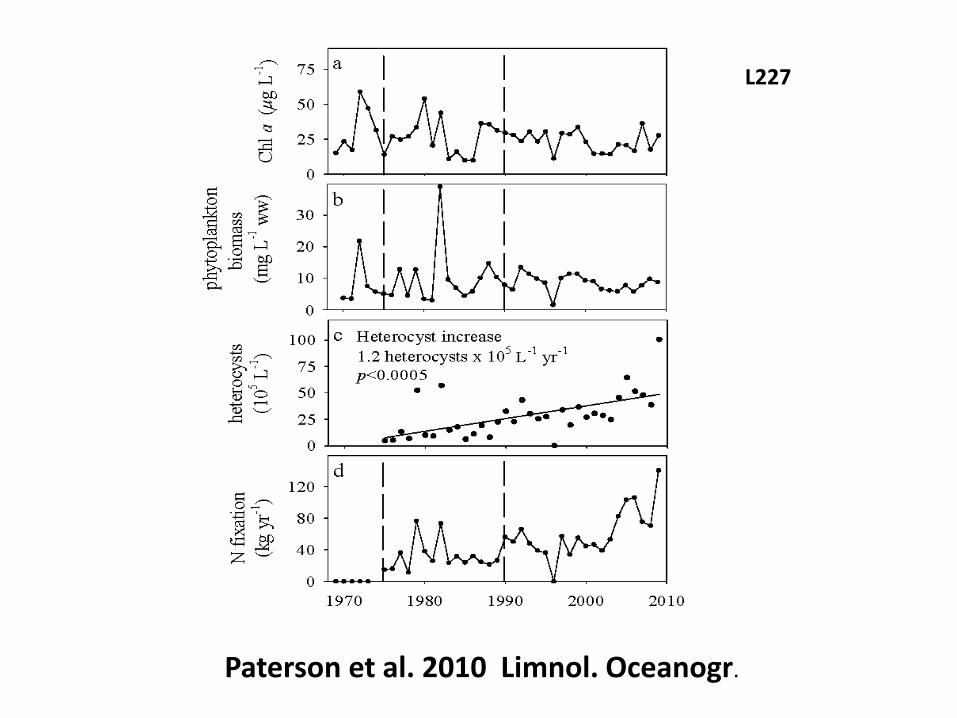
Paterson et al. 2010 Limnol. Oceanogr.
L227


Schindler 2012 Proc Roy. Soc. Lond. B
doi: 10.1098/rspb.2012.1032
Cutting P without cutting N causes rapid decline in chl a in L 304
NO3 declined rapidly (denitrified). Schindler 2012 Proc. Roy. Soc. B

Nfix+Nfrt (110kg/yr)
Year
1975 1980 1985 1990 1995 2000 2005 2010
N (
kg
)
0
50
100
150
200
N F ixation
N Fertiliza tion
Year
1975 1980 1985 1990 1995 2000 2005 2010
N (
kg
)
0
50
100
150
200
N F ixation
N Fertiliza tion
N-fixation is now equal to or greater than the sum of
fertilizer+ n-fixation in the 1980s, and is still increasing.
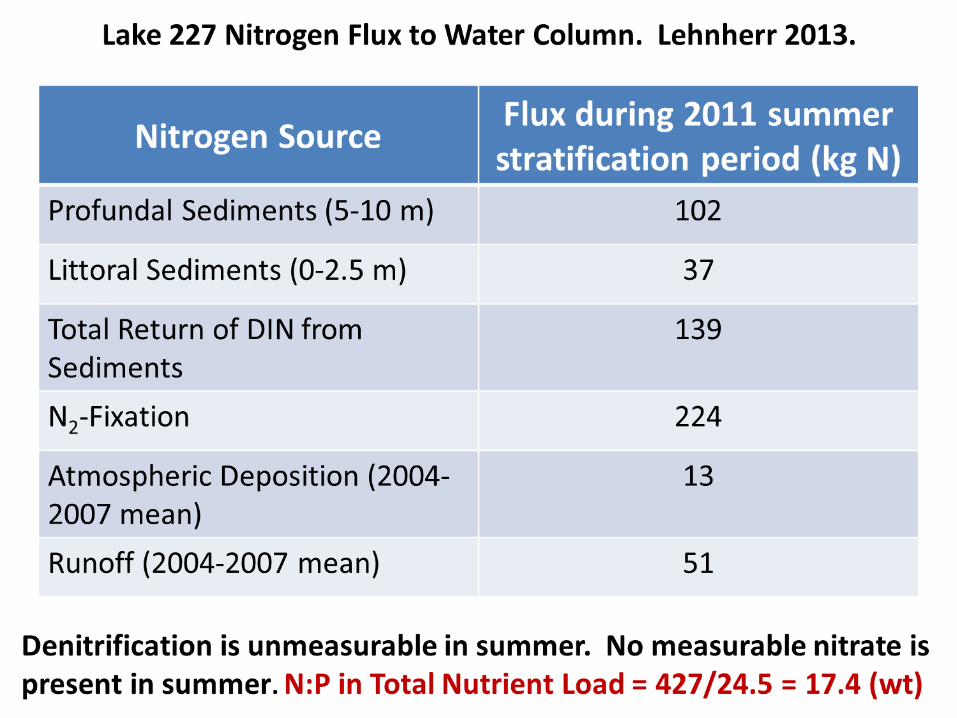
224 in 2011

Dove and Chapra L & O 2015
P mg/m3

Dove and Chapra 2015 Limnol. Oceanogr. 60(2) (in press)
Chl a mg/m3

There are NO examples of where decreasing nitrogen loading has successfully reduced eutrophication of a lake!
There are numerous case histories and experiments showing that P control has reduced eutrophication .Lake ErieLake OntarioLake MichiganLake HuronLake SuperiorLake Onondaga, NYLake Geneva, SwitzerlandLake Lucerne, SwitzerlandLake Zurich, SwitzerlandLake Constance, SwitzerlandLake Norrviken, SwedenLake Malaren, SwedenLake Hjalmaren, Sweden Lake Vattern, SwedenLake Vanern, SwedenLake Mjosa, SwedenGravenhurst Bay, MuskokaKootenay Lake, BCMoses Lake, WashingtonSeveral ELA lakes
Conclusion: P paradigm has
increased in strength, not
eroded!
Schindler 2012 Proc. Roy.
Soc. London (B) 279: 4322-
4333.
Stockholm Archipelago
U of AlbertaPress 2008

Redfield Ratio
16N:1P (moles), 7N:1P (wt)Redfield, A.C., The biological control
of chemical factors in the environment,American Scientist, 1958
The Shootout at the OK N-P
Corral LagoonD. W. Schindler
_____
NPee
ASLO 2015 Redfield Prize Lecture

N
Emperor Nitrogenis very scantilyclad!
N
You are living in a
House of Cards,Boys!
On close inspection,Phoenix turns out To be Icarus.
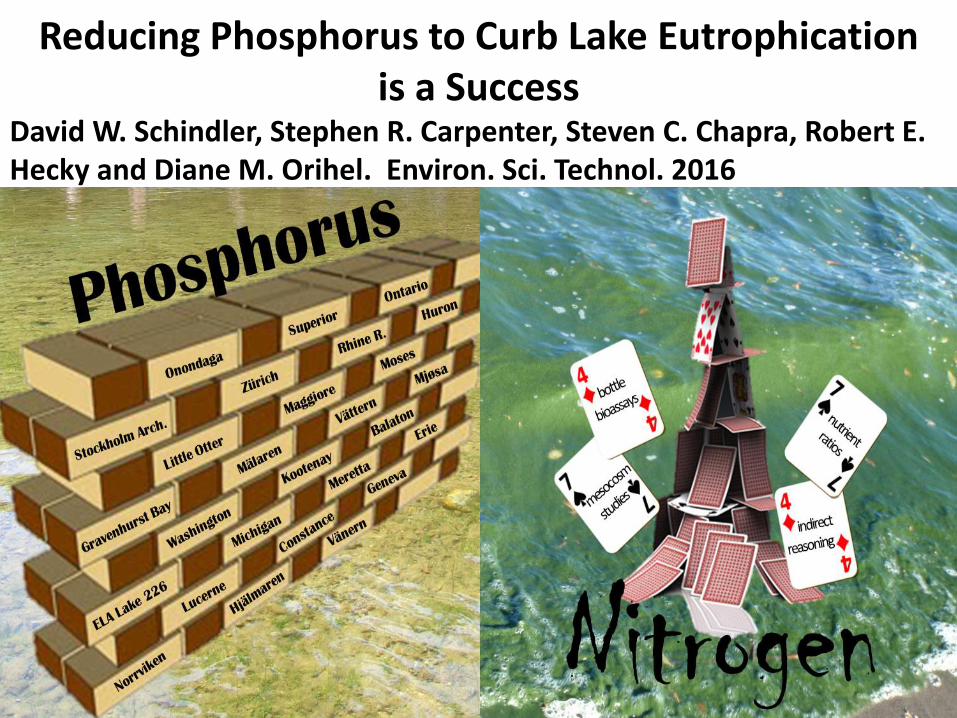
Reducing Phosphorus to Curb Lake Eutrophication is a Success
David W. Schindler, Stephen R. Carpenter, Steven C. Chapra, Robert E. Hecky and Diane M. Orihel. Environ. Sci. Technol. 2016

Short-term nitrogen limitation does not mean that
nitrogen must be controlled, it means the lake has
been overfertilized with phosphorus.
Bottle bioassays tell us nothing about the long-term
(years) biogeochemical processes that correct
deficiencies of nitrogen and carbon in whole lakes.
Meta-analyses do not make them ecosystem scale.
Mesocosms can tell some features of a lake’s
response, but still are too short to estimate slow
biogeochemical processes and successional
changes that require years.
Lessons from the Experimental Lakes

Limnology is plagued by flawed logic
Lake 227 is nitrogen limited for most of the summer
according to bottle bioassays and mesocosms.
But there are no anthropogenic sources of N to control.
Proximate nitrogen limitation does not indicate that N
must be reduced, as commonly interpreted.
Instead, N limitation means that a lake is receiving too
much phosphorus, ie the very opposite of the traditional
interpretation.
Eutrophication requires controlling the ultimate rather
than the proximate limiting nutrient, ie phosphorus.
.

The Costs of a Mistake are Huge
Ex: Baltic Sea“The costs to reduce 15,016 t/yr of P and 133,170 t/yr of N according to HELCOM would be 3300 million Euro/yr (0.45 trillion $US). That is 2900 million Euro/yr higher than the “optimal” strategy advocated in this work. (P alone control = 400 million Euros). Lars Hakanson 2009.

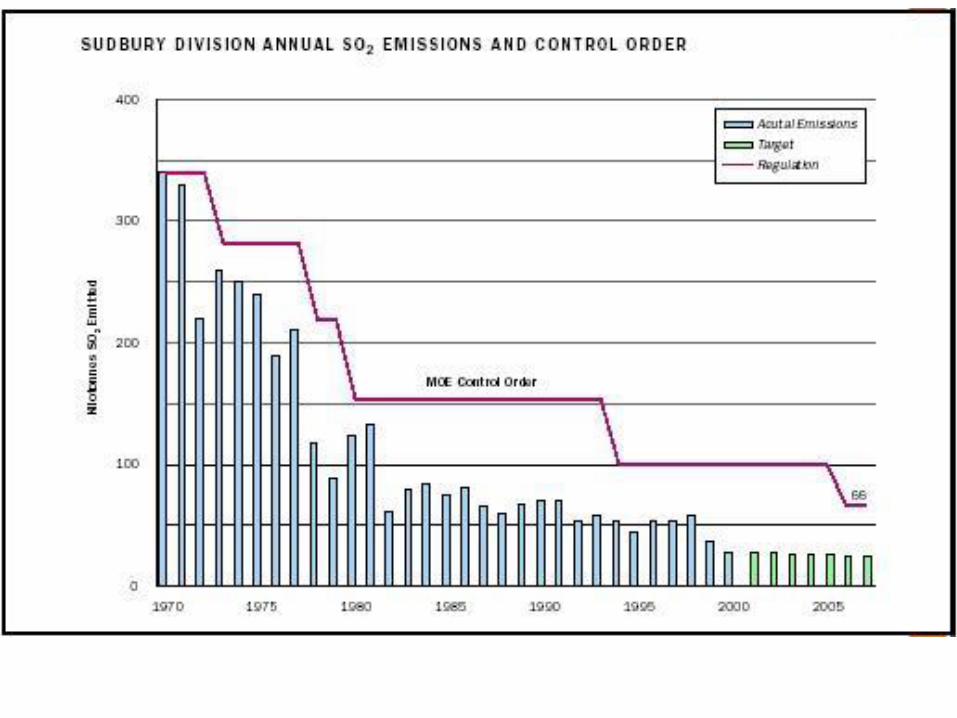
Case 2: Acid Rain
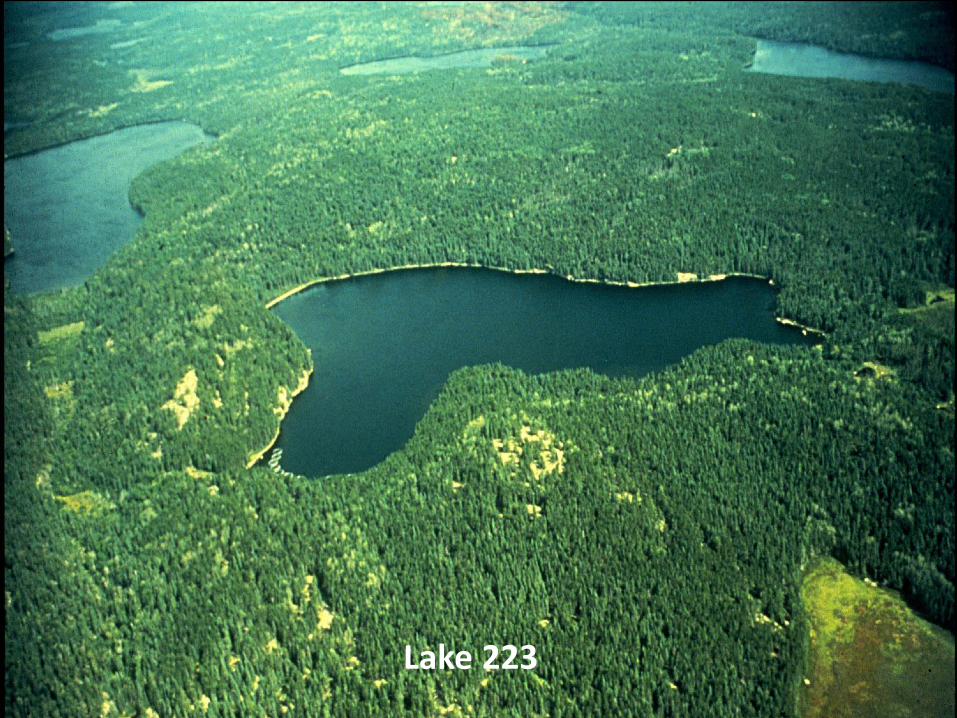
Lake 223
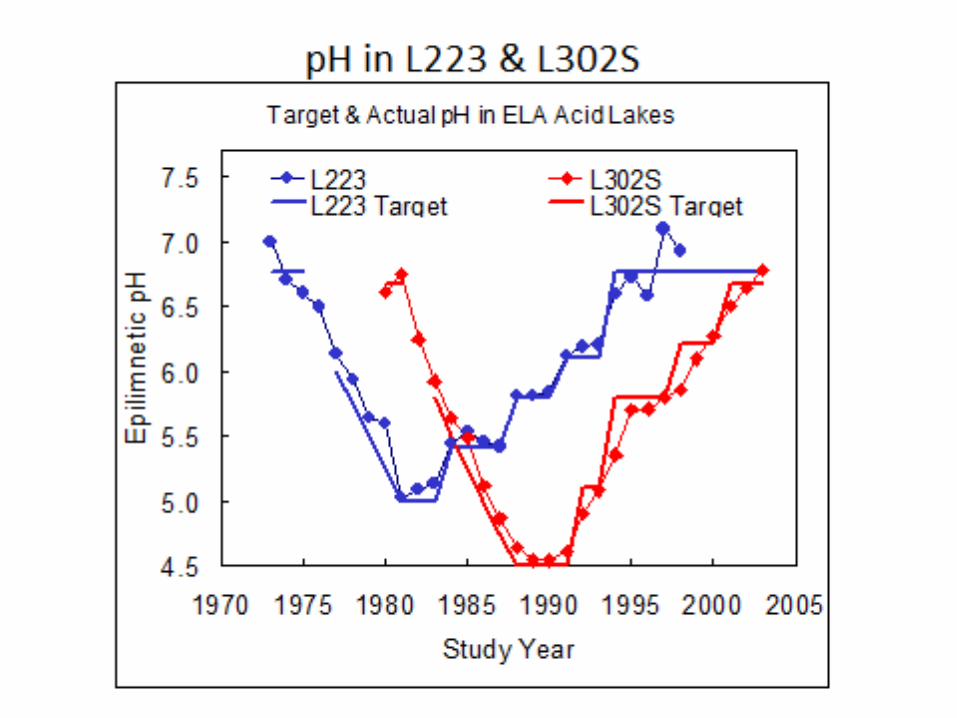

Figure 3. One of the key food species of lake trout eliminated at pH 6 Pimephales promelas (Fathead minnow). Photo by Ken Mills

Mysisrelicta
A second key food species for lake trout, extirpated at pH 6.

Figure 2. Lake trout before and after acidification extirpated key food species in Lake 223, leaving the trout too starved to reproduce.Schindler et al. 1985. Science 228: 1395-1401. Photos by Ken Mills
Schindler et al. 1985 Science

Taxonomic Group 1974-75
pH > 6.5
1981-83
pH 5.0-5.1
% Lost
Planktonic algae 78 73 6
Benthic algae 30 16 47
Zooplankton 31 19 39
Dipteran insects 70 36 51
Benthic
crustaceans
3 0 100
Fish 6 3 50-100
Total species 218 144-147 33-34
Changes in the number of species in various taxonomic
groups in Lake 223 during experimental acidification
Figure 5. Biodiversity in Lake 223, ELA, under pristine conditions and after acidification to pH 5.
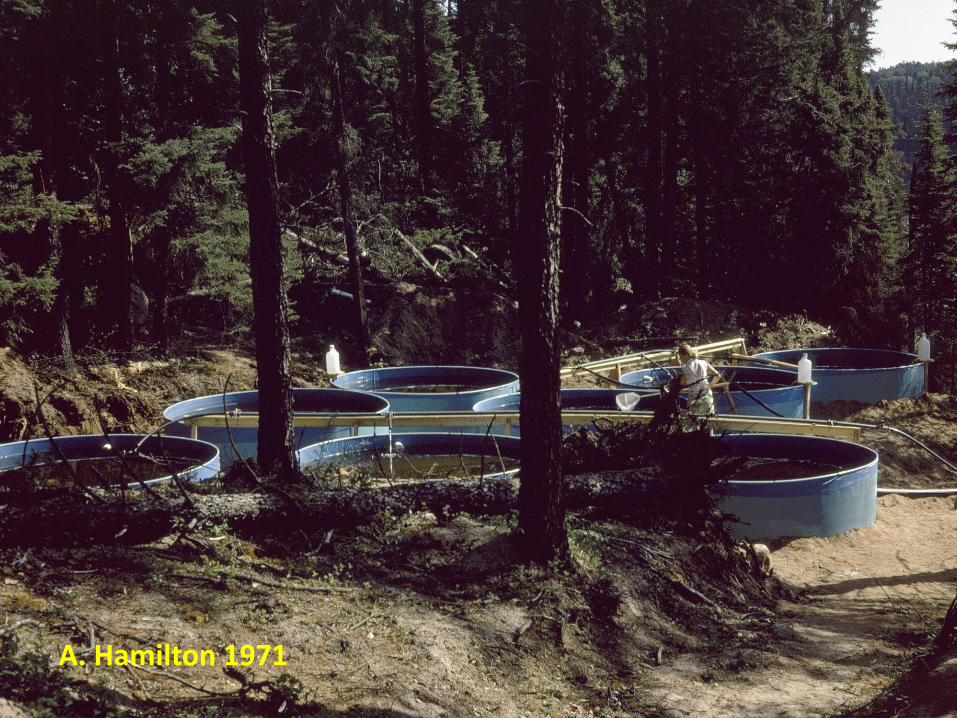
A. Hamilton 1971

y = 0.1998x + 318.91
270
280
290
300
310
320
330
340
350
Ju
lia
n D
ay
Year
Rawson LakeIce-On Dates from 1969 to 2011
( 43 Years )
K. Beaty

y = -0.2419x + 124.35
80
90
100
110
120
130
140
150
Ju
lia
n D
ay
Year
Rawson LakeIce-Off Dates from 1969 to 2012
( 44 Years )

y = 0.3828x + 195.44
120
140
160
180
200
220
240
Nu
mb
er
of
Days
Year
ICE FREE DAYS( 43 Years )

Significant ELA Temp and Precipitation Trends1969-2005
Annual Average temp. 0.045 C/y p<0.005Winter (DJF) temp. 0.105/y p=0.013Summer (Apr-Sept) ppt. 0.3%/y p=0
H+ -2.2%/yNH4- N +1.4%/y DOC +2.9%/ySi -3.1%/y SO4 -1.4%/yCa -1.4%/y Cl -6.4%/yMg -1.8%/yNa -3.3%/y
NParker et al. 2009 CJFAS and ELA unpubl.

Annual precipitation (mm)
400 600 800 1000 1200 1400 1600 1800 2000An
nu
al str
ea
mflo
w /
An
nu
al e
va
po
tra
nsp
ira
tio
n
(mm
)
0
200
400
600
800
1000
1200
1400 EIF evapotranspiration
EIF streamflow
Hubbard Brook evapotranspiration
Hubbard Brook streamflow
Parker et al. 2009


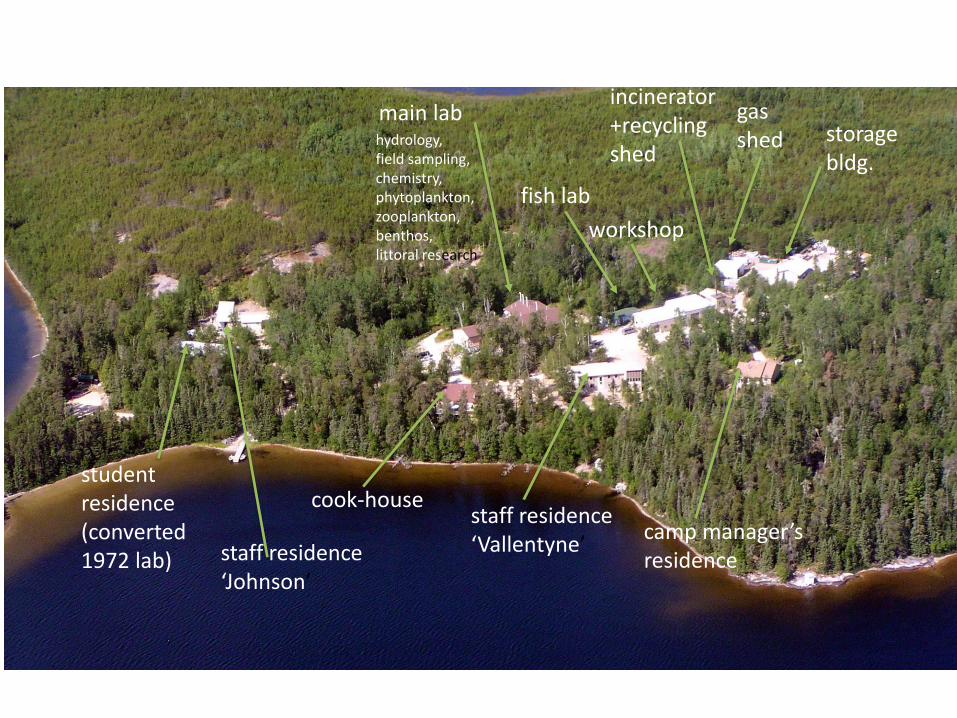
cook-housestaff residence‘Vallentyne’
camp manager’s residence
student residence(converted 1972 lab) staff residence
‘Johnson’
storage bldg.
gas shed
incinerator+recycling shed
workshop
fish lab
main labhydrology,field sampling,chemistry,phytoplankton,zooplankton,benthos,littoral research

Ecosystem Research at ELAWhole Ecosystem Experimental Research at the ELA
0
2
4
6
8
10
12
14
19
68
19
70
19
72
19
74
19
76
19
78
19
80
19
82
19
84
19
86
19
88
19
90
19
92
19
94
19
96
19
98
20
00
20
02
20
04
20
06
Year
Resea
rch
Cate
go
ries
Eutrophication
Radionuclides
Habitat Disruption
Endocrine Disrupters
Acidification Impacts
Cadmium Toxicity
Organic Toxicants
Mercury Deposition
Acidification Recovery
Reservoir Impacts
Biomanipulation
Aquaculture
Long Term Ecological Research & Monitoring
• “Whole-ecosystem” research
• Multidisciplinary, multi-year duration


D.W. Schindler
J.R. Vallentyne
Deck of the BradburyJune 1969