ecological risk assessment for benthic invertebrates · ecological risk assessment for benthic...
TRANSCRIPT

Ecological Risk Assessment for Benthic Invertebrates
Ecological Risk Assessment for Benthic Invertebrates
Gary Lawrence (EVS Environment Consultants)Gary Lawrence (EVS Environment Consultants)

Assessment Endpoint and Representative SpeciesAssessment Endpoint and Representative Species
• Assessment Endpoint –community structure, survival, growth, and reproduction
• (1) “Whole” – examine entire benthic community assemblage
• (2) “Specific” – indicator test species:Chironomus tentans (midge);Hyalella azteca (amphipod);Daphnia magna, Ceriodaphnia dubia(crustaceans);Lumbriculus variegatus (worm)
•• Assessment Endpoint Assessment Endpoint ––community structure, survival, growth, community structure, survival, growth, and reproductionand reproduction
•• (1) “Whole” (1) “Whole” –– examine entire benthic examine entire benthic community assemblagecommunity assemblage
•• (2) “Specific” (2) “Specific” –– indicator test species:indicator test species:Chironomus tentansChironomus tentans (midge);(midge);Hyalella aztecaHyalella azteca (amphipod);(amphipod);Daphnia magna, Daphnia magna, Ceriodaphnia dubiaCeriodaphnia dubia(crustaceans);(crustaceans);Lumbriculus variegatusLumbriculus variegatus (worm)(worm)

Measurement Endpoints and Lines of EvidenceMeasurement Endpoints and Lines of Evidence
Fieldstudies
Site-specifictoxicity
Triad
Chemistry
1. 2.
3.
Community compositionCommunity composition
(a) Long-term laboratory tests (2 species)
(b) Field tests (4 species)(c) Toxicity Identification
(TIE)
(a) Long-term laboratory tests (2 species)
(b) Field tests (4 species)(c) Toxicity Identification
(TIE)
(a) Sediment(b) Water(c) Biota
(a) Sediment(b) Water(c) Biota
SEDIMENT QUALITY
TRIAD
SEDIMENT QUALITY
TRIAD

River Mite: N/AHW-SE000161
H3-SD0437Q2Benttiie Oamnmnlty Stations Witlwut Toxlcfly Testing
Benthrc Commu nity Stations With Towcity TQBiJna
Reach BreaksRiver Mile: 130.32
/ Roads
I 1 Hydrography
Reach 5B r Housatonic Rivor Basin Boundary
Mies: -Codeinlaftmxof eschlD rapi«oiri"ilnn[«iBd'romanct«UJi»ii»<fcf twwlc IrrwrrobfM* ERA.• Button 8A «*• ma/nxM 12 nurtr* tram AaUni * . wd M I imaif 1a MBixMay taicHy any.River Mile: 12B.7
H3-SE000116
I Reach 5C
River Mile: 126.36H3-SE0003S9
River Mile: 125.65H3-SEEC0031
River Mile: 124.5H3-SE000246

Exposure AssessmentExposure Assessment
• Biota tissue, water, and sediment data• Contaminants of Concern from invertebrate-
specific screening: PCBs, dioxins/furans, PAHs, and some metals
• PCBs are the dominant chemical stressor
• Biota tissue, water, and sediment data• Contaminants of Concern from invertebrate-
specific screening: PCBs, dioxins/furans, PAHs, and some metals
• PCBs are the dominant chemical stressor

Habitat/Substrate Change in Primary Study Area
Habitat/Substrate Change in Primary Study Area
0
20
40
60
80
100
A1 A2 A3 1 2 3 4 5 6 7 8 9 R4
Med
ian
Perc
ent F
ines
(%)
0%
2%
4%
6%
8%
10%
Med
ian
TOC
Percent Fines Total Organic Carbon (%)
A
B
Upstream Downstream
A - (1.5 mi below Holmes Rd.)A - (1.5 mi below Holmes Rd.)
B - (Woods Pond Headwaters)B - (Woods Pond Headwaters)
“sandy”
“silty”

Sediment tPCB Concentrations in Benthic Community Samples (log scale)
Sediment tPCB Concentrations in Benthic Community Samples (log scale)
0.1
1
10
100
1000
A1 A2 A3 1 2 3 4 5 6 7 8 9 R4
Location ID
Conc
entra
tion
oftP
CB
(mg/
kg)
Median of 12 replicates
Mean of 12 replicates
Replicate concentration, assuming non-detected values equal tohalf MDL
0.1
1
10
100
1000
A1 A2 A3 1 2 3 4 5 6 7 8 9 R4
Location ID
Conc
entra
tion
oftP
CB
(mg/
kg)
Median of 12 replicates
Mean of 12 replicates
Replicate concentration, assuming non-detected values equal tohalf MDL
Upstream Downstream
-NOTE:-- large variability- PSA elevated above references- gradient observed
PSA RR

Effects Assessment - MethodsEffects Assessment - Methods
• Toxicity tests (laboratory, field, and TIE); Wright State University (Dr. G.A. Burton)
• Benthic community measures • Literature reviews (sediment, tissue)• Concentration-response evaluation
• Toxicity tests (laboratory, field, and TIE); Wright State University (Dr. G.A. Burton)
• Benthic community measures • Literature reviews (sediment, tissue)• Concentration-response evaluation

Laboratory Hyalella Toxicity (42-day Reproduction)
Laboratory Hyalella Toxicity (42-day Reproduction)
72
31213
(no survivors)
8.7
0.28
0.028
NA
0
10
20
30
40
50
60
70
80
T-Control A1 A3 4 7 8A 8
Station Location
Mea
n nu
mbe
r of o
ffspr
ing
[+ S
D]
Negative control (clean
sediment/water
Housatonic River contaminated stations
Field reference stations

Field Daphnia Toxicity Survival (48-h Survival)Field Daphnia Toxicity Survival (48-h Survival)
522(no survivors)
139(no survivors)
7.3
0.95
0.380.0001NA
0
25
50
75
100
LabControl
A1 A3 4 5 7 8
Station Location
Mea
n Su
rviv
al (%
) [+
SD]
Field reference stations
Housatonic River contaminated stations
Sediment tPCB concentration (ppm) in italics

Toxicity Identification Evaluation (TIE)
Toxicity Identification Evaluation (TIE)
• Wright State University. (USEPA protocols)
• Ceriodaphnia dubia• Modified toxicity test
conditions (treatments) and observed changes in toxicity
• Non-polar organics (PCBs, dioxins/furans, PAHs) identified as toxicant group
• Metals, others excluded
•• Wright State University. Wright State University. (USEPA protocols)(USEPA protocols)
•• Ceriodaphnia dubiaCeriodaphnia dubia•• Modified toxicity test Modified toxicity test
conditions (treatments) and conditions (treatments) and observed changes in toxicityobserved changes in toxicity
•• NonNon--polar organics (PCBs, polar organics (PCBs, dioxins/furans, PAHs) dioxins/furans, PAHs) identified as toxicant groupidentified as toxicant group
•• Metals, others excludedMetals, others excluded

Benthic Community StructureBenthic Community Structure
• Taxonomy and PCB chemistry• Investigated individual metrics (e.g., total abundance,
species numbers) and combined metrics (multivariate methods)
• 12 replicates (individual grab samples) collected from each of 13 stations (8 “sandy” + 5 “silty”)
•• Taxonomy and PCB chemistryTaxonomy and PCB chemistry•• Investigated individual metrics (e.g., total abundance, Investigated individual metrics (e.g., total abundance,
species numbers) and combined metrics (multivariate species numbers) and combined metrics (multivariate methods)methods)
•• 12 replicates (individual grab samples) collected from 12 replicates (individual grab samples) collected from each of 13 stations (8 “sandy” + 5 “each of 13 stations (8 “sandy” + 5 “siltysilty”)”)
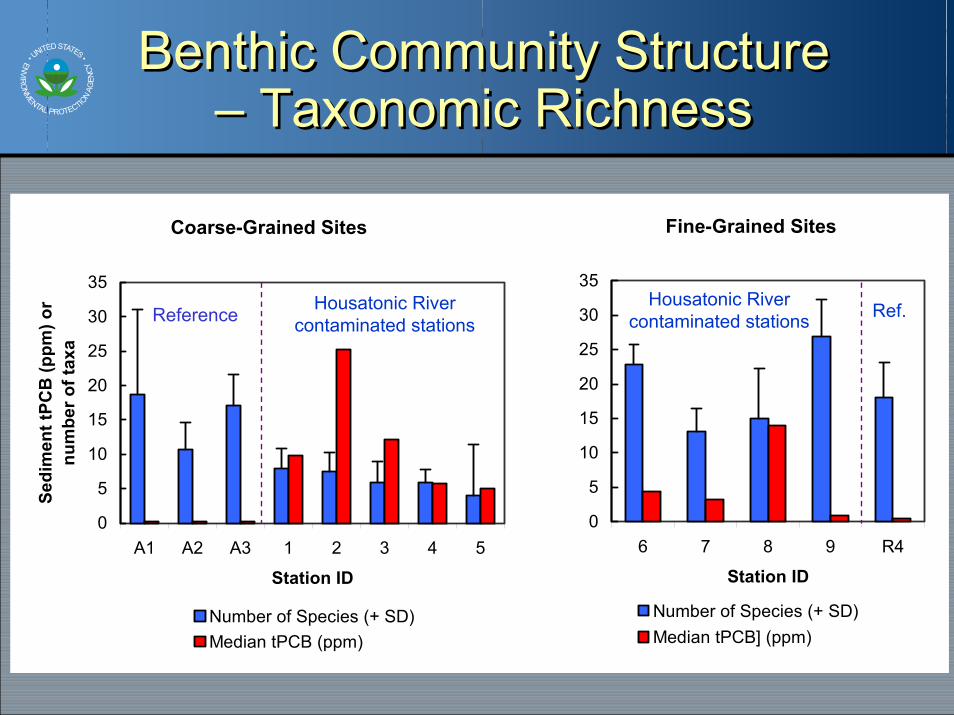
Benthic Community Structure – Taxonomic Richness
Benthic Community Structure – Taxonomic Richness
Coarse-Grained Sites
0
5
10
15
20
25
30
35
A1 A2 A3 1 2 3 4 5
Station ID
Sedi
men
t tPC
B (p
pm) o
r nu
mbe
r of t
axa
Number of Species (+ SD)Median tPCB (ppm)
Fine-Grained Sites
0
5
10
15
20
25
30
35
6 7 8 9 R4
Station ID
Number of Species (+ SD)Median tPCB] (ppm)
Housatonic River contaminated stations
Housatonic River contaminated stationsReference Ref.

Effects Assessment - ChemistryEffects Assessment - Chemistry
• Literature review of tPCB effects in tissue and sediment
• Concentration-response assessment for site-specific studies
• Good agreement between approaches• Threshold level identified: 3 ppm tPCB
• Literature review of tPCB effects in tissue and sediment
• Concentration-response assessment for site-specific studies
• Good agreement between approaches• Threshold level identified: 3 ppm tPCB

Risk Characterization – Lines of Evidence (continued)
Risk Characterization – Lines of Evidence (continued)
Station ID
Coarse-Grained (Sandy) Fine-Grained (Silty) Major Line of Evidence
1 2 3 4 5 6 7 8A 8 9
Toxicity (11 endpoints)
- - - - -
Benthic Community (5 endpoints)
-
Chemistry (7 endpoints)
OVERALL
= major impact = moderate impact = negligible impact

Risk CharacterizationRisk Characterization
Coarse-Grained Sediments
Measurement Endpoints Weighting Evidence of
Harm
Magnitude
C. Chemical Measures
C-1. Water chemisty Low/ Mod Yes Intermediate
C-2. Sediment chemistry Low/ Mod Yes High
C-3. Tissue chemistry Moderate Yes Intermediate
T. Toxicological Measures
T-1. Sediment toxicity (laboratory) Mod/ High Yes High
T-2. Sediment toxicity (field) Mod/ High Yes Intermediate
T-3. Indications of PCB as toxicity driver in TIE Moderate Yes High
B. Benthic Community Measures
B-1. Abundance, richness, and biomass of invertebrates, relative to reference Moderate Yes Intermediate
B-2. Benthic community structure, using multivariate assessment Moderate Yes Intermediate
B-3. Modified Hilsenhoff Biotic Index (MHBI) indicator of organic pollution Moderate No —

Summary of Risks (By Reach)
Summary of Risks (By Reach)
0.1
1
10
100
5A 5B 5C 5D 6
Haz
ard
Quo
tient
.
X
Max
MinMC 25th
MC 75thMeanMedian
3 ppm
CFS
T
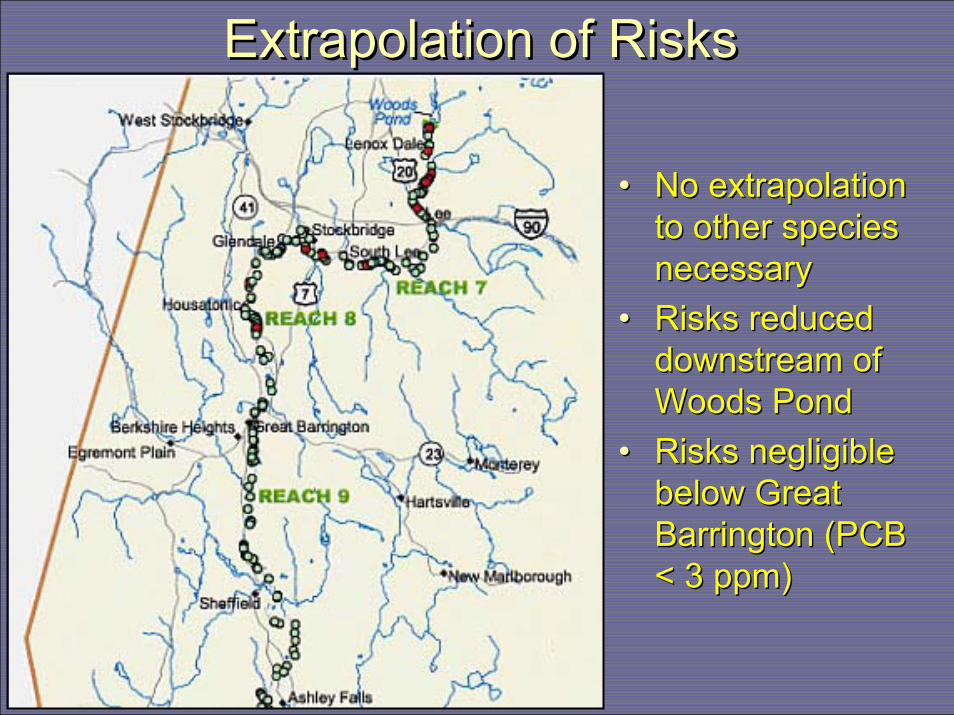
Extrapolation of RisksExtrapolation of Risks
• No extrapolation to other species necessary
• Risks reduced downstream of Woods Pond
• Risks negligible below Great Barrington (PCB < 3 ppm)
• No extrapolation to other species necessary
• Risks reduced downstream of Woods Pond
• Risks negligible below Great Barrington (PCB < 3 ppm)