e.i.i. capital q3cy2014 technical research
DESCRIPTION
Here is E.I.I. Capital institutional report where they forecast every global instrument at the beginning of the 2014 and then updated in June.TRANSCRIPT

E.I.I. Capital Q3CY2014 Technical Research

- 2 -
-
*
__________________________________________________________________________________________
Manesh Patel
+16468639620

- 3 -
Contents 1. Back Ground .............................................................................................................................. - 4 -
2. Global Market .......................................................................................................................... - 5 -
a. North America/South America Market .............................................................................. - 5 -
b. Europe & Surrounding Markets ........................................................................................ - 20 -
c. Middle East Market ........................................................................................................... - 35 -
d. Asia Market ........................................................................................................................ - 42 -
3. Forex Market .......................................................................................................................... - 53 -
4. Future Markets ....................................................................................................................... - 97 -
a. Commodities ....................................................................................................................... - 97 -
b. Energy ............................................................................................................................... - 106 -
c. Bonds/Notes .................................................................................................................... - 112 -
d. Live Stock ......................................................................................................................... - 119 -
e. Metals ............................................................................................................................... - 124 -
e. Misc. ................................................................................................................................. - 131 -
4. Dow 30 ..................................................................................................................................... - 139 -
4. Sector Analysis ...................................................................................................................... - 141 -
a. Main SPDR Sectors ............................................................................................................ - 141 -
b. Supersectors...................................................................................................................... - 154 -
.................................................................................................................................................. - 154 -
c. All Dow Sectors ................................................................................................................. - 155 -
5. S&P500 Analysis .................................................................................................................... - 158 -
6. Disclaimer .............................................................................................................................. - 165 -

- 4 -
1. Back Ground This is the second report for CY2014. The first report was release in January 2014. The first report analyzed what has
occurred in 2013 and forecasted the price movement for various Global instruments for the beginning of 2014. This
report will provide an updated view of current price action for 2014. For each instrument class, the following will be
examined:
Yearly Percentage Movement: All instruments are sorted from the highest to lowest yearly percentage move.
o For the instruments that had huge moves in 2013, we will be looking for pull backs for them.
Depending on the trading plan for each account, we will trade the pull backs (short term) and/or wait for
the pull backs to finalize (long term).
o For instruments that had very little percentage move or consolidated in 2013, we will be looking for -
those instruments to break out of their consolidation patterns. The biggest trends occur when
instruments have been consolidating for a while.
Weekly/Monthly Ichimoku Technical Analysis: The higher times frames will tell when to look for setups on the
lower time frames. If the higher times frames tell us nothing then we will not trade the instrument. We always
want to trade based on the higher timeframes. This is the only way we can get a 3:1 or higher reward/risk ratio.
Without this ratio, there is no way to achieve returns year after year.

- 5 -
2. Global Market
a. North America/South America Market
1. 2013 Yearly Percentage Movement
Country Market Symbol 2014 % Movement
2014 Open Price
Current Price
United States Dow Jones 1.20 16576.66 16775.74 S&P 500 4.75 1848.36 1936.16 Nasdaq 100 5.11 3592.00 3775.56
Canada TSX-TC 10.13 13621.55 15001.61 Mexico $IME-MEX -0.57 42727.09 42485.66
Argentina $IM25-BUE 51.70 5382.21 8164.61 Chile $SPSA- 4.43 3699.19 3863.13 Brazil $IBOV-BSP 6.41 51507.16 54806.64
- 6 -
2. United States Dow Jones Industrial Average
Current Analysis:
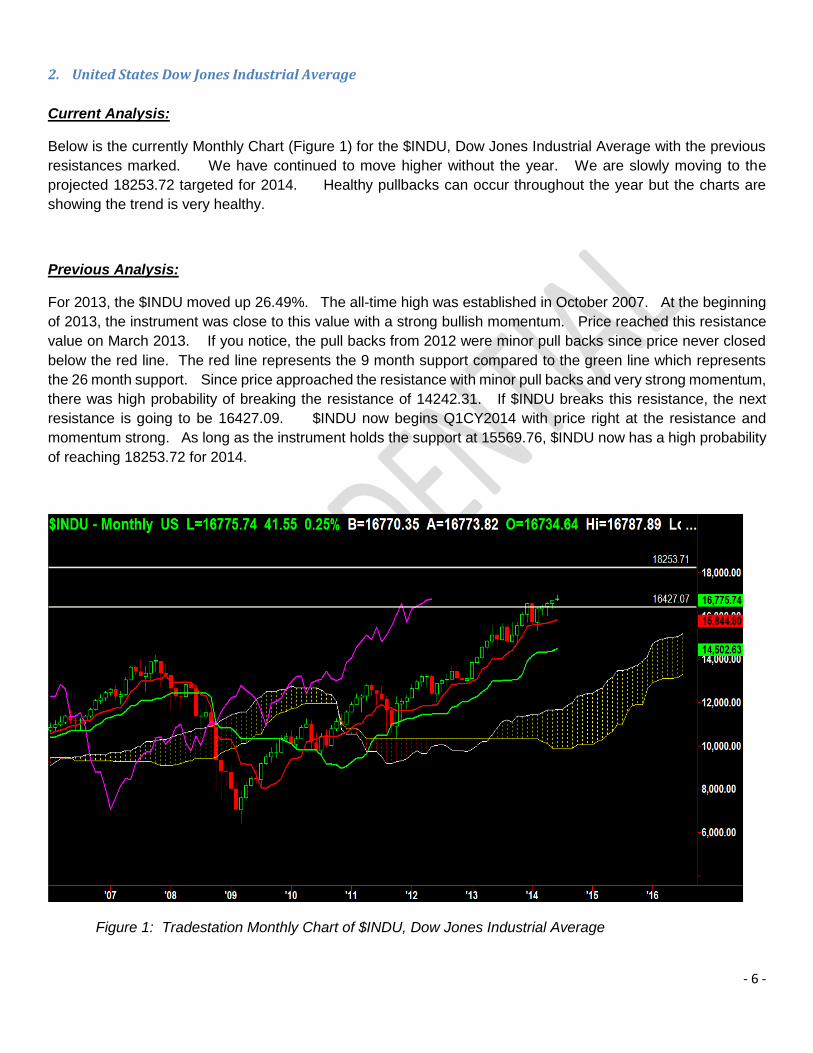
Below is the currently Monthly Chart (Figure 1) for the $INDU, Dow Jones Industrial Average with the previous
resistances marked. We have continued to move higher without the year. We are slowly moving to the
projected 18253.72 targeted for 2014. Healthy pullbacks can occur throughout the year but the charts are
showing the trend is very healthy.
Previous Analysis:
For 2013, the $INDU moved up 26.49%. The all-time high was established in October 2007. At the beginning
of 2013, the instrument was close to this value with a strong bullish momentum. Price reached this resistance
value on March 2013. If you notice, the pull backs from 2012 were minor pull backs since price never closed
below the red line. The red line represents the 9 month support compared to the green line which represents
the 26 month support. Since price approached the resistance with minor pull backs and very strong momentum,
there was high probability of breaking the resistance of 14242.31. If $INDU breaks this resistance, the next
resistance is going to be 16427.09. $INDU now begins Q1CY2014 with price right at the resistance and
momentum strong. As long as the instrument holds the support at 15569.76, $INDU now has a high probability
of reaching 18253.72 for 2014.
Figure 1: Tradestation Monthly Chart of $INDU, Dow Jones Industrial Average

- 7 -
We will be monitoring the daily and weekly charts throughout the quarter to see if the instrument experiences a
pull back to the support or starts to move to the next resistance value. Pull backs to the support levels on the
daily/weekly time frame will be great points for adding positions in the market. Figure 2 shows the current
Daily/Weekly chart for the $INDU. Both time frames are very strong bullish since price is above the cloud and
above the Green line Support.
Figure 2: Tradestation Daily/Weekly Chart of $INDU, Dow Jones Industrial Average
- 8 -
3. United States S&P 500 Index
Current Analysis:
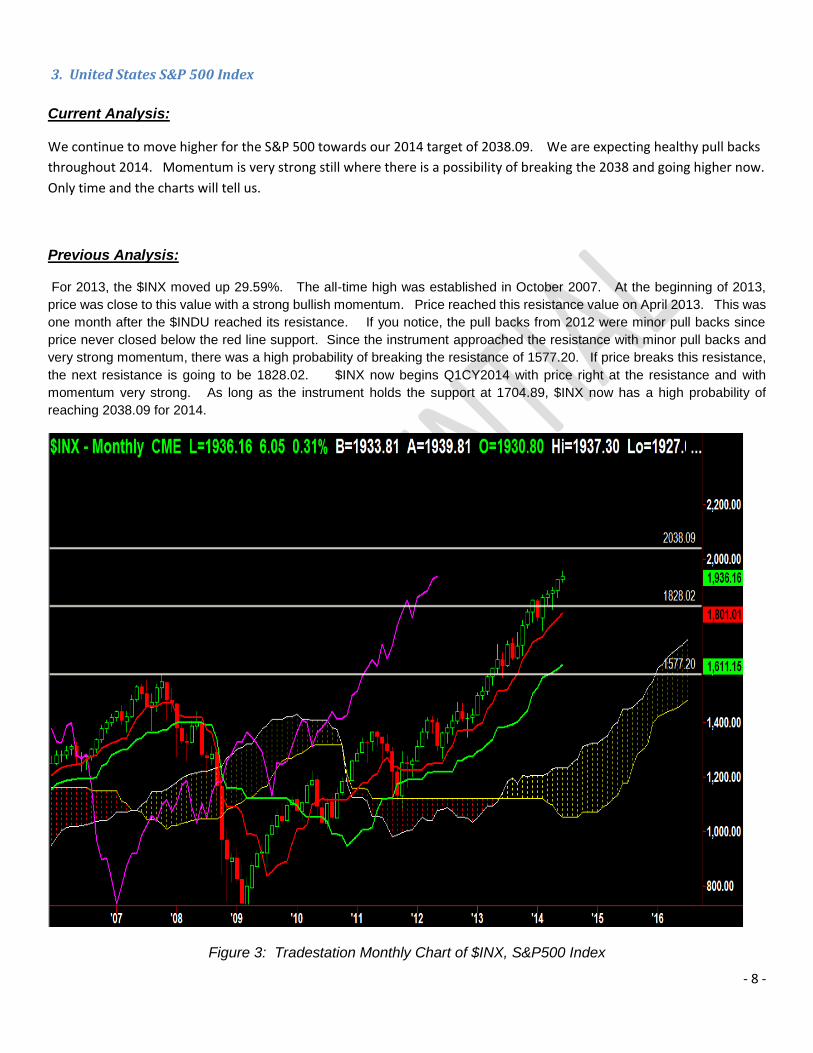
We continue to move higher for the S&P 500 towards our 2014 target of 2038.09. We are expecting healthy pull backs
throughout 2014. Momentum is very strong still where there is a possibility of breaking the 2038 and going higher now.
Only time and the charts will tell us.
Previous Analysis:
For 2013, the $INX moved up 29.59%. The all-time high was established in October 2007. At the beginning of 2013,
price was close to this value with a strong bullish momentum. Price reached this resistance value on April 2013. This was
one month after the $INDU reached its resistance. If you notice, the pull backs from 2012 were minor pull backs since
price never closed below the red line support. Since the instrument approached the resistance with minor pull backs and
very strong momentum, there was a high probability of breaking the resistance of 1577.20. If price breaks this resistance,
the next resistance is going to be 1828.02. $INX now begins Q1CY2014 with price right at the resistance and with
momentum very strong. As long as the instrument holds the support at 1704.89, $INX now has a high probability of
reaching 2038.09 for 2014.
Figure 3: Tradestation Monthly Chart of $INX, S&P500 Index

- 9 -
We will be monitoring the daily and weekly charts throughout the quarter to see if get pull backs to the support or start to
make a move to the next resistance value. Pull backs to support levels on the daily/weekly time frame will be great points
for adding positions in the market. Figure 4 shows the current Daily/Weekly chart for the $INX. Both time frames are
very strong bullish since price is above the cloud and above the Green line Support.
Figure 4: Tradestation Daily/Weekly Chart of $INX, S&P500 Index
- 10 -
3. United States NASDAQ
Current Analysis:
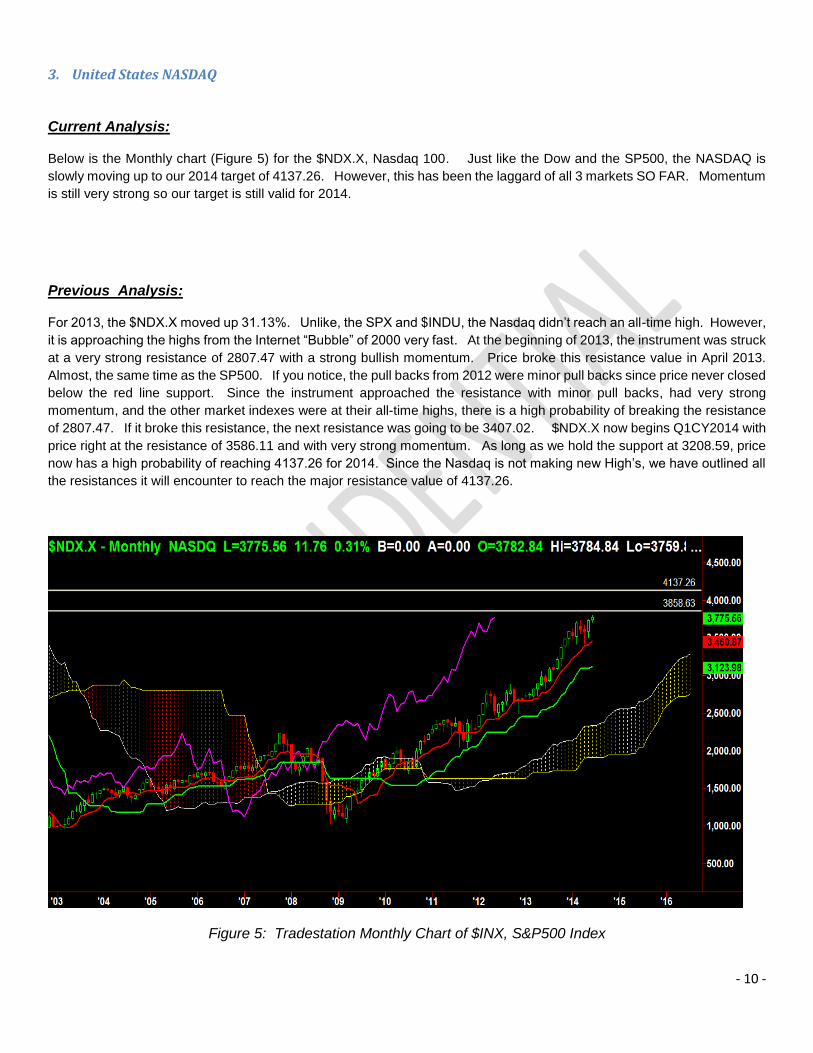
Below is the Monthly chart (Figure 5) for the $NDX.X, Nasdaq 100. Just like the Dow and the SP500, the NASDAQ is
slowly moving up to our 2014 target of 4137.26. However, this has been the laggard of all 3 markets SO FAR. Momentum
is still very strong so our target is still valid for 2014.
Previous Analysis:
For 2013, the $NDX.X moved up 31.13%. Unlike, the SPX and $INDU, the Nasdaq didn’t reach an all-time high. However,
it is approaching the highs from the Internet “Bubble” of 2000 very fast. At the beginning of 2013, the instrument was struck
at a very strong resistance of 2807.47 with a strong bullish momentum. Price broke this resistance value in April 2013.
Almost, the same time as the SP500. If you notice, the pull backs from 2012 were minor pull backs since price never closed
below the red line support. Since the instrument approached the resistance with minor pull backs, had very strong
momentum, and the other market indexes were at their all-time highs, there is a high probability of breaking the resistance
of 2807.47. If it broke this resistance, the next resistance was going to be 3407.02. $NDX.X now begins Q1CY2014 with
price right at the resistance of 3586.11 and with very strong momentum. As long as we hold the support at 3208.59, price
now has a high probability of reaching 4137.26 for 2014. Since the Nasdaq is not making new High’s, we have outlined all
the resistances it will encounter to reach the major resistance value of 4137.26.
Figure 5: Tradestation Monthly Chart of $INX, S&P500 Index

- 11 -
We will be monitoring the daily and weekly charts throughout the quarter for pull backs to the support or start to
make a move to the next resistance value. Pull backs to support levels on the daily/weekly time frame will be
great trading zones for adding positions in the market. Figure 6 shows the current Daily/Weekly chart for the
$NDX. Both time frames are very strong bullish since price is above the cloud and above the Green line Support.
Figure 6: Tradestation Daily/Weekly Chart of $NDX.X, Nasdaq100
- 12 -
5. Canada: Toronto, S&P/TSX Composite
Current Analysis:
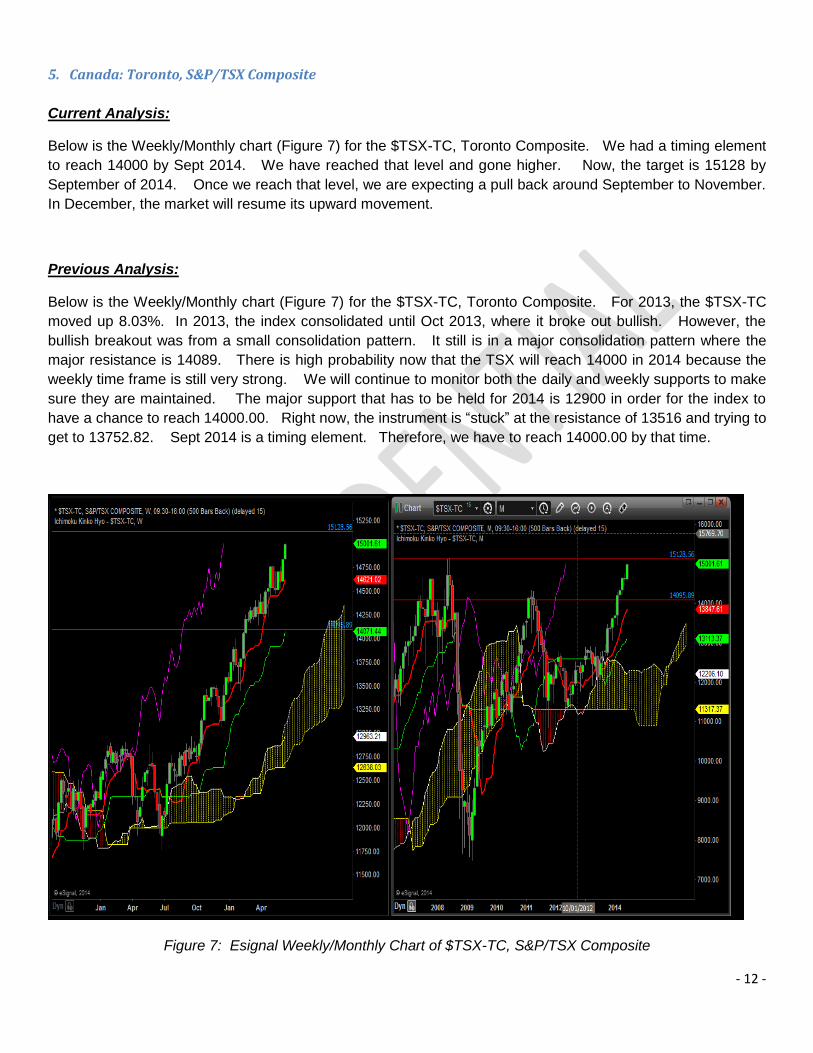
Below is the Weekly/Monthly chart (Figure 7) for the $TSX-TC, Toronto Composite. We had a timing element
to reach 14000 by Sept 2014. We have reached that level and gone higher. Now, the target is 15128 by
September of 2014. Once we reach that level, we are expecting a pull back around September to November.
In December, the market will resume its upward movement.
Previous Analysis:
Below is the Weekly/Monthly chart (Figure 7) for the $TSX-TC, Toronto Composite. For 2013, the $TSX-TC
moved up 8.03%. In 2013, the index consolidated until Oct 2013, where it broke out bullish. However, the
bullish breakout was from a small consolidation pattern. It still is in a major consolidation pattern where the
major resistance is 14089. There is high probability now that the TSX will reach 14000 in 2014 because the
weekly time frame is still very strong. We will continue to monitor both the daily and weekly supports to make
sure they are maintained. The major support that has to be held for 2014 is 12900 in order for the index to
have a chance to reach 14000.00. Right now, the instrument is “stuck” at the resistance of 13516 and trying to
get to 13752.82. Sept 2014 is a timing element. Therefore, we have to reach 14000.00 by that time.
Figure 7: Esignal Weekly/Monthly Chart of $TSX-TC, S&P/TSX Composite

- 13 -

- 14 -
6. Mexico: $IME-MEX
Current Analysis:
Below is the Weekly/Monthly chart (Figure 8) for the $IME-MEX, Mexico Index
Since the beginning of the year, the Mexican exchange has been consolidating. It is still bullish and we are back
at the top of the range right now. The target of reaching 45294.42 by end of 2014 is still valid. We may
experience a pull back to the middle of the consolidation pattern before it breaks the consolidation pattern to
reach the all-time high. We will continue to monitor the Daily/Weekly charts for trade setups since we are
trading within a Monthly Consolidation pattern.
Previous Analysis:
For 2013, the $IME-MEX moved down 1.7%. Jan 2013, the Mexico index reached an all-time high around
45163.48. After reaching this high, it has pull back to a major support of 38852. It held this major support
and keep the bull trend intact. The new major support is 40798.32. If the instrument holds this support, there
is a high probability of price reaching 45163.48. Right now, you may get a pull back to the support of 40798
by end of Feb. After that, it has to make a move to go to retest the high from March onwards. If it doesn’t, the
Mexico index will undergo a major pull back which could led to a trend reversal. If price can reach 45163 by
July 2014, the index will have a high probability of breaking it and the bullish trend will continue.

- 15 -
Figure 8: Esignal Weekly/Monthly Chart of Mexico $IME-MEX

- 16 -
7. Argentina: $IM25-BUE
Current Analysis:
Below is the Weekly/Monthly chart (Figure 9) for the $IM25-BUE, Argentina Index. From the charts below, you
can see that the Argentina market has continued on its strong bullish trend from 2013 into 2014. We were
expecting the 5844 to hold but it only held temporarily. In March, we broke that 5844 completely and the bullish
trend continued. Since we are at an all-time high, we have to continue to monitor the lower timeframes for any
bullish pull backs. It seems like the market will remain in a bullish trend throughout the rest of 2014. Maybe,
2015 will be the year for it to consolidate.
Previous Analysis:
For 2013, the $IM25-BUE moved up 87%. From end of 2010 to Sept 2013, the Argentina market was
consolidating between 2300 and 3800. In Sept 2013, it broke out of the consolidation pattern and made a huge
move up. .The chart shows the current support/resistances. Due to the huge move in 2013, the market has
a high probability of consolidating for 2014 between 4400 and 5800. Right now, the index has a major resistance
around 5484 and major support of 4984.82. These two levels will tell the trader what will happen to this market
once those levels are reached.
Figure 9: Esignal Weekly/Monthly Chart of Argentina $IM25-BUE

- 17 -
8. Chile: $IPSA-SGO, Santiago De Chile
Current Analysis:
Below is the Weekly/Monthly chart (Figure 10) for the $IPSA-SGO, Chile Index. We reached the major support
of 3535 and held it. Price is now trying to get back to 3969.39 which was the major resistance level outlined at
the beginning of the year. Until the resistance or the support is broken, we are in a consolidation pattern.
Previous Analysis:
For 2013, the $IPSA-SGO, moved down 13%. At the beginning of 2013, we reached a lower high of 4614.00.
The Chile market reached an all time high in 2010. After that, it has gone through a major pull back to 3532.
Once it reached this major support, it has not had the bullish momentum to start going higher and breaking minor
resistance values. As a result, price is around the major support which is not good. If the index does not
break the resistance of 3969.39 this year, there is high probability of price breaking the support of 3532. This
can led to the index reversing completely (lower).
Figure 10: Esignal Weekly/Monthly Chart of Santiago Chile, $IPSA-SGO

- 18 -
9. Brazil: $IBOV-BSP IBOVESPA
Previous Analysis:
Below is the Weekly/Monthly chart (Figure 11) for the $IBOV-BSP, Brazil Index. The previous support at 50546
didn’t hold but the support at 45000 did hold. As a result, we are in a consolidation pattern. If the support at
50546 held at the beginning of the year, we had a good chance of breaking out a major consolidation pattern.
However, it didn’t. Therefore, we are in a consolidation pattern until the charts tell us we aren’t.
Current Analysis:
For 2013, the $IPSA-SGO, moved down 15.9%. In 2010, we retested the high for the Brazil market. After that
point, the index has consolidated going lower. The resistances are moving down along with the supports.
Currently, the instrument is at a major support of 50590. If this instrument has any chance of going higher, it
has to hold this support and start to make a move to go to the resistance of 56611.36 and break it. If the support
is not held, the instrument will continue to move lower into 2014 to possibility get back to 35000.
Figure 11: Esignal Weekly/Monthly Chart of Brazil $IBOV-BSP

- 19 -

- 20 -
b. Europe & Surrounding Markets
Country Market Symbol 2014 % Movement
2014 Open Price
Current Price
UK $UKX-FTSE 0.43 6749.09 6777.85 Ireland $IEQP-DUB 8.35 6091.71 6600.48
Germany $DAX-XET 3.78 9552.16 9912.87 France $PX1-EEB 5.76 4295.95 4543.28 Spain $IBC-MAC 12.07 9916.70 11113.70
Portugal $PSITR-EEB 12.89 12947.26 14616.39 Italy $FTSEMIB-MIL 16.86 18967.71 22165.97 Swiss $SMI-SWX 5.50 8202.98 8653.76
Austria $ATX-VIE 0.39 2546.54 2556.36 Belgium $BEL20-EEB 7.80 2923.82 3151.84
Netherlands $AEX-EEB 3.05 401.79 414.05 Greece $SAGD-ATH 9.57 1683.53 1844.59
Czech Republic $PX-PRA 4.42 989.04 1032.75 Hungary $BUX-BUD 1.25 18564.08 18796.52 Poland $WIG20-WAR 2.95 2400.98 2471.82
Romania $BET-BVB 6.48 6493.79 6914.76 Slovakia $MICEX10-MOS 1.84 3266.42 3326.47
Israel EQTL-TAE 14.97 5417.00
South Africa CFR-JSE 5.78 10458.00 11062.00 Turkey $DJIMTR 8.57 4104.37 4456.23 Russia $MICEX-MOS -0.19 1504.08 1501.18

- 21 -
1. United Kingdom: $UKX-FTSE
Current Analysis:
Below is the Weekly/Monthly chart (Figure 12) for the $UKX-FTSE, United Kingdom Composite. The UK stock
market has been consolidating since for over 1 year now. It can’t seem to break the 6878 resistance level. Until
that resistance is broken, it will continue to consolidate. We will continue to monitor the lower timeframes at
this resistance to see if we can break it.
Previous Analysis:
For 2013, the $UKX-FTSE, moved up 24.42%. At the beginning of the 2013, the UK market broke out of a
consolidation pattern by breaking the resistance at 6000. The index reached the high of 6800 and then the
market has consolidated from that resistance level. The support was been 6442. The market is slowly
approaching its all-time highs of 6879.45. As long as the instrument holds the support of 6442, it will have a
high probability of reaching 6879. However, the timing elements show that it has a high probability of reaching
this high in Jan/Feb. After that, the timing elements are showing it can pull back to 6442 or 6052 by Sept 2014.
The lower time frames will confirm if this will happen.
Figure 12: Esignal Weekly/Monthly Chart of UK FTSE: $UKK-FTSE

- 22 -
- 23 -
2. Germany: $DAX-XET
Current Analysis:
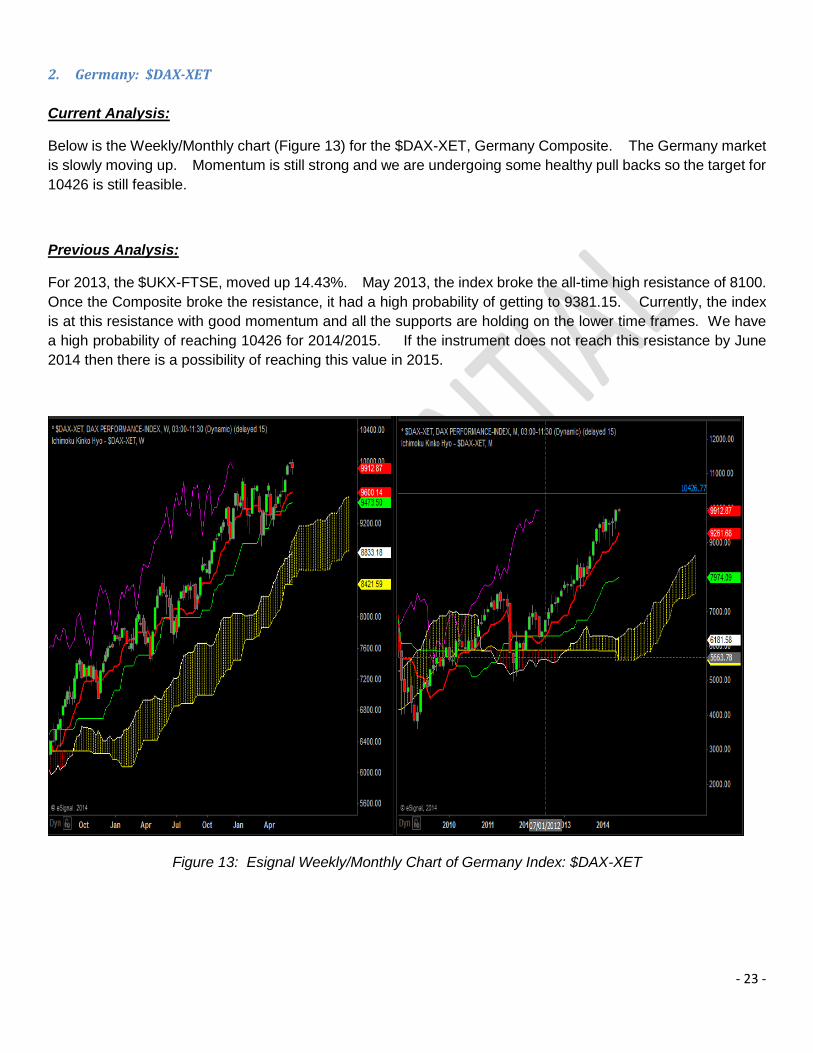
Below is the Weekly/Monthly chart (Figure 13) for the $DAX-XET, Germany Composite. The Germany market
is slowly moving up. Momentum is still strong and we are undergoing some healthy pull backs so the target for
10426 is still feasible.
Previous Analysis:
For 2013, the $UKX-FTSE, moved up 14.43%. May 2013, the index broke the all-time high resistance of 8100.
Once the Composite broke the resistance, it had a high probability of getting to 9381.15. Currently, the index
is at this resistance with good momentum and all the supports are holding on the lower time frames. We have
a high probability of reaching 10426 for 2014/2015. If the instrument does not reach this resistance by June
2014 then there is a possibility of reaching this value in 2015.
Figure 13: Esignal Weekly/Monthly Chart of Germany Index: $DAX-XET

- 24 -
3. France: Paris: CAC40 $PX1-EEB
Current Analysis:
Below is the Weekly/Monthly chart (Figure 14) for the $PX1-EEB, Paris Composite. After hesitating around the
resistance level of 4325.95, the Paris stock market broke it. Since then, it has slowly started to move to the
next major resistance of 4675 which is our 2014 target. We are expecting some time of pull back before it
reaches this level but that has healthy for the trend. The momentum has been so strong that there is a high
probability that the Paris market could reach close to 5000 by the end of this year. We will monitor the lower
time frames after we reach 4675 to see what will happen around this major resistance level.
Previous Analysis:
For 2013, the $PX1-EEB, moved up 15.98%. In 2013, we broke a minor resistance of 3568 and then trend
higher to a major resistance value of 4331.61. There is high probability that this resistance value will hold and
the market will start to pull back after the 2013 bullish movement. The current major supports are 3970 and
3639. The timing elements show the Paris market will consolidate or move lower this year. If we break the
resistance of 4331.61 then the major consolidation pattern is over and it can start to make a move to retest the
highs over the next couple of years. The next resistance for this scenario would be 4663.11. We will monitor
the lower time frames to see what is going to happen at this major resistance level.

- 25 -
Figure 14: Esignal Weekly/Monthly Chart of France Index: Paris CAC40 $PX1-EEB
4. Italy: $FTSEMIB-MIL
Current Analysis:
Below is the Weekly/Monthly chart (Figure 15) for the $FTSEMIB, Paris Composite. We broke the small
consolidation pattern resistance of 19514 and now we are approaching the major resistance of the big
consolidation pattern of 23534. The timing elements show we will reach this value by around September. After
that, there is a high probability of pull back down to the middle of the consolidation pattern (min) by February
2015. We will monitor the lower timeframes once we reach the major resistance value:
Past Analysis:
For 2013, the $FTSEMIB, moved up 14.3%. In 2009, the Italian market drastically dropped. After that it
consolidated and establish a bottom around support 12347. The stop of the consolidation pattern is 22000.
Currently, the Italian market is stuck between 19514 and 17191. We have to wait to see what happens at these
level to see what it is going to do. If it breaks the support then it will have a high probability of retesting and
possibility breaking the lows since it never retested the high of the consolidation pattern. If the instrument breaks
the resistance then the probability to retest the top of the consolidation pattern around 22000 will be high.

- 26 -
Figure 15: Esignal Weekly/Monthly Chart of Italy Index: $FTSEMIB
5. Spain: $IBC-MAC
Current Analysis:
Below is the Weekly/Monthly chart (Figure 16) for the $IBC-MAC, Spain Composite. After consolidating around
the major resistance of 9050, price broke the resistance to move higher. This movement, broke the long term
trend downward to establish a major consolidation pattern now. The top of the consolidation pattern is 11362
which was outlined on the first report. Timing elements show we will reach this value by end of August. At
that point, a pullback will start to occur. If 11362 holds instead of 12000, we will have a lower top where the
overall yearly trend is still bearish since we will have all the pivots on a monthly basis going lower. We will be
monitoring the lower timeframes once we reach this time frame to determine what will happen at this price.
Past Analysis:

- 27 -
For 2013, the $IBC-MAC, moved up 18.93%. Since September 2013, the index has moved higher after a minor
consolidation pattern. However, the market is still moving down long term. The supports have gone lower and
the resistances have gone lower.
Figure 16: Esignal Weekly/Monthly Chart of Spain Index: $IBC-MAC

- 28 -
6. Greece: $SAGD-ATH
Current Analysis:
Below is the Weekly/Monthly chart (Figure 17) for the $SAGD-ATH, Greece Composite. The Greece stock
market is stuck at the major resistance level of 1951.79. There is high probability now that it can possible
break this resistance level since we have been consolidating around this level instead of moving down which
was the natural trend. Timing elements show that it has a high probability of breaking this resistance and
reach 2242 by end of September. We will monitor the lower time frames to confirm this price/time elements.
Past Analysis:
For 2013, the : $SAGD-ATH, moved up 29.2%. Since Nov 2007, the Greece market has trended down and
established a bottom May 2012 at a major support of 668. Since that time, the index has pulled back upwards
to the bottom of the monthly cloud. If the resistance at 1836 holds and starts to go down to the support of
1462/1220, the bearish momentum is still very strong. It will have a high probability of breaking the 1220
support if the resistance of 1836 does not get broken. If it breaks this resistance, the major pull back will go
to 2255. The Greece market has to April 2014 to break the resistance.

- 29 -
Figure 17: Esignal Weekly/Monthly Chart of Greece Index: $SAGD-ATH
7. Switzerland: $SMI-SWX
Past Analysis:
Below is the Weekly/Monthly chart (Figure 18) for the $SMI-SWX, Switzerland Composite. The Swiss stock
market has been strong and slowly moving to the 2014 target of 8804. Momentum is still very strong to a
point, it can moving higher to retest the all-time high. Once we get to 8804, we will monitor the lower
timeframes to see what will happen around this price.
Current Analysis:
For 2013, the $SMI-SWX, moved up 17.6%. Since 1998, the Switzerland market has consolidated between
4719 and 8319. August of 2011, the index hit the major support again and bounced off it. From the
beginning of 2013, a huge movement up took place to take price to the top of the consolidation pattern again.
May 2013, the index hit the top of the consolidation pattern and then market decided to consolidate within a
small consolidation pattern after that point. At the beginning of 2014, the index was right at the major
resistance again. During the small consolidation pattern, it had a chance to go lower but it didn’t. As a result,
the probabilities are high for the market to break this resistance value and move higher to the next resistance
level of 8821. We will monitor the lower timeframes around this resistance value to see what will happen.
Once we get a confirmation of the break of the resistance value, we can look for trade setup on the lower
timeframes.

- 30 -
Figure 18: Esignal Weekly/Monthly Chart of Switzerland Index: the $SMI-SWX

- 31 -
8. Turkey: $DJIMTR
Current Analysis:
Below is the Weekly/Monthly chart (Figure 19) for the DJIMTR, Turkey Composite. The Turkey stock market
held the major support at 3856 and now trying to go back to the major resistance at 4662.42. We are
expecting pull back before it reaches this value since it has not really pulled back since it bounced off the major
support
Past Analysis:
For 2013, the DJIMTR, moved down 10.93%. The Turkey market has been trending up since Sept 2010 when
it broke the major resistance of 3250. May 2013, the index reached the high of 4800. This is now the major
resistance. Since that time, the index has consolidated in a small pattern. The bullish trend is still good
since the major support of 3881 has held. Until, the index breaks this support, a major pullback cannot occur.
In order for the bullish trend to continue, price has to break the resistance value of 4309. Until one of these
values is broken, there is not trade setup.
Figure 19: Esignal Weekly/Monthly Chart of Turkey Index: the DJIMTR

- 32 -
9. Russia: $MICEX-MOS
Current Analysis:
Below is the Weekly/Monthly chart (Figure 20) for the $MICEX-MOS, Russia Composite. The Russian
stock market is continuing to consolidate which was established since 2011. We are approaching the major
resistance of 1537.41. We will monitor the lower timeframes once we reach this resistance value.
Past Analysis:
There is not enough data for an Ichimoku monthly chart so we are going to use the Weekly as the highest time
frame. The Russia market has been consolidating. The top of the range is 1537. The bottom of the range
has been moving higher slowly. Oct 2013, the index reached the major resistance and bounced off it. For
2014, the market is going to consolidate down to the bottom of the consolidation. The major support right now
is 1418 and the bottom of the consolidation pattern is 1280. If the bottom of the consolidation moves higher,
most likely the bottom will be around 1356.
Figure 20:: Esignal Weekly/Monthly Chart of Russia Index: the $MICEX-MOS

- 33 -
10. Israel: EQTL-TAE
Current Analysis:
Below is the Weekly/Monthly chart (Figure 21) for the EQTL-TAE, Israel Composite. Israel stock market has
continued it journey upwards through 2014. It is hesitating around the 6000 level but right now, we are above
this value. If we close above this value this month then this market can continue to go higher throughout the
rest of the year. We are going to monitor the lower time frames right now to see what will happen this month.
If we hold this resistance value 6000, it could mark the beginning of the top of a consolidation pattern.
Past Analysis:
For 2013, the Israel market moved up 61%. From 2009 to March 2013, the Israel market has consolidated
between 2180 and 3750. After breaking the resistance of 3750, a bullish trend has occurred going all the way
up to 6000. The bullish trend still has strong momentum and will exist as long as price stays above the support
at 4140.00. For 2014, price may pull back to 4140 or it may continue to go up if it maintains the minor support
at 4800. The weekly time frame is showing that a pull back is highly to occur.. Lower time frames will give us
an idea on what may happen in the next couple of months.
Figure 21:: Esignal Weekly/Monthly Chart of Israel Index: the EQTL-TAE

- 34 -

- 35 -
c. Middle East Market
Country Market Symbol 2014 % Movement
2014 Open Price
Current Price
Saudi $TASI-SAU 13.841 8535.599 9716.994 Dubai $DFMGI-DFM 36.78 3369.81 4609.28
Abu Dhabi $ADI-ADX 12.62 4290.30 4831.57 Bahrain $BSEX-BAH 16.69 1248.86 1457.33 Kuwait $15-KUW 9.8 1068.4 1173.2 Oman $MSM30-MSM 0.90 6834.56 6896.28 Qatar $GNRI-DSM 23.06 10379.59 12773.20

- 36 -
1. Saudi Arabia: $TASI-SAU
Current Analysis:
Below is the Weekly/Monthly chart (Figure 22) for the $TASI-SAU, Saudi Arabia. The Saudi Arabia stock
market is extremely strong right now. It never hesitated at the major resistance of 8797 which we had outlined
at the beginning of the year. Instead, it broke through there and has continued to go higher without a pull back
at all. We are getting to our next resistance value of 10152. It is healthy to have pull backs in major trends
in order for them to keep on doing. This market has not had a pullback yet which is concerning!
Previous Analysis:
For 2013, the Saudi Arabia market moved up 22.17%. February 2006, the Saudi market reached it high at
20900. After that the market has gone down until March 2009 to 4180. Since that point, the index has slowly
moved up. From the beginning of 2013, the index has moved up drastically and it broke the major resistance
of 7903.73. At the beginning of 2014, the index is almost at the next resistance level of 8800.00. If it breaks
that level, price will go to 10152 which is a major resistance level. Once the index gets to the 8800 resistance
level, we have to observe the lower time frames to determine if it will break it, go to the next level, bounce off it
to start a consolidation pattern, or start to trend lower.
Figure 22 : Esignal Weekly/Monthly Chart of Saudi Arabia Index: the $TASI-SAU

- 37 -

- 38 -
2. Dubai: $DFMGI-DFM
Current Analysis:
Below is the Weekly/Monthly chart (Figure 22) for the $DFMGI-DFM, Dubai market. The Dubai stock market
continued to move up to 5200 and finally held the resistance level at this mark. We will monitor the lower time
frames to see how far the pull back will occur. We are currently at one major support level now. It breaks this
level, it has a high probability of pulling back to 4400 level.
Previous Analysis:
For 2013, the Dubai market moved up 107.67%. In 2013, the Dubai market was consolidating within a tight
range. In 2013, the market broken out of the consolidation pattern and started a major bullish trend. The
market double in one year! It is continuing to move up and does not show any sign of a pull back at all right now.
All the lower time frames are bullish and the support/resistances are going higher. It is dangerous to add a new
bullish position right now. We have to wait for a major pull back to occur to enter the market. Right now, all
the Ichimoku supports are pointing up indicating that a support has not been established. Once the Ichimoku
support flattens out, we will look for price to reach these pull back levels.
Figure 23: Esignal Daily/Weekly Chart of Dubai Index: the $TASI-SAU

- 39 -

- 40 -
3. Abu Dhabi: $ADI-ADX
Current Analysis:
Below is the Daily/Weekly chart (Figure 24) for the $ADI-ADX, Abu Dhabi market. The Abu Dhabi market
continued on its bullish momentum all the way to 5250 where it has held so far. We are going through a pull
back now. This is not a major pull back yet. Only time will tell us if this is a major pull back. We have
marked off the support/resistances on the weekly chart below.
Previous Analysis:
For 2013, the Abu Dhabi market moved up 63%. The Abu Dhabi market is very similar to the Dubai market. It
consolidated in 2012 and started a major bullish trend in 2013. 2014 started another push upwards with no
signs of it stopping at all. The same strategy that will be used for Dubai will be used for the Abu Dhabi market.
Figure 24: Esignal Daily/Weekly Chart of Dubai Index: the $ADI-ADX

- 41 -

- 42 -
d. Asia Market
Country Market Symbol 2014 % Movement
2014 Open Price
Current Price
China $000002-SHG -2.09 2214.49 2168.18 Hong Kong $HSI-HKG 0.05 23306.39 23319.17
Korea $200-KOR -2.08 264.24 258.75 Japan $NI225-NKI -7.51 16147 14933
Singapore $SGS100-FTSE 3.12 5887.48 6071.44 Malaysia $200-FTSB 0.52 1866.96 1876.74
Indonesia $COMPOSITE-JKT 15.27 4274.18 4926.66 Thailand $SET-SET 12.11 1298.71 1456.02
Philippine $ALL-PHS 12.45 3614.32 4064.19 Vietnam AAA-HNX 6 17700 18700
India - Sensex $SENSEX-BOM 19.17 21170.68 25228.17 Aust. $XJO-ASX 1.0 5352.2 5405.1
New Zealand $NZ50G.X-NZX 9.15 4737.01 5170.51
- 43 -
-
1. China: $000002-SHG
Current Analysis:
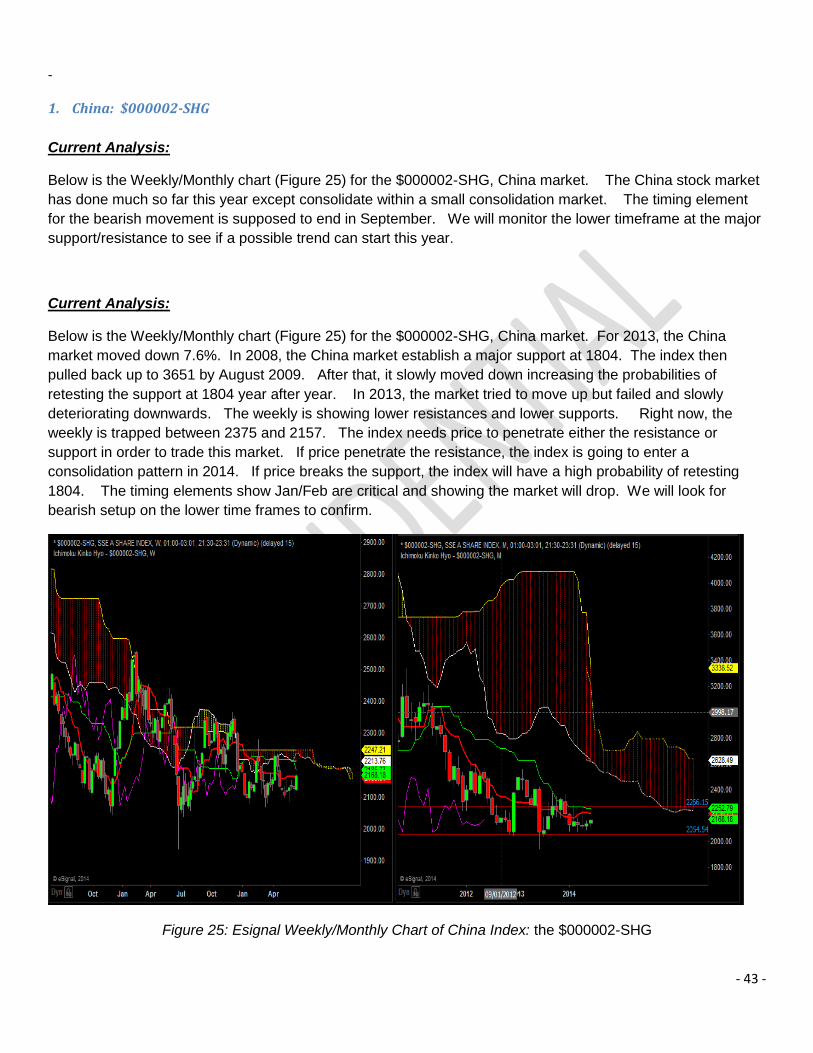
Below is the Weekly/Monthly chart (Figure 25) for the $000002-SHG, China market. The China stock market
has done much so far this year except consolidate within a small consolidation market. The timing element
for the bearish movement is supposed to end in September. We will monitor the lower timeframe at the major
support/resistance to see if a possible trend can start this year.
Current Analysis:
Below is the Weekly/Monthly chart (Figure 25) for the $000002-SHG, China market. For 2013, the China
market moved down 7.6%. In 2008, the China market establish a major support at 1804. The index then
pulled back up to 3651 by August 2009. After that, it slowly moved down increasing the probabilities of
retesting the support at 1804 year after year. In 2013, the market tried to move up but failed and slowly
deteriorating downwards. The weekly is showing lower resistances and lower supports. Right now, the
weekly is trapped between 2375 and 2157. The index needs price to penetrate either the resistance or
support in order to trade this market. If price penetrate the resistance, the index is going to enter a
consolidation pattern in 2014. If price breaks the support, the index will have a high probability of retesting
1804. The timing elements show Jan/Feb are critical and showing the market will drop. We will look for
bearish setup on the lower time frames to confirm.
Figure 25: Esignal Weekly/Monthly Chart of China Index: the $000002-SHG

- 44 -
2. Hong Kong: $HSI-HKG
Current Analysis:
Below is the Weekly/Monthly chart (Figure 26) for the $HSI-HKG, Hong Kong market. The Hong Kong market
is very similar to the Chinese market. It has just consolidated. The only difference is that the Chinese market is
bearish long term since it is below the cloud but the Hong Kong market is bullish long term. Therefore, we will
be monitoring Hong Kong for a bullish breakout and the Chinese market for a bearish breakout. One of the
markets will give us a signal ahead of the trend.
Previous Analysis:
For 2013, the Hong Kong market moved up 7.6%. Since 2010, the index has consolidated between 17805 and
23920. There are no signs of us breaking out of the consolidation pattern. The lower time frames right now
are showing that the resistance is going to hold. The weekly time frame is stuck between 22000 and 23287. If
the index breaks the support, it will have a high probability to go to the bottom of the consolidation pattern. If
the index breaks the resistance, the probabilities will increase to break out of the consolidation pattern.
Figure 26: Esignal Weekly/Monthly Chart of Hong Kong Index: $HSI-HKG
- 45 -
3. Japan: $NI225-NKI
Current Analysis:
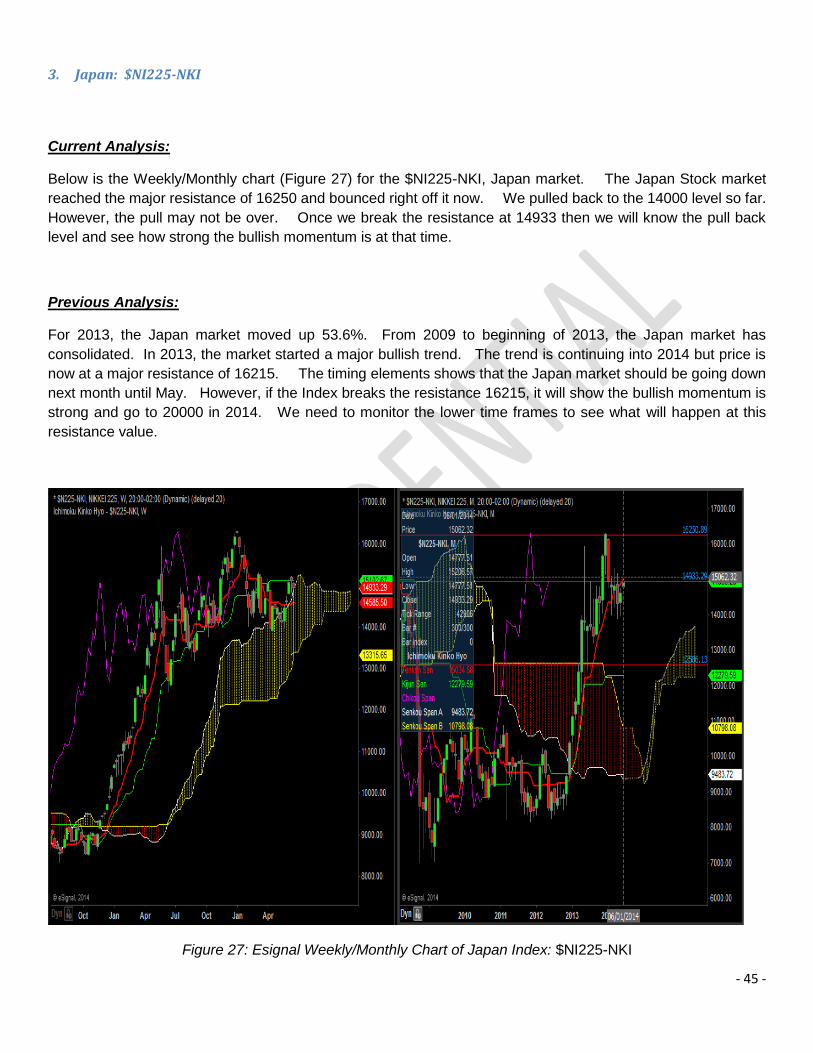
Below is the Weekly/Monthly chart (Figure 27) for the $NI225-NKI, Japan market. The Japan Stock market
reached the major resistance of 16250 and bounced right off it now. We pulled back to the 14000 level so far.
However, the pull may not be over. Once we break the resistance at 14933 then we will know the pull back
level and see how strong the bullish momentum is at that time.
Previous Analysis:
For 2013, the Japan market moved up 53.6%. From 2009 to beginning of 2013, the Japan market has
consolidated. In 2013, the market started a major bullish trend. The trend is continuing into 2014 but price is
now at a major resistance of 16215. The timing elements shows that the Japan market should be going down
next month until May. However, if the Index breaks the resistance 16215, it will show the bullish momentum is
strong and go to 20000 in 2014. We need to monitor the lower time frames to see what will happen at this
resistance value.
Figure 27: Esignal Weekly/Monthly Chart of Japan Index: $NI225-NKI

- 46 -

- 47 -
4. Singapore: $SGS100-FTSE
Current Analysis:
Below is the Weekly/Monthly chart (Figure 28) for the $SGS100-FTSE Singapore market. The Singapore market
is slowly moving up to the next resistance of 6313. The next resistance after that will be 6601. We will monitor
to see what happens at these resistance levels on the lower timeframes. If 6313 holds and price bounces off
it, we will have a lower pivot high long term which could level a bearish term in the futures.
Figure 28: Esignal Weekly/Monthly Chart of Malaysia Index: $200.x-KLS

- 48 -
5. Malaysia: $200_FTSB
Current Analysis:
Below is the Weekly/Monthly chart (Figure 28) for the $200-FTSB, Malaysia market. The Malaysia stock market
has moved up close to 1900 now. We will monitor to see what will happen at this resistance value on the lower
time frames.
Previous Analysis:
For 2013, the Malaysia market moved up 10.78%. In 2013, the Malaysia market had a new high. Since 2009
when the market bottomed at 858, the market has made higher supports and higher resistances. The last
major support is 1600. For 2014, will continue to move higher with pull backs along the way.
Figure 28: Esignal Weekly/Monthly Chart of Malaysia Index: $200.x-KLS

- 49 -
6. Indonesia: COMPOSITE-JKT
Current Analysis:
Below is the Weekly/Monthly chart (Figure 29) for the COMPOSITE-JKT, Indonesia market. The Indonesia
market held the support at 4257 and bounced off it. It now reaching the major resistance of 5053. We will
monitor the lower timeframes to see if we can break this resistance. There is high probability that we will break
this resistance due to the pull back level and timing elements. This is a market definitely one to watch for the
rest of the year.
Previous Analysis:
For 2013, the Indonesia market moved down 1.1%. In 2013, the market went to a new high of 5200 and then
went down drastically to a point the market declared a loss at the end of the year. The Indonesia market is due
to a major pull back. The weekly is showing signs that this pull back may occur in 2014. The pull back has a
high possibility to occur as long as the resistance at 4546 is held. The major support that the pull back can
occur to is 2750. If it breaks that support then the pull back will turn into a trend reversal.
Figure 29:: Esignal Weekly/Monthly Chart of Indonesia Index: SCOMPOSITE-JKT

- 50 -
7. India: $SENSEX-BOM
Current Analysis:
Below is the Weekly/Monthly chart (Figure 30) for the $Sensex-BOM, India market. The market broke the major
resistance and went up drastically getting close to 26000. The lower timeframes showed the higher probability
of breaking the resistance value of 21205 since we consolidating in a tight pattern right around this resistance
value.
Previous Analysis:
For 2013, the India market moved up 6.1%. Towards the end of 2013, the Indian market retested the major
resistance 21248. The index is still right at the resistance. Time is against the Indian market. It has to break
it soon otherwise the bullish momentum is going to fade. As long as price remains above 19500, we have the
possibility of breaking the resistance and move to another level higher. Right now, the index is at a minor
support. If the index fails this minor support, price can move down to 20200. We have to wait to see what will
happen in this market.
Figure 30 : Esignal Weekly/Monthly Chart of India Index: $Sensex-BOM

- 51 -
8. Australia: $XJO-ASX
Current Analysis:
Below is the Weekly/Monthly chart (Figure 31) for the $XJO-ASX, Australia market. The Australia market has
held the minor resistance level before bearish timing elements. We now have a bearish timing element until
January 2015. We will monitor the lower timeframes to see a breakdown or a bullish breakout defiaing the
timing elements.
Previous Analysis:
In 2013, the Index broke the major resistance of 4992 and trended higher. The major resistance is at 5807 with
a lot of minor resistances along the way. The timing elements show that a pullback downward will occur around
the Feb/March time frame. If a pullback occurs, it has to occur above the support of 4992. If price goes below
4992, then the bullish trend will be over completely.
Figure 31 : Esignal Weekly/Monthly Chart of Australia Index: $XJO-ASX
- 52 -
9. New Zealand: $NZ50G.X-NZX
Current Analysis:
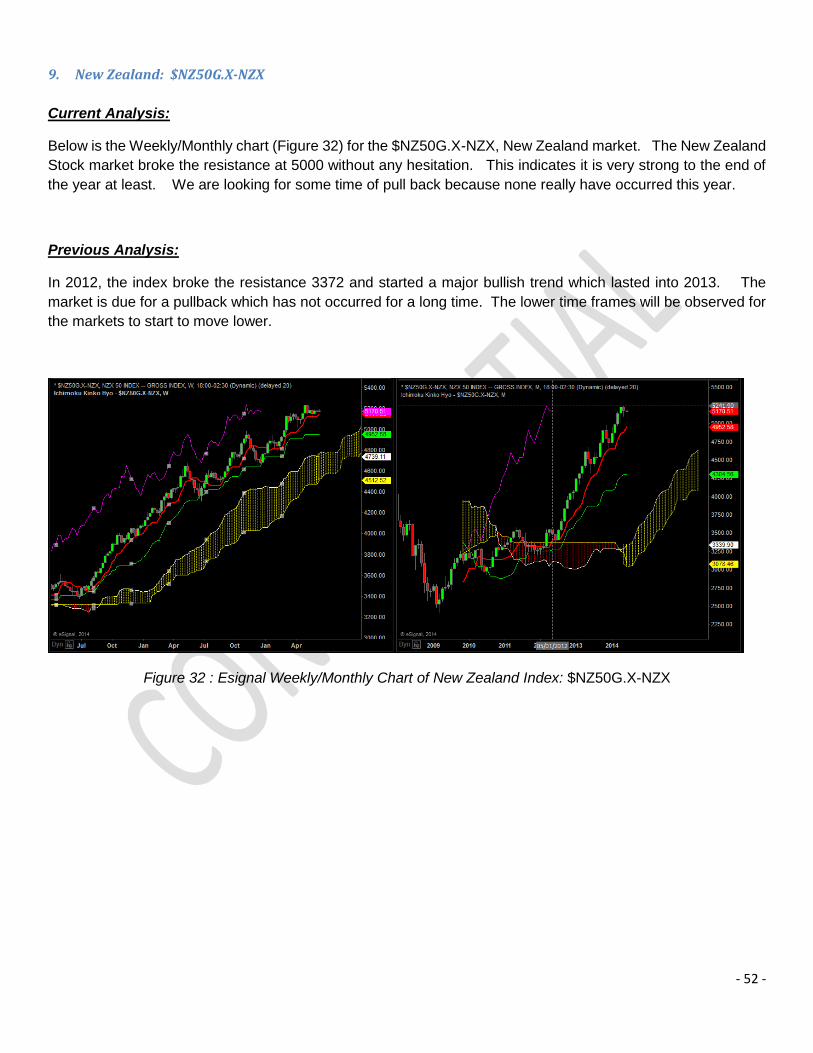
Below is the Weekly/Monthly chart (Figure 32) for the $NZ50G.X-NZX, New Zealand market. The New Zealand
Stock market broke the resistance at 5000 without any hesitation. This indicates it is very strong to the end of
the year at least. We are looking for some time of pull back because none really have occurred this year.
Previous Analysis:
In 2012, the index broke the resistance 3372 and started a major bullish trend which lasted into 2013. The
market is due for a pullback which has not occurred for a long time. The lower time frames will be observed for
the markets to start to move lower.
Figure 32 : Esignal Weekly/Monthly Chart of New Zealand Index: $NZ50G.X-NZX

- 53 -
3. Forex Market
Currency Description 2014 % 2014 Open Price
Current Price
AUDCAD Aust Dollar / Canadian Dollar
7.59335 0.94833 1.02034
AUDCHF Aust Dollar / Swiss Franc 6.27096 0.79621 0.84614
AUDHUF Aust $/Hungarian Forint 10.344 192.743 212.680
AUDJPY Aust Dollar / Japanese Yen 2.018 93.972 95.868
AUDNZD Aust Dollar / New Zealand $ -0.09862 1.08493 1.08386
AUDUSD Aust Dollar / US Dollar 5.29151 0.89275 0.93999
EURAUD Euro / Australian Dollar -6.54584 1.54052 1.43968
GBPAUD British Pound / Aust Dollar -2.73806 1.85423 1.80346
NOTE: ALL THE SUPPORT/RESISTANCES FOR ALL THESE INSTRUMENTS FOR DAILY/WEEKLY/MONTHLY
TIMEFRAMES CAN BE FOUND AT WWW.ICHIMOKUTRADE.COM UNDER THE SCANNER

- 54 -
1. Forex: AUDCAD Currency
Current Analysis:
Below is the Weekly/Monthly chart (Figure 33) for the AUDCAD currency. AUDCAD currency could reach
the major resistance of 0.8973. Instead, it made a higher pivot high on the weekly timeframe and got back
above the major resistance of 0.9607. We had mentioned if it broke the 0.9607 resistance, it had a higher
probability of consolidation for the next couple of months. Since we broke the resistance, it is trying to get to
the top of the consolidation pattern. Remember, consolidation patterns can be ugly where they can form lower
pivot high and/or higher pivot low. The Weekly is telling us that we have a high probability of retesting at
least 1.0400. If we get there soon, momentum will be strong where we can break that level and go higher to
1.0600.
Previous Analysis:
In 2011, the currency broke the consolidation pattern between 0.8973 and 0.9977. Once the currency broke
this consolidation pattern it moved into another consolidation pattern between 0.9977 and 1.0652. In May
2013, AUDCAD moved back down into the lower consolidation pattern. The currency now has a high
probability of reaching the bottom of the consolidation pattern which is 0.8973 for 2014. This probability will
remain as long as the resistance 0.9977 is not broken. The weekly timeframe shows a bearish trend. A
medium pull back did occur back to 1.000 and price is trying to retest the lows at 0.9200. In order for the
trend to continue, the resistance at 0.9607 has to be held. If that resistance gets broken then the currency
has a high probability of consolidating for a couple of months.

- 55 -
Figure 33 : Tradestation Weekly/Monthly Chart of AUDCAD Currency
2. Forex: AUDCHF Currency
Current Analysis:
Below is the Weekly/Monthly chart (Figure 34) for the AUDCHF currency. AUDCHF long term is basically
consolidating. We didn’t reach the bottom of the consolidation pattern. Instead we formed a higher pivot low.
We now having a consolidation pattern where the pivot high are going lower and the pivot low are going higher.
The next major resistance is shown on the monthly chart. If we break this level…we will go higher to retest the
lower pivot high or make a new lower pivot high. If we hold this resistance level, we will go back to 0.7838 with
a high probability of breaking it this time.
Previous Current Analysis:
The AUDCHF for years has been consolidating in a big wide range of 0.7354 and 0.9985. The currency has
broken the major support of 0.8747 which was the middle of the consolidation pattern. As a result, the instrument
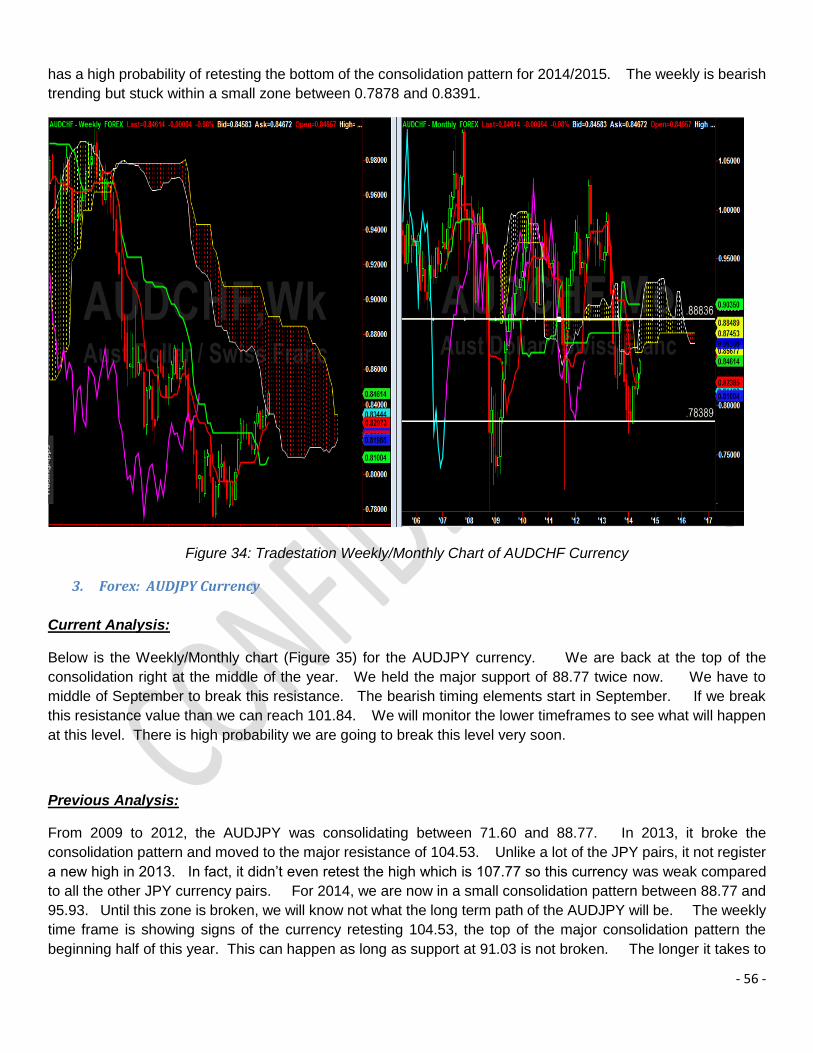
- 56 -
has a high probability of retesting the bottom of the consolidation pattern for 2014/2015. The weekly is bearish
trending but stuck within a small zone between 0.7878 and 0.8391.
Figure 34: Tradestation Weekly/Monthly Chart of AUDCHF Currency
3. Forex: AUDJPY Currency
Current Analysis:
Below is the Weekly/Monthly chart (Figure 35) for the AUDJPY currency. We are back at the top of the
consolidation right at the middle of the year. We held the major support of 88.77 twice now. We have to
middle of September to break this resistance. The bearish timing elements start in September. If we break
this resistance value than we can reach 101.84. We will monitor the lower timeframes to see what will happen
at this level. There is high probability we are going to break this level very soon.
Previous Analysis:
From 2009 to 2012, the AUDJPY was consolidating between 71.60 and 88.77. In 2013, it broke the
consolidation pattern and moved to the major resistance of 104.53. Unlike a lot of the JPY pairs, it not register
a new high in 2013. In fact, it didn’t even retest the high which is 107.77 so this currency was weak compared
to all the other JPY currency pairs. For 2014, we are now in a small consolidation pattern between 88.77 and
95.93. Until this zone is broken, we will know not what the long term path of the AUDJPY will be. The weekly
time frame is showing signs of the currency retesting 104.53, the top of the major consolidation pattern the
beginning half of this year. This can happen as long as support at 91.03 is not broken. The longer it takes to

- 57 -
retest 104.53, the lower the probability it will have to break that resistance. There is a timing element in April
where the currency can go down. The current minor resistance is 95.93.
Figure 35: Tradestation Weekly/Monthly Chart of AUDJPY Currency

- 58 -
4. Forex: AUDNZD Currency
Current Analysis:
Below is the Weekly/Monthly chart (Figure 36) for the AUDNZD currency. AUDNZD went straight to the major
support at 1.0617 and bounced off this major resistance level. This was a 2 year journey from 1.3000 to 1.0617.
This could be the bottom of the consolidation pattern, pull back to still go bearish more, or a trend reversal. The
lower time frames should tell us a lot in the next couple of months. In order for price to start a bullish trend, the
major resistance at 1.1043 has to be broken. Until then, there currency is still very strong bearish.
Previous Analysis:
AUDNZD has the best smooth currency trend for 2013. You can easily see that from the weekly chart. Once
the AUDNZD broke the major support of 1.2205, it started a major bearish trend towards the 1.0622. For 2014,
the probabilities are high of getting to this value since the instrument is only 200 pips away from it. Once we
reach this value, we will have to look at the lower timeframes to determine what will happen there. It will be
interesting to see if the currency gets to 1.000 in 2014/2015 which no one thinks can happen.
Figure 36: Tradestation Weekly/Monthly Chart of AUDNZD Currency

- 59 -
5. Forex: AUDUSD Currency
Current Analysis:
Below is the Weekly/Monthly chart (Figure 37) for the AUDUSD currency. The AUDUSD never got the major
support. Instead of went above the Kijun Sen on the weekly timeframe with a lower pivot low. We are at a
minor resistance level now and if we break it, the currency will start to move up to try to reach 0.9715 which a
major resistance level. This instrument will remain bearish long term as long as we stay below this level.
Timing elements show we are bearish and still could reach 0.8538 by March 2015.
Previous Analysis:
In 2010, the AUDUSD currency broke the major resistance 0.9572. After that it went to 1.1000 in 2011. Since
2011, the currency has slowly been going down. In 2013, the currency broke the major support of 0.9572.
Now, we have a high probability of reaching 0.8543. Currently, the weekly is in a range of 0.8841 and 0.9288.
Figure 37: Tradestation Weekly/Monthly Chart of AUDUSD Currency

- 60 -
6. Forex: EURAUD Currency
Current Analysis:
Below is the Weekly/Monthly chart (Figure 38) for the EURAUD currency. During our previous analysis at the
beginning of 2014, we stated we were at the major resistance level of 1.5518. We were going to monitoring
the lower timeframes to see what happened at this level. The weekly chart showed that the currency could not
break the minor resistance level of 1.5420 to retest the high again. Therefore, the reversal started to happen..
We know have a high probability of reaching 1.4015
Previous Analysis:
In 2010, the currency broke the major support of 1.5479 and started a major bearish trend all the way down to
1.1621. In 2013, the currency pulled back to 1.5479. The currency begins 2014 right at this level which is a
major resistance. We have to observe the lower timeframe to determine what is going to happen at this level.
The currency may go through a minor pull back before it break this level.

- 61 -
Figure 38: Tradestation Weekly/Monthly Chart of EURAUD Currency

- 62 -
7. Forex: GBPAUD Currency
Currency Analysis:
Below is the Weekly/Monthly chart (Figure 39) for the GBPAUD currency. The GBPAUD continue to push higher
to 0.9000 and stopped at that level. Since then, it has pulled back to a major support of 1.7925. As long as
this support is maintained, the bullish momentum is still very strong and the probabilities of getting to 2.0704 by
Feb 2015 is very high. We will continue to watch the lower timeframe for the price/time level to be maintained.
Previous Analysis:
In 2013, one the major currencies that got strong was the GBP. The trader can see from the charts below that
the GBPAUD was consolidating for 2 years until 2013. In 2013, it bottom out at the support of 1.4678 and
started a bullish trend once it broke the resistance at 1.5943. The long term major resistance is at 2.0670.
The timing element to go down is Feb/March 2015.
Figure 39: Tradestation Weekly/Monthly Chart of GBPAUD Currency

- 63 -
Currency Description 2014 % 2014 Open Price
Current Price
CADCHF Canadian Dollar / Swiss Franc
-1.23897 0.83941 0.82901
CADHUF Canadian $/Hungarian Forint
2.642 203.069 208.435
CADJPY Canadian $ / Japanese Yen -5.205 99.088 93.930
EURCAD Euro / Canadian Dollar 0.55637 1.46127 1.46940
GBPCAD British Pound / Canadian $ 4.65586 1.75886 1.84075
NZDCAD New Zealand $ / Canadian $ 7.70191 0.87355 0.94083
USDCAD US Dollar / Canadian Dollar 2.18810 1.06211 1.08535
NOTE: ALL THE SUPPORT/RESISTANCES FOR ALL THESE INSTRUMENTS FOR DAILY/WEEKLY/MONTHLY
TIMEFRAMES CAN BE FOUND AT WWW.ICHIMOKUTRADE.COM UNDER THE SCANNER

- 64 -
8. Forex: CADCHF Currency
Current Analysis:
Below is the Weekly/Monthly chart (Figure 40) for the CADCHF currency. CADCHF broke the support we had
outlined and got to the next major support of 0.7864. This shows this is still very strong bearish and the possibility
of now reaching the bottom of the huge spike on the monthly time frame. We will continue to monitor the lower
timeframes at all weekly support/resistance levels.
Previous Analysis:
At the beginning of 2013, CADCHF tried to go up but failed around 0.9500. After hitting that resistance, it has
started a bearish trend. The currency stopped at a support of 0.8249 but there is high probability of going to
retest 0.7111. We have to wait for a confirmation that we have broken the minor support at 0.8249 before you
can enter a bearish trade to retest the low at 0.7111. If the currency breaks the resistance at 0.8752 then the
probabilities increase for the currency to consolidate.
Figure 40 Tradestation Weekly/Monthly Chart of CADCHF Currency

- 65 -
9. Forex: CADJPY Currency
Current Analysis:
Below is the Weekly/Monthly chart (Figure 41) for the CADJPY currency. We didn’t’ retest the last pivot high at
the beginning of the year and fell short of it. This caused price to start a consolidation pattern with a downward
slope. The next major resistance is 94.88 and the next major support is 91.25. Until we break one of these,
we will continue to consolidate. There is a bearish timing element in July to end of August.
Previous Analysis:
For all of 2013, the CADJPY has been around the major resistance 96.88. Until last month, it has not been
able to close above this value on the monthly time frame. Now that we have closed above it, the probabilities
have increased drastically for a bullish trend to start and for the CADJPY to get to the major resistance at 105.00.
The timing element indicate this can possible happen by May 2014. The weekly time frame is showing the
bullish momentum is very strong and the currency is trying to retest the last pivot high at around 100.00.
Figure 41: Tradestation Weekly/Monthly Chart of CADJPY Currency

- 66 -
- 67 -
10. Forex: EURCAD Currency
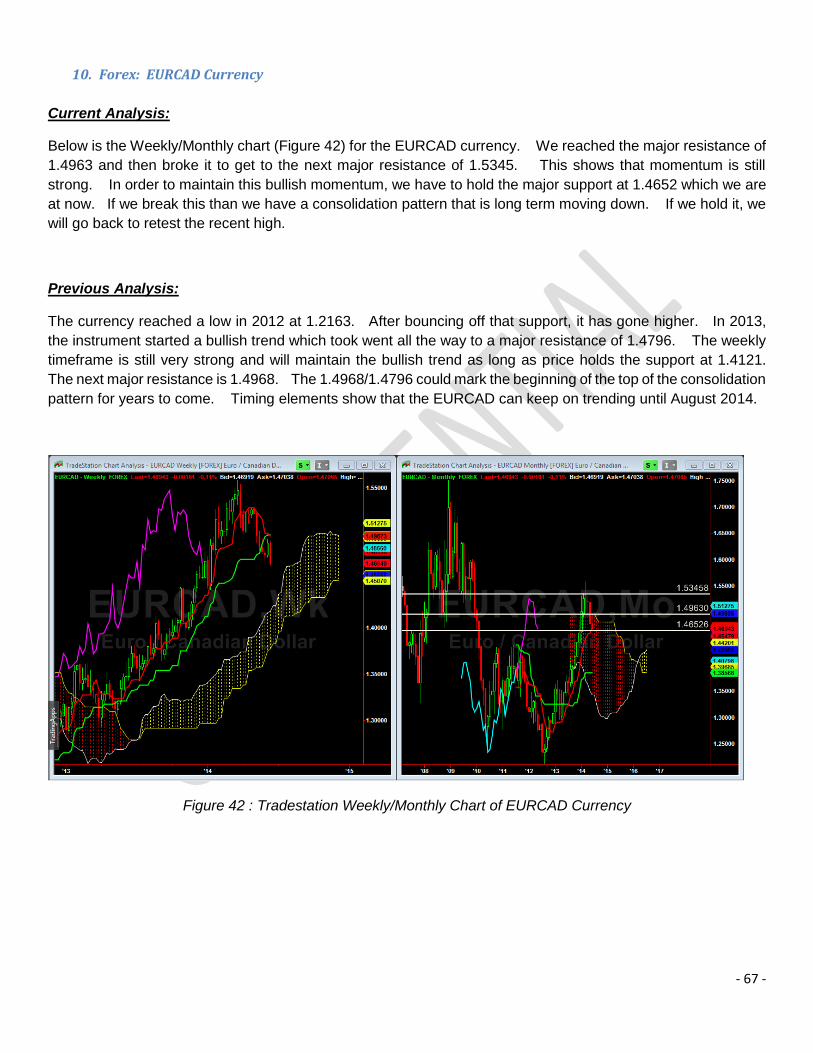
Current Analysis:
Below is the Weekly/Monthly chart (Figure 42) for the EURCAD currency. We reached the major resistance of
1.4963 and then broke it to get to the next major resistance of 1.5345. This shows that momentum is still
strong. In order to maintain this bullish momentum, we have to hold the major support at 1.4652 which we are
at now. If we break this than we have a consolidation pattern that is long term moving down. If we hold it, we
will go back to retest the recent high.
Previous Analysis:
The currency reached a low in 2012 at 1.2163. After bouncing off that support, it has gone higher. In 2013,
the instrument started a bullish trend which took went all the way to a major resistance of 1.4796. The weekly
timeframe is still very strong and will maintain the bullish trend as long as price holds the support at 1.4121.
The next major resistance is 1.4968. The 1.4968/1.4796 could mark the beginning of the top of the consolidation
pattern for years to come. Timing elements show that the EURCAD can keep on trending until August 2014.
Figure 42 : Tradestation Weekly/Monthly Chart of EURCAD Currency

- 68 -
11. Forex: GBPCAD Currency
Currency Analysis:
Below is the Weekly/Monthly chart (Figure 42) for the GBPCAD currency. We reached the resitance level of
1.7870 and broke it completely. This shows the bearish trend is over and we are now in a big long term
consolidation pattern. The next major support/resistance levels long term are marked on the chart:
Previous Analysis:
GBPCAD has been consolidating since 2010 between 1.5248 and 1.6364. Sept 2013, the GBPCAD broke out
of this consolidation pattern to start a bullish trend. The bullish trend is still strong going into 2014. Price is
very close to the major resistance of 1.7868. After it reaches the resistances, we will have to monitor on the
lower time frames to determine what will happen.
Figure 42: Tradestation Weekly/Monthly Chart of GBPCAD Currency

- 69 -
12. Forex: NZDCAD Currency
Current Analysis:
Below is the Weekly/Monthly chart (Figure 43) for the NZDCAD currency. NZDCAD got to the top of the big
consolidation pattern and broke it. We in a major bullish trend now. IF we break the support at 0.9156 we
will possible have a major pull back but until then this will continue to go higher.
Previous Analysis:
The chart for NZDCAD looks very ugly. It broke the resistance at 0.8518 again and it is trying to get to the
major resistance of 0.9196. The path to this resistance is going to be difficult since there are a lot of minor
resistances.
Figure 43: Tradestation Weekly/Monthly Chart of NZDCAD Currency

- 70 -
13. Forex: USDCAD Currency
Current Analysis:
Below is the Weekly/Monthly chart (Figure 44) for the USDCAD currency. USDCAD got our resistance and
then “blipped” above to the next major resistance. However, it maintained the resistance level we had marked
at the beginning of the year. Price is now pulling back the major support at 1.0730. There are a lot of minor
support around this level so it could intra-bar go to another support. In order for a possibility, of USDCAD
having a bullish sentiment on a monthly timeframe this support has to hold and it has to break the resistance.
If not, USDCAD will go lower to the next major at 1.0455. Since 2003, we have not been back above the
monthly cloud!
Previous Analysis:
Since 2010, the USDCAD currency is consolidating between 0.9450 and 1.0713. Right now, the currency is
at this major resistance. If the instrument breaks it, the next resistance will be 1.1065. The weekly time
frame is showing some signs of weakness so we have to wait and see what happens on the lower time frames
to determine what will happen at this resistance value.
Figure 44: Tradestation Weekly/Monthly Chart of USDCAD Currency

- 71 -

- 72 -
Currency Description 2013 Point Movement
2013 Open Price
2013 Close Price
CADJPY Canadian Dollar/Japanese Yen -5.205 99.088 93.930
CHFJPY Swiss Franc / Japanese Yen -4.017 118.003 113.263
CNHJPY China Yuan Renminbi /Jap Yen -5.519 17.321 16.365
EURJPY Euro / Japanese Yen -4.676 144.842 138.069
GBPJPY British Pound / Japanese Yen -0.793 174.330 172.948
HKDJPY Hong Kong $ / Japanese Yen -3.103 13.569 13.148
JPYHUF Japan Yen/Hungarian Forint 8.504 1.999 2.169
NZDJPY New Zealand $ / Japanese Yen 2.122 86.558 88.395
SGDJPY Singapore $/Japanese Yen -1.357 82.592 81.471
TRYJPY Turkish Lira / Japanese Yen -1.837 48.776 47.880
USDJPY US Dollar / Japanese Yen -3.135 105.279 101.978
NOTE: ALL THE SUPPORT/RESISTANCES FOR ALL THESE INSTRUMENTS FOR DAILY/WEEKLY/MONTHLY
TIMEFRAMES CAN BE FOUND AT WWW.ICHIMOKUTRADE.COM UNDER THE SCANNER

- 73 -
14. Forex: CHFJPY Currency
Current Analysis:
Below is the Weekly/Monthly chart (Figure 45) for the CHFJPY currency. CHFJPY is just consolidating since
the beginning of the year. It is consolidating at the major high so it is still very strong. We will maintain watch
on the lower timeframe support/resistance to see what happens at the major support/resistance. We are at a
major support now at 113.00.
Previous Analysis:
CHFJPY has been one of the strong JPY pairs in 2013. In 2013, the CHFJPY has broken two major resistances,
98.80 and 104.33. After breaking the 104.33 resistance, it has started a major bullish trend reaching new highs
week after week. Momentum is still very strong where CHFJPY can continue to make new highs.
Figure 45: Tradestation Weekly/Monthly Chart of CHFJPY Currency

- 74 -

- 75 -
15. Forex: EURJPY Currency
Current Analysis:
Below is the Weekly/Monthly chart (Figure 46) for the EURJPY currency. EURJPY didn’t get to our exact
resistance level of 146.47. Instead, it stopped at 145 and decided to consolidate. We are at one major level
now of 137.69. The next one is 132.00. If the current support level holds, we still have a possibility of getting
to 146.47 and possibly going higher by end of December 2014.
Previous Analysis:
Like other currencies vs the JPY currency, the EURJPY started a bullish trend in 2013 which has carried into
2014. The monthly chart looks ugly but the weekly is showing a nice bullish trend.
Figure 46: Tradestation Weekly/Monthly Chart of CHFJPY Currency

- 76 -
16. Forex: GBPJPY Currency
Current Analysis:
Below is the Weekly/Monthly chart (Figure 47) for the GBPJPY currency. GBJPY has not reached our
resistance level of 185.07. Instead, it stopped at 174.68 where it has been consolidating in a small range. It is
still strong because it has been holding minor support level of 168.34 and major support level of 166.09. We
will continue to monitor the lower timeframe to see what happens at the major support/resistance levels.
Previous Analysis:
The GBP was strong in 2013 and the JPY was weak in 2013. Therefore, this combination created a powerful
bullish trend that has carried into 2014. We have outlined the long term resistances on the monthly chart.
184.98 is the major resistance. The timing elements have GBPJPY goin up to April 2014.
Figure 47: Tradestation Weekly/Monthly Chart of CHFJPY Currency

- 77 -
17. Forex: NZDJPY Currency
Current Previous Analysis:
Below is the Weekly/Monthly chart (Figure 48) for the NZDJPY currency. NZDJPY is slowly getting to our target
of 91.56. The minor support level is 85.66.
Previous Analysis:
The NZDJPY current broke the resistance 69.41 in 2013 and started a major bullish trend just like all other JPY
currency pairs. The major resistance which it is trying to get to is 91.37. Momentum is strong so there is a
high probability it will get there in 2014 but we will monitor the lower time frames as it moves upwards.
Figure 48: Tradestation Weekly/Monthly Chart of NZDJPY Currency

- 78 -
18. Forex: USDJPY Currency
Current Analysis:
Below is the Weekly/Monthly chart (Figure 49) for the USDJPY currency. USDJPY has been holding the major
resistance level of 105.68 and can’t seem to break it. The major support is 100.99. Until one of these are
broken, we will continue to consolidate. The probabilities are more to the bullish side now since we are above
the cloud on both the weekly and monthly.
Previous Analysis:
In 2007, USDJPY hit a major resistance at 123.30. After that, it has gone down drastically all the way to 76.04.
In 2013, USDJPY started a major bullish trend. The major trend is continuing into 2014 and price is approaching
the first major resistance of 105.69. If it breaks it, it will go to 109.76. There is a high probability of USDJPY
reaching 109.76 in 2014.
Figure 49: Tradestation Weekly/Monthly Chart of USDJPY Currency

- 79 -

- 80 -
Currency
Description 2014 % 2014 Open Price
Current Price
EURAUD Euro / Australian Dollar -6.54584 1.54052 1.43968
EURCAD Euro / Canadian Dollar 0.55637 1.46127 1.46940
EURCHF Euro / Swiss Franc -0.68129 1.22708 1.21872
EURDKK Euro / Danish Krone -0.02534 7.45967 7.45778
EURGBP Euro / British Pound -3.91038 0.83061 0.79813
EURJPY Euro / Japanese Yen -4.676 144.842 138.069
EURNOK Euro / Norwegian Krone -2.76035 8.34132 8.11107
EURNZD Euro / New Zealand Dollar -6.67181 1.67241 1.56083
EURPLN Euro / Polish Zloty -0.84108 4.15182 4.11690
EURSEK Euro / Swedish Krona 1.66283 8.84638 8.99348
EURSGD Euro / Singapore Dollar -2.43565 1.73588 1.69360
EURTRY Euro / Turkish Lira -2.57988 2.95052 2.87440
EURUSD Euro / US Dollar -1.59191 1.37571 1.35381
EURZAR Euro / South African Rand 0.15315 14.43018 14.45228
NOTE: ALL THE SUPPORT/RESISTANCES FOR ALL THESE INSTRUMENTS FOR DAILY/WEEKLY/MONTHLY
TIMEFRAMES CAN BE FOUND AT WWW.ICHIMOKUTRADE.COM UNDER THE SCANNER
- 81 -
19. Forex: EURGBP Currency
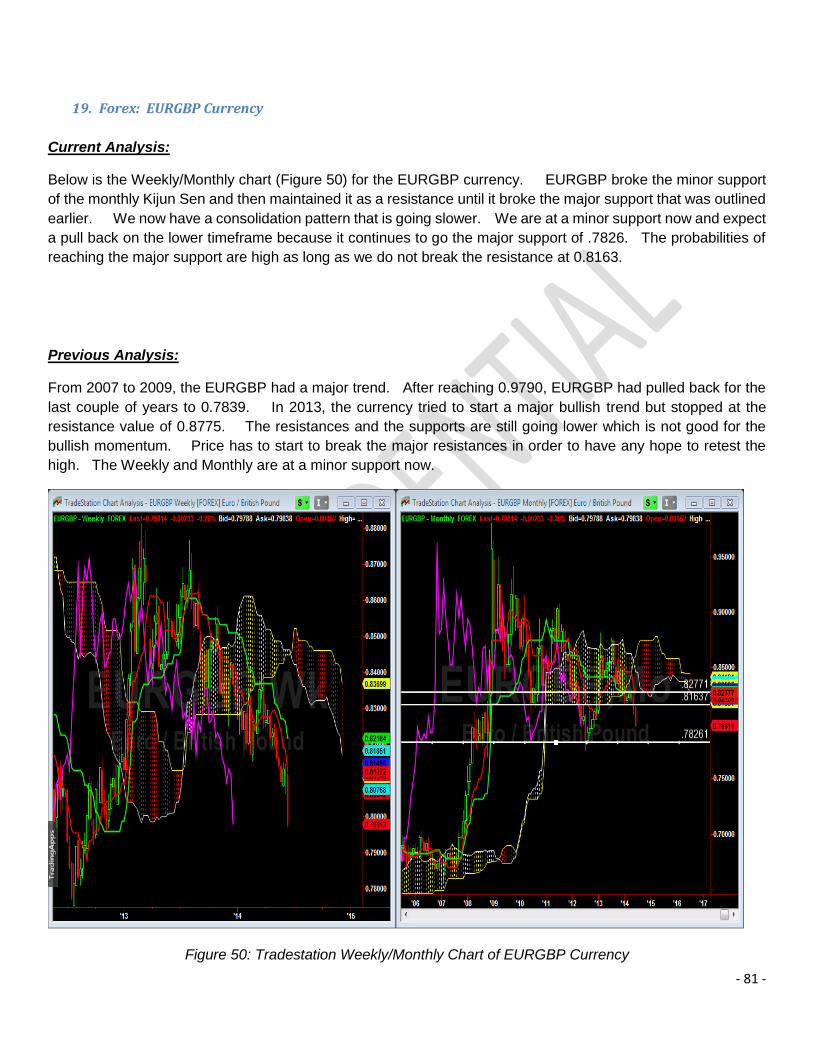
Current Analysis:
Below is the Weekly/Monthly chart (Figure 50) for the EURGBP currency. EURGBP broke the minor support
of the monthly Kijun Sen and then maintained it as a resistance until it broke the major support that was outlined
earlier. We now have a consolidation pattern that is going slower. We are at a minor support now and expect
a pull back on the lower timeframe because it continues to go the major support of .7826. The probabilities of
reaching the major support are high as long as we do not break the resistance at 0.8163.
Previous Analysis:
From 2007 to 2009, the EURGBP had a major trend. After reaching 0.9790, EURGBP had pulled back for the
last couple of years to 0.7839. In 2013, the currency tried to start a major bullish trend but stopped at the
resistance value of 0.8775. The resistances and the supports are still going lower which is not good for the
bullish momentum. Price has to start to break the major resistances in order to have any hope to retest the
high. The Weekly and Monthly are at a minor support now.
Figure 50: Tradestation Weekly/Monthly Chart of EURGBP Currency

- 82 -

- 83 -
20. Forex: EURNZD Currency
Current Analysis:
Below is the Weekly/Monthly chart (Figure 51) for the EURNZD currency. In 2013, we held the major resistance
at 1.7269. Since then, we slowly have been going lower. We broke the major support of 1.6122 which is now
increased the probability of retesting the low drastically. This value is now our major resistance and the
EURNZD is now starting a major bearish trend to retest the low or to get a high low.
Previous Analysis:
In 2012, the EURNZD bottomed out at 1.5095. In 2013, it tried to start a bullish trend to reverse the downward
trend but didn’t succeed. Instead, consolidation pattern off the low has occurred. This range is 1.5095 to 1.7259.
Figure 51: Tradestation Weekly/Monthly Chart of EURNZD Currency

- 84 -
21. Forex: EURUSD Currency
Current Analysis:
Below is the Weekly/Monthly chart (Figure 52) for the EURUSD currency. EURUSD got to the major resistance
of 1.3941 which we had outlined at the beginning of the year and could not break it. We are now a major
support. If we break it, we will go to the next major support and establish a consolidation pattern going lower.
If we hold it, it has to break the minor resistance at 1.3747 to retest the major resistance again.
Previous Analysis:
The EURUSD currency really didn’t do anything in 2013. The monthly time frame shows the support at 1.2207
but the resistances are moving downward. The next major resistance is 1.3971. We see price reaching 1.3971
and then bounce off it and start to go down back to the support of 1.2207 in 2014.
Figure 52: Tradestation Weekly/Monthly Chart of EURUSD Currency

- 85 -
Currency Description 2014 % 2014 Open Price
Current Price
GBPAUD British Pound / Aust Dollar -2.73806 1.85423 1.80346
GBPCAD British Pound / Canadian $ 4.65586 1.75886 1.84075
GBPCHF British Pound / Swiss Franc 3.34392 1.47701 1.52640
GBPHUF British Pound/Hungarian Forint
7.298 357.676 383.780
GBPJPY British Pound / Japanese Yen -0.793 174.330 172.948
GBPNZD British Pound / New Zealand $
-2.86547 2.01293 1.95525
GBPTRY British Pound / Turkish Lira 1.27178 3.55407 3.59927
GBPUSD British Pound / US Dollar 2.41811 1.65584 1.69588
EURGBP Euro / British Pound -3.91038 0.83061 0.79813
NZDCAD New Zealand $ / Canadian $ 7.70191 0.87355 0.94083
NZDCHF New Zealand $ / Swiss Franc 6.38507 0.73343 0.78026
NZDJPY New Zealand $ / Japanese Yen
2.122 86.558 88.395
NZDUSD New Zealand $ / US Dollar 5.41596 0.82220 0.86673
AUDNZD Aust Dollar / New Zealand $ -0.09862 1.08493 1.08386
EURNZD Euro / New Zealand Dollar -6.67181 1.67241 1.56083
GBPNZD British Pound / New Zealand $
-2.86547 2.01293 1.95525
NOTE: ALL THE SUPPORT/RESISTANCES FOR ALL THESE INSTRUMENTS FOR DAILY/WEEKLY/MONTHLY
TIMEFRAMES CAN BE FOUND AT WWW.ICHIMOKUTRADE.COM UNDER THE SCANNER

- 86 -
22. Forex: GBPCHF Currency
Current Analysis:
Below is the Weekly/Monthly chart (Figure 53) for the GBPCHF currency. GBPCHF maintained the support
of 1.4557 and broke the resistance of 1.4775. We short term bearish trend is over and we have entered a
consolidation pattern to the major resistance of 1.5439. If it breaks that resistance, there is a high probability
of reaching 1.6000. Remember, we are undergoing a major pull back up. The major trend is still bearish as
long as price is below 1.7000.
Previous Analysis:
For 2013, the GBPCHF just consolidated between 1.4000 and 1.4801. The weekly time frame shows that we
have broken the resistance. If we break this value then the next resistance value will be 1.5447.

- 87 -
Figure 53: Tradestation Weekly/Monthly Chart of GBPCHF Currency
23. Forex: GBPNZD Currency
Current Analysis:
Below is the Weekly/Monthly chart (Figure 53) for the GBPNZD currency. GBPNZD is now consolidating at the
bottom of bottom of the major support. The stop of the range is 2.0529 and the bottom is 1.8897. The
momentum is still bearish. We just bounced off the major resistance at 1.9757 off the weekly timeframe and
now at the weekly support. If we break the support this week, we will go back to the bottom of the range without
testing the top of the consolidation pattern. This will increase our probability of breaking the bottom of the
consolidation pattern.
Previous Analysis:

- 88 -
GBPNZD in 2013 did nothing but consolidate. The consolidation range is 1.8864 and 2.0546. If GBPNZD
can break the resistance of 2.0546, the instrument can start a major pull back upwards.
Figure 53: Tradestation Weekly/Monthly Chart of GBPNZD Currency

- 89 -
24. Forex: GBPUSD Currency
Current Analysis:
Below is the Weekly/Monthly chart (Figure 54) for the GBPUSD currency.
Previous Analysis:
Since 2009, the GBPUSD has been in a consolidation pattern between 1.5165 and 1.6841. The weekly shows
that a minor consolidation pattern has been broken and the GBPUSD is trying to go higher. There is high
probability of GBPUSD reaching 1.6841 for 2014. The next major resistance after that would be 1.7330. The
monthly time frame shows the resistance has remained the same but the supports have gone up with time.
Figure 54: Tradestation Weekly/Monthly Chart of GBPUSD Currency

- 90 -
25. Forex: NZDCHF Currency
Current Analysis:
Below is the Weekly/Monthly chart (Figure 55) for the NZDCHF currency. We broke the minor resistance below
finally and now we are going to the top of the consolation pattern of 0.7995. The weekly is showing signs of a
possibility of breaking the consolidation pattern bullish as long as the minor support of 0.7570 holds.
Previous Analysis:
In 2013, NZDCHF just consolidated between 0.7200 and 0.8013. If the minor resistance of 0.7600 is not
broken then the currency will move downward Q1CY2014.
Figure 55: Tradestation Weekly/Monthly Chart of NZDCHF Currency

- 91 -
Currency Description 2014 % 2014 Open Current Price
USDCAD US Dollar / Canadian Dollar 2.18810 1.06211 1.08535
USDCHF US Dollar / Swiss Franc 0.91040 0.89192 0.90004
USDCNH US Dollar / Chinese Renminbi 2.61014 6.05332 6.21132
USDCZK US Dollar / Czech Rep Koruna 2.05194 19.84950 20.25680
USDDKK US Dollar / Danish Krone 1.58368 5.42155 5.50741
USDHKD US Dollar / Hong Kong Dollar -0.03482 7.75353 7.75083
USDHUF US Dollar / Hungarian Forint 4.791 215.906 226.250
USDJPY US Dollar / Japanese Yen -3.135 105.279 101.978
USDMXN US Dollar / Mexican Peso -0.25563 13.04630 13.01295
USDNOK US Dollar / Norwegian Krone -1.18857 6.06107 5.98903
USDPLN US Dollar / Polish Zloty 0.68523 3.01941 3.04010
USDSEK US Dollar / Swedish Krona 3.32062 6.42741 6.64084
USDSGD US Dollar / Singapore Dollar -0.86549 1.26171 1.25079
USDTRY US Dollar / Turkish Lira -1.11491 2.14637 2.12244
USDZAR US Dollar / So African Rand 1.74460 10.48950 10.67250
NOTE: ALL THE SUPPORT/RESISTANCES FOR ALL THESE INSTRUMENTS FOR DAILY/WEEKLY/MONTHLY
TIMEFRAMES CAN BE FOUND AT WWW.ICHIMOKUTRADE.COM UNDER THE SCANNER

- 92 -
26. Forex: USDCHF Currency
Current Analysis:
Below is the Weekly/Monthly chart (Figure 56) for the USDCHF currency. The USDCHF really has not doen
anything. It started it movement down to retest the low and in the last couple of months it has gone up a little.
Up to a point, it is gone back above the Kijun Sen. That is show signs of the bearish momentum becoming
weak. The weekly should have trended downward to the major support of 0.8510. We have to get below
0.8869 for the bearish momentum to get strong again.
Previous Analysis:
Since 2012, the currency has been consolidating between 0.8939 and 0.9716. Slowly, the resistances are
going lower and supports are going lower too. This increases the probabilities of price moving toward 0.8482
in 2014. If the currency break 0.8482 then it does have a probability of coming back all the way down to
0.7105.
Figure 56: Tradestation Weekly/Monthly Chart of USDCHF Currency

- 93 -
27. Forex: USDSGD Currency
Current Analysis:
Below is the Weekly/Monthly chart (Figure 57) for the USDSGD currency. USDSGD is doing nothing except
consolidating tighter and tighter. It is still following the lines we drew at the beginning of the year.
Previous Analysis:
In 2009, the high of 1.5500 was reached. After price bounced off that resistance value, a major bearish trend
started that took the USDSGD all the way down to 1.2015. After the major pull back up, price has consolidated
for the last 2 years. The consolidation pattern is a “squeeze” pattern where the resistances are going lower and
the supports are going higher. Sooner or later, price is going to break out and start another major trend. We
will be observing this currency through 2014/2015 for the breakout.

- 94 -
Figure 57: Tradestation Weekly/Monthly Chart of USDSGD Currency

- 95 -
28. Forex: USDNOK Currency
Current Analysis:
Below is the Weekly/Monthly chart (Figure 58) for the USDNOK currency. USDNOK reached the top of the
consolidation resistance of 6.2675 and bounced off it again. It then went to the major support of 5.8726 and
bounced off that level. These two levels are defining the new consolidation pattern right now.
Previous Analysis:
Since 2010, the instrument has consolidated between 5.5054 and 6.2557. The supports are going up and the
resistances are constant. If the resistance at 6.2557 gets broken then a possible trend can start.
Figure 58: Tradestation Weekly/Monthly Chart of USDNOK Currency

- 96 -

- 97 -
4. Future Markets
a. Commodities
Symbol Description 2014 % 2014 Open Price
Current Price
@SM Soybean Meal Continuous Contract [Mar14]
19.4 391.9 467.9
@C Corn Continuous Contract [Mar14]
3 1/8 433 2/8 447
@S Soybeans Continuous Contract [Mar14]
11 5/8 1277 1425 6/8
@BO Soybean Oil Continuous Contract [Jan14]
0.15 39.63 39.69
@O Oats Continuous Contract [Mar14]
26 2/8 275 347 2/8
@W Wheat Continuous Contract [Mar14]
-4 7/8 616 2/8 586
@SB Sugar No. 11 Continuous Contract [Mar14]
-2.07 17.40 17.04
@RR Rough Rice Continuous Contract [Mar14]
-5.349 15.330 14.510
NOTE: ALL THE SUPPORT/RESISTANCES FOR ALL THESE INSTRUMENTS FOR DAILY/WEEKLY/MONTHLY
TIMEFRAMES CAN BE FOUND AT WWW.ICHIMOKUTRADE.COM UNDER THE SCANNER

- 98 -
1. Future: Soybean Meal
Below is the Weekly/Monthly chart (Figure 59) for Soybean Meal. Soybean Meal is bullish trending very
strong right now. It is making new higher every month. The current support right now is 443.90. We are one
resistance of 509.20 and if we break that resistance, we can go to 555.0.
Figure 59: Tradestation Weekly/Monthly Chart of Soybean Meal

- 99 -
2. Future: Corn
Current nalysis:
Below is the Weekly/Monthly chart (Figure 60) for Corn. Price bounced off the major support and then all the
way to the major resistance at 511. The chart pattern is ugly but if it breaks 418, we could start a major trend
to bearish side to go retest the low or making a higher low.
Previous Analysis:
The monthly chart for Corn futures is “ugly”. Currently, price is at a major support value of 418 1/8.
Figure 60: Tradestation Weekly/Monthly Chart of Corn

- 100 -
3. Future: Soybean
Current Analysis:
Below is the Weekly/Monthly chart (Figure 61) for Soybean. Soybeans retested the major high of 1427 1/28.
It then broke it and now we are testing that value as a support. The lower timeframes are showing the bullish
momentum is strong and the support could hold since we have a major support on the weekly timeframe at 1390
5/8. As long as this weekly support holds, we can trend higher. If the support doesn’t hold then we can start
to pull back more and the breakout could have been a “fake breakout”
Previous Analysis:
In 2013, the weekly pull back was completed and price started to move up to retest the highs. Instead of retesting
the high, price stopped short of it and started to go down. The resistances are slowly going down and can be
seen on the weekly chart. We are at a minor short now. If that support gets broken then the instrument may
start a pull back on the monthly time frame.

- 101 -
Figure 61: Tradestation Weekly/Monthly Chart of Soybean
4. Future: Oats
Current Analysis:
Below is the Weekly/Monthly chart (Figure 62) for Oats. Oats moved higher based on our initial analysis and
actually broke the major resistance of 372 4/8 and went above 448. It didn’t get to the next major resistance
of 475 2/8 yet. However, the bullish trend is still strong. We have had a pullback but as long as we hold the
support of 316 1/8, we will be bullish and have a high probability of going to 475 2/8.
Previous Analysis:
Oats has been consolidating and finally broken the resistance. On the monthly time frame, the supports are
going higher too. Price is trying to get to the major resistance value of 372 4/8.
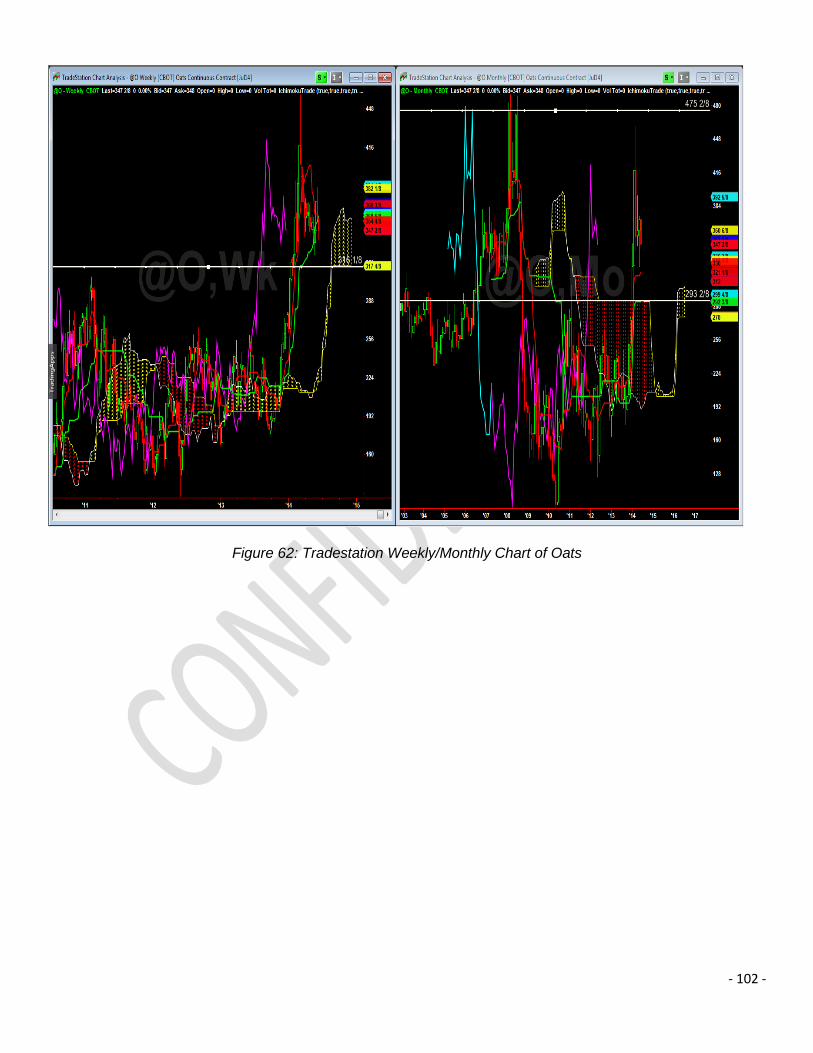
- 102 -
Figure 62: Tradestation Weekly/Monthly Chart of Oats

- 103 -
5. Future: Sugar
Current Analysis:
Below is the Weekly/Monthly chart (Figure 63) for Sugar. The major support of 17.36 didn’t hold and price went
to 16.00. After the bounce at 16, price bounced the resistance value of 18.29 showing the bearish momentum
is very strong. The bearish trend is very strong that there is high probability of breaking the support at 16 and
going a lot lower. We will be watching the lower timeframes at around the price of 16 to see what happens.
The movement downward can happen fast and drastic.
Previous Analysis:
Sugar has been undergoing a major pull back for the last 2 years. The major support it need to hold is 17.36.
In 2014, we have broken the support and the probabilities of a trend reversal is high now. The weekly time
frame is still very strong bearish and doesn’t show any signs of weakness yet.
Figure 63: Tradestation Weekly/Monthly Chart of Sugar

- 104 -
6. Future: Wheat
Current Analysis:
Below is the Weekly/Monthly chart (Figure 64) for Wheat. Wheat futures broke the support at 727 7/8 and just
recently retested it as a resistance. The bearish momentum is very strong and it has a high probability of
retesting the low and breaking it too.
Previous Analysis:
Wheat has both the resistances and the supports going lower. Also, the support at 693 2/8 was broken so
Wheat is going to continue its journey downwards into 2014.
Figure 64:: Tradestation Weekly/Monthly Chart of Wheat

- 105 -
7. Future: Rough Rice
Current Analysis:
Below is the Weekly/Monthly chart (Figure 65) for Rice. Rough Rice Futures are consolidating between 15.882
and 14.02. We just bounced off the bottom of the consolidation of the pattern and have a high probability now
to get to the top. The longer we consolidate, the more the bearish momentum will go away.
Previous Analysis:
Rice has held the support at 14.509. For 2014, Rice will probability consolidate majority of the year. If it breaks
the weekly consolidation resistance of 15.857, it will still have to conquer the major resistance at 17.930.
Figure 65: Tradestation Weekly/Monthly Chart of Rice

- 106 -
b. Energy
Symbol Description 2014 % 2014 Open Price
Curent Price
@NG Natural Gas Continuous Contract [Feb14]
45.681 3.253 4.739
@CL Crude Oil Continuous Contract [Feb14]
11.24 96.11 106.91
@RB NYHarborBlendstock RBOB Continuous Contract [Feb14]
5.2492 2.9052 3.0577
@HO Heating Oil Continuous Contract [Feb14]
6.6315 2.8018 2.9876
NOTE: ALL THE SUPPORT/RESISTANCES FOR ALL THESE INSTRUMENTS FOR DAILY/WEEKLY/MONTHLY
TIMEFRAMES CAN BE FOUND AT WWW.ICHIMOKUTRADE.COM UNDER THE SCANNER

- 107 -
8. Future: Natural Gas
Current Analysis:
Below is the Weekly/Monthly chart (Figure 66) for Natural Gas. We talked about going bullish for Natural gas
for 2014. The bullish move is just a bullish pull back for the major bearish trend that took place for the last
couple of year. We consolidated at the major support at 2.508. We now have a higher support of 4.021. As
long as this support is maintained, the pull back will continue to go up. We have a high probability of reaching
6.00 by end of his year.
Previous Analysis:
Natural Gas has had a major bearish trend from 2005 to 2012. From 2012 to 2013, it has consolidated
between 3.457 and 4.838. The bearish momentum has gone and 2014 could be the year Natural gas breaks
out of the consolidation pattern and starts a major pull back upwards. We will be watching on the lower time
frames for the breakout.

- 108 -
Figure 66: Tradestation Weekly/Monthly Chart of Natural Gas

- 109 -
10. Future: Crude Oil
Current Analysis:
Below is the Weekly/Monthly chart (Figure 67) for Crude Oil. Crude Oil futures are slowly moving up long
term. The bottom of the consolidation pattern is 87.02. This year, we got to 90 and bounced off that value and
went higher. We have higher supports being established in an ugly consolidation pattern. We are at the top
of one consolidation pattern which has a resistance of 106.67. Timing elements have us bullish on crude oil
until the end of November unless we break the major supports.
Previous Analysis:
Since 2009, Crude Oil has been consolidating. The consolidation is a “squeeze” where the resistances are
going lower and the supports are going higher. Sooner or later, price is going to breakout and start a trend.
We will monitoring Crude Oil for the breakout.
Figure 67: Tradestation Weekly/Monthly Chart of Crude Oil

- 110 -

- 111 -
11. Future: NY Harbor Gasoline
Current Analysis:
Below is the Weekly/Monthly chart (Figure 68) for Gasoline. We have maintained the major support at 2.33
during the consolidation pattern and formed a higher support. The new higher support is 2.53. Price is slowly
moving up to the major resistance value of 3.15. Momentum is strong where if we get to this resistance value
very soon, we have a possibility of breaking and going a lot higher.
Previous Analysis:
In 2013, Gasoline reached 3.1365 and then decided to consolidate. The weekly consolidation pattern has
resistances going lower but supports remaining constant. This indicates that the weekly is trying to go
bearish. If price breaks the support of 2.3379, a major pull back will start to occur.
Figure 68: Tradestation Weekly/Monthly Chart of Gasoline
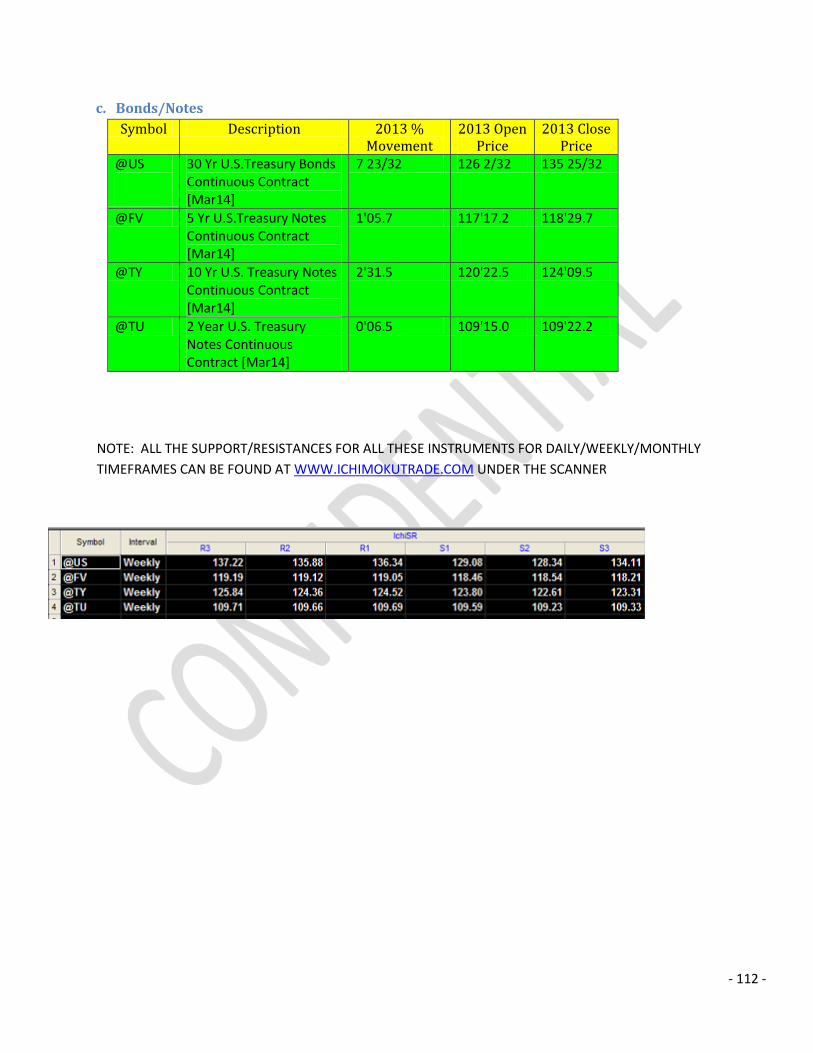
- 112 -
c. Bonds/Notes
Symbol Description 2013 % Movement
2013 Open Price
2013 Close Price
@US
30 Yr U.S.Treasury Bonds Continuous Contract [Mar14]
7 23/32 126 2/32 135 25/32
@FV 5 Yr U.S.Treasury Notes Continuous Contract [Mar14]
1'05.7 117'17.2 118'29.7
@TY 10 Yr U.S. Treasury Notes Continuous Contract [Mar14]
2'31.5 120'22.5 124'09.5
@TU 2 Year U.S. Treasury Notes Continuous Contract [Mar14]
0'06.5 109'15.0 109'22.2
NOTE: ALL THE SUPPORT/RESISTANCES FOR ALL THESE INSTRUMENTS FOR DAILY/WEEKLY/MONTHLY
TIMEFRAMES CAN BE FOUND AT WWW.ICHIMOKUTRADE.COM UNDER THE SCANNER

- 113 -
12. Future: 30 Yr US Treasury Bonds
Current Analysis:
Below is the Weekly/Monthly chart (Figure 69) for 30 Year Treasury. We didn’t get down to the major support
at 120 7/32. Instead, we held the support at 126 indicating that the bullish momentum is still very strong. The
major resistance was 134 27/32 and we just broke that last month. There is high probability of us reaching
144 now as long as the support at 131 20/32 is held.
Previous Analysis:
Since 2009, the 30 year bonds have been in a bullish trend. 2013 started the major pull back for the
instrument. The pull back should continue into 2014. The major support where the instrument can turn from
a major pull back to a trend reversal is 120 7/32.
Figure 69: Tradestation Weekly/Monthly Chart of 30 Year Treasury

- 114 -

- 115 -
13. Future: 5 Yr US Treasury Notes
Current Analysis:
Below is the Weekly/Monthly chart (Figure 70) for 5 Year Notes. Price went down and held the major support
around 117’15. This is the bottom of the consolidation of the pattern. We will continue to watch the lower
timeframe to see when we break out of the consolidation pattern. Where the high gets established will be
critical.
Previous Analysis:
Since 2008, the 5 Year Treasury Notes have been bullish and finally reached a high in 2013 at 122’05.70. The
weekly is showing signs that maybe a major pull back may start to occur. In order for the major pull back to
occur, the support at 119’00 has to be broken and price goes down to retest 118’00.
Figure 70: Tradestation Weekly/Monthly Chart of 5 Year Notes

- 116 -

- 117 -
14. Future: 10 Yr US Treasury Notes
Previous Analysis:
Below is the Weekly/Monthly chart (Figure 71) for 10 Year Notes. 10 Yr US Treasury Notes didn’t hold the
resistance at 123’09. Therefore, we are not going through a major pull back yet. Since we broke the
resistance, we now have a high probability of retesting the high and possibly breaking it now.
Current Analysis:
Since 2008, the 10 Year Notes have trended bullish to 130’00. After reaching this resistance, price has
consolidated with the support at 125’18.5. We have broken this support in 2013 and remain below it for 2014.
As soon as the resistance of 125’18.50 is held, we will undergo a major pull back in 2014 to the possible value
of 112’14.50.
Figure 71: Tradestation Weekly/Monthly Chart of 10 Year Notes

- 118 -

- 119 -
d. Live Stock
Symbol Description 2013 % Movement
2013 Open Price
2013 Close Price
@LH Lean Hog Continuous Contract [Feb14]
22.888 106.825 131.275
@FC Feeder Cattle Continuous Contract [Mar14]
19.301 174.475 208.150
@LC Live Cattle Continuous Contract [Feb14]
18.246 124.000 146.625
NOTE: ALL THE SUPPORT/RESISTANCES FOR ALL THESE INSTRUMENTS FOR DAILY/WEEKLY/MONTHLY
TIMEFRAMES CAN BE FOUND AT WWW.ICHIMOKUTRADE.COM UNDER THE SCANNER

- 120 -
15. Future: Lean Hog
Current Analysis:
Below is the Weekly/Monthly chart (Figure 72) for Lean Hog. Lean Hogs broke the resistance at 125.265.
This was the major pull back level. Since we broke this resistance level, we now are in a big consolidation
pattern. The top of the consolidation pattern is 139.163 and the bottom possible can become 112.875. If we
break the 139.163 resistance then the consolidation pattern will be bigger. The short term support is 124.06. If
this support holds and we retest the resistance at 139.163, we can possible break it to go higher.
Previous Analysis:
Lean Hogs has been consolidating since 2009 between 71.990 and 91.382. In 2013, we did a fake breakout
and then went below the resistance again. Until the resistance value of 91.382 is broken completely, the
instrument will keep on consolidating.
Figure 72: Tradestation Weekly/Monthly Chart of Lean Hog

- 121 -
16. Future: Feeder Cattle
Current Analysis:
Below is the Weekly/Monthly chart (Figure 73) for Feeder Cattle. Feeder Cattle was consolidating going into
2014. The middle of the consolidation pattern was the resistance at 175.51. The resistance didn’t hold.
When price broke the resistance at 175.51, it was going to the next major resistance which was the top of the
consolidation pattern. The 198.37 resistance was broke so now we are in a long term bullish trend. We are
expecting a pullback back to 198.372 where it should hold if it is a true bullish breakout.
Previous Analysis:
Feeder Cattle has consolidated for years and shows no signs to break out of it in 2014.
Figure 73: Tradestation Weekly/Monthly Chart of Feeder Cattle

- 122 -
17. Future: Live Cattle
Previous Analysis:
Below is the Weekly/Monthly chart (Figure 74) for Live Cattle. Live Cattle broke the middle of the
consolidation pattern by breaking the resistance of 126.97 and went to the top of the consolidation pattern at
135.98. We then broke the major resistance at 135.98 and now going high to a bigger consolidation pattern.
Timing elements are bullish to the end of October 2014.
Current Analysis:
Live Cattle has consolidated since 2010 between 128.345 and 146.701.
Figure 74: Tradestation Weekly/Monthly Chart of Live Cattle

- 123 -

- 124 -
e. Metals
Symbol Description 2014 % 2014 Open Price
Current Price
@YG mini-sized Gold Continuous Contract [Feb14]
6.14 1202.90 1276.70
@YI mini-sized Silver Continuous Contract [Mar14]
1.052 19.484 19.689
@HG Copper Continuous Contract [Mar14]
-9.1195 3.3335 3.0295
@PL Platinum Continuous Contract [Apr14]
4.38 1374.80 1435.00
NOTE: ALL THE SUPPORT/RESISTANCES FOR ALL THESE INSTRUMENTS FOR DAILY/WEEKLY/MONTHLY
TIMEFRAMES CAN BE FOUND AT WWW.ICHIMOKUTRADE.COM UNDER THE SCANNER

- 125 -
18. Future: Mini Gold
Current Analysis:
Below is the Weekly/Monthly chart (Figure 75) for Mini Gold. Gold is going through a long term pull back.
The major support for the pull back is 1190.45. As long as this level holds, we are still in a bullish pull back.
If we beak this resistance then we are going to establish a big wide consolidation pattern. In order for the
bullish trend to resume, the major resistance at 1366.93 needs to be broken. Timing elements are not bullish
until April 2015.
Previous Analysis:
Gold finally undergone a major pull back. The support for the major pull back is 1191.56. If we close below
that on a monthly chart, the pull back will turn into a trend reversal. Gold now needs to break the resistance
of 1370.14 in order to start a bullish trend.
Figure 75: Tradestation Weekly/Monthly Chart of Mini Gold

- 126 -

- 127 -
19. Future: Mini Silver
Current Analysis:
Below is the Weekly/Monthly chart (Figure 76) for Mini Silver. Silver futures is holding the multi-year support
at 18.614. We are monitoring the lower timeframes at this level. Price needs to get above monthly tenkan
in order to establish a consolidation pattern with this support.
Previous Analysis:
Silver went from a major pull back to trend reversal when it broke the support at 30.760. Right now, the major
support at 18.628 is holding. If it continues to hold, this can be the bottom of the consolidation pattern for
Silver. The charts will tell us more Q2CY2014.
Figure 76: Tradestation Weekly/Monthly Chart of Mini Silver

- 128 -
20. Future: Copper
Current Analysis:
Below is the Weekly/Monthly chart (Figure 77) for Copper. Copper is still holding the bullish pull back level of
3.0114. It is consolidating around this support level. Price should have reached the resistance level at
3.4568 but instead it broke the support at 3.1282 and has held it as a resistance now. This is starting to setup
for a possible bearish trade once it breaks 3.0114.
Previous Analysis:
Copper long term is really not going anything. If it can break the support of 3.2036 then a possible bearish
trend can start.
Figure 77: Tradestation Weekly/Monthly Chart of Copper

- 129 -
21. Future: Platinum
Current Analysis:
Below is the Weekly/Monthly chart (Figure 78) for Platinum. Platinum is just consolidating in a small range
now. The resistance is 1535.67 and 1339.38. The consolidation is bearish. If price breaks the support at
1400, a bearish trend could possible resume.
Previous Analysis:
Since 2011, Platinum has been consolidating between 1332.98 and 1644.07. If price can break the support
1332.98 then a bearish trend can possible start.
Figure 78: Tradestation Weekly/Monthly Chart of Platinum

- 130 -
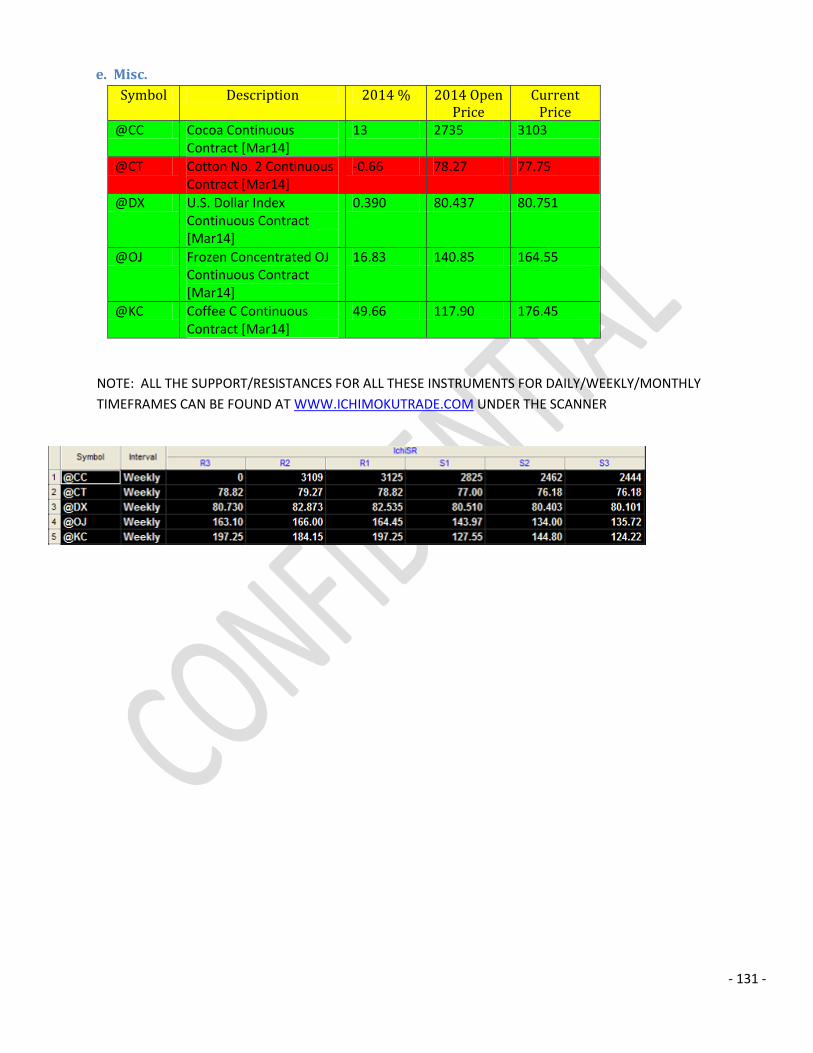
- 131 -
e. Misc.
Symbol Description 2014 % 2014 Open Price
Current Price
@CC Cocoa Continuous Contract [Mar14]
13 2735 3103
@CT Cotton No. 2 Continuous Contract [Mar14]
-0.66 78.27 77.75
@DX U.S. Dollar Index Continuous Contract [Mar14]
0.390 80.437 80.751
@OJ Frozen Concentrated OJ Continuous Contract [Mar14]
16.83 140.85 164.55
@KC Coffee C Continuous Contract [Mar14]
49.66 117.90 176.45
NOTE: ALL THE SUPPORT/RESISTANCES FOR ALL THESE INSTRUMENTS FOR DAILY/WEEKLY/MONTHLY
TIMEFRAMES CAN BE FOUND AT WWW.ICHIMOKUTRADE.COM UNDER THE SCANNER

- 132 -
22. Future: Cocoa
Current Analysis:
Below is the Weekly/Monthly chart (Figure 79) for Cocoa. Cocoa is trading in a big consolidation pattern long
term. The bottom of the consolidation pattern is 2129. Price bounced off there and started to go to the
middle of the consolidation pattern at the beginning of 2014. We now have reached it and broke the
resistance of 3024. Therefore, the probabilities are high to get to the top of the consolidation pattern which is
around 3600. The support at 3024 has to hold in order for these probabilities to stay valid.
Previous Analysis:
Cocoa has been consolidating since 2012 between 2093 and 2702. We are above this resistance value in
2014 but we have not started the upward movement at all yet. If the support gets broken then we will
continue to consolidate.
Figure 79: Tradestation Weekly/Monthly Chart of Cocoa

- 133 -
23. Future: Cotton
Current Analysis:
Below is the Weekly/Monthly chart (Figure 80) for Cotton. Cotton held the major support at 60 for the bullish
pull back. At the beginning of 2014, it established a higher support of 72.53. We have just consolidated
around this support level. The probabilities to retest the high can only occur once we break the monthly cloud.
Previous Analysis:
After the major pull back to 79.15, price has consolidated for 2 years. As long as the support is maintained,
the is a possibility of Cotton starting a bullish trend. The daily/weekly have to start the trend in order for this
to occur.
Figure 80: Tradestation Weekly/Monthly Chart of Cotton

- 134 -

- 135 -
24. Future: Dollar
Currnet Analysis:
Below is the Weekly/Monthly chart (Figure 81) for Dollar. Dollar is consolidating below the major resistance of
86.639. Since price has not reached this resistance level and close to the support, the momentum is still
strong on the bearish side. We are holding the support at 79.158. We will monitor the lower timeframes to
see what happens at this support level. The weekly right now is showing signs of the support holding.
Previous Analysis:
After the bearish trend, the Dollar has consolidated since 2008. The consolidation range is now 78.832 and
86.489. Until the instrument breaks out of the range, no trend can start.
Figure 81: Tradestation Weekly/Monthly Chart of Dollar

- 136 -
25. Future: Orange Juice
Current Analysis:
Below is the Weekly/Monthly chart (Figure 82) for Orange Juice. Orange Juice just broke the resistance at
159.20. Therefore, it now has a higher probability of reaching 180.00
Previous Analysis:
Orange Juice is doing nothing at all. Right now, it is ranging between 114.79 and 158.34.

- 137 -
Figure 82: Tradestation Weekly/Monthly Chart of Orange Juice

- 138 -
26. Future: Coffee
Current Analysis:
Below is the Weekly/Monthly chart (Figure 83) for Coffee. Coffee has been in a nice bearish trade for years.
At the end of 2013, the bottom support was established at 117.49. We have pulled back to the major
resistance of 213.81. If the support at 166.43, we will undergo a bullish pull back to 232.93. The pull back
maybe an ugly consolidation pattern due to the volatility of this instrument.
Previous Analysis:
Coffee continued its bearish trend in 2013. The bearish momentum is still very strong where it could continue
to go down after a pull back.
Figure 83: Tradestation Weekly/Monthly Chart of Coffee

- 139 -
4. Dow 30
Symbol Description 2014 % AXP American Express Company 4.54
NKE Nike, Inc'B' -5.11
DIS Disney (Walt) Co 8.38
MMM 3M Co 2.22
V Visa Inc -5.11
DD Dupont(E.I.)Denemours 5.13
MSFT Microsoft Corp 10.21
UNH UnitedHealth Group Inc 5.15
UTX United Technologies 2.63
GS Goldman Sachs Group -6.41
GE General Electric -3.53
JPM JPMorgan Chase & Co -2.46
HD Home Depot Inc -5.19
JNJ Johnson & Johnson 11.94
$INDU Dow Jones Industrial Average 1.20
TRV The Travelers Companies Inc 5.38
INTC Intel Corp 15.06
PFE Pfizer Inc -3.59
MRK Merck & Co 16.36
PG Procter & Gamble -2.17
XOM Exxon Mobil 1.43
WMT Wal-Mart Stores -4.33
CVX Chevron Corporation 1.88
KO Coca-Cola Co -2.28
CSCO Cisco Systems 10.12
VZ Verizon Communications 0.08
MCD McDonald's Corp 3.57
T AT&T Inc -0.37
CAT Caterpillar Inc 17.58
IBM Intl Business Machines Corp -2.67
NOTE: ALL THE SUPPORT/RESISTANCES FOR ALL THESE INSTRUMENTS FOR DAILY/WEEKLY/MONTHLY
TIMEFRAMES CAN BE FOUND AT WWW.ICHIMOKUTRADE.COM UNDER THE SCANNER

- 140 -
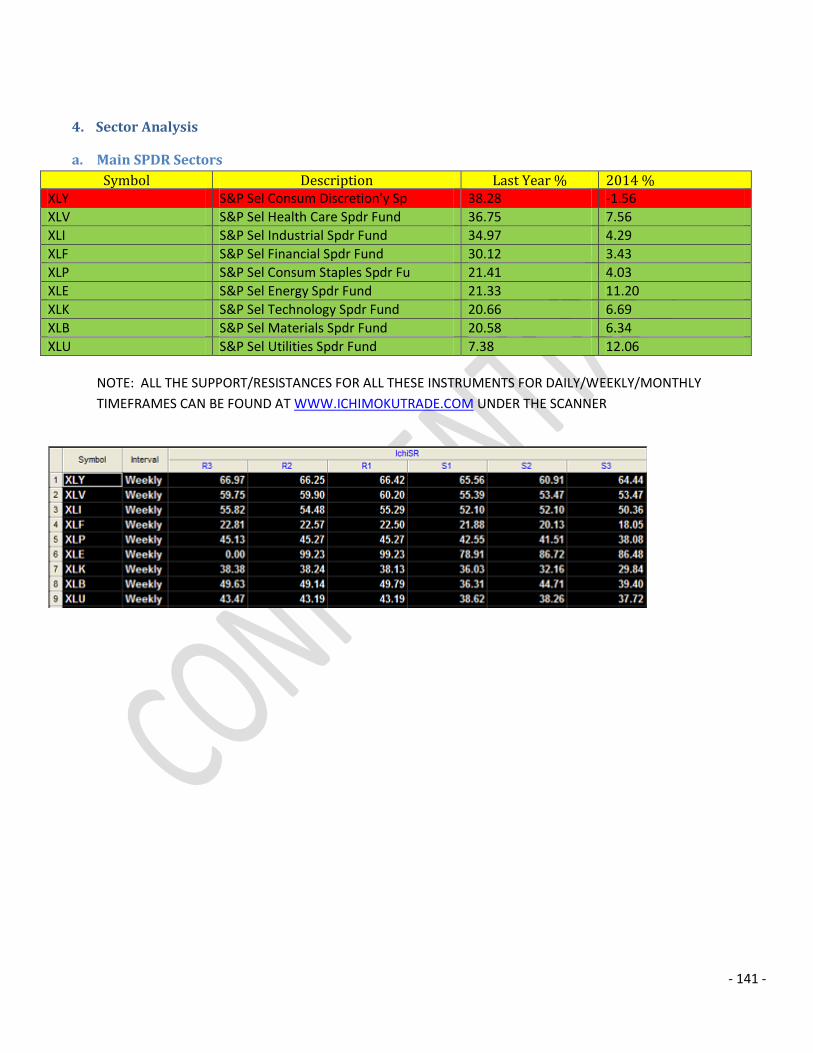
- 141 -
4. Sector Analysis
a. Main SPDR Sectors
Symbol Description Last Year % 2014 % XLY S&P Sel Consum Discretion'y Sp 38.28 -1.56
XLV S&P Sel Health Care Spdr Fund 36.75 7.56
XLI S&P Sel Industrial Spdr Fund 34.97 4.29
XLF S&P Sel Financial Spdr Fund 30.12 3.43
XLP S&P Sel Consum Staples Spdr Fu 21.41 4.03
XLE S&P Sel Energy Spdr Fund 21.33 11.20
XLK S&P Sel Technology Spdr Fund 20.66 6.69
XLB S&P Sel Materials Spdr Fund 20.58 6.34
XLU S&P Sel Utilities Spdr Fund 7.38 12.06
NOTE: ALL THE SUPPORT/RESISTANCES FOR ALL THESE INSTRUMENTS FOR DAILY/WEEKLY/MONTHLY
TIMEFRAMES CAN BE FOUND AT WWW.ICHIMOKUTRADE.COM UNDER THE SCANNER

- 142 -
27. Sector: Consumer Discretion
Current Analysis:
Below is the Weekly/Monthly chart (Figure 84) for Consumer Discretion. XLY has been consolidating
around the resistance value of 67.66. It is still bullish because the consolidation pattern has a small range
where it is maintaining a support of 60.95. Until the resistance/support is broken, we will continue to
consolidate. The probabilities are still to the bullish side since the pull back i.e. bottom of the consolidation
pattern is not too low from the major resistance.
Previous Analysis:
This was the top winner for the main sectors for 2013. You can easily see that from the charts. Both the
Weekly and Monthly held the 9 period support throughout 2013. There are no signs as of yet of it slowing
down at all. A pull back to the 9 week support on the weekly chart would be observed to see what happens
next time.
Figure 84: Tradestation Weekly/Monthly Chart of Consumer Discretion

- 143 -
28. Sector: Health Care
Current Analysis:
Below is the Weekly/Monthly chart (Figure 85) for Health Care. The Health Care sector trend to the major
resistance of 60. The Pull back was minor so the momentum is still very strong bullish. The current weekly
support is 56.95. As long as we maintain this support, we have a high probability of breaking the resistance
and the trend continuing.
Previous Analysis:
Heath care sector is very strong and will remain strong through 2014. It really has not undergone any major
pull backs at all on the weekly timeframe. We will be looking for the major pull back on the daily/weekly
timeframe.
Figure 85: Tradestation Weekly/Monthly Chart of Health Care

- 144 -

- 145 -
29. Sector: Industrial
Current Analysis:
Below is the Weekly/Monthly chart (Figure 86) for Industrial. The Industrial sector is continuing its bullish
trend with healthy pull backs. The momentum is strong to a point, there really has not been any really support
established since there has not been many strong consolidation pattern on moving upwards.
Previous Analysis:
Industrial sector is very strong and will remain strong through 2014. It really has not undergone any major
pull backs at all on the weekly timeframe. We will be looking for the major pull back on the daily/weekly
timeframe.
Figure 86: Tradestation Weekly/Monthly Chart of Industrial
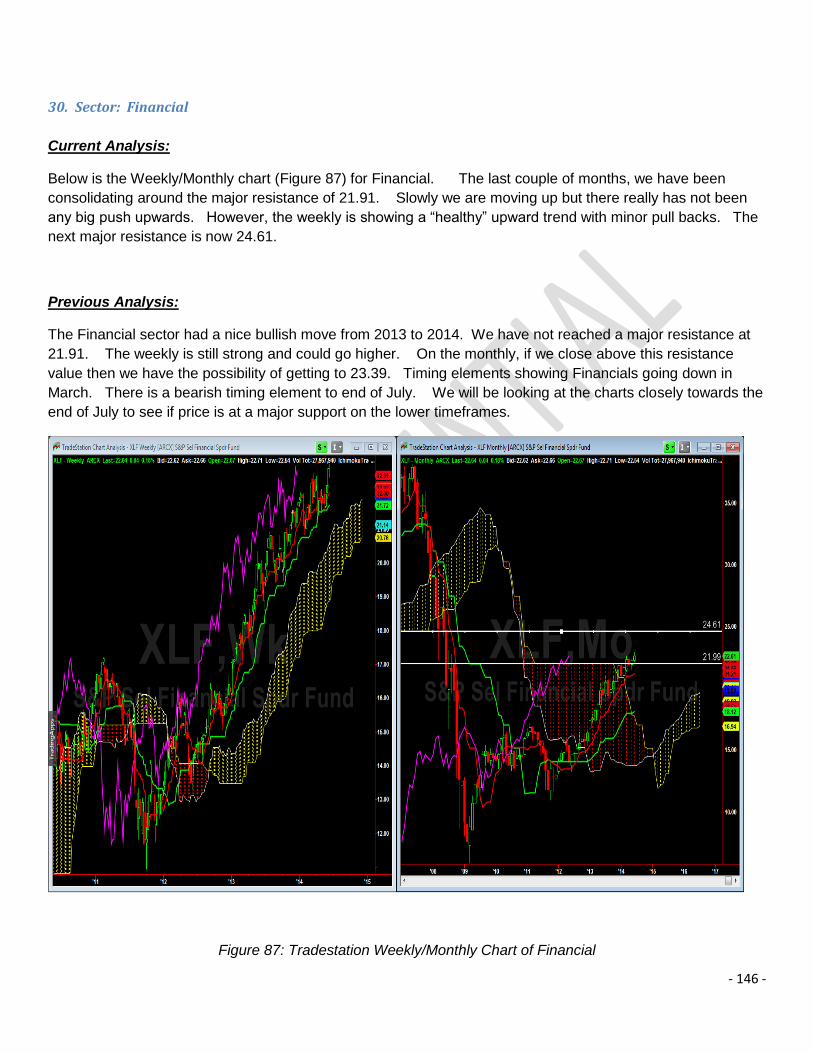
- 146 -
30. Sector: Financial
Current Analysis:
Below is the Weekly/Monthly chart (Figure 87) for Financial. The last couple of months, we have been
consolidating around the major resistance of 21.91. Slowly we are moving up but there really has not been
any big push upwards. However, the weekly is showing a “healthy” upward trend with minor pull backs. The
next major resistance is now 24.61.
Previous Analysis:
The Financial sector had a nice bullish move from 2013 to 2014. We have not reached a major resistance at
21.91. The weekly is still strong and could go higher. On the monthly, if we close above this resistance
value then we have the possibility of getting to 23.39. Timing elements showing Financials going down in
March. There is a bearish timing element to end of July. We will be looking at the charts closely towards the
end of July to see if price is at a major support on the lower timeframes.
Figure 87: Tradestation Weekly/Monthly Chart of Financial

- 147 -

- 148 -
31. Sector: Consumer Staples
Current Analysis:
Below is the Weekly/Monthly chart (Figure 88) for Consumer Staples. The Consumer Staples sector is very
strong bullish which is not really showing any signs of weakness. Initially, the weekly started to show some
signs but price held the support at 40.00 and then broke out of the minor consolidation pattern to continue the
trend making new highs.
Figure 88: Tradestation Weekly/Monthly Chart of Consumer Staples

- 149 -
32. Sector: Energy
Current Analysis:
Below is the Weekly/Monthly chart (Figure 89) for Energy. In the last two months, we have broken the major
resistance and we are on our way to 100, a nice even number. Everything on the lower timeframes is
showing a new healthy bullish trend with minor pull backs.
Previous Analysis:
The Energy sector has moved up since 2013 and is approaching the resistance at 90.06 at the beginning of
2014. We will monitor the lower time frames once we approach that resistance.
Figure 89: Tradestation Weekly/Monthly Chart of Energy

- 150 -
33. Sector: Technology
Current Analysis:
Below is the Weekly/Monthly chart (Figure 89) for Technology. The Technology sector has now reached the
major resistance value of 38.39. We will monitor the lower timeframes to determine what will happen at this
resistance value. Right, the lower timeframe is still extremely strong bullish with a support at 37.00
Previous Analysis:
Beginning of Dec 2013, we broke the resistance at 34.35. We have stayed above this resistance value for
beginning of 2014. There is high probability of us reaching the next resistance at 38.42. This may not occur
until a pullback occurs. The timing elements show Technology sector going up in March.
Figure 89: Tradestation Weekly/Monthly Chart of Technology

- 151 -
34. Sector: Materials
Current Analysis:
Below is the Weekly/Monthly chart (Figure 90) for Materials. The Material Sector broke the resistance of 46.54
and is continuing to move higher. The next resistance is at 54.48. Ideally, we want a pull back to 46.54 and
price holds there. If that occurs then there is a high probability of getting to 54.48 and possibly of going
higher.
Previous Analysis:
Materials has moved up since 2011 to the beginning of 2014. We are now approaching the major support at
46.54. We have to observe on the lower time frames to determine what will happen at this resistance value.
Figure 90: Tradestation Weekly/Monthly Chart of Materials

- 152 -
35. Sector: Utilities
Current Analysis:
Below is the Weekly/Monthly chart (Figure 91) for Utilities. The Utilities never closed below the monthly Kijun
Sen. In fact, it held to take price higher to retest the high. Everything reversed since price could not close
lower on the monthly time frame. We are now at the major resistance. As long as the weekly support at
41.39 holds, we have a possibility of going higher.
Previous Analysis:
The Utilities was doing well at the beginning of 2013 but stopped when price hit a resistance at 41.00. After
that, it is slowly going down by having resistances going lower. The supports are going higher so a “squeeze”
is occurring. In the last 2 weeks, price has broken out of the tightening consolidating pattern bearish. The
monthly is also supporting it with the fact it could not retest the high. We will be looking for bearish setup on
the lower timeframes.

- 153 -
Figure 91: Tradestation Weekly/Monthly Chart of Utilities

- 154 -
b. Supersectors
Symbol Description 2013 %
2014 %
$DJUSFI DJ US Financial Service 51.06 -2.80
$DJUSME DJ US Media 45.16 1.28
$DJUSAP DJ US AutoParts 43.64 3.68
$DJUSCG DJ US Cyclical Goods 41.62 5.87
$DJUSIR DJ US Insurance 40.07 2.72
$DJUSHC DJ US Healthcare 38.32 7.47
$DJUSIG DJ US Industrial Goods 37.81 2.62
$DJUSRT DJ US Retail 34.59 -3.46
$DJUSBK DJ US Banks 31.26 2.11
$DJUSCN DJ US Construction and Matrls 28.00 2.48
$DJUSCH DJ US Chemicals 27.55 7.92
$DJUSNG DJ US Non-cyclical Good 24.82 0.24
$DJUSTC DJ US Technology 24.61 7.91
$DJUSFB DJ US Food & Beverage 24.37 5.35
$DJUSEN DJ US Oil & Gas 23.04 10.30
$DJUSUT DJ US Utilities 10.33 10.94
$DJUSTL DJ US Telecommunication 7.41 1.83
$DJUSBS DJ US Basic Resources -1.39 -1.12

- 155 -
c. All Dow Sectors
NOTE: ALL THE SUPPORT/RESISTANCES FOR ALL THESE INSTRUMENTS FOR DAILY/WEEKLY/MONTHLY
TIMEFRAMES CAN BE FOUND AT WWW.ICHIMOKUTRADE.COM UNDER THE SCANNER
Symbol Description % 2014 %
Symbol Description % 2014 %
Symbol
Description % 2014 %
$DJUSAR
DJ US Airlines 89.99 35.07 $DJUSCP
DJ US Container & Packaging
37.09 4.90 $DJUSOI
DJ US Oil Equipment & Services
26.65 15.55
$DJUSOE
DJ US Office Equipment
82.85 2.43 $DJUSEC DJ US Elect Cmpts & Equipment
36.58 7.22 $DJUSENT
DJ US Oil & Gas TR
25.66 11.52
$DJUSTT
DJ US Travel & Tourism
74.59 5.11 $DJUSGI DJ US General Industrials
36.18 -0.46 $DJUSNG
DJ US Non-cyclical Good
24.82 0.24
$DJUSBTT
DJ US Biotechnology TR
69.14 5.76 $DJUSID DJ US Industrials, Diversified
36.15 -1.19 $DJUSRU
DJ US Restaurants & Bars
24.67 1.07
$DJUSBT
DJ US Biotechnology
67.58 5.34 $DJUSIS DJ US Support Services
35.96 -1.46 $DJUSOQ
DJ US Oil Equip Servic & Distr
24.63 14.57
$DJUSBE
DJ US Business Training Employ
66.12 -12.52 $DJUSPG
DJ US Personal Goods
35.88 -2.79 $DJUSTC
DJ US Technology
24.61 7.91
$DJUSCA
DJ US Gambling 63.92 -3.51 $DJUSHP
DJ US Healthcare Providers
35.88 9.36 $DJUSFB
DJ US Food & Beverage
24.37 5.35
$DJUSIL DJ US Insurance, Life
62.57 -0.66 $DJUSAU
DJ US Automobile Manufa
35.45 1.97 $DJUSHG
DJ US Household Goods
23.58 -1.73
$DJUSRP
DJ US Recreational Product
60.01 -7.38 $DJUSLG
DJ US Hotels 35.12 6.88 $DJUSTS
DJ US Transportation Services
23.57 16.27
$DJUSSB
DJ US Investment Services
57.95 -4.84 $DJUSAM
DJ US Medical Equipment
35.12 6.42 $DJUSEN
DJ US Oil & Gas 23.04 10.30
$DJUSRD
DJ US Retailer, Drug
56.70 11.98 $DJUSRT DJ US Retail 34.59 -3.46 $DJULTC
DJ US Large-Cap Technology
22.75 8.12
$DJUSCE
DJ US Consumer Electronics
56.59 18.37 $DJUSCF DJ US Clothing & Accessories
34.56 -4.16 $DJUSOG
DJ US Oil & Gas Producers
22.45 8.82
$DJUSDN
DJ US Defense 56.47 11.77 $DJUSPB
DJ US Publishing 34.46 -2.42 $DJUSRQ
DJ US Recreation Services
22.06 2.69
$DJUSNS
DJ US Internet Services
55.44 2.04 $DJUSFNT
DJ US Financials TR 34.14 3.65 $DJUSPC
DJ US Waste &Disposal Services
21.67 3.01
$DJUSAE
DJ US Aerospace 53.99 4.37 $DJUSIX DJ US Nonlife Insurance
33.98 3.78 $DJULTCTR
DJ US Large-Cap Tech Tot Ret
21.65 9.10
$DJUSAT
DJ US Auto Parts 53.63 4.92 $DJUSHI DJ US Home Improvement Retaile
33.76 -6.80 $DJUSAL
DJ US Aluminum 21.04 33.08
$DJUSAS
DJ US Aerospace 52.86 0.58 $DJUSBKT
DJ US Banks TR 33.59 2.98 $DJUSCX
DJ US Specialty Chemicals
20.98 5.22
$DJUSFT
DJ US Footwear 52.85 -6.01 $DJUSEE DJ US Electronic & Electrical
33.55 3.55 $DJUSFR
DJ US Forest Products
20.67 -2.90
$DJUSGF
DJ US General Financial
51.06 -2.80 $DJUSVN
DJ US Distillers & Vintners
33.34 22.83 $DJUSPP
DJ US Paper Products
20.67 -2.90
$DJUSFI DJ US Financial Service
51.06 -2.80 $DJUSSCT
DJ US Semiconductors TR
33.12 18.93 $DJUSBMT
DJ US Basic Materials TR
20.00 6.62
$DJUSSF
DJ US Consumer Finance
51.02 -1.67 $DJUSPRT
DJ US Pharmaceuticals TR
32.99 10.35 $DJUSHN
DJ US Hh Prod, Non Durable
19.72 -1.70
$DJUSFA
DJ US Financial Administration
50.79 0.42 $DJUSCC
DJ US Chemicals Commodity
32.69 10.27 $DJUSBV
DJ US Beverage 19.39 4.20
$DJUSSP
DJ US Specialty Finance
50.59 2.80 $DJUSIV DJ US Business Support Service
32.26 -3.53 $DJUSOL
DJ US Integrated Oil & Gas
18.10 2.69
$DJUSRS
DJ US Retailers, Specialty
49.32 -4.47 $DJUSIU DJ US Reinsurance 32.21 6.10 $DJUSMS
DJ US Medical Supplies
17.97 -3.15
$DJUSAV
DJ US Media Agencies
49.13 -3.13 $DJUSMC
DJ US Health Care Equip & Serv
32.18 7.11 $DJUSUO
DJ US Gas Water Multiutilities
17.88 7.96
$DJUSLE
DJ US Leisure Goods
49.06 3.59 $DJUSAI DJ US Electronic Equipment Idx
32.15 1.98 $DJUSST
DJ US Steel 17.85 -8.28

- 156 -
$DJUSIF DJ US Insurance Full Line
47.00 5.25 $DJUSFN
DJ US Financial 31.51 2.74 $DJUSSD
DJ US Soft Drinks 17.73 1.60
$DJUSTR
DJ US Tires 46.35 12.26 $DJUSFP DJ US Food Products
31.31 6.54 $DJUSBM
DJ US Basic Materials
17.29 5.66
$DJUSBC
DJ US Broadcasting
45.80 1.80 $DJUSWCT
DJ US Mobile Telecomm TR
31.31 1.03 $DJUSHR
DJ US Commercial Vehicle&Truck
17.20 10.59
$DJUSDR
DJ US Food & Drug Retailers
45.65 6.06 $DJUSBK
DJ US Banks 31.26 2.11 $DJUSTQ
DJ US Tech Hardware & Equip
16.99 13.21
$DJUSMF
DJ US Mortgage Finance
45.42 -10.74 $DJUSWC
DJ US Wireless Comm
31.19 0.95 $DJUSIM
DJ US Industrial Metals
16.72 -3.58
$DJUSME
DJ US Media 45.16 1.28 $DJUSHV
DJ US Heavy Construction
30.28 -4.11 $DJUSCT
DJ US Telecomm Equipment
16.48 8.87
$DJUSFH
DJ US Furnishings
45.04 -1.98 $DJUSRA
DJ US Retailer, Apparel
30.28 -4.32 $DJUSUTT
DJ US Utilities TR 14.65 12.85
$DJUSMT
DJ US Marine Transportation
44.71 11.11 $DJUSOS
DJ US Exploration & Production
30.05 16.63 $DJUSNF
DJ US Non Ferrous Metals
14.15 -9.99
$DJUSAP
DJ US AutoParts 43.64 3.68 $DJUSNCT
DJ US Consumer Goods TR
30.03 3.67 $DJUSWU
DJ US Water Utilities
13.71 10.92
$DJUSFE
DJ US Industrial Machinery Idx
43.45 2.74 $DJUSIQ DJ US Industrial Engineering
29.94 6.43 $DJUSCS
DJ US Specialized Consumer Svc
12.99 -5.53
$DJUSAG
DJ US Asset Managers
43.19 -2.95 $DJUSSC DJ US Semiconductors
29.94 17.62 $DJUSDS
DJ US Industrial Suppliers Idx
12.97 3.58
$DJUSTY
DJ US Toys 43.06 6.18 $DJUSFO
DJ US Food Producers
29.80 6.54 $DJUSMU
DJ US Multiutilities
12.75 6.14
$DJUSIB
DJ US Insurance Brokers
42.79 4.79 $DJUSIP DJ US Insurance, Prop/Casua
29.49 0.71 $DJUSPL
DJ US Pipelines 12.29 11.41
$DJUSAF
DJ US Delivery Services
41.85 -3.51 $DJUSDB
DJ US Brewers 29.44 26.86 $DJUSTLT
DJ US Telecommunications TR
12.09 4.07
$DJUSCG
DJ US Cyclical Goods
41.62 5.87 $DJUSGT
DJ US General Retailers
29.43 -6.36 $DJUSTK
DJ US Trucking 12.03 7.69
$DJUSPN
DJ US Pharmaceuticals & Bio
41.35 7.64 $DJUSPR
DJ US Pharmaceuticals
29.37 9.05 $DJUSTB
DJ US Tobacco 11.15 6.02
$DJUSCYT
DJ US Consumer Services TR
40.85 0.40 $DJUSFD
DJ US Food Retailers & Wholesa
29.29 -3.42 $DJUSUT
DJ US Utilities 10.33 10.94
$DJUSFV
DJ US Financial Service
40.79 -0.11 $DJUSCM
DJ US Personal Products
29.19 0.05 $DJUSCR
DJ US Computer Hardware
10.15 12.72
$DJUSHCT
DJ US Health Care TR
40.77 8.27 $DJUSSV DJ US Software & Computer Serv
28.47 2.63 $DJUSHB
DJ US Home Construction
8.72 -0.35
$DJUSINT
DJ US Industrials TR
40.60 3.40 $DJUSSW
DJ US Software 28.38 5.07 $DJUSTL
DJ US Telecommunication
7.41 1.83
$DJUSHD
DJ US Hh Prod, Durable
40.12 -2.56 $DJUSCN
DJ US Construction and Matrls
28.00 2.48 $DJUSVE
DJ US Conv Electr Idx
6.78 12.22
$DJUSIR
DJ US Insurance 40.07 2.72 $DJUSRB
DJ US Retailer, Broadline
27.74 -10.02 $DJUSEU
DJ US Electric Utility
6.77 12.22
$DJUSRR
DJ US Railroads 39.15 11.64 $DJUSCH
DJ US Chemicals 27.55 7.92 $DJUSDV
DJ US Computer Services
4.33 -2.45
$DJUSCY
DJ US Consumer Cyclical
38.95 -0.18 $DJUSNC
DJ US Consumer Non-cycl
26.93 2.51 $DJUSFC
DJ US Fixed Line Commun
4.30 1.66
$DJUSHC
DJ US Healthcare 38.32 7.47 $DJUSBD
DJ US Building Material
26.82 5.87 $DJUSBS
DJ US Basic Resources
-1.39 -1.12
$DJUSIN
DJ US Industrials 38.06 2.61 $DJUSGU
DJ US Gas Distribution
26.77 11.24 $DJUSRE
DJ US Real Estate -2.65 12.73
$DJUSIG
DJ US Industrial Goods
37.81 2.62 $DJUSTCT
DJ US Technology TR
26.74 8.78 $DJUSCL
DJ US Coal -14.45 2.21
$DJUSIT
DJ US Industrial Trans
37.41 5.40 $DJUSOQT
DJ US Oil Equip Srvc&Distr Tot
26.72 15.75 $DJUSPT
DJ US Platinum Precious Metals
-24.51 10.40
$DJUSMG
DJ US Mining -35.66 7.16
$DJUSPM
DJ US Gold Mining
-52.17 10.19

- 157 -

- 158 -
5. S&P500 Analysis
NOTE: ALL THE SUPPORT/RESISTANCES FOR ALL THESE INSTRUMENTS FOR DAILY/WEEKLY/MONTHLY
TIMEFRAMES CAN BE FOUND AT WWW.ICHIMOKUTRADE.COM UNDER THE SCANNER
Sym Description 2013 %
2014 %
Sym Description 2013 %
2014 %
Symbol Description 2013 %
2014 %
NFLX Netflix Inc 286.69 16.17 ADP Automatic Data Proc
39.17 -2.46 AA Alcoa Inc 19.71 36.59
MU Micron Technology
229.55 43.31 PLL Pall Corp 39.01 -1.57 MRK Merck & Co 19.57 16.36
BBY Best Buy 227.42 -28.18 GM General Motors Company
38.97 -12.82
FTI FMC Technologies
19.45 12.72
DAL Delta Airlines Inc
127.59 42.85 ROK Rockwell Automation
38.78 6.31 MO Altria Group 19.45 7.97
ETFC E Trade Financial Corporation
114.18 2.70 MDT Medtronic, Inc 38.76 5.77 COP ConocoPhillips 19.44 17.59
PBI Pitney Bowes 112.20 17.90 HOG Harley-Davidson 38.65 -0.22 DRI Darden Restaurants
19.02 -8.63
CELG Celgene Corp 110.90 -5.31 ALXN Alexion Pharmaceuticals
38.20 23.22 ADI Analog Devices 19.00 9.21
BSX Boston Scientific Corporation
106.17 6.49 MMC Marsh & McLennan Companies Inc
38.13 5.09 PDCO Patterson Companies
18.80 -6.04
GILD Gilead Sciences
102.10 7.48 TYC Tyco Intl Ltd 38.09 9.04 RAI Reynolds American Inc
18.80 19.52
YHOO Yahoo Inc 100.20 -8.65 ROST Ross Stores 38.07 -10.42
BF.B Brown-Forman'B'
18.60 23.91
GNW Genworth Financial Inc
99.87 12.23 ZMH Zimmer Holdings 37.86 13.30 PG Procter & Gamble
18.59 -2.17
FB Facebook Inc 99.16 18.02 GLW Corning Inc 37.82 18.97 CNP Centerpoint Energy
18.51 3.58
STZ Constellation Brands 'A'
95.77 17.33 TWC Time Warner Cable Inc
37.75 4.99 COST Costco Wholesale
18.31 -3.13
ACT Actavis plc 93.53 24.40 CCE Coca-Cola Enterprises Inc
37.65 1.02 AVP Avon Products 18.03 -14.69
LNC Lincoln Natl Corp
93.04 -2.07 HOT Starwood Hotels&ResWorldwide
37.50 1.16 CVC Cablevision Sys'A'
17.42 -5.08
TRIP TripAdvisor Inc When-Issued
92.90 23.12 CFN CareFusion Corp 37.45 7.28 SHW Sherwin-Williams
17.26 10.48
WDC Western Digital
92.74 9.80 DLTR Dollar Tree Inc 37.38 -4.43 X U.S. Steel Corporation
17.20 -18.81
GME Gamestop Corp 'A'
92.57 -24.91 MSFT Microsoft Corp 37.28 10.21 PX PraxAir Inc 17.14 1.15
SEE Sealed Air 90.22 -2.23 SPLS Staples Inc 37.22 -30.84
COV Covidien PLC (Ireland)
17.13 5.76
HPQ Hewlett-Packard
88.67 25.66 UNH UnitedHealth Group Inc
37.21 5.15 GAS AGL Resources Inc
17.02 12.07
AIZ Assurant Inc 88.60 1.75 LYB LyondellBasell Ind N.V. 'A'
37.14 23.27 QCOM Qualcomm Inc 16.78 6.55
BIIB Biogen Idec 87.98 10.88 PPG PPG Indus 37.10 7.70 F Ford Motor 16.63 7.32
PCLN Priceline.com Inc
82.24 2.31 AME Ametek, Inc 37.09 1.14 DVN Devon Energy 16.60 26.14
GHC Graham Holdings Company
80.24 5.38 ZION Zions Bancorp 36.93 -1.13 NWSA News Corp Cl A
16.56 -4.38
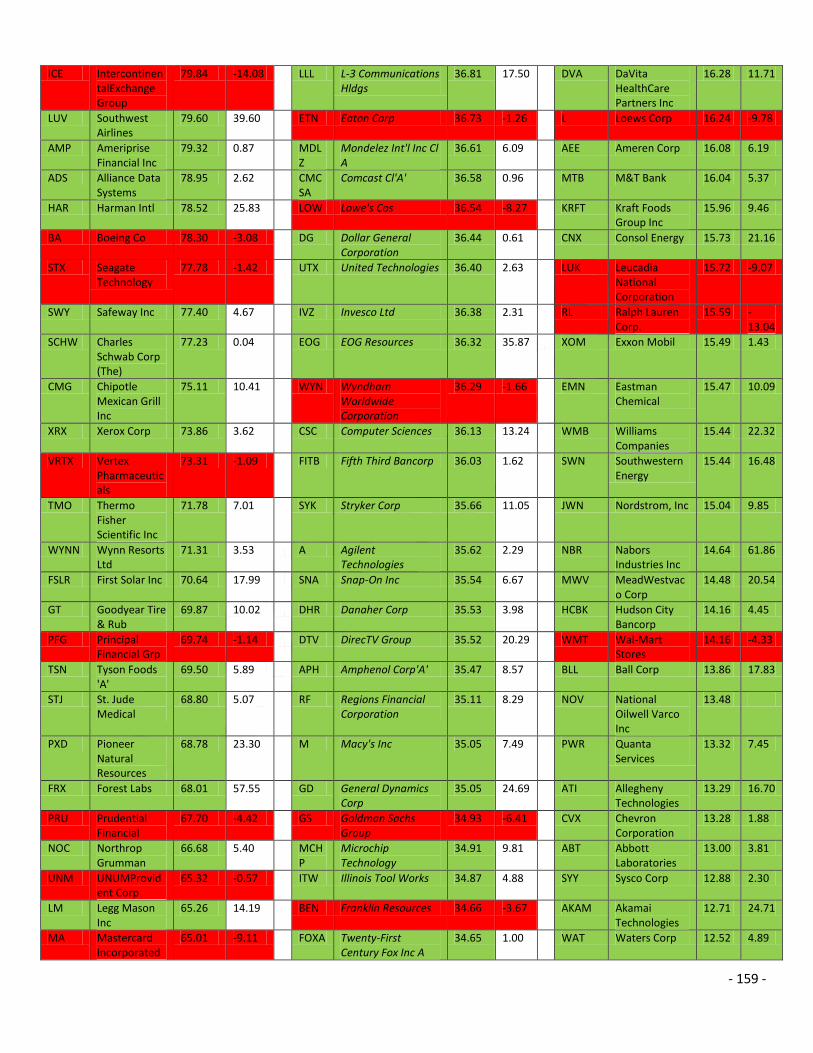
- 159 -
ICE IntercontinentalExchange Group
79.84 -14.08 LLL L-3 Communications Hldgs
36.81 17.50 DVA DaVita HealthCare Partners Inc
16.28 11.71
LUV Southwest Airlines
79.60 39.60 ETN Eaton Corp 36.73 -1.26 L Loews Corp 16.24 -9.78
AMP Ameriprise Financial Inc
79.32 0.87 MDLZ
Mondelez Int'l Inc Cl A
36.61 6.09 AEE Ameren Corp 16.08 6.19
ADS Alliance Data Systems
78.95 2.62 CMCSA
Comcast Cl'A' 36.58 0.96 MTB M&T Bank 16.04 5.37
HAR Harman Intl 78.52 25.83 LOW Lowe's Cos 36.54 -8.27 KRFT Kraft Foods Group Inc
15.96 9.46
BA Boeing Co 78.30 -3.08 DG Dollar General Corporation
36.44 0.61 CNX Consol Energy 15.73 21.16
STX Seagate Technology
77.78 -1.42 UTX United Technologies 36.40 2.63 LUK Leucadia National Corporation
15.72 -9.07
SWY Safeway Inc 77.40 4.67 IVZ Invesco Ltd 36.38 2.31 RL Ralph Lauren Corp.
15.59 -13.04
SCHW Charles Schwab Corp (The)
77.23 0.04 EOG EOG Resources 36.32 35.87 XOM Exxon Mobil 15.49 1.43
CMG Chipotle Mexican Grill Inc
75.11 10.41 WYN Wyndham Worldwide Corporation
36.29 -1.66 EMN Eastman Chemical
15.47 10.09
XRX Xerox Corp 73.86 3.62 CSC Computer Sciences 36.13 13.24 WMB Williams Companies
15.44 22.32
VRTX Vertex Pharmaceuticals
73.31 -1.09 FITB Fifth Third Bancorp 36.03 1.62 SWN Southwestern Energy
15.44 16.48
TMO Thermo Fisher Scientific Inc
71.78 7.01 SYK Stryker Corp 35.66 11.05 JWN Nordstrom, Inc 15.04 9.85
WYNN Wynn Resorts Ltd
71.31 3.53 A Agilent Technologies
35.62 2.29 NBR Nabors Industries Inc
14.64 61.86
FSLR First Solar Inc 70.64 17.99 SNA Snap-On Inc 35.54 6.67 MWV MeadWestvaco Corp
14.48 20.54
GT Goodyear Tire & Rub
69.87 10.02 DHR Danaher Corp 35.53 3.98 HCBK Hudson City Bancorp
14.16 4.45
PFG Principal Financial Grp
69.74 -1.14 DTV DirecTV Group 35.52 20.29 WMT Wal-Mart Stores
14.16 -4.33
TSN Tyson Foods 'A'
69.50 5.89 APH Amphenol Corp'A' 35.47 8.57 BLL Ball Corp 13.86 17.83
STJ St. Jude Medical
68.80 5.07 RF Regions Financial Corporation
35.11 8.29 NOV National Oilwell Varco Inc
13.48
PXD Pioneer Natural Resources
68.78 23.30 M Macy's Inc 35.05 7.49 PWR Quanta Services
13.32 7.45
FRX Forest Labs 68.01 57.55 GD General Dynamics Corp
35.05 24.69 ATI Allegheny Technologies
13.29 16.70
PRU Prudential Financial
67.70 -4.42 GS Goldman Sachs Group
34.93 -6.41 CVX Chevron Corporation
13.28 1.88
NOC Northrop Grumman
66.68 5.40 MCHP
Microchip Technology
34.91 9.81 ABT Abbott Laboratories
13.00 3.81
UNM UNUMProvident Corp
65.32 -0.57 ITW Illinois Tool Works 34.87 4.88 SYY Sysco Corp 12.88 2.30
LM Legg Mason Inc
65.26 14.19 BEN Franklin Resources 34.66 -3.67 AKAM Akamai Technologies
12.71 24.71
MA Mastercard Incorporated
65.01 -9.11 FOXA Twenty-First Century Fox Inc A
34.65 1.00 WAT Waters Corp 12.52 4.89

- 160 -
MCK McKesson Corp
64.78 13.14 DOW Dow Chemical 34.55 18.02 CAG Conagra Foods 12.45 -3.56
OI Owens-Illinois 64.43 -6.99 WPX WPX Energy Inc 34.34 11.73 MRO Marathon Oil Corp
12.31 10.71
CBS CBS Corporation
64.19 -5.16 BCR Bard (C.R.) 33.99 2.60 ORCL Oracle Corp 12.23 10.14
VFC VF Corp 62.94 -1.12 MAS Masco Corp 33.94 -4.04 YUM Yum Brands 12.16 4.79
JCI Johnson Controls
62.75 -3.24 AZO AutoZone Inc 33.88 9.45 RSG Republic Services Inc
12.12 10.57
VIAB Viacom Inc Cl 'B'
62.16 -1.64 CTSH Cognizant Tech Solutions'A'
33.82 -6.10 JNPR Juniper Networks
12.12 8.95
BMY Bristol-Myers SQUIBB
61.85 -11.40 FLR Fluor Corp 33.82 -3.30 LEG Leggett & Platt 12.02 8.18
CI Cigna Corp 61.70 4.05 HSY The Hershey Company
33.45 0.42 KO Coca-Cola Co 11.68 -2.28
ABC AmeriSourceBergen Corp
61.30 2.09 ALL Allstate Corp 33.35 8.20 CF CF Industries Holdings Inc
11.53 0.94
CME CME Group Inc
61.11 -8.93 AES AES Corp 33.24 -2.14 VMC Vulcan Materials
11.48 8.97
GCI Gannett Co 61.02 -2.87 BK Bank Of New York 33.10 1.20 CSCO Cisco Systems 11.48 10.12
MHK Mohawk Indus
60.99 -11.24 RRC Range Resources 32.86 4.60 GRMN Garmin Ltd 11.35 28.32
CAH Cardinal Health Inc
60.60 1.41 BHI Baker Hughes Inc 32.61 28.75 EXPE Expedia Inc 11.26 6.60
CHK Chesapeake Energy
60.21 12.27 KLAC KLA-Tencor Corp 32.06 6.38 WEC Wisconsin Energy Corp
10.95 9.02
TIF Tiffany & Co 59.66 6.74 NBL Noble Energy 31.69 11.86 RDC Rowan Companies Plc (UK) new
10.78 -8.37
LMT Lockheed Martin
58.50 10.35 WM Waste Management Inc
31.55 -1.94 WY Weyerhaeuser Co
10.77 -2.31
MET Metlife Inc 58.40 1.02 CINF Cincinnati Financial 31.22 -6.65 VZ Verizon Communications
10.45 0.08
SNDK SanDisk Corp 58.34 39.59 NI Nisource Inc 30.84 13.11 EXPD Expeditors Intl of Washington
9.88 0.95
ADBE Adobe Systems
57.58 11.59 UNP Union Pacific Corporation
30.77 20.12 FCX Freeport-McMoRan Copper&Gold B
9.87 -9.99
HIG Hartford Finl Svcs Grp
57.52 -1.38 FLIR Flir Systems 30.64 18.80 BEAM Beam Inc. 9.79
REGN Regeneron Pharmaceuticals
57.17 11.27 KSS Kohl's Corp 30.61 -8.16 DHI D.R. Horton 9.73 5.02
IPG Interpublic Grp Cos
57.05 10.51 AMGN
Amgen Inc 30.59 1.71 VNO Vornado Realty Trust
9.33 17.69
NDAQ NASDAQ OMX Group Inc
56.63 -7.71 PCAR PACCAR Inc 30.56 6.96 DTE DTE Energy 9.14 12.17
FLS Flowserve Corp
56.50 -1.98 PNC PNC Financial Services Group
30.36 13.19 VAR Varian Medical Systems
8.95 5.33
MYL Mylan Inc 55.89 15.67 APD Air Products & Chem
30.33 8.36 DPS Dr Pepper Snapple Grp Inc
8.77 18.60
KEY KeyCorp 55.87 6.04 GE General Electric 30.13 -3.53 RIG TransOcean Ltd
8.62 -10.30
GOOG Google Inc Cl A
55.78 -1.53 HSP Hospira Inc 30.10 23.06 K Kellogg Co 8.41 10.05

- 161 -
AMZN Amazon.com Inc
55.73 -18.19 TSO Tesoro Corporation 30.09 -1.23 PHM PulteGroup, Inc
8.29 -4.66
MS Morgan Stanley
55.56 0.73 EMR Emerson Electric Co 30.06 -5.29 CMS CMS Energy 8.29 10.42
AXP American Express Company
55.55 4.54 RHI Robert Half Intl 30.04 12.84 MCD McDonald's Corp
8.28 3.57
EA Electronic Arts, Inc.
55.31 55.54 JPM JPMorgan Chase & Co
30.01 -2.46 AEP Amer Electric Pwr
8.27 12.92
PNR Pentair Inc 55.15 -3.21 LLTC Linear Technology Corp
29.85 3.51 TGT Target Corp 8.04 -9.55
RTN Raytheon Co 54.99 6.49 WFC Wells Fargo 29.60 14.32 CCL Carnival Corp 7.87 -3.11
KORS Michael Kors Holdings, Ltd.
54.88 15.65 $INX S&P 500 Index 29.60 4.75 MKC Mccormick & Co
7.45 4.05
ADM Archer-Daniels-Midland
54.61 1.01 HD Home Depot Inc 29.53 -5.19 APA Apache Corp 7.41 13.64
DLPH Delphi Automotive PLC
54.02 13.07 BRK.B
Berkshire Hathaway'B'
29.42 6.73 NU Northeast Utilities
7.34 7.01
HES Hess Corporation
53.87 15.60 LB L Brands Inc 29.39 -5.75 SWK Stanley Black & Decker Inc
7.26 8.03
FDX FedEx Corp 53.83 -2.43 TAP Molson Coors Brewing Co Cl 'B'
29.32 26.86 MUR Murphy Oil Corp
7.01 0.62
TSS Total System Svcs
53.79 -8.38 BAC Bank of America Corporation
29.21 -0.83 DUK Duke Energy Corporation
6.74 2.64
CMA Comerica Inc 53.65 5.38 CBG CBRE Group, Inc. 29.17 16.12 NE Noble Corp plc 5.67 -11.48
HRB Block (H&R) 53.65 11.88 JNJ Johnson & Johnson 29.15 11.94 PETM Petsmart Inc 5.18 -19.97
DNB Dun & Bradstreet
53.59 -15.32 MAR Marriott Int'l Cl A 28.78 24.38 EBAY Ebay Inc 4.71 -10.63
COG Cabot Oil & Gas Corp
53.20 -10.55 COF Capital One Financial
28.69 5.04 APC Anadarko Petroleum
4.71 37.88
STT State Street Corp
52.90 -9.72 GPC Genuine Parts 28.58 2.30 LH Laboratory Corp Amer Hldgs
3.94 11.38
BWA Borg Warner 52.63 16.47 CRM salesforce.com Inc 28.53 -1.59 DE Deere & Co 3.82 -0.94
FIS Fidelity National Information
52.63 0.32 LO Lorillard Inc (New) 28.43 20.60 PEG Public Svc Enterprises
3.69 18.10
MCO Moody's Corp 52.43 9.29 SE Spectra Energy Corp 28.04 15.58 PPL PPL Corp 3.58 13.09
VRSN Verisign Inc 51.92 -15.01 MAT Mattel, Inc 27.97 -19.15
PCL Plum Creek Timber
3.42 -5.12
AMAT Applied Materials
51.89 26.53 ESRX Express Scripts Holding Co
27.76 1.92 RHT Red Hat Inc 3.26 -7.35
WAG Walgreen Co 51.72 27.19 NVDA
Nvidia Corp 27.55 21.97 BAX Baxter Intl 3.25 5.13
LSI LSI Corporation
51.65 ACE ACE Limited (Switzerland)New
27.50 0.36 XEL Xcel Energy 3.18 9.84
LIFE Life Technologies Corp
51.63 IFF Intl Flavors/Fragr 27.38 17.22 TEG Integrys Energy Group Inc
3.09 6.05
WLP WellPoint Inc 51.26 15.68 C Citigroup Inc 27.38 -8.67 PSA Public Storage 3.03 12.63
HAS Hasbro Inc 51.25 -4.76 SLB Schlumberger Ltd 27.27 20.13 CAM Cameron International Corp
3.01 9.34
WHR Whirlpool Corp
51.20 -11.88 THC Tenet Healthcare 26.98 11.51 EIX Edison Intl 2.91 18.55

- 162 -
BLK Blackrock Inc'A'
51.18 -2.22 PKI Perkinelmer Inc 26.94 12.56 PM Philip Morris Intl Inc
2.87 1.51
SLM SLM Corp 50.77 INTU Intuit Inc 26.92 3.50 FTR Frontier Communications Corp
2.65 21.29
CA CA Inc 50.36 -14.00 PGR Progressive Corporation (The)
26.78 -3.73 PNW Pinnacle West Capital
2.32 2.46
NKE Nike, Inc'B' 50.08 -5.11 STI SunTrust Banks 26.58 9.37 T AT&T Inc 2.24 -0.37
KR Kroger Co 50.08 19.28 FMC FMC Corp 26.48 2.37 LLY Lilly (Eli) 2.12 15.49
DIS Disney (Walt) Co
49.92 8.38 CMI Cummins Inc 26.43 10.68 FDO Family Dollar Stores
2.01 2.60
EQT EQT Corporation
49.41 17.90 TROW
T.Rowe Price Group 26.31 -2.30 AMT American Tower Corporation
1.94 10.80
TMK Torchmark Corp
49.14 4.24 MNST
Monster Beverage Corporation
26.20 1.62 TE Teco Energy 1.71 0.87
AON Aon Plc 49.11 7.20 XLNX Xilinx Inc 26.15 1.83 AAPL Apple Inc 1.30 13.89
MMM 3M Co 48.90 2.22 CB Chubb Corp 26.12 -3.24 SCG Scana Corp 1.23 8.01
TJX TJX Companies
48.55 -14.03 SIAL Sigma-Aldrich 26.05 6.40 ALLE Allegion plc 0.66 26.93
NLSN Nielsen Holdings N.V.
48.03 1.09 IGT Intl Game Technology
25.76 -12.67
KIM Kimco Realty 0.56 14.89
HUM Humana Inc 48.01 20.77 EFX Equifax Inc 25.71 3.75 CCI Crown Castle Intl
0.20 0.50
OMC Omnicom Group
47.27 -5.57 BBT BB&T Corp 25.70 2.87 KMI Kinder Morgan Inc
0.14 -2.25
FISV Fiserv Inc 47.11 1.46 CLX Clorox Co 25.54 -2.90 GGP General Growth Properties Inc
-0.05 17.14
PH Parker-Hannifin
47.10 -1.14 FOSL Fossil Group Inc 25.38 -11.26
MAC Macerich Co -0.34 10.99
LRCX Lam Research 47.08 20.66 MJN Mead Johnson Nutrition Co
25.28 4.41 QEP QEP Resources Inc
-0.39 5.48
NSC Norfolk Southern
47.02 8.97 XYL Xylem, Inc. 25.23 11.56 FAST Fastenal Co -0.42 4.34
SNI Scripps Ntwrks Interactive Inc
46.88 -10.44 EL Lauder (Estee) Co 24.81 1.55 PLD ProLogis Inc -0.70 10.72
HBAN Huntington Bancshares
46.43 -2.18 XL XL Group Plc 'A' 24.76 3.05 PCG PG&E Corp -0.86 15.57
HP Helmerich & Payne
46.18 34.49 COL Rockwell Collins 24.72 7.37 DNR Denbury Resources
-0.96 7.61
TXT Textron, Inc 46.05 7.18 SRE Sempra Energy 24.70 12.66 LEN Lennar Corp'A' -0.98 1.57
CVS CVS Caremark Corporation
46.00 5.99 GWW
Grainger (W.W.) 24.67 1.72 EMC EMC Corp -1.41 5.84
PRGO Perrigo Co plc 45.86 -8.52 USB US Bancorp 24.46 6.58 COH Coach Inc -1.49 -29.86
AET Aetna Inc 45.78 18.01 WU Western Union Co (THE)
24.28 -6.72 ED Consolidated Edison
-1.74 -0.11
TEL TE Connectivity Ltd
45.52 11.52 WFM Whole Foods Market
24.18 -27.17
ZTS Zoetis Inc -1.77 -1.74
JEC Jacobs Engr Group
44.97 -13.10 IR Ingersoll-Rand Plc 23.97 -6330.00
ETR Entergy Corp -2.07 23.60
KSU Kansas City Southern
44.86 -15.51 TRV The Travelers Companies Inc
23.87 5.38 CAT Caterpillar Inc -2.65 17.58
R Ryder System 44.78 17.43 GPS Gap Inc 23.79 5.17 IBM Intl Business Machines Corp
-3.36 -2.67

- 163 -
V Visa Inc 44.45 -5.11 PBCT People's United Financial Inc
23.73 -1.98 POM Pepco Holdings
-3.63 43.02
DOV Dover Corp 44.26 -9015.00
AN AutoNation Inc 23.61 11.33 IRM Iron Mountain Inc
-3.71 2.14
VLO Valero Energy 44.08 6.63 D Dominion Resources Inc
23.55 5.80 BXP Boston Properties
-3.96 16.38
OKE Oneok Inc 43.77 4.78 CL Colgate-Palmolive Co
23.48 4.06 SPG Simon Property Group
-5.01
CTAS Cintas Corp 43.66 5.91 KMX CarMax Inc 23.09 -6.02 SO Southern Company Inc
-5.21 5.89
PAYX Paychex Inc 43.63 -9.73 SRCL Stericycle Inc 23.07 1.98 ESV Ensco plc (new) Cl A
-5.46 -6.80
SBUX Starbucks Corp
43.60 -4.72 CPB Campbell Soup 23.02 4.71 AIV Apartment Investment & Mgmt'A'
-5.64 23.77
ABBV AbbVie Inc 43.35 2.56 AFL AFLAC Inc 23.02 -7.25 CTXS Citrix Systems -5.77 0.66
ECL Ecolab Inc 43.31 3.72 NRG NRG Energy Inc 23.00 27.82 WIN Windstream Holdings Inc
-6.23 22.81
NWL Newell Rubbermaid
43.22 -5.62 SYMC
Symantec Corp 22.88 -7.97 ALTR Altera Corp. -7.22 4.58
HRL Hormel Foods 43.12 6.58 INTC Intel Corp 22.74 15.06 URBN Urban Outfitters
-7.80 -9.65
CSX CSX Corp 43.06 5.49 ROP Roper Indus 22.51 5.40 DGX Quest Diagnostics
-8.74 10.59
HAL Halliburton Co
43.04 33.16 NEE NextEra Energy Inc 22.44 13.03 CHRW C.H. Robinson Worldwide Inc
-8.98 6.27
MPC Marathon Petroleum Corp
42.99 -5.79 KMB Kimberly-Clark 22.36 5.94 EXC Exelon Corp -9.09 30.41
TWX Time Warner 42.96 IP Intl Paper 22.18 -1.94 FFIV F5 Networks -9.23 23.60
AVY Avery Dennison Corp
42.22 -0.90 GIS Genl Mills 22.03 8.82 EQR Equity Residential
-9.85 19.07
PSX Phillips 66 42.12 8.25 MON Monsanto Co 21.98 2.68 NFX Newfield Exploration
-9.98 64.23
BBBY Bed Bath & Beyond
42.10 -24.99 HST Host Hotels & Resorts Inc
21.88 14.15 JOY Joy Global, Inc. -11.28
4.45
DFS Discover Financial Services
42.04 9.06 ACN Accenture PLC (Ireland) NEW
21.72 0.62 JBL Jabil Circuit -12.23
13.47
ORLY O'Reilly Automotive, Inc.
41.97 16.18 NTRS Northern Trust 21.47 0.52 BRCM Broadcom Corp'A'
-12.54
29.34
HON Honeywell Intl
41.66 2.63 OXY Occidental Petroleum
21.36 8.55 VTR Ventas Inc -12.63
11.10
PCP Precision Castparts
41.57 -1.36 NUE Nucor Corp 21.04 -4.76 HCN Health Care Reit
-13.74
17.92
CERN Cerner Corp 41.47 -5.01 NTAP NetApp Inc 20.96 -13.32
ADT The ADT Corp -14.00
-16.09
DD Dupont(E.I.)Denemours
41.39 5.13 BMS Bemis Co 20.83 -0.10 AVB Avalonbay Communities
-14.24
18.43
AIG Amer Intl Group
40.67 7.15 XRAY Dentsply Intl 20.54 -1.40 DO Diamond Offshore Drilling
-14.30
-10.52
MHFI McGraw-Hill Financial Inc
40.57 6.60 ARG Airgas Inc 20.50 -5.13 MOS The Mosaic Company (New)
-18.58
2.77

- 164 -
UPS United Parcel'B'
40.01 -3.85 PVH PVH Corp. 20.05 -14.35
CTL CenturyLink Inc
-20.18
16.01
HRS Harris Corp 40.01 8.85 PFE Pfizer Inc 20.02 -3.59 HCP HCP Inc -20.70
14.23
DISCA Discovery Communications Inc
39.99 -14.05 AGN Allergan, Inc 19.91 45.65 FE FirstEnergy Corp
-21.94
3.64
BDX Becton, Dickinson
39.74 6.47 PEP Pepsico Inc 19.89 5.12 ISRG Intuitive Surgical
-24.17
3.32
ADSK Autodesk, Inc 39.58 7.81 MSI Motorola, Inc. 19.85 -1.07 TDC Teradata Corp -27.94
-4.55
TXN Texas Instruments
39.18 10.07 SJM Smucker (J.M.) 19.82 1.56 EW Edwards Lifesciences
-28.46
19.16
BTU Peabody Energy
-29.26
-14.03
CLF Cliffs Natural Resources Inc
-34.91
-46.05
NEM Newmont Mining
-51.35
1.61
- 165 -
6. Disclaimer
This report contains or may contain references and links to other companies and/or their web sites. E.I.I. Capital Group
makes no representations, warranties or endorsements whatever about any other Web sites to which you may have
access through this report. You use this report and all E.I.I. Capital Group (and affiliated) products and services at your
own risk. In no event shall E.I.I. Capital Group be liable for any special, incidental, indirect or consequential damages of
any kind, or any financial losses or damages whatever, including, without limitation, those resulting from loss of (or
errors in) service, software or data, whether or not we have been advised of the possibility of such damages, and
regardless of the theory of liability. This site could, and likely do, include some technical and other inaccuracies and
errors. © Copyright, All Rights Reserved.