eiffects of refresh rates of a simulated crt … · point di~turzce, critical flicker. frequency...
TRANSCRIPT

I~lterrzutioilal Journal of f'ndzrstrial Ergonomics, 1 (1986) 9-20 Elsevier Science Publishers B.V., Amsterdam - Printed in The Netherlands
EiFFECTS OF REFRESH RATES OF A SIMULATED CRT DISPLAY WITH BRIGHT CHARACTERS
ON A DARK SCREEN
Th. Laubli, St. Gyr, K. Nishiyama, R. Gierer and E. Grandjean
Department of Hygiene and Ergonomics, Swiss Federal Institute of Technology, Zurich (Switzerland) -
(Received October 10, 1985; accepted in revised form march 14, 1986)
*
ABSTRACT
Twenty-nine suhjects carried out a 3 hour reading task at a sivt~ulated CRT. In the ap- purutus chopper disc's generuled uscilfuting luminances of bright characters qf 30, 60. 90. 180 aiid 0 HL. A further control experime~zt MSas conducted with a pr~nted text. The oscillat- ing llrrninances had an approximate decay tinze of 4 nzs (to 10% of peak luminance). The churuc.fer iuminur-rc.e was kept constant (75 cd/ nz2). In the sirnulated CR T UN charucters oscil- fated sinzulta~zeousIy.
Before, durmg and (~jter each rcaciirzg tusk, the follo~ling parartzeters were determined: Near point di~turzce, critical flicker. frequency (CFF), uisrral acuity. tzeterophonas, contrast sensitiuity, q 7 e bliizking rate. and subjective symptoms of
discon~f'ort. The reading speed wus contirzuousI,v recorded. Furtherntore the CFF at the sirnu- luted CRT was determined.
Zhe mnge of individuul CFF ar the sirnu- luted CRT was found between 40 and 54 Hz. It is concluded thut most models o j VDTs huve todav refresh rates lying in a cntzcal range of CFF. In euev conclrtiorz the reuding tusk was found to hace an effect on ristdal ,functiom and cuused visuul discomforf. Dij'erentiated resulls anznng the six conditions were onb: observed for CFF and r!isual dzsconzfort. The visible flicker (30 HE) produced the strongesr effects while 180 Hz, 0 Hz and the printed text were ussociated with relatiz~ely small effecis.
INTRODUCTION
Many field studies on VDT operators re- vealed a high incidence of eye complaints (Liiubli and Grandjean. 1984). Although the interpretation of these complaints is still con- troversial. L'iubli et al. (1981) observed a higher incidence of eye complaints and of lowered visual acuity in a group of operators working with VDTs of poor quality, espe-
cially those with high oscillation degrees. It is well known that a visible flickering
light is annoying, producing a strong decrease of critical flicker frequency (CFF) (Rey and Key. 1965). Less clear is the knowledge about effects of oscillating fluorescent lamps; Zacharia and Bitterman (1 95 3) compared the effects of fluorescent lighting with constant and with oscillating luminance (120 cycles per sccond (Hz)). The oscillating light did not
01 69-81 41/86/$03.50 O 1986 Elsevier Science Publishers H.V.

influence the speed of reading while the CFF dropped. Five of 20 subjects could distinguish the two lighting conditions and gave prefer- ence to the constant luminance. When fluo- rescent lighting oscillating at 100 Hz was introduced on a large scale in European offices, some operators complained about eye pains and headaches. That is why lighting technology in Europe subsequently intro- duced lamps with two phase-shifted fluo- rescent tubes. distinctly reducing the degree of oscillation of the light source. Unfor- tunately the effects of oscillating fluorescent tubes were never studied systematically and the question of their importance remains open. The possibility of the existence of adverse effects due to unpcrceived frequency oscilla- tions in lighting must therefore still be con- sidered as a hypothesis.
Today most VDTs have a refresh rate of 50 or 60 Hz. This range seems to be slightly above or very near the visible flicker of CRTs under normal lighting conditions. These con- siderations induced us to construct a simu- lated CKT, generating optionally various oscillating frequencies of bright characters and to study their effects on subjects.
METHODS
The simulated CRT
The apparatus was described by Nishlyama et al., (1986) and only the principle of its operation will be described here. A slide pro- jector was modified so that the luminance from a DC powered halogen lamp was ad- justable in a propcr range by a voltage con- trol. The light beam was projected on a screen of 170 X 210 mm. A chopper disk was located in the focus of the final projection lens. The chopper disk was driven by a servoamplifier system and the light could be continuously varied from a constant light up to a frequency modulated light of 180 Hz. The chopper disks
were perforated in such a way that they created oscillating luininances that were simi- lar in shape to those of VDTs (decay time of 4 ms to drop to 10% of the peak luminance).
Text slides with sharpness and contrast characteristics similar to those of a well printed text were prepared and projected on the screen. Characters were bright and the background was dark.
Experimental conditions
The following six conditions were selected: (I) Oscilluting izminance of 30 Hz. This is a
clearly visible flicker and such an oscillation , frequency is perceived as disturbing.
(2) Oscillating lumi~ance of 60 Hz. This is just above flicker fusion, that means it is perceived as a constant luminance.
(3) Oscilluting luminar?ce of 90 Hz. This is clearly above the flicker fusion but the human visual system is able to register changes of luminances at this speed under specific condi- tions (Kelly, 1964).
(4) Oscillating /uminance of 180 Ht. It is assumed that the visual system is not able to react on such a fast oscillation. It is a control condition.
Fig. 1. Characteristics of the lunlinanct: oscillation. Mean luminance and decay time are klept constant.

(5) Constant light ( = oscillating lurninunce 0 Hz). A control.
(6) Pri~ted tent. T h s is a linkage to the known condition with dark characters on white paper.
The applied oscillating characteristics have been measured by an equipment described by Fellmann et al. (1982) and are shown in Fig. 1.
In the conditions 1 to 4 (characterized by luminance oscillations) the mean luminance of characters (75 cd/m2) and the decay time
? (4 tns to drop down to 10% of the peak luminance) were kept constant. In the 0 Hz condition the character luminance was also * 75 cd/m2. The peak lunlinance decreased with increasing oscillation frequency, to keep the mean luninance constant. The printed test was fixed directly on the screen and was consequently in a vertical position. The size of its characters was about the size of the projected ones.
In each condition the experimental room was illuminated by a DC powered incandes- cent light with 200 lx (vertical) and 300 lx (horizontal) at the screen centre.
Dependent variables
1. Near point distance The mean value of three measurements,
taken with a widely used device (Clement C'larke Ltd.) were registered.
2. Critical flicker frequency (CFF) This was measured by an apparatus and
procedure described by Gierer et al. (1981). Each measurement was repeated three times
d
and mean values of these three evaluations were used for the analysis.
*
3. Binocular visual acuity in far vision
4. Lateral heterophoria in far vision
5. Binocular visual acuity in near vision
6. Lateral heterophoria in near vision "Vision Tester" by Titmus, Zeiss, USA
was used for 3, 4, 5 and 6. "Far vision" was 6.1 m and "near vision" was 35.6 cm.
7. Contrast sensitivity in far vision It was measured with an apparatus that is
normally used to evaluate the visual capacity to drive a car at night ("Rodenstock Nyktom- eter").
To get a partial adaptation to dark vision. subjects had to look into the completely dark apparatus for three minutes. Afterwards test targets of low contrasts but of a non-critical size (corresponding to a visual acuity of 0.1) were presented. The test symbol was a black disk with a little cam sticlung out on a brighter surrounding surface. The subject was asked to tell the position of the cam. The luminance of the surface was decreased by eight steps so that the contrast-ratio between disk and sur- rounding decreased logarithmically from 1 : 23.5 to 1 : 1.14.
8. Subjective feelings of discomfort Ten questions concerning eye discomfort
which were observed in a previous field study (Liubli et al.. 1981) and three questions about fatigue were arranged into three groups.
8a. Eye pain, eye fatigue, flickering view. On three stepless scales subjects had to adjust the levels according to the discomfort of eye pain. eye fatigue and flickering view by moving a sliding pointer on each of the three scales. The range of each scale was between "no feeling at all" and "unbearable". The full range of the scale was set at 100 points and each final position of the printer was related to this level. The adjusted levels were elec- tronically recorded and checked by the super- visor. After each trial the pointer was auto- matically reset at the zero level.
8b. Fatigue, bored, tired. On three stepless scales of a questionnaire subjects had to mark

their levels of fatigue. boredom and tiredness. The range of each scale was between "no feelings at all" and "unbearable". The full range of the scale was set at 100 points and each mark was related to this level.
8c. Burning eyes, headache, itching eyes, tears, blurred vision, near, double image. On a second sheet seven questions concerning eye troubles were asked using the kind of stepless scales described in group "llb".
9. Eye blinking rate The experimentalist sat by the side of the
subject and counted the blinking of the right eye during two minutes. Subjects did not known the aim of the i 11 tensive observations.
10. Reading performance The time between the changes of slides
(approximately 2 min) was electronically re- corded. The number of lines read per min was calculated for each slide, and the reading performance at each slide was noted at time intervals of approximately 2 min during each session.
11. CFF levels at the sinnulated CRT In the end of the 60 Hz condition the 60
Hz chopper disk was used to determine the CFF levels of each subject focussing the bright characters. The experi~nentalist assessed the CFF by three ascending and three descending procedures and the individual mean values were recorded.
Procedure
Each subject participated in the six experi- rt~ental conditioils (within subjects design). The sequence of the conditions was random. Experiments were conducted in the morning or afternoon. but a single subject was only tested once a day. Before each session sub- jects were asked about their health, eye trou- bles, headaches, consumption of drugs or al-
cohol~. In such cases experiments were post- poned.
Each subject read the presented text alol~d at a visual distance of about 60 cm under the six sets of conditions. All subjects read the identical text in the logical sequence. It was taken from a text book of ergonomics. Sub- jects reading very fast, needed two or three sessions to read the whole text. When the text was linished it had to be read again; conse- quently the text was read twice or three times in the course of the six sessions, depending on the individual reading speed.
The time schedule of each session was as follows: (numbers in parentheses refer to the test-numbers in the section ''dependent varia- bles'.).
10 min. Adaptation to the lighting condi- tions. Questions (set 8a. 8h and 8c). Full test battery (beginning with test one and ending with test 7) followed by the three groups of questions (8a, 8b. 8c).
15 min. Reading task. After five n~inutes reading, the eye blinking rate was recorded (9). Questions (set 8a).
15 min. Reading task. CFF (2) and questions of sets 8a and 8b.
15 min. Reading task. Questions (set 84 .
15 min. Reading task. Questions (set 8a. 8b, 8c) and test battery (l. 2. 3, 4, 5 , 6).
15 min. Reading task. Questions (set 8a).
15 min. Reading task. CFF (2) and questions (set 8a and 8b).

15 min. Keading task. Questions (set 8a).
15 min. Reading task. Questions (set Xa. 8b. 8c) and test battery (1, 2, 3, 4, 5, 6).
15 min. Reading task. Questions (set 8a).
15 min. Reading task. CFF (2) and questions (set 8a and 8b).
1 5 min. Reading task. r Questions (set 8 4 .
15 min. Reading task. During the last five minutes of reading the eye blinking rate (9) was recorded. Questions (set 8a. 8b, Xc) and full test battery (1. 2, 3, 4, 5. 6, 7). Questions (set 8a. 8b, 8c).
The total reading time therefore lasted 180 min. and the full session lasted about four hours.
Subjects
A total number of 29 subjects were divided in three subgroups:
(A) 13 young subjects between 19 and 26 years with normal vision (four male and nine female);
(B) 7 young subjects between 23 and 33 years wearing glasses (three male and four female);
(C) 9 elderly subjects between 49 and 59 years (two male and seven female).
Each subject was previously examined at the ophthalmic hospital of the University in order to assess their visual characteristics and had to fulfil1 some visual standards to be accepted for the experiments. In group B and C these preliminary tests were done after prescribing any glasses that were required. The limits of acceptance were set as follows: Visual acuity for far and near vision with
both eyes should be above 0.8 Snellen equiv- alents (tested by the Titmus vision tester). Lateral heterophoria (exophoric or esophoric scores) should not exceed three prism di- opters in near or far vision and vertical het- erophoria (far vision) should not exceed 0.5 prism diopters.
Subjects should not suffer from subjective eye troubles. CFF figures had to lie within 38-55 Hz. In the contrast sensitivity test the two easiest figures had to be recognized.
In group A subjects had normal vision. Group B consisted of six myopic and one hyperopic subjects. Five subjects also suffered from astigmatism. In group C the nine sub- jects suffered from presbyopia which in 6 cases was combined with a slight hyperopia or a slight astigmatism. They were provided with special glasses, to get an optimal correc- tion for the visual distance of 60 cm. A tenth subject was eliminated from the study. She started in the 30 Hz condition that was fixed at random. After a few minutes of reading she complained about dizziness and general feelings of discomfort and was unwilling to go on with the experiment or to take part in the other conditions.
RESULTS
The CFF measured on the oscillating bright characters
The results of 28 subjects focussing the screen centre are reported as a cumulative distribution in Fig. 2. (In one case the experi- mentalist did not measure it by mistake). The range of individual values lies between 40 and 56 Hz with a mean figure of 48 Hz. When the subjects were focussing slightly outside the screen, the CFF figures were a little higher.
When considering these results the follow- ing remarks must be taken into account:
The CFF measurements were conducted after the reading task sessions. when lowered levels must be expected.
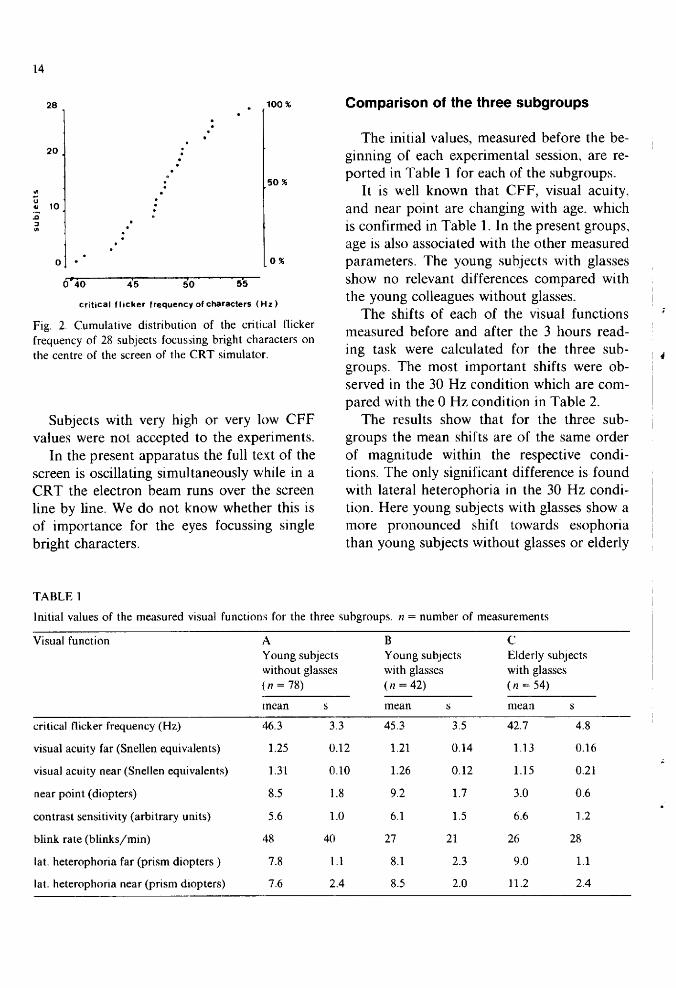
critical f Iicker frequency of characters ( H z )
Fig. 2. Cumulative distribution of the critical flicker frequency of 28 subjects focussing bright characters on the centre of the screen of the CRT simulator.
Subjects with very high or very low CFF values were not accepted to the experiments.
In the present apparatus the lull text of the screen is oscillating simultaneously while in a CRT the electron beam runs over the screen line by line. We do not know whether this is of importance for the eyes focussing single bright characters.
Comparison of the three subgroups
The initial values, measured before the be- ginning of each experimental session, are re- ported in Table 1 for each of the subgroups.
It is well known that CFF, visual acuity. and near point are changing with age. which is confirmed in Table 1. In the present groups, age is also associated with the other measured parameters. The young subjects with glasses show no relevant differences compared with the young colleagues without glasses.
The shifts of each of the visual functions measured before and after the 3 hours read- ing task were calculated for the three sub- groups. The most important shifts were ob- served in the 30 Hz condition which are conl- pared with the 0 H7, condition in Table 2.
The results show that for the three sub- groups the mean shifts are of the same order of magnitude wit hill the respective condi- tions. The only significant difference is found with lateral heterophoria in the 30 Hz condi- tion. Here young subjects with glasses show a inore pronounced shift towards esophoria than young subjects without glasses or elderly
TABLE 1
Inltial values of the measured visual functions for the three subgroups. n = number of measurenlents
Visual function A B C' Young subjects Young subjects Elderly subjects without glasses with glasses with glasses ( n = 78) ( n = 42) ( n = 54)
incan S mean S mean S
critical flicker frequency (Hz)
visual acuity far (Snellen equivalents)
visual acuity near (Snellen equivalents)
near point (diopters)
contrast sensitivity (arbitrary units)
blink rate (blinks/min)
lat. heteropharia far (prism diopters )
lat. heterophoria near (prism dropters)

TABLE 2
Shfts of visual functions after the 3 hours reading tasks for the three groups in the conditions of 30 Hz and of 0 Hz. n = number of subjects
Visual function 30 Hz condition 0 Hz condition
A B C A B C young subj. young subj. elderly subj. young subj. young subj. elderly subj. without with with wi thout with with glasses glasses glasses glasses glasses glasses ( 1 2 =12) (n = 7) ( n = 9 ) (tz = 1 3 ) ( n = 7 ) ( t z = 9)
mean S mean s mean s mean s mean s mean s
critical flicker frequency (W
visual acuity far (Snel len equivalents)
1 visual aculty near (Snellen cquivalents)
near point (diopters)
contrast sensitivity (arbitrary uumts)
blink rate (bliks/min)
lateral helerophoria far (prism diopters)
lateral heteraplloria near (pnsm diopters)
subjects with glasses ( p < 0.05 /-Test). The same analysis was conducted with the
results of the questionnaires dealing with the subjective symptoms: The initial values are very low for each item and reveal neither eye complaints nor fatigue before the sessions. A mean increase of subjective symptoms after the reading tasks is clear for seven items but again no important difference appears among the three subgroups. Only the subgroup of young subjects without glasses has slightly, but not significantly. more symptoms than the two other groups.
-m From the wholc analysis of the three sub- groups it can be concluded that in our experi- ments the three groups react about in the same way to the reading tasks. Since the three groups are rather small, a generalization is not possible. however it is certainly justified
to consider the three groups as one overall group of twenty nine subjects for further analysis.
The effects of oscillating frequencies on visual functions
The figures of the mean shifts of the mea- sured visual functions are reported in Table 3. One of the young subjects did not finish the session with an oscillation of 30 Hz. She judged it to be unbearable. She was dropped from the analysis of the 30 Hz condition but includcd in the other five conditions. Conse- quently the figures of discomfort are under- estimated in the 30 Hz condition. The paired con~parisons between " before-measurements" and " alter reading task measurements" for each of the experimental conditions give the following results :

TARLE 3
Shifts of visual functions of all 29 subjects after the 3 hou I s reading tasks
Visual function unit 30Hz 60Hz 90Hz 180Hz Ol-Iz Printed text
CFF HZ - 4.0 - 2.6 -2.8 - 1.9 - 2.1 - 2.2 Visual acuity far Snellen equivalents - 0.05 - 0.1 -0.1 -0.05 -0.05 -0.1 Visual acuity near Snellen equivalents - 0.05 - 0.05 - 0.1 -0.05 -0.05 -0.1 Con~rast sensitivity Arbitrary units - 0.4 - 0.5 -0.5 -0.5 - 0.3 - 0.1 Blink rate Blinks per min. + 2.5 +1.4 +2.0 +1.7 + 1.8 + 1.7 Near point Diopters - 0.3 0 -0.1 -0.1 0 0
(l) The CFF reveals a marked decrease in each condition: all changes are significant ( p 0.01 with Wilcoxon test).
(2) The visual acuity "far" and "near" show very small but still mostly significant decreases in each condition.
(3) The contrast sensitivity is slightly de- creased in each condition, but only significant on the p < 0.05 level for 30. 60. and 180 Hz.
(4) The blinking rate is increased in each condition, but only at 30 Hz significant with p < 0.05.
(5) The near point reveals no change in any of the six conditions.
(6) The lateral heterophorias exhibit a small but irrelevant esophoric shift in most condi- t ions.
A further analysis shows that the physio- logical reactions do not depend significantly
on the experimental condition with the excep- tion of the CFF. Only the near point (accom- modation) and the blink rate are slightly higher at the 30 Hz condition that at the printed text condition.
An analysis of variance was conducted with all values of the CFF. which is reported in Table 4. Subjects are treated as levels of a factor and consequently thei-e is one observa- tion in each cell. All sources of variation other than main effects are considered to be part of the experimental error. Consequently the computed statistics are too conservative (Winer, 1971).
The rcsults reveal a great individual vari- ance of the CFF: nevertheless the factors "time" and "experimental conditions" ex- hibit a highly significant influence. Based on this analysis of variance, the differences he-
TARLE 4
Analysis of variance of the critical flicker frequency
Main effects DF Sum of Mean F Significance squares square
Individual differences 2 8 54 339 1 941 521.3 0 001 Time h 2 886 48 1 129.2 0. (l01 Experimental
conditions 5 1 504 301 80.8 0.001 Kepetition of
measurements 2 40 20 5.4 0.004
Total main effects 4 1 58 610 1430 384.0 0.001 Residual 3 585 13 346 3.7
I'otal 3 626 71 957 19 8
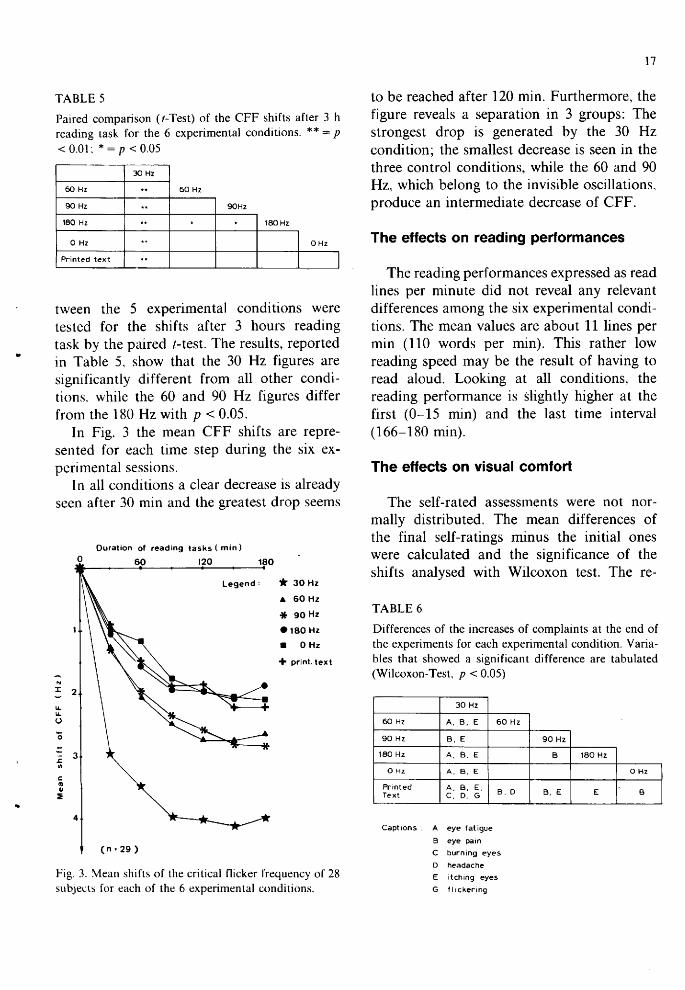
TABLE 5
Paired comparison (1-Test) of the CFF shifts after 3 h reading task for the 6 experimental conditions. **=p < 0.01 ; * = p < 0.05
tween the 5 experimental conditions were tested for the shifts after 3 hours reading task by the paired t-test. The results. reported
v
in Table 5 , show that the 30 Hz figures are significantly different from all other condi- tions. while the 60 and 90 Hz figures differ from the 1 X 0 Hz with p < 0.05.
In Fig. 3 the mean CFF shifts are repre- sented for each time step during the six ex- pcrimental sessions.
In all conditions a clear decrease is already seen after 30 min and the greatest drop seems
0 Hz
Printed text
Duration of reading tasks ( rnin )
69 120 180
Legend : * 30 Hz
A 60 Hz
* 90 Hz
100 Hz
a 0 Hz
+ print. tex t
t*
4 *
Fig. 3. Mean sh~fts of' the crit~cal fl~cker frequency of 28 s ~ b j e c t ~ for each of the 6 experimental conditions.
0 Hz
I
to be reached after 120 min. Furthermore, the figure reveals a separation in 3 groups: The strongest drop is generated by the 30 Hz condition; the smallest decrease is seen in the three control conditions. while the 60 and 90 Hz, which belong to the invisible oscillations, produce an intermediate decrease of CFF.
The effects on reading performances
The reading performances expressed as read lines per minute did not reveal any relevant differences among the six experimental condi- tions. The mean values are about 11 lines per rnin ( l 10 words per rnin). This rather low reading speed may be the result of having to read aloud. Looking at all conditions, the reading performance is slightly higher at the first (0-15 min) and the last time interval (1 66-1 80 rnin).
The effects on visual comfort
The self-rated assessments were not nor- mally distributed. The mean differences of the final self-ratings minus the initial ones were calculated and the significance of the shifts analysed with Wilcoxon test. The re-
TABLE 6
Differences of the increases of complaints at the end of the experiments for each experimental condition. Varia- bles that showed a significant difference are tabulated (Wilcoxon-Test, p < 0.05)
Captions . A eye fatigue
B eye pan
C burning eyes
D headache
E itch~ng eyes
G f l ~ c k e r ~ n g
Printed A , B . E , I Text I C. D. G B , D B , E E B

eye fatigue
eye pain
burning eyes
headache
itching eyes
tears
flickering
blurred vision: near far
double images
Mean shift of complaints ( arbitrary units)
Flg. 4. Mean shlfts of complmts at the end of the experiments of 29 subjects for each of the 6 experimrn- tal conditions.
sults are represented in Fig. 4 and Table 6. It must be pointed out that all shifts were
significant; this means that the 3 hour read- ing tasks increased the symptoms of discom- fort in each of the experimental conditions including " printed text" and " 0 Hz".
The symptoms reported in Fig. 4 were sep- arated into three groups. according to a factor analysis used in a prior field study (Liubli et al.. 1981). The factor analysis of the present study did not lead to a consistent grouping of the symptoms. For instance the symptoms "tired" ( K ) and "sleepy" (L) were mostly highly correlated with "eye fatigue" 4 but not however in every case. Nevertheless it seemed reasonable to represent the sytnptoms in the two groups shown in Fig. 4. The shifts of the symptoms " fatigued". " tired'' and "bored" were of equal size in all conditions.
From all results it can be deduced that the increases of "eye fatigue", "eye pain" and "itching eyes" are most pronounced at the 30 Hz condition and lowest in the printed text condition. In the other conditions the assess- mcnts covcrcd an intermediate range.
One observation must be pointed out: In
the 30 Hz condition two persons were dis- turbed so much that they ref~~sed to continue the reading task: they werc not taken into consideration for the calculation of the shifts in the 30 Hz condition.
The increase of eye complaints
Affirinative answers to all 13 questions about eye discomfort or fatigue showed a continuous increase throughout the experi- ment. As an example the development of feelings of eye pain is represented in Fig. 5.
The mean shift compared to the initial value is indicated for each experimental con- dition. From the results of the 13 questions. eye pains showed the best discriminating power among the 6 conditions.
Relations between eye functions and sub- jective feelings
To get some indications about relations between physiological and subjective changes during the reading task, Pearson correlation coefficient S werc computed. The shifts of sub- jective feelings as well as of visual acuity (far and near). near point and blinkrate were not normally distributed so that the correlation coefficients and the tests of significance
1001 l eqend: * )C cycles per second (Hz) G A h C H z
duration of reading t a s k ( m i n )
Fig. 5 . Mean shifts of eye pains of 29 subjects for each of the 6 experimental conditions.

TABLE 7
Pearson correlations bctwezn shlfts of eye functions and subjective feelings in the 30 Hz condition ( n = 27). Pearson correlation coefficients greater than 0.37 ( p < 0.05) are tabulated
CFF contr'ast sensitivity
eye fatigue -
eye pain 0.5 hurning eyes -
headache - itching eyes 0.5 tears 0.6
L flickering - blurred vision lar 0.5 blurred vision near 0.4 double images 0.4
should be taken as rough estimates of rela- tions.
Only the CFF and contrast sensitivity mea- surements revealed clear relationships with the subjective ratings. The correlation coeffi- cients for these two physiological functions are reported in Table 7; only the 30 Hz condition with the most pronounced shifts was taken into consideration.
I t is concluded that a greater drop of CFF might be associated with a greater increase of eye discomfort. This kind of relationship was a1 ready observed in other experiments (e.g. Weber et al.. 1973). The relationship between thc contrast sensitivity and the eye discomfort is more difficult to understand.
DISCUSSION
As mentioned above the visible flicker of a light source generates strong discomfort. One of the most striking effects is the immediate drop of the CFF which is n~ost pronounced at levels of 20 to 30 Hz (Rey and Rey, 1965). It is generally accepted, that the screens of VDTs should be free of visible flicker.
At the experimental screen (with an ap-
proximate decay time of 4 ms to drop to 10% of the peak luminance). the present experi- ments revealed CFF levels between 40 and 56 H z.
Bauer (1983) determined the CFF for a large population with a reversed presentation of a CRT and a background luminance of 80 cd/m2. The range of the measured CFF was between 55 and 87 Hz. (mean: 73 Hz). If the results of Kelly (1964) are taken into consid- eration. one can expect CFF levels above 50-80 Hz for VDT screens.
Most of the VDT models have refresh rates of 50 or 60 Hz with relatively short phosphor decay times. From t h s point of view it must be concluded that these refresh rates are in a critical range of CFF.
Some restrictions related to our experimen- tal conditions must, however. be pointed out. The lighting conditions of the simulated CRT screen are not identical with a real VDT. AT a CRT, the electron beam wanders down line by line. while in our experiment, the total screen illumination is turned on and off simul tancously.
We have kept the mean luminance con- stant and this means that the decreasing re- fresh rate is combined with an increased peak luminance (See Fig. 1). It is therefore theoret- ically not clear whether we evaluated the re- fresh rate or the peak luminance. The studies of Kelly (1964) give an answer to this ques- tion: Thc CFF depends on the amplitude of the groundwave divided by the mean lumi- nance. In our experiments this quotient mea- sured over a surface of 5 X 7 cm varied from 0.36 to 0.46 only. We therefore assume that for the eyes the refresh rate is the determining factor and not the very short peak luminance.
In every condition the reading task. lasting 3 hours, had physiological effects on visual functions and caused visual discomfort, Be- sides this, a certain distinction among the six conditions was observed with the parameters "visual discomfort" and 'CFF". The visual discomfort was strong with visible flicker (30

Hz) and low with the printed text. The re- maining conditions of invisible flicker (in- cluding the 0 Hz) did not reveal dilferentiat- ing effects on discomfort. However. the CFF revealed more conclusive effects: Thc: visible flicker caused a very strong drop of the thresholds. The three control conditions (180 Hz; 0 Hz and printed text) produced a smaller drop of the thresholds. while 60 and 90 Hz had an intermediate effect. Therefore the cl~~estion arises as to whether flicker frequen- cies slightly above the perceived flicker threshold might have some physiological ef- fects, but at the present time this considera- tion is not much more than a hypothesis.
ACKNOWLEDGEMENT
The research reported in this paper has been supportcd by the Swiss National Science Foundation, Grant No. 3.81 0.81.
REFERENCES
Gierer, R., Martin, E., Baschera, P. and Grandjcan, E., 1981. Ein Gerat zur Bestinmung der Flirnrner- verschmelzungsfrequenz des Auges. Z. Arbeitswis- senschaft, 35: 45-47.
Kelly. D.H.. 1964. Line waves and fhcker fusion. Documents Ophthalmologica, 18: 16-35.
Liiubli: Th. and Grandjean. E.? 1984. The magic of control groups in VDT field studies. In: Grandjean, E. (Ed.). Ergononlics and Health in Modern Offices. Taylor and Francis. London.
L'aubli, Th., Hiinting, W . and Grandjean, E.. 1981. Postural and visual loads at VDT workplaces, 11. Lighting conditions and visual impairments. Ergo- nonlics, 24: 933-944.
Nishiyama, K.. Brauninger. U.. de Boer, H., Gierer, R. ; and Grandjean, E., 1986. Physiological effects of oscillating lunlinances in the reversed display of VDTs. To be published in Ergonomics. ..
Rey, P. and Rey. J.P.. 1965. Effect of an intermittent light stinlulation on the critical fusion frequencv. Ergonomics, 8: 173-1 80.
Weber, A., Jerrnini. C. and Grandjean, E., 1973. Be- ziehung zwischen objektiven und subjektiven Mes- smethoden bei experin~entell erz,eugter '."Ermiidung". 2. Priiventivmedizin, 18: 279-283.
Winer, B.J., 1971. Statistical Principals in Experimental Design. McGraw-Hill Inc., New York.
Zacharia, A. and Bittertnan. M.E.. 1953. The effect of fluorescent flicker on visual efficiency. Applied Psy- chology. 36: 413-416.
Bauer. D., Bonacker, M. and Cavonius C.R.. 1983. Fratne repetition rate for Flicker-free viewing of bright VDT screens. Displays, January: 3 1 -33.