egyptian german high level joint committee for renewable...
TRANSCRIPT

Egyptian German High Level Joint Committee for
Renewable Energy, Energy Efficiency and Environmental
Protection
Electric Utility and Consumer Protection Regulatory
Agency
Boosting Capacity of Electric Generation through the use of
Turbo-Expanders in Natural Gas Network
Prepared by
In collaboration with
Dr. Mohamed Salah Elsobki (jr.)
Professor Electric Power Engineering
Director Energy Research Center
Faculty of Engineering – Cairo University
November 2013

Egyptian German High Level Joint Committee for Renewable
Energy, Energy Efficiency and Environmental Protection
Electric Utility and Consumer Protection Regulatory Agency
Boosting Capacity of Electric Generation through the use of
Turbo-Expanders in Natural Gas Network
Prepared by
6 Dokki St. 12th Floor, Giza 12311 Tel.: (+2010) 164 81 84 – (+202) 376 015 95 – 374 956 86 / 96
Fax: (+202) 333 605 99
Email: [email protected]
Website: www.environics.org
In collaboration with
Dr. Mohamed Salah Elsobki (jr.)
Professor Electric Power Engineering
Director Energy Research Center
Faculty of Engineering – Cairo University
November 2013

Boosting Capacity of Electric Generation through the use of Turbo-Expanders in Natural Gas Network iii
Environics in collaboration with Mohamed Salah Elsobki (jr) November 2013
Executive Summary
The Egyptian energy sector is becoming more reliant on natural gas as a prime source of
energy. The use of natural gas has increased by 6.5% in the year 2010/2011 compared with the
year before. It reached 29,210 million cubic meters the last year in the electricity sector1. A
range of 55%2 to 60%
3 of the domestic natural gas production is utilized by electricity sector.
More than 80% of electric generation power plants have been converted to use natural gas.
This tendency toward using natural gas is attributed to its availability, its higher combustion
efficiency and positive environmental impact as compared to other fossil fuels. As a result of
the increasing demand for natural gas, the Egyptian Government seeks more efficient options
for power generation in addition to renewable energy sources.
Nowadays, the energy crisis has pushed for the need to recover the energy which is normally
wasted in industrial processes. Gas pressure reducing process in power stations is one of these
processes in which the energy is wasted due to the presence of pressure reduction valves.
Natural gas is transported in pipelines at high pressures. To distribute the gas locally to
locations along the pipeline, the pressure must be reduced before the gas enters the local
distribution system. Most pressure reduction stations use throttling valves for this purpose
which is an energy wasting process.
In order to reduce the wasted energy, the pressure drop can be achieved by passing the gas
through a turbo-expander which generates electrical power. Based on the inlet and outlet
properties of natural gas flow and its flow rate, the amount of electricity which can be
produced from natural gas pressure reduction could be calculated when using a turbo-expander.
The study shows the increase of generation capacities and energy production through the use of
turbo-expanders in natural gas networks and assesses the potential of extracting electric
generation capacities from wasted energy in the natural gas pressure reduction stations of
electricity power plants. An estimated overall additional capacity at about 91MW, with
individual capacity ranging between 70 kW and 5.78 MW, could be generated through the use
of turbo-expanders in the existing natural gas networks. In addition, different issues are
addressed such as sizing of the turbo-expander as well as temperature constraints related to the
natural gas.
Turbo-expander generates an additional 800 GWh without affecting the natural gas
consumption by power plants. The total natural gas avoided per year is estimated to reach 130
ktoe compared to 21,663 ktoe consumed by the existing power plants. This will lead to 45 tons
savings of CO2 emissions which represents about 0.6% of the total CO2 emissions from the
existing power plants. Although turbo-expander installations involve high capital cost, they
also give high annual natural gas savings. This explains the short payback period which in case
of using unsubsidized natural gas prices ranges between 2 and 5 years.
1 Ministry of Electricity and Energy, “Annual Report 2011/2012”
2 “The Development of the Natural Gas Industry in Egypt and the World Presentation”, presented at the World
Energy Council Meeting (WEC), Cairo, Egypt, June 28th
, 2012 3 New and Renewable Energy Authority (NREA), “Annual Report 2010/2011”

Boosting Capacity of Electric Generation through the use of Turbo-Expanders in Natural Gas Network iv
Environics in collaboration with Mohamed Salah Elsobki (jr) November 2013
Table of Contents Executive Summary .................................................................................................................... iii
Table of Contents ........................................................................................................................ iv
List of Figure............................................................................................................................... vi
List of Tables ............................................................................................................................. vii
List of Abbreviations ................................................................................................................ viii
1 Natural Gas Networks Scene in Egypt .................................................................................... 1
1.1 Introduction ................................................................................................................... 1
1.2 Development of Natural Gas Usage .............................................................................. 1
1.3 Development of Natural Gas Local Consumption ........................................................ 2
1.3.1 Natural Gas Local Consumption by Sector ........................................................... 2
1.4 Future Natural Gas Demand .......................................................................................... 5
1.4.1 Prospects of Natural Gas Demand to 2030 according to OME Estimates ............. 5
1.4.2 Prospects of Natural Gas Demand till 2030 according to Nexant’s Estimates ...... 6
1.5 Egyptian Natural Gas Supply Chain ............................................................................. 8
1.6 Natural Gas Network Development ............................................................................ 10
1.7 Pressure Levels in Natural Gas Network .................................................................... 13
1.8 Natural Gas Transportation and Distribution Grid ...................................................... 13
1.8.1 Pressure Reduction Stations (PRS) Operation ..................................................... 14
2 Turbo-Expander Mechanism ................................................................................................. 16
2.1 Power Generation through Natural Gas Pressure Reduction ...................................... 17
2.2 Temperature Constraints ............................................................................................. 18
3 Potential of Energy Recovery from the Gas Network in Egypt ............................................ 19
3.1 Identification of Possible Stations for the Installation of Turbo-Expanders ............... 20
4 Possible Electric Capacity Output from the Identified Possible Turbo-Expander Installations
25
4.1 Evaluating the Potential of Electricity Generation from Natural Gas Pressure
Reduction Stations................................................................................................................. 27
4.2 Technical Assessment of Generation Potential from PRS .......................................... 28
4.2.1 The Possible Electric Capacity Output ................................................................ 28
4.2.2 Environmental Impact and Natural Gas Avoided ................................................ 30

Boosting Capacity of Electric Generation through the use of Turbo-Expanders in Natural Gas Network v
Environics in collaboration with Mohamed Salah Elsobki (jr) November 2013
5 Economic Assessment for the Application ........................................................................... 34
5.1 Factors Affecting the Project Economics ................................................................... 34
5.1.1 Capital Costs ........................................................................................................ 34
5.1.2 Operating Costs .................................................................................................... 34
5.1.3 Revenue from Power Sales .................................................................................. 34
5.1.4 Pressure Ratio ...................................................................................................... 34
5.1.5 Flow Rate ............................................................................................................. 35
5.2 System Cost Calculation ............................................................................................. 35
5.3 Potential Profit Margin ................................................................................................ 41
6 Assessment of Operating the Proposed Units in Parallel with the Existing Electricity
Systems ...................................................................................................................................... 45
7 The Current Institutional Setup and Relevant National Legislations .................................... 48
7.1 Description of the Electricity Market Structure .......................................................... 48
8 Expected Roles for the Different Stakeholders including Owners of the NG Networks and
Pressure Reduction Stations ....................................................................................................... 50
Annex A. Important Definition and Basic Concept of some Thermodynamics Properties ......... 1
Annex B. Evaluating the Potential of Electricity Generation from Industrial and Residential
Sector ........................................................................................................................................... 1
Annex C. Request Letters sent to EGAS and GASCO ................................................................ 1
Annex D. Units Conversion Tables ............................................................................................. 1
Annex E. Natural Gas Measurements and Conversions .............................................................. 1
Annex F. Characteristics of some Gas Pressure Regulating and Metering Station in Egypt and
other Countries ............................................................................................................................. 3

Boosting Capacity of Electric Generation through the use of Turbo-Expanders in Natural Gas Network vi
Environics in collaboration with Mohamed Salah Elsobki (jr) November 2013
List of Figure Figure 1-1 Natural Gas Total Demand Development (1990/1991-2010/2011) ......................................... 2
Figure 1-2 Natural Gas Consumption by Sector (2010-2011) ................................................................... 4
Figure 1-3 Natural Gas Consumption by Industrial Subsectors (2010-2011) ............................................ 4
Figure 1-4 Natural Gas Demand Development by Sector during the Period (2009/2010-2030) ............... 6
Figure 1-5 Natural Gas Demand Development in Egypt till 2029/2030.................................................... 7
Figure 1-6 Simplified Schematic Diagram for the Natural Gas Chain ...................................................... 9
Figure 1-7 Natural Gas Network in Egypt .............................................................................................. 11
Figure 1-8 Schematic Diagram for Pressure Levels in the Gas Network of Egypt ................................ 13
Figure 1-9 Schematic Diagram for Natural Gas City Distribution Network .......................................... 14
Figure 2-1 Different Pressure Reduction Processes ................................................................................. 16
Figure 2-2 Schematic Diagram of a Turbo-Expander Driving a Compressor ......................................... 17
Figure 2-3 Power Generation through Natural Gas Pressure Reduction ................................................ 18
Figure 2-4 Schematic Diagram for a Turbo-expander Installed Parallel to the Existing ........................ 19
Figure 3-1 The Recommended Pressure Reduction Levels for Turbo-Expander Installation ................. 20
Figure 4-1 Variation of Turbo-expander Efficiency with Gas Flow Rate ............................................... 26
Figure 4-2 Potential Power Generation versus Flow and Pressure Ratio ................................................ 28
Figure 6-1 A Generator Being Paralleled with A Running Power System .............................................. 46
Figure 6-2 Parallel Operation - Synchronizing Generators ..................................................................... 46
Figure 6-3 Parallel Connection Control System ..................................................................................... 47
Figure 7-1 Current Electricity Market in Egypt ....................................................................................... 48
Figure 7-2 Phase Two towards Market Structure ........................................ Error! Bookmark not defined.
Figure 7-3 Phase Three towards Market Structure ...................................... Error! Bookmark not defined.

Boosting Capacity of Electric Generation through the use of Turbo-Expanders in Natural Gas Network vii
Environics in collaboration with Mohamed Salah Elsobki (jr) November 2013
List of Tables Table 1-1 Development of Electricity Demand ........................................................................................ 1
Table 1-2 Natural Gas Consumption by Sector (2010/2011) ..................................................................... 4
Table 1-3 Natural Gas Demand in Egypt in 2029/2030 ............................................................................. 7
Table 1-4 Natural Gas Demand Development in Egypt (2008/2009-2029/2030) ..................................... 8
Table 1-5 Recent Domestic Natural Gas Pipelines Characteristics ........................................................ 12
Table 1-6 Recently Added Natural Gas Pipelines ................................................................................... 12
Table 3-1 Fuel Type and Estimated NG Consumption of Generation Power Plants .............................. 21
Table 4-1 Examples of Power from Gas Pressure Reduction .................................................................. 27
Table 4-2 Expected Electricity Generation at Power Plants by Turbo-Expander .................................... 29
Table 4-3 The Annual Natural Gas Avoided Cost ................................................................................... 31
Table 5-1 Total Capital Costs and Payback Period for Turbo-Expander Installations ............................ 36
Table 5-2 Turbo-Expander Annualized Total Cost .................................................................................. 38
Table 5-3 The Average Cost of Energy at Electricity Production Companies ........................................ 41
Table 5-4 Capital Cost of Turbo-Expander versus the Annual Profit ...................................................... 43
Table 7-1 Recent Effectively Prevailing Legislations in Egypt ................... Error! Bookmark not defined.
Table 7-2 Electricity Market Limitations .................................................... Error! Bookmark not defined.

Boosting Capacity of Electric Generation through the use of Turbo-Expanders in Natural Gas Network viii
Environics in collaboration with Mohamed Salah Elsobki (jr) November 2013
List of Abbreviations
BBOE billion barrels of oil equivalent
BCF/Y billion cubic meters per year
bcm billion cubic meters
BOOT Build Own Operate and Transfer
CNG Compressed Natural Gas
EEA Egyptian Electricity Authority
EEHC Egyptian Electricity Holding Company
EETC Egyptian Electric Transmission
EEUCPRA Egyptian Electric Utility and Consumer Protection Regulatory Agency
EGAS Egyptian Natural Gas Holding Company
EGP Egyptian pound
EGPC Egyptian General Petroleum Corporation
EHV Extra High Voltage
GASCO Egyptian Natural Gas Company
GoE Government of Egypt
hp Horsepower
HV High Voltage
IBE Investment Bank of Egypt
IPP Independent Power Producers
ISP Independent Service Providers
ktoe kilo ton oil equivalent
kWh kilo Watt hours
LCOE Levelized Cost of Energy
LNG Liquefied Natural Gas
LPG Liquefied Petroleum Gas
Mio Million
MMSCF/D million standard cubic feet per day
MoEE Ministry of Electricity and Energy
MoP Ministry of Petroleum
MW Mega Watt
NG Natural Gas
NGG Natural Gas Grid
NGL Natural Gas Liquid
NREA New and Renewable Energy Authority
OME Observatoire Mediterraneen de l'Energie
PPA Power Purchase Agreements

Boosting Capacity of Electric Generation through the use of Turbo-Expanders in Natural Gas Network ix
Environics in collaboration with Mohamed Salah Elsobki (jr) November 2013
PR Pressure Reduction Ratio
PRS Pressure Reduction Stations
PRVs Pressure Reducing Valves
T.Exp. Turbo-Expander
TCF trillion cubic feet
toe ton oil equivalent
WEC World Energy Council

Boosting Capacity of Electric Generation through the use of Turbo-Expanders in Natural Gas Network 1
Environics in collaboration with Mohamed Salah Elsobki (jr) November 2013
1 Natural Gas Networks Scene in Egypt
1.1 Introduction
The energy system in Egypt relies mainly on depleted oil and natural gas resources to satisfy
energy needs for social and economic development. In 2010/2011, total primary energy
production reached 89.756 million ton oil equivalent (Mtoe) of which natural gas represented
about 59.1% compared to 37.5% for oil, 3% for hydropower and only 0.4% for other
renewable sources4.
The last few decades have witnessed a tremendous increase in energy demand with an average
annual growth rate of about 4% for petroleum products, more than 10.4% for natural gas and
about 7% for electricity, a situation which lead to a remarkable increase in petroleum energy
subsidy that reached about 114 billion EGP during the year 2011/20125. Unless immediate and
effective measures are taken to curb the energy demand, the energy situation in Egypt will
worsen, adversely affecting social and economic development plans. Table 1-1 shows the
development of electricity over the last five years up to the year 2012.
Table 1-1 Development of Electricity Demand 6
2007/2008 2008/2009 2009/2010 2010/2011 2011/2012
Peak Load (MW) 19,738 21,330 22,750 23,470 25,705
Fuel Consumption
(ktoe) 23,562 24,895 26,772 27,430 29,728
Fuel Consumption Rate
(gm o.e/kWh gen) 218.9 217.6 215.6 208.1 209
Natural gas to Total
Fuel Ratio (%) 79.3 78 77.7 80.4 84.3
1.2 Development of Natural Gas Usage
The total demand for natural gas increased from 8.5 billion cubic meters (bcm) in 1990/1991 to
61.7 bcm in 2010/2011 with an average annual growth rate of about 10.4% during that period,
as shown in Figure 1-1. Local consumption of natural gas reached 46.9 bcm in 2010/2011 with
an average annual growth rate of about 8.7% during that period.
Total exports to the international gas market accounted for about 14.8 bcm with a share of
about 24% of the total natural gas demand during 2010/2011 compared to a consumption of
46.9 bcm for the local market with a share of 76%.7
4 “Energy in Egypt Presentation 2010/2011”, presented at the World Energy Council (WEC) Meeting, Cairo,
Egypt, June 28th
, 2012. 5 “The Development of the Natural Gas Industry in Egypt and the World Presentation”, presented at the WEC
Meeting, Cairo, Egypt, June 28th
, 2012 6 EEHC, “Annual Reports”
7 Source:
“The Development of the Natural Gas Industry in Egypt and the World Presentation”, presented at the WEC
Meeting, Cairo, Egypt, June 28th
, 2012
EGAS

Boosting Capacity of Electric Generation through the use of Turbo-Expanders in Natural Gas Network 2
Environics in collaboration with Mohamed Salah Elsobki (jr) November 2013
Figure 1-1 Natural Gas Total Demand Development (1990/1991-2010/2011)8
1.3 Development of Natural Gas Local Consumption
As shown in Figure 1-1, local consumption of natural gas increased from 8.5 bcm in
1990/1991 to reach 46.9 bcm in 2010/2011 with an average annual growth rate of about 8.7%
during that period.
1.3.1 Natural Gas Local Consumption by Sector
As shown in
8 Source:
• “The Development of the Natural Gas Industry in Egypt and the World Presentation”, presented at the WEC
Meeting, Cairo, Egypt, June 28th, 2012
• EGAS
Boosting Capacity of Electric Generation through the use of Turbo-Expanders in Natural Gas Network 3
Environics in collaboration with Mohamed Salah Elsobki (jr) November 2013
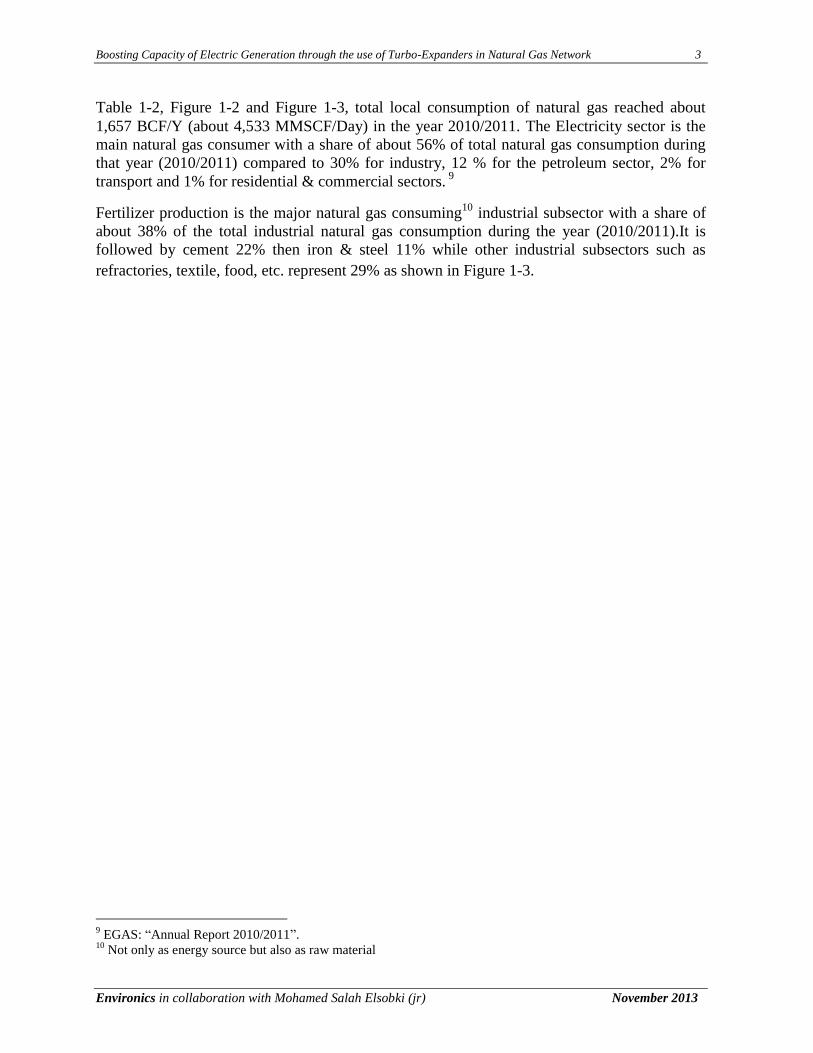
Table 1-2, Figure 1-2 and Figure 1-3, total local consumption of natural gas reached about
1,657 BCF/Y (about 4,533 MMSCF/Day) in the year 2010/2011. The Electricity sector is the
main natural gas consumer with a share of about 56% of total natural gas consumption during
that year (2010/2011) compared to 30% for industry, 12 % for the petroleum sector, 2% for
transport and 1% for residential & commercial sectors. 9
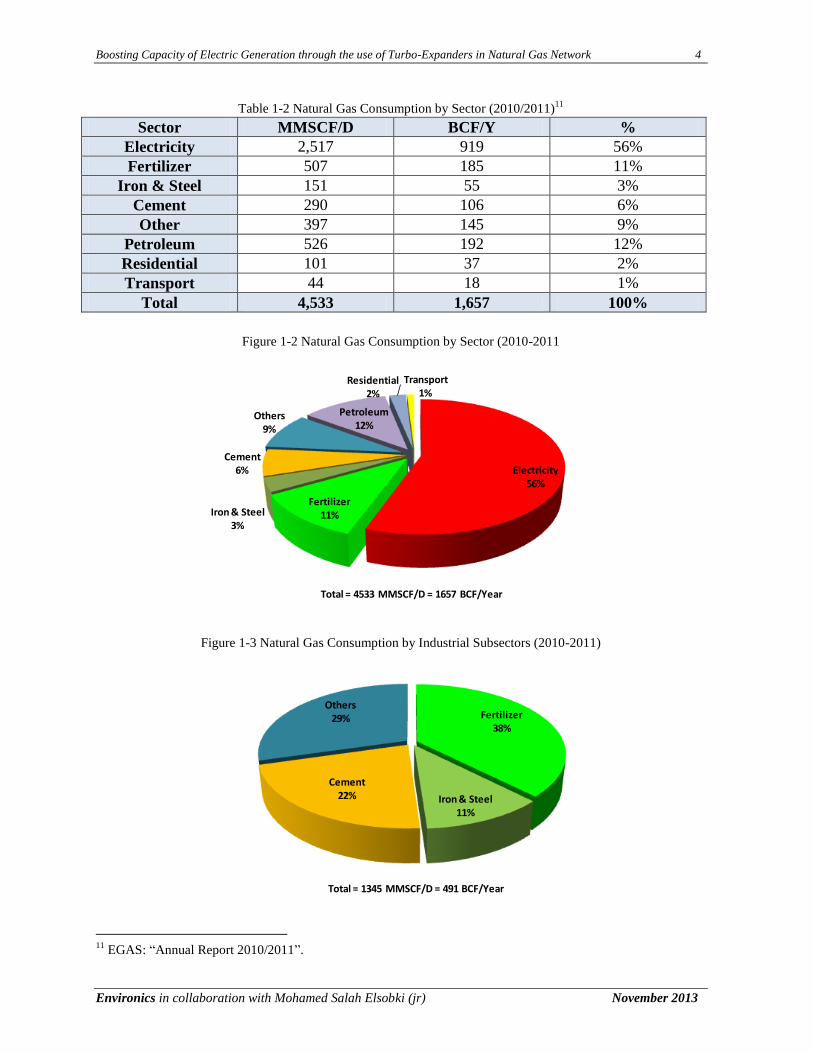
Fertilizer production is the major natural gas consuming10
industrial subsector with a share of
about 38% of the total industrial natural gas consumption during the year (2010/2011).It is
followed by cement 22% then iron & steel 11% while other industrial subsectors such as
refractories, textile, food, etc. represent 29% as shown in Figure 1-3.
9 EGAS: “Annual Report 2010/2011”.
10 Not only as energy source but also as raw material
Boosting Capacity of Electric Generation through the use of Turbo-Expanders in Natural Gas Network 4
Environics in collaboration with Mohamed Salah Elsobki (jr) November 2013
Table 1-2 Natural Gas Consumption by Sector (2010/2011)11
Sector MMSCF/D BCF/Y %
Electricity 2,517 919 56%
Fertilizer 507 185 11%
Iron & Steel 151 55 3%
Cement 290 106 6%
Other 397 145 9%
Petroleum 526 192 12%
Residential 101 37 2%
Transport 44 18 1%
Total 4,533 1,657 100%
Figure 1-2 Natural Gas Consumption by Sector (2010-2011
Figure 1-3 Natural Gas Consumption by Industrial Subsectors (2010-2011)
11
EGAS: “Annual Report 2010/2011”.
Electricity56%
Fertilizer11%Iron & Steel
3%
Cement6%
Others9%
Petroleum12%
Residential2%
Transport1%
Total = 4533 MMSCF/D = 1657 BCF/Year
Fertilizer38%
Iron & Steel11%
Cement22%
Others29%
Total = 1345 MMSCF/D = 491 BCF/Year

Boosting Capacity of Electric Generation through the use of Turbo-Expanders in Natural Gas Network 5
Environics in collaboration with Mohamed Salah Elsobki (jr) November 2013
1.4 Future Natural Gas Demand
Several studies for estimating natural gas demand in the coming years have been made by
EGAS in cooperation with some international firms such as Observatoire Mediterraneen de
l’Energie (OME) and Nexant; the following section presents the most important outputs of
each.
1.4.1 Prospects of Natural Gas Demand to 2030 according to OME Estimates
During the period (2009-2010), the OME in cooperation with the Egyptian Energy Holding
Company EGAS prepared the Mediterranean Energy Perspectives for the year 2010 with the
main focus on the Egyptian energy sector. One of the main issues that have been assessed by
that publication is the possible future evolution of natural gas consumption during the period
(2008-2030). In building up the demand forecast for the different energy commodities in
Egypt, including natural gas during the period (2008-2030), four scenarios have been
considered; these are:
1. The Conservative or business as usual Scenario: considers past trends, policies in force in
addition to ongoing projects. However, it takes a more cautious approach regarding the
implementation of policy measures and planned projects. At the same time this scenario
considers no implementation of large scale demand efficiency programs and no major
efforts for energy conservation.
2. The Proactive Scenario which considered a progressive energy efficiency program and a
more diversified energy supply mix which include the nuclear option in addition to higher
share of renewable energy.
3. Two High Economic Growth Scenarios based on the economic growth projections of the
Egyptian Ministry of Economic Development. While the High Economic Growth Scenario
(HEG) presents the impact of a more sustained economic growth; the High Economic
Growth Diversification Scenario (HEG Div) presents a future with a significantly
diversified electricity generation mix (Coal 12.5% , oil and gas 52.5% of which 20% of
oil and 80% of gas, nuclear 12.5%, and renewable 22.5%).
According to the results obtained by the utilization of a tailored model for Egypt which
developed by OME, and as shown from Figure 1-4:
Natural gas demand is expected to increase from about 44 Billion Cubic Meters (BCM) in
2009/2010 to about 90 to 120 BCM in 2030 according to the different scenarios.
The electricity and industrial sector are expected to have a share of more than 80% of total
natural gas demand in all scenarios during the forecast period (2009/2010-2030).

Boosting Capacity of Electric Generation through the use of Turbo-Expanders in Natural Gas Network 6
Environics in collaboration with Mohamed Salah Elsobki (jr) November 2013
Figure 1-4 Natural Gas Demand Development by Sector during the Period (2009/2010-2030)12
1.4.2 Prospects of Natural Gas Demand till 2030 according to Nexant’s Estimates
Natural gas demand in Egypt is estimated through a study entitled “Egypt Energy Strategy till
2030” prepared in 2009-2010 by Nexant Corporation in cooperation with EGAS and other
concerned entities in Egypt.
According to that study and as shown in Figure 1-5, Table 1-3 and Error! Reference source
not found. 13
:
Total domestic and export demand for natural gas is expected to grow by an average
3.6-3.5% till 2030 to reach about 13.9-14.7 MMSCF/D in 2030 according to EGAS and
Nexant estimates, respectively.
The highest natural gas demand growth rates are expected to occur in the industrial
sector, in particular the petrochemical industry.
Both EGAS and Nexant forecasts estimate that the power sector will be the largest gas
consuming sector, contributing to 53% of the total gas demand by 2030. It is expected
to be followed by exports and the industrial sector, which will make up to 15% and
25%, respectively in 2030.
12
Source: Mediterranean Energy Perspectives- Egypt, OME, 2010. 13
Egypt Energy Strategy to 2030, “Final Report, Section 5”, Nexant, February 2009

Boosting Capacity of Electric Generation through the use of Turbo-Expanders in Natural Gas Network 7
Environics in collaboration with Mohamed Salah Elsobki (jr) November 2013
Figure 1-5 Natural Gas Demand Development in Egypt till 2029/2030
Table 1-3 Natural Gas Demand in Egypt in 2029/2030
EGAS Forecast Nexant Forecast
Average Annual
Growth, percent
Gas Demand
(MMSCFD)
Average Annual
Growth, percent
Gas Demand
(MMSCFD)
2009 to
2019
2009 to
2030 2029/30
2009 to
2019
2009 to
2030 2029/30
Power 4.7 3.8 4,923 5.3 5.2 7,795
Fertilizers 5.6 4.2 1,172 4.2 2.7 1,033
Petrochemicals 42.2 18.9 493 45.8 20.8 584
Steel 14.2 7.1 675 11.9 6.7 657
Cement 8.4 5.5 1,320 3.8 2.7 588
Other Industries 16.1 10.2 2,863 6.0 4.9 679
Petroleum &
Gas Derivatives 7.4 6.1 728 10.4 4.0 680
Residential &
Commercial 9.5 7.7 433 10.6 6.0 284
CNG 10.1 10.0 285 10.1 7.6 174
Exports -2.4 4.1 1,005 -2.0 0.6 2,205
Total Demand 6.1 3.6 13,896 4.8 3.5 14,679

Boosting Capacity of Electric Generation through the use of Turbo-Expanders in Natural Gas Network 8
Environics in collaboration with Mohamed Salah Elsobki (jr) November 2013
Table 1-4 Natural Gas Demand Development in Egypt (2008/2009-2029/2030)
Demand
Side
Transport
R&C, LI
Industries
Power Exports Other
Industries
EI
Industries
Total
Demand
2008/9 368 2,704 2,440 1,054 506 7,072
2009/10 417 2,906 2,640 1,141 552 7,656
2010/11 474 2,938 2,660 1,252 630 7,953
2011/12 516 3,163 2,830 1,366 738 8,612
2012/13 562 3,351 3,025 1,600 817 9,356
2013/14 611 3,595 3,080 1,858 863 10,007
2014/15 660 3,783 3,080 1,909 890 10,321
2015/16 685 3,984 3,080 1,970 917 10,637
2016/17 712 4,036 3,055 2,014 946 10,763
2017/18 739 4,268 3,055 2,057 975 11,094
2018/19 767 4,535 3,055 2,103 1,005 11,465
2019/20 796 4,789 3,055 2,143 1,024 11,807
2020/21 825 5,046 3,055 2,191 1,043 12,160
2021/22 856 5,149 3,055 2,235 1,063 12,359
2022/23 888 5,480 2,910 2,283 1,083 12,643
2023/24 920 5,630 2,645 2,301 1,104 12,600
2024/25 954 5,987 2,645 2,334 1,125 13,044
2025/26 988 6,166 2,645 2,321 1,146 13,266
2026/27 1,024 6,592 2,415 2,311 1,168 13,510
2027/28 1,061 6,842 2,415 2,304 1,191 13,813
2028/29 1,099 7,309 2,205 2,297 1,217 14,125
2029/30 1,138 7,795 2,205 2,297 1,245 14,679
Where,
LI Industry: Low Energy Intensity Industry,
EI Industries: Energy Intensive Industries e.g. cement, Iron& steel, Fertilizers, etc.
It is worth mentioning that due to the decision made by the Ministry of Petroleum (MoP) in
2011 to stop gas exports through the eastern gas pipeline and through the Arab gas pipeline due
to continued attacks to it, the previous mentioned estimates (Exports) are expected to be
decreased.
1.5 Egyptian Natural Gas Supply Chain
Normally, natural gas is produced from gas wells at high pressure that could be at an average
level of about 60-70 bars. Such is the case of most natural gas wells in Egypt. Starting from
the gas producing wells till the gas consuming centers passing through transmission and
distribution systems and networks; natural gas is subject to several treatment processes to

Boosting Capacity of Electric Generation through the use of Turbo-Expanders in Natural Gas Network 9
Environics in collaboration with Mohamed Salah Elsobki (jr) November 2013
extract valuable derivatives such as condensates for refineries, ethane and propane for
petrochemical industries and LPG for residential & commercial sectors.
In addition, undesirable components that could be harmful to the environment, consumer’s
health and equipment such as mercury and carbon dioxide (CO2) are also removed through
treatment and processing facilities. This leaves gas that is mainly composed of methane (CH4)
to be pumped through the network pipelines to the domestic consumers. Figure 1-6 shows a
simplified schematic diagram for the natural gas chain.
Figure 1-6 Simplified Schematic Diagram for the Natural Gas Chain14
Where,
C2/C3: Mixture of ethane and propane,
GTL: Gas to Liquids,
LNG: Liquefied Natural Gas,
LPG: Liquefied Petroleum Gas and,
NGL: Natural Gas Liquefaction
14
Source: EGAS [Online], Available at: http://www.egas.com.eg/Egyptian_Natural_Gas/Introduction.aspx

Boosting Capacity of Electric Generation through the use of Turbo-Expanders in Natural Gas Network 10
Environics in collaboration with Mohamed Salah Elsobki (jr) November 2013
Meanwhile, as natural gas is utilized by different consumers at low pressures 7, 4 and 2 bars.
The high pressure of natural gas produced at the well-head (normally at 60-70 bars as
mentioned above) is reduced through throttling or Pressure Reducing Valves (PRVs) that result
in large amounts of energy loss. This valuable potential energy can be either a source for
power generation, or an energy saving measure for process industries consuming large
volumes of natural gas.
1.6 Natural Gas Network Development
In order to keep up with the growth of natural gas demand by different economic sectors and to
implement the petroleum sector’s policy of replacing liquid petroleum products by natural gas,
for the MoP developed the natural gas infrastructure including the National Gas Grid (NGG) to
serve as a link from the upstream fields and gas processing facilities to end-users.
Accordingly, NGG has expanded from only about 40 km in 1975 to reach a length of around
18 thousand km15
with a capacity of 180 MMSCM/Day by June 2011 covering most of the
inhabited area in the country. By June 2011, the gas grid supplied natural gas to about 4.37
million clients in the residential and commercial sectors, 1800 clients in the industrial sector in
addition to about 185 thousand vehicles.16
The development of NGG started in 1975 with a 40 km, 12-inch pipeline with capacity of
0.085 MMSCM/Day from the Abu Madi gas field to Talkha area in the middle of the Delta
region to feed a power generation plant, a fertilizer factory and a textile factory.17
Later, an
offshore collection network was installed and started operation in the Gulf of Suez to recover
associated gas from the oil fields. Today, natural gas is transmitted and distributed through the
NGG, which extends from Matrouh in the northwest and the Western Desert to Sinai in the
east with high densities in the Nile Delta and Suez areas. Figure 1-7 shows the natural gas
network in Egypt and its development during the period (1980-2010) and Table 1-5 shows
several projects that were recently added to expand the NGG and to supply natural gas for the
first time to other cities and governorates.
15
“The Development of the Natural Gas Industry in Egypt and the World Presentation”, presented at the WEC
Meeting, Cairo, Egypt, June 28th
, 2012 16
EGAS: “Annual Report 2009/2010”. 17
General information presented in several papers & reports.

Boosting Capacity of Electric Generation through the use of Turbo-Expanders in Natural Gas Network 11
Environics in collaboration with Mohamed Salah Elsobki (jr) November 2013
Figure 1-7 Natural Gas Network in Egypt 18
18
“The Development of the Natural Gas Industry in Egypt and the World Presentation”, presented at the WEC
Meeting, Cairo, Egypt, June 28th
, 2012

Boosting Capacity of Electric Generation through the use of Turbo-Expanders in Natural Gas Network 12
Environics in collaboration with Mohamed Salah Elsobki (jr) November 2013
Table 1-5 Recent Domestic Natural Gas Pipelines Characteristics 19
Length
(km)
Diameter
(inches)
Capacity
(MCM/Day)
Operation
Date
Taba - Sharm El Sheikh Pipeline 208 20 6 2007
Shukir - Hurghada Gas Pipeline 127 24 4 2007
Upper Egypt Gas Pipelibe: 930 30-36 -- 2009
Phase 1: Dahshour - El Kurimat 90 36 20 2007
Phase 2: El Kurimat - Beni Suef 28 30 10 2007
Phase 3: Beni Suef to Abu-Qorqas 150 32 5 2008
Phase 4: El Minia (Abu-Qorqas) to
Assiut 150 32 3 2009
Phase 5: Assiut - Gerga 122 32 1 2009
Phase 6: Gerga - Qena - Aswan 390 30 1 2009
El Tina - Abu Sultan Pipeline 62 32 18 2007
Abu Hommos - El Nubaria Gas Pipeline 65 42 50 2009
Port Fouad - El Tina Gas Pipeline 42 42 40 2009
Trans - Sinai Gas Pipeline / Phase 1 55 36 -- 2010
Abu Sultan - El Sokhna Gas Pipeline 105 32 13 2010
Trans - Sinai Gas Pipeline / Phase 2 77 36 -- 2010
Sinai - Military Pipeline 16 16 -- 2010
Suez Canal Crossing 5 30 -- 2010
Inter Sinai Loop from Al Tina to Drish 155 36 -- 2010
In addition to the natural gas pipelines mentioned above that already exist and are in operation,
three other pipelines are recently added as shown in Table 1-6.
Table 1-6 Recently Added Natural Gas Pipelines 20
Name Length
(km)
Diameter
(inch)
Capacity
(MMCM/Day)
Belbis-10th
of Ramadan 36 24 3.4
Abu Madi - Gemsa 14 24 3.4
Abu Sultan – El Shabab 35 24
The distribution of natural gas in Egypt is regulated by the MoP, mostly through the state
owned company EGAS which supervises 15 distribution companies working now in this
activity; 5 are state-owned and 10 are from the private sector. Each company is responsible for
the design, construction and operation of the distribution network in some specified concession
areas, starting from the off-take at the national gas grid, operated by GASCO, until the end
users. Distribution companies quote a tariff level on gas sales in return to pipeline operation
19
Source: GASCO, length and the diameter of the pipelines are available online at:
http://www.egas.com.eg/Egyptian_Natural_Gas/Establishing_gas.aspx 20
Source: EGAS, “Annual Report 2010/2011”

Boosting Capacity of Electric Generation through the use of Turbo-Expanders in Natural Gas Network 13
Environics in collaboration with Mohamed Salah Elsobki (jr) November 2013
and maintenance. However, some large industrial consumers and power plants take natural gas
directly from the transmission grid of GASCO.
1.7 Pressure Levels in Natural Gas Network
The gas networks are working at different potential (pressure) levels. The pressure level of 70
bars is used to connect the production centers with the main distribution stations, at which the
pressure is reduced to 42 bars. Large consumers such as power, fertilizers, cement and
metallurgical plants as well as industrial districts are supplied at that pressure. Pressure is
further reduced in these distribution stations to 7 bars for distribution to the medium size
industrial and residential districts. Inside the facilities, gas is distributed at 4 bars till the
consuming equipment at which the pressure is reduced to the equipment operating pressure.
The working pressure of normal combustion system is around 20 mbar. Figure 1-8 shows
schematic diagram for the predominant pressure levels in the gas network of Egypt.
Figure 1-8 Schematic Diagram for Pressure Levels in the Gas Network of Egypt 21
1.8 Natural Gas Transportation and Distribution Grid
As mentioned before, natural gas is transported from the main producing fields to major
consuming centers and cities through the main gas pipelines at pressures ranging between 70
and 30 bars which is reduced to 7 and 4 bars through the Pressure Reducing Station. In
addition, an odorant is added to gas utilized by residential and commercial consumers for
safety reasons. Natural gas distribution grid to cities is composed of the following components:
Main distribution pipelines made of steel or polyethylene in which gas pressure ranges
between 7-2 bars.
21
“Power Generation using Recovered Energy from Natural Gas Networks”, 17th
International Conference on
Electricity Distribution, Barcelona, May 12-15th
2003

Boosting Capacity of Electric Generation through the use of Turbo-Expanders in Natural Gas Network 14
Environics in collaboration with Mohamed Salah Elsobki (jr) November 2013
Gas valves and regulators that reduce gas pressure of the high pressure distributions
pipelines to 2-0.1 bars for medium pressure distributions pipelines and to 0.1 for the
main low pressure distributions pipelines.
Main medium pressure distributions pipelines through which natural gas is transported
at a pressure of 2-0.1 bars.
Main low pressure distribution pipelines through which natural gas is transported at a
pressure of 0.1 bars.
Both the medium and low pressure gas distribution pipelines are made of polyethylene. Figure
1-9 is a schematic diagram for city natural gas distribution network.
Figure 1-9 Schematic Diagram for Natural Gas City Distribution Network 22
1.8.1 Pressure Reduction Stations (PRS) Operation 22
As mentioned before, natural gas is usually transmitted at high pressure. To satisfy the
distribution network needs or the end users, the pressure is then gradually reduced to low-
pressure ranges. Traditionally this has been done through PRVs at PRS. The PRS include
seven main stages: inlet, filtration, heating, reduction, measuring, odorizing and outlet.
22
“Environmental and Social Impact Assessment Framework for Greater Cairo Natural Gas Connections Project”,
September 2007

Boosting Capacity of Electric Generation through the use of Turbo-Expanders in Natural Gas Network 15
Environics in collaboration with Mohamed Salah Elsobki (jr) November 2013
1.8.1.1 Inlet stage:
It is essential that the inlet parts of the PRS are completely isolated from the cathodic system
applied to the feeding steel pipes. This could be done by installing an isolating joint with
protection. In case of emergencies, the PRS could be shut off by locally or remotely controlling
the main station valve included in the inlet stage.
1.8.1.2 Filtration stage
Filtration is required to remove dust, rust, solid contaminants and liquid traces. Two filters and
two separators are installed in parallel; each filter-separator operates with the full capacity of
the PRS. While operating one line, the other one is kept on standby. Filter-separator lines are
equipped with safety devices such as differential pressure gauges, relief valves, liquid
indicators, etc.
1.8.1.3 Heating stage
Because of the relatively high difference between inlet and outlet pressure, icing could occur
around outlet pipes. This may cause blockings that reduce or stop the gas flow. To avoid this, a
heater is installed to keep the temperature of the outlet pipes over 7°C. Each PRS is equipped
with two heaters in parallel to allow for a standby heater in emergencies.
1.8.1.4 Reduction stage
Two parallel reduction lines are included in each PRS allowing for a standby line. To maintain
safe operation conditions, the lines are equipped with safety gauges, indicators and
transmitters. According to the Institution of Gas Engineers and Managers (IGEM) standards, a
reduction unit should be installed in a well-ventilated-closed area or, alternatively, in an open
protected area.
1.8.1.5 Measuring stage
After adjusting the outlet pressure, gas flow and cumulative consumption are then measured, to
monitor NG consumption from the PRS and to adjust the dosing of the odorant as indicated
below. Measuring devices should be sensitive to low gas flow, which normally occurs during
the first stages after connecting a small portion of targeted clients.
1.8.1.6 Odorizing stage
The aim of the odorant stage is to enable the detection of gas leaks in residential units, at low
concentration, before gas concentration becomes hazardous. The normally used odorant is
formed from Tertiobutylmercaptin (80%) and Methylehylsulphide (20%). The normal dosing
rate of the odorant is 12-24 mg/cm3. The system will consist of a stainless steel storage tank,
receives the odorant from 200-liter drums, injection pumps and associated safety devices.
Operation of the odorant unit is controlled automatically and could be switched to manual
operation.
1.8.1.7 Outlet stage
The outlet stage includes the outlet valve gauge, temperature indicators, pressure and
temperature transmitters and non-return valves. The outlet pipes are also, as inlet pipes,
isolated from cathodic protection by an isolating joint.

Boosting Capacity of Electric Generation through the use of Turbo-Expanders in Natural Gas Network 16
Environics in collaboration with Mohamed Salah Elsobki (jr) November 2013
2 Turbo-Expander Mechanism The gas pressure is reduced at the reduction station using throttling valves. The throttling
process is a constant enthalpy process23
-at an almost constant temperature. This process is
thermodynamically irreversible.
Expansion through the turbo-expander is ideally an isentropic process, as work is extracted
from the expanding high pressure gas, as opposed to throttling gas through a regulator which is
ideally an isenthalpic process, as a large amount of latent energy of high pressure gas is wasted
during the pressure reduction process24
. In an isenthalpic throttling, there is a temperature
decrease in the gas due to the Joule-Thompson effect, but there is no change in the enthalpy of
the gas as it is reduced in pressure. In an isentropic expansion, the enthalpy of the gas also
decreases as the gas is expanded as shown in Error! Reference source not found.. This
change in enthalpy releases energy that is converted to power. The extraction of energy from
the gas results in a greater temperature reduction for an isentropic expansion compared to an
isenthalpic throttling over the same pressure ratio. The low pressure outlet gas from the turbine
is at a very low temperature, −150 °C or less depending upon the operating pressure and gas
properties. Partial liquefaction of the expanded gas is not uncommon. For natural gas pipeline
applications where certain minimum temperatures must be maintained to prevent condensation
or hydrate formation, the greater temperature drop of an isentropic power expansion can be a
critical consideration.
Figure 2-1 Different Pressure Reduction Processes24
A turbo-expander is essentially a compressor in reverse. Instead of shaft power being used to
compress gas to a higher pressure, shaft power is produced by expanding gas to a lower
pressure. Expanders are commonly used in air separation, LNG and hydrocarbon processing
applications where steady pressure ratios and flows, and high load factors are common.
23
Further information regarding isentropic process, Joule-Thompson effect and other thermodynamics definitions
are provided in Annex A. 24
“Steam Distribution System Desk Book” by James F. McCauley, Fairmont Press, Inc., 2000

Boosting Capacity of Electric Generation through the use of Turbo-Expanders in Natural Gas Network 17
Environics in collaboration with Mohamed Salah Elsobki (jr) November 2013
As shown in Figure 2-2, a turbo-expander, also referred to as an expansion turbine, is a
centrifugal or axial flow turbine through which a high pressure gas is expanded to produce
work that is often used to drive a compressor. 25,26,27
Figure 2-2 Schematic Diagram of a Turbo-Expander Driving a Compressor28
Turbo-expanders are very widely used as sources of refrigeration in industrial processes such
as the extraction of ethane and natural gas liquids (NGLs) from natural gas, the liquefaction of
gases (such as oxygen, nitrogen, helium, argon and krypton) and other low-temperature
processes. Turbo expanders which are in operation range in size from about 750 W to about 7.5
MW or 1 hp to about 10,000 hp25
.
2.1 Power Generation through Natural Gas Pressure Reduction
Power generation through natural gas pressure reduction is a closed loop operation as shown in
Figure 2-3. It is worth to mention that power generation through natural gas pressure does not
require any additional fuel burning and therefore does not require any additional natural gas for
the electricity production. When pre-heating is necessary; (as explained in section 2.2 below),
only a small portion of main gas is consumed as a fuel gas for preheating. All the natural gas
going into the expansion engine or turbine comes out as low pressure gas to the end user or the
gas network. Both expansion engines and turbo expanders can easily operate under the
following nominal parameters29
:
a) Inlet Pressure Range: from 100 psig to over 1000 psig.
b) Pressure regulation ratio: 2:1 to 16:1 or even higher.
c) Annual Availability: between 355 to 360 days.
d) Estimated Operating Life: minimum 30 years with regular servicing and
maintenance.
25
“Turbo-Expanders and Process Applications”, Heinz P. Bloch and Claire Soares, Gulf Professional Publishing.,
Jun 15, 2001 26
“Industrial Gas Handbook: Gas Separation and Purification.” Frank G. Kerry, 2007 27
“Cryogenics Engineering” (Second Edition ed.), Thomas Flynn, 2004 28
Turbo-expander, Wikipedia 29
“Power Generation Opportunities in Bangladesh from Gas Pressure Reduction Stations”, 3rd
International
Conference on Electrical & Computer Engineering ICECE 2004, 28-30 December 2004, Dhaka, Bangladesh

Boosting Capacity of Electric Generation through the use of Turbo-Expanders in Natural Gas Network 18
Environics in collaboration with Mohamed Salah Elsobki (jr) November 2013
Figure 2-3 Power Generation through Natural Gas Pressure Reduction 30
2.2 Temperature Constraints
The expansion process produces a temperature decrease which can cause cooling of the gas
and condensation of the gas composition. When the turbo-expander is used, the temperature
drop is much greater; as the gas is doing work in the expansion. This means the gas need to be
preheated before it enters the turbo-expander to temperature higher than when using throttling
valves.
If the supplied gas is at the ambient temperature the exhaust gas temperature will be at a lower
temperature depending on the expansion pressure ratio, type of the gas and expansion
efficiency. In cases when the turbo-expander is not being used for condensation and
consequently it is not required to have low downstream temperature, suitable upstream gas
preheating is used. This is preferably achieved by recovering the waste heat from any available
heat source in the PRS or the industrial plant to which gas is fed (through e.g. Heat exchanger).
If this is not possible, a dedicated gas pre-heater is used. Gas preheating boosts the power of
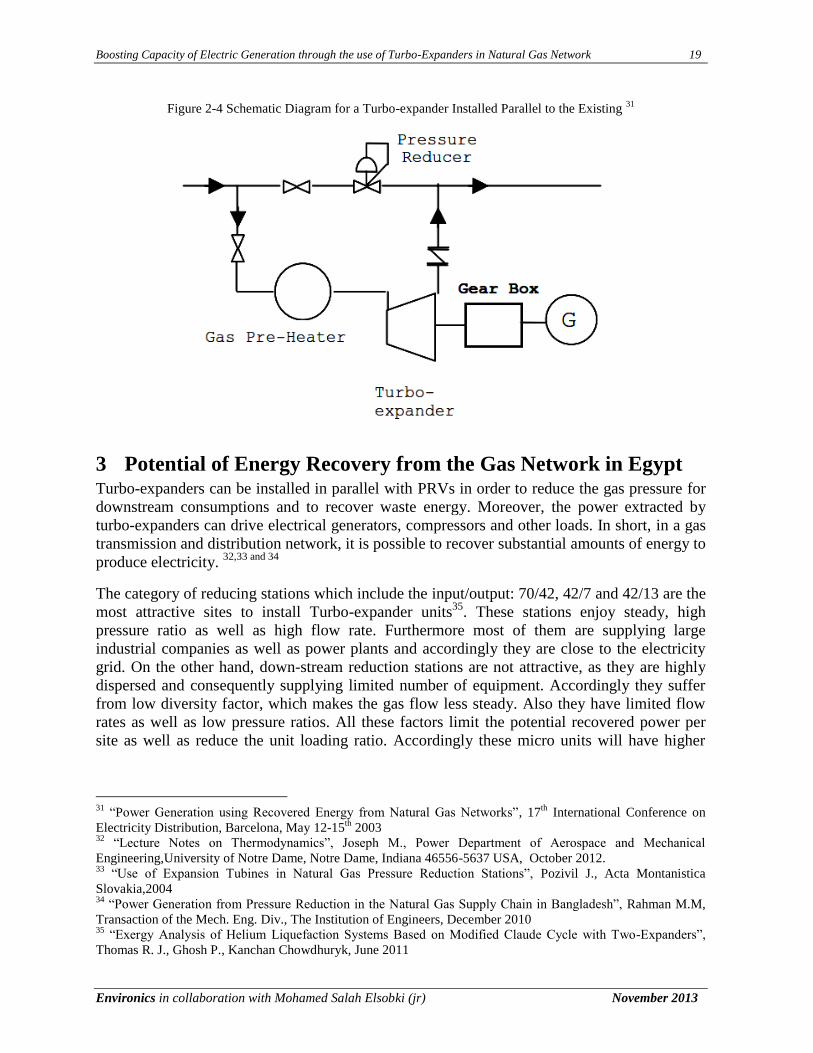
the Turbo-expander due to the increase in the enthalpy of the upstream gas. Figure 2-4 shows a
schematic diagram for a pressure reducing station, which uses a parallel turbo-expander for
pressure reduction with gas pre-heater.
30
“Power Generation Opportunities in Bangladesh from Gas Pressure Reduction Stations”, 3rd
International
Conference on Electrical & Computer Engineering ICECE 2004, 28-30 December 2004, Dhaka, Bangladesh
Boosting Capacity of Electric Generation through the use of Turbo-Expanders in Natural Gas Network 19
Environics in collaboration with Mohamed Salah Elsobki (jr) November 2013
Figure 2-4 Schematic Diagram for a Turbo-expander Installed Parallel to the Existing 31
3 Potential of Energy Recovery from the Gas Network in Egypt Turbo-expanders can be installed in parallel with PRVs in order to reduce the gas pressure for
downstream consumptions and to recover waste energy. Moreover, the power extracted by
turbo-expanders can drive electrical generators, compressors and other loads. In short, in a gas
transmission and distribution network, it is possible to recover substantial amounts of energy to
produce electricity. 32,33 and 34
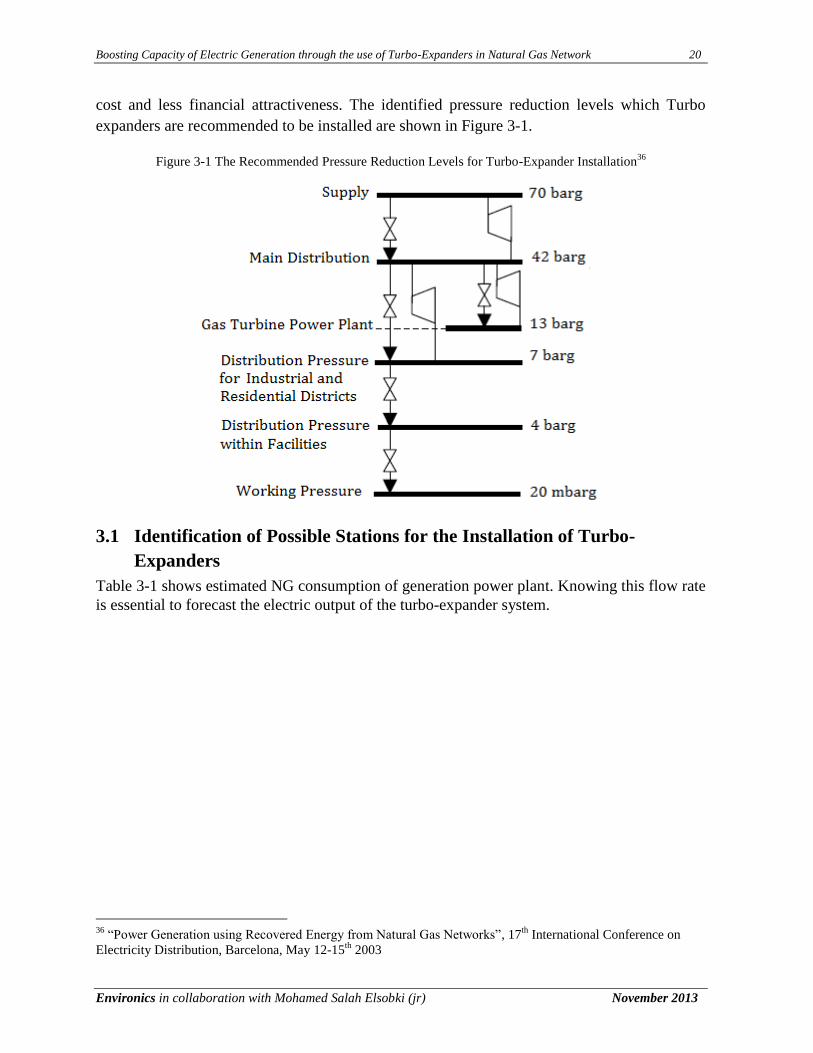
The category of reducing stations which include the input/output: 70/42, 42/7 and 42/13 are the
most attractive sites to install Turbo-expander units35
. These stations enjoy steady, high
pressure ratio as well as high flow rate. Furthermore most of them are supplying large
industrial companies as well as power plants and accordingly they are close to the electricity
grid. On the other hand, down-stream reduction stations are not attractive, as they are highly
dispersed and consequently supplying limited number of equipment. Accordingly they suffer
from low diversity factor, which makes the gas flow less steady. Also they have limited flow
rates as well as low pressure ratios. All these factors limit the potential recovered power per
site as well as reduce the unit loading ratio. Accordingly these micro units will have higher
31
“Power Generation using Recovered Energy from Natural Gas Networks”, 17th
International Conference on
Electricity Distribution, Barcelona, May 12-15th
2003 32
“Lecture Notes on Thermodynamics”, Joseph M., Power Department of Aerospace and Mechanical
Engineering,University of Notre Dame, Notre Dame, Indiana 46556-5637 USA, October 2012. 33
“Use of Expansion Tubines in Natural Gas Pressure Reduction Stations”, Pozivil J., Acta Montanistica
Slovakia,2004 34
“Power Generation from Pressure Reduction in the Natural Gas Supply Chain in Bangladesh”, Rahman M.M,
Transaction of the Mech. Eng. Div., The Institution of Engineers, December 2010 35
“Exergy Analysis of Helium Liquefaction Systems Based on Modified Claude Cycle with Two-Expanders”,
Thomas R. J., Ghosh P., Kanchan Chowdhuryk, June 2011
Boosting Capacity of Electric Generation through the use of Turbo-Expanders in Natural Gas Network 20
Environics in collaboration with Mohamed Salah Elsobki (jr) November 2013
cost and less financial attractiveness. The identified pressure reduction levels which Turbo
expanders are recommended to be installed are shown in Figure 3-1.
Figure 3-1 The Recommended Pressure Reduction Levels for Turbo-Expander Installation36
3.1 Identification of Possible Stations for the Installation of Turbo-
Expanders
Table 3-1 shows estimated NG consumption of generation power plant. Knowing this flow rate
is essential to forecast the electric output of the turbo-expander system.
36
“Power Generation using Recovered Energy from Natural Gas Networks”, 17th
International Conference on
Electricity Distribution, Barcelona, May 12-15th
2003

Boosting Capacity of Electric Generation through the use of Turbo-Expanders in Natural Gas Network 21
Environics in collaboration with Mohamed Salah Elsobki (jr) November 2013
Table 3-1 Fuel Type and Estimated NG Consumption of Generation Power Plants 37
Company Station
Installed
Capacity
(MW)
Annual Gross
Generation
(GWh)
Specific Fuel
Consumption
(gm/kWh gen.)
Fuel
Type
Average Fuel
Consumption
(ktoe/yr)
Average NG
Consumption
(m3/sec)
Cairo
Shoubra El-
Kheima (St) 1,260 5,473 243.147
N.G-
H.F.O 1,331 35.17
Cairo West
(St) 350 682 334.514
N.G-
H.F.O 228 6.02
Cairo West
Ext. (St) 1,360 7,181 214.689
N.G-
H.F.O 1,541 40.72
Tebbin (St) 700 4,276 198.251 N.G-
H.F.O 848 22.41
Cairo South
I (CC) 450 2,681 231.063
N.G-
H.F.O 619 16.36
Cairo South
II (CC) 165 719 261.261 N.G 188 6.62
Cairo North
(CC) 1,500 10,432 160.743
N.G-
L.F.O 1,677 44.31
Wadi Hof
(G) 100 127 383.618
N.G-
L.F.O 49 1.29
6 October
(G) 450 628 235.620
N.G-
L.F.O 148 3.91
Sub Total 6,335 32,199
East
Delta
Ataka (St) 900 4,260 255.730 N.G-
H.F.O 1,089 28.78
Abu Sultan
(St) 600 3,674 260.040
N.G-
H.F.O 955 25.24
Shabab (G) 100 106 364.456 N.G-
L.F.O 39 1.03
37
EEHC, "Annual Report 2011/2012”

Boosting Capacity of Electric Generation through the use of Turbo-Expanders in Natural Gas Network 22
Environics in collaboration with Mohamed Salah Elsobki (jr) November 2013
Company Station
Installed
Capacity
(MW)
Annual Gross
Generation
(GWh)
Specific Fuel
Consumption
(gm/kWh gen.)
Fuel
Type
Average Fuel
Consumption
(ktoe/yr)
Average NG
Consumption
(m3/sec)
Port Said
(G) 73 62 366.382
N.G-
L.F.O 23 0.61
EL-Arish
(St) 66 367 257.900
N.G-
H.F.O 94 2.48
Oyoun
Mousa (St) 640 5,188 214.400
N.G-
H.F.O 1,112 29.38
Damietta
(CC) 1,200 7,522 193.100
N.G-
H.F.O 1,453 38.40
New Gas
Damietta
(G)
500 2,989 256.300 N.G-
L.F.O 766 20.24
New Gas
Shabab (G) 1,000 6,013 275.183
N.G-
L.F.O 1,655 43.73
Sharm El-
Sheikh (G) 178 43 400.1 L.F.O 17 -
Hurghada
(G) 143 44 439.5 L.F.O 19 -
Sub Total 5,400 30,268
Middle
Delta
Talkha (CC) 290 1,698 236.800 N.G-
L.F.O 402 10.62
Talkha
steam 210
(St)
420 2,197 243.700 N.G-
H.F.O 535 14.14
Talkha 750
(CC) 750 3,462 165.872
N.G-
L.F.O 575 15.19
Nubaria
1,2,3 (CC) 2,250 11,169 163.931
N.G-
L.F.O 1,831 48.38
Mahmoudia
(CC) 316 2,052 235.200
N.G-
L.F.O 483 12.76

Boosting Capacity of Electric Generation through the use of Turbo-Expanders in Natural Gas Network 23
Environics in collaboration with Mohamed Salah Elsobki (jr) November 2013
Company Station
Installed
Capacity
(MW)
Annual Gross
Generation
(GWh)
Specific Fuel
Consumption
(gm/kWh gen.)
Fuel
Type
Average Fuel
Consumption
(ktoe/yr)
Average NG
Consumption
(m3/sec)
El-Atf (CC) 750 5,652 160.825 N.G-
L.F.O 909 24.02
Sub Total 4,776 26,230
West
Delta
Kafr El-
Dawar (St) 440 2,116 276.500
N.G-
H.F.O 585 15.46
Damanhour
Ext. 300
(St)
300 539 251.700 N.G-
H.F.O 136 3.59
Damanhour
(St) 195 1,050 293.010
N.G-
H.F.O 308 8.14
Damanhour
(CC) 156.5 1,049 215.282
N.G-
L.F.O 226 5.97
Abu Kir (St) 911 5,179 247.000 N.G-
H.F.O 1,279 33.80
El-Seiuf (G) 200 214 390.442 N.G-
L.F.O 83 2.19
Karmouz
(G) 23.1 6 407.607 L.F.O 3 -
Sidi Krir
(St) 640 4,004 211.678
N.G-
H.F.O 848 22.41
Sidi Krir
(CC) 750 5,461 158.913
N.G-
H.F.O 868 22.94
Matroh (St) 60 366 289.631 N.G-
H.F.O 106 2.80
Sub Total 3,675.6 19,984
Upper
Egypt
Kuriemat
(St) 1,254 7,602 211.820
N.G-
H.F.O 1,625 42.94
Kuriemat 1
(CC) 750 5,072 156.000
N.G-
L.F.O 791 20.90
Boosting Capacity of Electric Generation through the use of Turbo-Expanders in Natural Gas Network 24
Environics in collaboration with Mohamed Salah Elsobki (jr) November 2013
Company Station
Installed
Capacity
(MW)
Annual Gross
Generation
(GWh)
Specific Fuel
Consumption
(gm/kWh gen.)
Fuel
Type
Average Fuel
Consumption
(ktoe/yr)
Average NG
Consumption
(m3/sec)
Kuriemat 2
(CC) 750 4,435 173.800
N.G-
H.F.O 771 20.37
Walidia (St) 624 3166 234.63 H.F.O 743 -
Assiut (St) 90 406 305.76 H.F.O 124 -
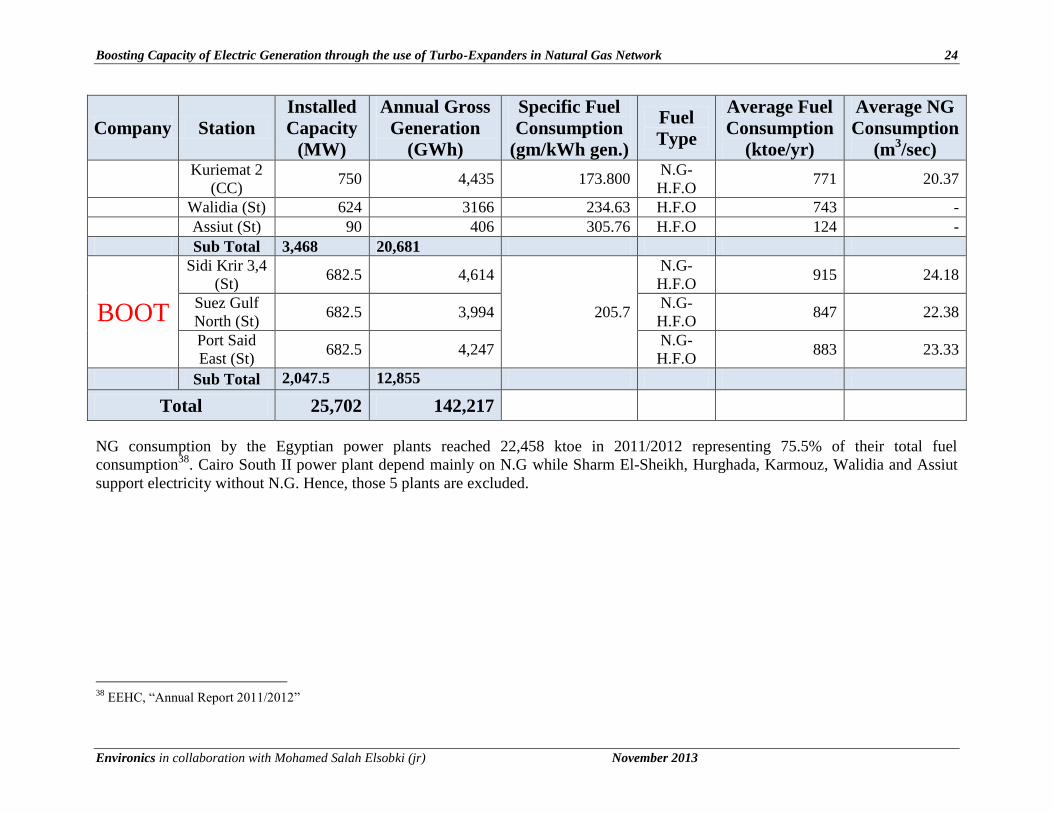
Sub Total 3,468 20,681
BOOT
Sidi Krir 3,4
(St) 682.5 4,614
205.7
N.G-
H.F.O 915 24.18
Suez Gulf
North (St) 682.5 3,994
N.G-
H.F.O 847 22.38
Port Said
East (St) 682.5 4,247
N.G-
H.F.O 883 23.33
Sub Total 2,047.5 12,855
Total 25,702 142,217
NG consumption by the Egyptian power plants reached 22,458 ktoe in 2011/2012 representing 75.5% of their total fuel
consumption38
. Cairo South II power plant depend mainly on N.G while Sharm El-Sheikh, Hurghada, Karmouz, Walidia and Assiut
support electricity without N.G. Hence, those 5 plants are excluded.
38
EEHC, “Annual Report 2011/2012”

Boosting Capacity of Electric Generation through the use of Turbo-Expanders in Natural Gas Network
Environics in collaboration with Mohamed Salah Elsobki (jr) November 2013
4 Possible Electric Capacity Output from the Identified Possible
Turbo-Expander Installations
Various applications have been made worldwide to harness the energy loss during natural gas
pressure reduction through conventional throttling valves and experimental work to examine
the most important factors that determine the level of power to be produced through the
utilization of turbo expanders instead of throttling valves.
It is obvious that both the gas flow rate and the pressure reduction ratio (PR) (the ratio of inlet
high pressure over outlet low pressure) are the most important parameters.
The parameters required to size the turbo-expander are39
:
1. Gas Composition
2. Flow Rate
3. Pressure Ratio
4. Inlet Temperature
A twofold optimal formulation is introduced to account for the proposed locations of Turbo-
expanders and their capacities40
. The first stage of the optimal formulation is the determination
process of the best locations for the installation of turbo-expenders in the gas distribution
network. The selection process is executed through a combinatorial optimization process,
where pressure ratio “Rp” across the reduction station is maximum, the flow rate “G” is
maximum, the variation in the flow rate “ΔG” is minimum and interconnection requirements
with the electricity grid are minimum.
The second stage of the optimal formulation is to determine the optimum rating of the turbo-
expander and the corresponding operational conditions. The target is to reach the maximum
possible electric energy “E”, as well as minimum fuel consumption for preheating, with a
target upper limit of the cost per kWh generated. This is expressed as41
:
(Equation 4-1)
Where,
P: Rated Electric output of the turbo-expander system
As: Availability of the turbo-expander system
The rated electric power “P” is expressed in terms of the rated flow capacity “GR” of the turbo-
expander, the specific heat “CP” of the gas, the density of the gas at normal conditions “ρNG”,
the inlet temperature “Tin” to the turbo-expander, the pressure ratio “RP”, the overall efficiency
of the turbo-expander system “ηS”, and gas specific heat ratio “k”. Gas specific heat is
considered as a function in temperature. The electric power “P” is expressed as:
(Equation 4-2)
39
“Fundamental of Turbo-Expanders (Basic theory and Design)”, presented by: Mr. James Simms, Simms
Machinery International, INC, California, March 23th
, 2009 40
“Exergy Based Analysis on Different Expander Arrangements in Helium Liquefiers”, Thomas R. J., Ghosh P.,
Kanchan Chowdhuryk, November 2011 41
“Power Generation using Recovered Energy from Natural Gas Networks”, 17th
International Conference on
Electricity Distribution, Barcelona, May 12-15th
2003

Boosting Capacity of Electric Generation through the use of Turbo-Expanders in Natural Gas Network
Environics in collaboration with Mohamed Salah Elsobki (jr) November 2013
The availability “AS” of the Turbo-expander system is normally a manufacturer based value
and is around 92%42
.
The pressure ratio “RP” is expressed in terms of the upstream and downstream pressure levels
“Pu” and “Pd” at the gas reduction station and is expressed as:
The overall efficiency of the turbo-expender system “ηS” represents all the sub systems
efficiencies including the turbo-expander efficiency “ηT”, the transmission efficiency “ηTran”
(gearbox) and the generator efficiency “ηG”, and is expressed as:
(Equation 4-3)
Both the Turbo-expander efficiency “ηT” and the generator efficiency “ηG” are functions in the
load factor. Figure 4-1 shows the dependence of the expander efficiency on the load factor
(design flow percent).
Figure 4-1 Variation of Turbo-expander Efficiency with Gas Flow Rate
The design flow of a turbo-expander is the flow rate at which the maximum efficiency is
observed. As the flow rate increases or decreases from the design flow, the efficiency will
decrease.
The turbo-expander inlet temperature “Tin” is related to the downstream temperature “Td” of
the gas reduction station as:
The downstream temperature “Td” is limited by the possible liquid condensation, if the
downstream temperature went below the dew point “Tdp” of the heavy constituents of the gas.
42
“Rotoflow Turbo-Expander for Hydrocarbon Applications”, GE Power System-Gas and Oil, 2002

Boosting Capacity of Electric Generation through the use of Turbo-Expanders in Natural Gas Network
Environics in collaboration with Mohamed Salah Elsobki (jr) November 2013
Condensation increases the erosion of expander blades as well as reduces its efficiency. Since
the concentration of the heavy constituents can vary, then a safety margin “ΔTs” should be
considered.
Therefore inlet gas preheating is needed to control the downstream temperature and the main
point is that the outlet temperature should always be greater that the dew point of natural gas
composition (butane) at outlet pressure. Additional heating of the inlet gas will lead to an
increase in the turbine output yet this will take place on the expense of the system efficiency.
Finally, the turbo-expander outlet temperature “To” is function in the turbo-expander inlet
temperature “Tin”. The isentropic (ideal case)43
outlet temperature of turbo-expander “To isen” is
expressed as:
The actual outlet temperature of turbo-expander “To act” is related to the isentropic outlet
temperature as following:
4.1 Evaluating the Potential of Electricity Generation from Natural Gas
Pressure Reduction Stations
Table 4-1 illustrates the impact of gas flow rates and pressure reduction ratios on the level of
power generation according to an experiential work done in a natural gas PRS in Bangladesh to
examine that correlation.
Table 4-1 Examples of Power from Gas Pressure Reduction44
NG Flow
(Standard m3/hr)
Incoming Gas
Pressure (bar g)
Outlet Gas
Pressure (bar g)
Pressure
Reduction
Ratio
Power
Generated
(kW)
10,000 60 2 30:1 700
45,000 37 15 2.45:1 1500
6,500 55 9 6.1:1 750
9,000 40 7 5.6:1 470
16,000 18 6 3:1 850
5,500 50 3 16.7:1 570
43
“Lecture Notes on Thermodynamics”, Joseph M., Power Department of Aerospace and Mechanical Engineering
University of Notre Dame, Notre Dame, Indiana 46556-5637 USA, October 2012. 44
Sources:
“Gas Expansion Power Plants with Modular System Gas Expanders” a publication of Spilling Energy System.
“Power Generation Opportunities in Bangladesh from Gas Pressure Reduction Stations”, 3rd
International
Conference on Electrical & Computer Engineering ICECE 2004, 28-30 December 2004, Dhaka, Bangladesh
Boosting Capacity of Electric Generation through the use of Turbo-Expanders in Natural Gas Network
Environics in collaboration with Mohamed Salah Elsobki (jr) November 2013
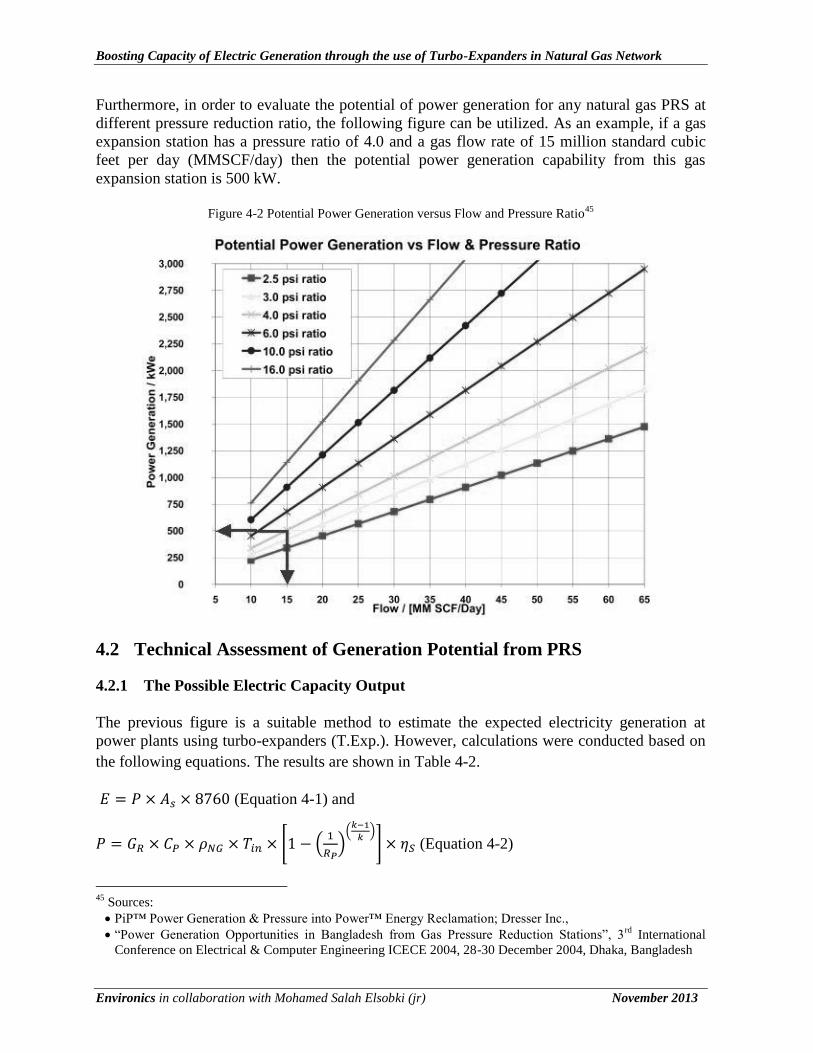
Furthermore, in order to evaluate the potential of power generation for any natural gas PRS at
different pressure reduction ratio, the following figure can be utilized. As an example, if a gas
expansion station has a pressure ratio of 4.0 and a gas flow rate of 15 million standard cubic
feet per day (MMSCF/day) then the potential power generation capability from this gas
expansion station is 500 kW.
Figure 4-2 Potential Power Generation versus Flow and Pressure Ratio45
4.2 Technical Assessment of Generation Potential from PRS
4.2.1 The Possible Electric Capacity Output
The previous figure is a suitable method to estimate the expected electricity generation at
power plants using turbo-expanders (T.Exp.). However, calculations were conducted based on
the following equations. The results are shown in Table 4-2.
(Equation 4-1) and
(Equation 4-2)
45
Sources:
PiP™ Power Generation & Pressure into Power™ Energy Reclamation; Dresser Inc.,
“Power Generation Opportunities in Bangladesh from Gas Pressure Reduction Stations”, 3rd
International
Conference on Electrical & Computer Engineering ICECE 2004, 28-30 December 2004, Dhaka, Bangladesh

Boosting Capacity of Electric Generation through the use of Turbo-Expanders in Natural Gas Network
Environics in collaboration with Mohamed Salah Elsobki (jr) November 2013
Table 4-2 Expected Electricity Generation at Power Plants by Turbo-Expander
Company No. Station T.Exp. Capacity
(MW)
T.Exp. Annual
Electricity
Generated (GWh)
Cairo
1 Shoubra El-Kheima (St) 4.21 36.84
2 Cairo West (St) 0.72 6.31
3 Cairo West Ext. (St) 4.87 42.65
4 Tebbin (St) 2.68 23.47
5 Cairo South I (CC) 1.96 17.13
6 Cairo South II (CC) 0.79 6.94
7 Cairo North (CC) 5.30 46.41
8 Wadi Hof (G) 0.15 1.36
9 6 October (G) 0.47 4.10
Sub Total 21.14 185.21
East
Delta
10 Ataka (St) 3.44 30.14
11 Abu Sultan (St) 3.02 26.43
12 Shabab (G) 0.12 1.08
13 Port Said (G) 0.07 0.64
14 EL-Arish (St) 0.30 2.60
15 Oyoun Mousa (St) 3.51 30.78
16 Damietta (CC) 4.59 40.21
17 New Gas Damietta (G) 2.42 21.20
18 New Gas Shabab (G) 5.23 45.80
Sub Total 22.7 198.88
Middle
Delta
19 Talkha (CC) 1.27 11.13
20 Talkha steam 210 (St) 1.69 14.81
21 Talkha 750 (CC) 1.82 15.91
22 Nubaria 1,2,3 (CC) 5.78 50.68
23 Mahmoudia (CC) 1.53 13.37
24 El-Atf (CC) 2.87 25.16
Sub Total 14.96 131.06
West
Delta
25 Kafr El-Dawar (St) 1.85 16.19
26 Damanhour Ext. 300 (St) 0.43 3.76
27 Damanhour (St) 0.97 8.52
28 Damanhour (CC) 0.71 6.25
29 Abu Kir (St) 4.04 35.40
30 El-Seiuf (G) 0.26 2.30
31 Sidi Krir (St) 2.68 23.47
32 Sidi Krir (CC) 2.74 24.02
33 Matroh (St) 0.33 2.93
Sub Total 14.02 122.84

Boosting Capacity of Electric Generation through the use of Turbo-Expanders in Natural Gas Network
Environics in collaboration with Mohamed Salah Elsobki (jr) November 2013
Company No. Station T.Exp. Capacity
(MW)
T.Exp. Annual
Electricity
Generated (GWh)
Upper
Egypt
34 Kuriemat (St) 5.13 44.97
35 Kuriemat 1 (CC) 2.50 21.89
36 Kuriemat 2 (CC) 2.44 21.34
Sub Total 10.07 88.20
BOOT
37 Sidi Krir 3,4 (St) 2.89 25.32
38 Suez Gulf North (St) 2.68 23.44
39 Port Said East (St) 2.79 24.44
Sub Total 8.36 73.20
Total 91.26 MW 799.39 GWh
An estimated overall additional capacity at about 91 MW, with individual capacity ranging
between 70 kW and 5.78 MW, could be generated through the use of turbo-expanders in the
existing PRS at the electricity production companies. The total electricity produced in one year
is approximately 800 GWh.
Evaluating the potential of electricity generation from industrial sector is also provided in
Error! Reference source not found..
4.2.2 Environmental Impact and Natural Gas Avoided
The turbo-expander additional electricity is generated without affecting the natural gas
consumption by power plants. Hence, the amount of natural gas avoided could be computed
using the following equation:
The table below illustrates the annual natural gas avoided. This is calculated using the specific
consumption of each plant (Table 3-1), based on 75.5%46
share of their total fuel consumption.
This practically means that the output of the plant will be reduced in an amount equal to power
generated by the turbo-expander. This might not be the case in periods of the day of high
demand on electricity, and N.G avoided will be smaller than the mentioned in the table below.
Avoided N.G will result in carbon dioxide release avoidance assumed to be 2.6147
ton CO2 to
ton NG.
46
EEHC, “Annual Report 2011/2012” 47 EEHC: “Annual Report 2010/2011”

Boosting Capacity of Electric Generation through the use of Turbo-Expanders in Natural Gas Network
Environics in collaboration with Mohamed Salah Elsobki (jr) November 2013
To determine the annual N.G avoided cost as shown Table 4-3, two sets of N.G prices are
used. The subsidized price of N.G for the electricity sector is 0.06$ per m3.48
As for the
unsubsidized N.G prices, N.G is sold in the spot market for 10.75$ per MMBtu.49
Table 4-3 The Annual Natural Gas Avoided Cost
Company No. Station
Annual NG Avoided Annual
CO2
Avoided
(ton Co2) ktoe m
3 Subsidized
NG ($)
Unsubsidized
NG ($)
Cairo
1
Shoubra El-
Kheima
(St)
6.72 7,463,805 447,828 2,863,523 2,315
2 Cairo West
(St) 1.58 1,758,986 105,539 674,843 546
3 Cairo West
Ext. (St) 6.87 7,630,021 457,801 2,927,292 2,367
4 Tebbin (St) 3.49 3,877,257 232,635 1,487,527 1,203
5 Cairo South
I (CC) 2.97 3,298,636 197,918 1,265,537 1,023
6 Cairo South
II (CC) 1.81 2,013,832 120,830 772,616 625
7 Cairo North
(CC) 5.60 6,216,965 373,018 2,385,167 1,929
8 Wadi Hof
(G) 0.39 433,519 26,011 166,322 134
9 6 October
(G) 0.72 804,243 48,255 308,551 249
East
Delta
10 Ataka (St) 5.78 6,422,777 385,367 2,464,128 1,992
11 Abu Sultan
(St) 5.15 5,727,391 343,643 2,197,340 1,777
12 Shabab (G) 0.30 327,811 19,669 125,766 102
13 Port Said
(G) 0.17 194,346 11,661 74,562 60
14 EL-Arish
(St) 0.50 559,104 33,546 214,503 173
15 Oyoun
Mousa (St) 4.95 5,498,483 329,909 2,109,518 1,706
16 Damietta
(CC) 5.82 6,470,848 388,251 2,482,570 2,007
48
The Egyptian Cabinet decree No. 1257 of the year 2012, regarding the sale price per cubic meter of the local
natural gas supplied to all the electricity producing companies. The subsidized price of N.G is 44 PT per m3.
49 Based on private communication

Boosting Capacity of Electric Generation through the use of Turbo-Expanders in Natural Gas Network
Environics in collaboration with Mohamed Salah Elsobki (jr) November 2013
Company No. Station
Annual NG Avoided Annual
CO2
Avoided
(ton Co2) ktoe m
3 Subsidized
NG ($)
Unsubsidized
NG ($)
17
New Gas
Damietta
(G)
4.08 4,527,836 271,670 1,737,125 1,405
18 New Gas
Shabab (G) 9.45 10,503,472 630,208 4,029,705 3,258
Middle
Delta
19 Talkha
(CC) 1.98 2,195,437 131,726 842,290 681
20
Talkha
steam 210
(St)
2.71 3,006,925 180,416 1,153,620 933
21 Talkha 750
(CC) 1.98 2,199,653 131,979 843,907 682
22 Nubaria
1,2,3 (CC) 6.23 6,922,496 415,350 2,655,847 2,147
23 Mahmoudia
(CC) 2.36 2,619,979 157,199 1,005,167 813
24 El-Atf (CC) 3.03 3,371,559 202,294 1,293,514 1,046
West
Delta
25 Kafr El-
Dawar (St) 3.36 3,730,476 223,829 1,431,214 1,157
26
Damanhour
Ext. 300
(St)
0.71 789,470 47,368 302,884 245
27 Damanhour
(St) 1.87 2,081,356 124,881 798,522 646
28 Damanhour
(CC) 1.01 1,122,095 67,326 430,497 348
29 Abu Kir
(St) 6.56 7,285,860 437,152 2,795,253 2,260
30 El-Seiuf
(G) 0.67 747,391 44,843 286,740 232
31 Sidi Krir
(St) 3.73 4,139,853 248,391 1,588,273 1,284
32 Sidi Krir
(CC) 2.86 3,181,211 190,873 1,220,486 987
33 Matroh (St) 0.64 708,050 42,483 271,647 220
Upper 34 Kuriemat
(St) 7.14 7,938,412 476,305 3,045,608 2,463

Boosting Capacity of Electric Generation through the use of Turbo-Expanders in Natural Gas Network
Environics in collaboration with Mohamed Salah Elsobki (jr) November 2013
Company No. Station
Annual NG Avoided Annual
CO2
Avoided
(ton Co2) ktoe m
3 Subsidized
NG ($)
Unsubsidized
NG ($)
Egypt 35 Kuriemat 1
(CC) 2.56 2,845,866 170,752 1,091,829 883
36 Kuriemat 2
(CC) 2.78 3,090,420 185,425 1,185,653 959
BOOT
37 Sidi Krir
3,4 (St) 3.77 4,184,841 251,090 1,605,533 1,298
38 Suez Gulf
North (St) 3.73 4,142,628 248,558 1,589,338 1,285
39 Port Said
East (St) 3.81 4,233,986 254,039 1,624,388 1,313
Total 129.85 144,267,295 8,656,038 55,348,802 44,753
The 130 ktoe avoided are a result of using the turbo-expander to generate the additional 799
GWh without increasing the natural gas consumption by power plants. The total natural gas
avoided per year is estimated to reach 130 ktoe, representing about 0.6% of the 21,663 ktoe
consumed by the existing power plants. This will lead to 45 tons annual savings of CO2
emissions which represents again about 0.6% of the total CO2 emissions from the existing
power plants.

Boosting Capacity of Electric Generation through the use of Turbo-Expanders in Natural Gas Network
Environics in collaboration with Mohamed Salah Elsobki (jr) November 2013
5 Economic Assessment for the Application
High-efficiency expanders made even smaller units economically attractive. Turbo-expanders
offer great promise from an energy efficiency perspective in that they have the potential to
provide power at very high efficiency (low heat rates). This heat rate can be further reduced if
the heating can be provided by a source of waste heat from another process or application.
5.1 Factors Affecting the Project Economics 50
The most important factors affecting project economics are the high capital cost of the systems
themselves, and the recoverable value of the electricity generated. Other key variables include
the gas flow rate and pressure drop, which together determine the power generation potential,
and the hourly, daily and seasonal variability in flow.
5.1.1 Capital Costs
The total costs for a turbo expander system include the equipment costs for the expander,
gearbox, generator, pre-heaters, utility interconnect and controls, and pipeline connection, as
well as the overall engineering and installation costs. According to a study conducted in Iran
the costs ranges from 600$ to 2,300$/kW. The lowest cost per kW was on the largest system
indicating that some economies of scale exist.51
5.1.2 Operating Costs
Turbo-expander installations generating electricity will have significantly higher operating
costs than regulator stations. The highest cost will be in the fuel required for pre- or post-
heating of the gas. However, this study assumed the inlet gas is pre-heated using power plant
waste heat recovery system (e.g. heat exchanger). Along with this are maintenance costs for
the turbo expander equipment itself. The annual non-fuel operating and maintenance (O&M)
costs were estimated at two percent of capital costs52
.
5.1.3 Revenue from Power Sales
The total revenue depends on the sales price and the amount of power generated. The amount
of power is a function of the flow rate and pressure ratio at the location, and the efficiency of
the expander/ gearbox/ generator system in converting pressure drop to electricity. Daily and
seasonal variations in flow and pressure will affect power output and will most likely impact
the value of the power to the ultimate purchaser.
5.1.4 Pressure Ratio
Higher pressure ratios (ratio of inlet pressure to outlet pressure) result in higher power
production. While normal pipeline operating pressures are well below maximum turbo-
expander pressure ratios, there is also a minimum pressure ratio (approximately 1.3:1) that
must be maintained below which the turbo-expander will not function.
50
“Waste energy Recovery Opportunities for Interstate Natural Gas Pipelines”, prepared by: Bruce A. Hed,am
Energy and Environmental Analysis, INC., An ICF International Company,February 2008 51
“Energy Regeneration in Natural Gas Pressure Reduction Stations by Use of Gas Turbo-Expander; Evaluation
of Available Potential in Iran”, Ardalj, E.K and Heybatial, E. 2009 52
“Application of Turbo-expanders for Pressure Letdown Energy Recovery”, Engineering Technical Note,
Operating and Engineering Services Group, American Gas Association, 1987

Boosting Capacity of Electric Generation through the use of Turbo-Expanders in Natural Gas Network
Environics in collaboration with Mohamed Salah Elsobki (jr) November 2013
5.1.5 Flow Rate
Power output is also a function of flow rate. Variability in flow rate is an important
consideration in project economics, and gas flow rates, particularly at stations, will vary over a
wide range due to seasonal, daily and hourly demand fluctuations. Turbo-expanders can
generally operate between 50 and 140 percent of design flow, although exact capabilities will
vary from manufacturer to manufacturer. This can make optimum sizing for an installation
difficult to estimate. If the system is too large, there may be significant periods of the year
where flow and pressure are below the minimum requirements and the system will remain idle.
If the system is sized too small and capital cost economies are lost and there may be extended
periods where a significant portion of the flow will need to bypass the turbo expander.
5.2 System Cost Calculation
In order to evaluate the turbo-expander economics, the different range of capital cost per kilo
Watt generated should be taken into consideration. To be conservative, the capital costs per
kW is assumed to be 2,300 $/kW inclusive the cost of finance.
Assuming 25 years as lifetime and considering that no additional cost required for pre-heating
the gas, e.g. inlet gas is pre-heated using power plant waste heat recovery system.
The payback period is determined by calculating the total capital cost of turbo-expander
system divided by the annual natural gas avoided. This is expressed as:
The table below estimates the total capital costs, the annual O&M, the annual N.G avoided
cost53
as well as the payback period for unsubsidized natural gas.
53
The unsubsidized N.G price in the spot market is 10.75$ per MMBtu, based on private communication.

Boosting Capacity of Electric Generation through the use of Turbo-Expanders in Natural Gas Network
Environics in collaboration with Mohamed Salah Elsobki (jr) November 2013
Table 5-1 Total Capital Costs and Payback Period for Turbo-Expander Installations
Company Station Capital
Costs ($)
Annual
O&M
Costs ($)
Annual
NG
Avoided
Cost ($)
Payback
period
(years)
Cairo
Shoubra El-Kheima (St) 9,671,947 7,738 2,863,523 3
Cairo West (St) 1,656,802 1,325 674,843 2
Cairo West Ext. (St) 11,197,950 8,958 2,927,292 4
Tebbin (St) 6,162,142 4,930 1,487,527 4
Cairo South I (CC) 4,498,073 3,598 1,265,537 4
Cairo South II (CC) 1,821,514 1,457 772,616 2
Cairo North (CC) 12,186,218 9,749 2,385,167 5
Wadi Hof (G) 356,067 285 166,322 2
6 October (G) 1,075,468 860 308,551 3
East
Delta
Ataka (St) 7,913,412 6,331 2,464,128 3
Abu Sultan (St) 6,939,677 5,552 2,197,340 3
Shabab (G) 283,400 227 125,766 2
Port Said (G) 167,134 134 74,562 2
EL-Arish (St) 683,068 546 214,503 3
Oyoun Mousa (St) 8,080,545 6,464 2,109,518 4
Damietta (CC) 10,558,482 8,447 2,482,570 4
New Gas Damietta (G) 5,566,275 4,453 1,737,125 3
New Gas Shabab (G) 12,026,351 9,621 4,029,705 3
Middle
Delta
Talkha (CC) 2,921,204 2,337 842,290 3
Talkha steam 210 (St) 3,887,672 3,110 1,153,620 3
Talkha 750 (CC) 4,178,339 3,343 843,907 5
Nubaria 1,2,3 (CC) 13,305,286 10,644 2,655,847 5
Mahmoudia (CC) 3,509,805 2,808 1,005,167 3
El-Atf (CC) 6,605,410 5,284 1,293,514 5
West
Delta
Kafr El-Dawar (St) 4,251,006 3,401 1,431,214 3
Damanhour Ext. 300
(St) 988,268 791 302,884 3
Damanhour (St) 2,238,137 1,791 798,522 3
Damanhour (CC) 1,642,269 1,314 430,497 4
Abu Kir (St) 9,294,080 7,435 2,795,253 3
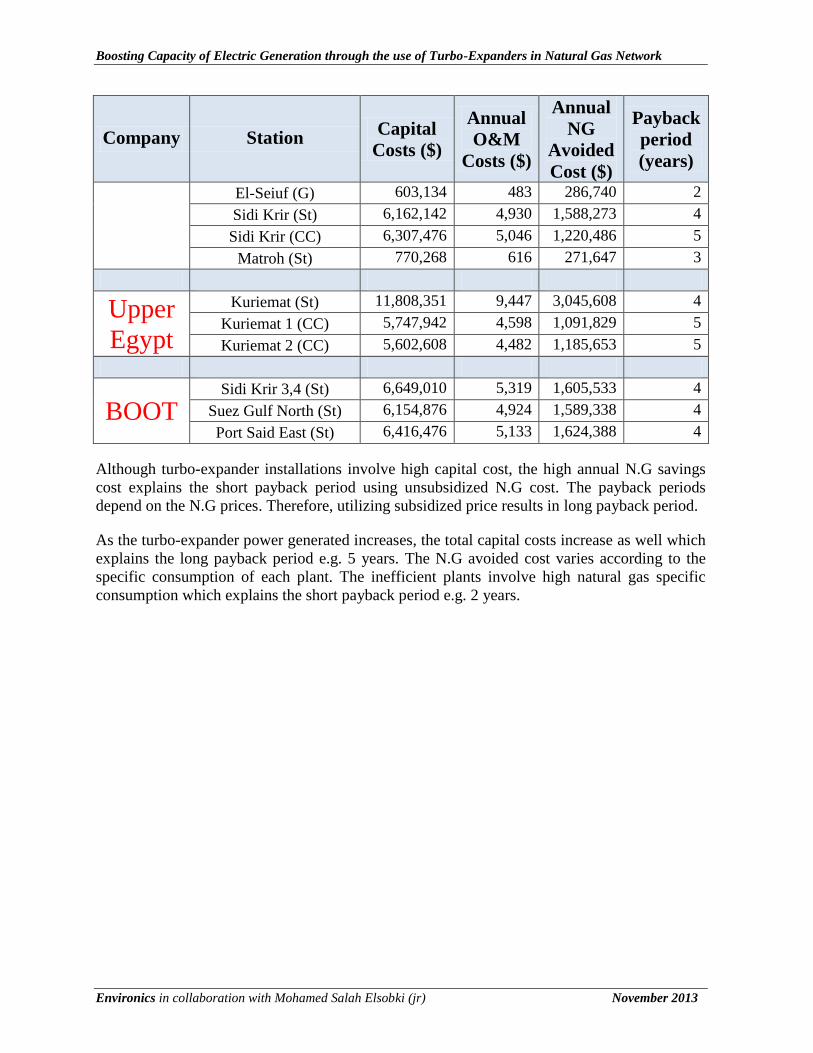
Boosting Capacity of Electric Generation through the use of Turbo-Expanders in Natural Gas Network
Environics in collaboration with Mohamed Salah Elsobki (jr) November 2013
Company Station Capital
Costs ($)
Annual
O&M
Costs ($)
Annual
NG
Avoided
Cost ($)
Payback
period
(years)
El-Seiuf (G) 603,134 483 286,740 2
Sidi Krir (St) 6,162,142 4,930 1,588,273 4
Sidi Krir (CC) 6,307,476 5,046 1,220,486 5
Matroh (St) 770,268 616 271,647 3
Upper
Egypt
Kuriemat (St) 11,808,351 9,447 3,045,608 4
Kuriemat 1 (CC) 5,747,942 4,598 1,091,829 5
Kuriemat 2 (CC) 5,602,608 4,482 1,185,653 5
BOOT
Sidi Krir 3,4 (St) 6,649,010 5,319 1,605,533 4
Suez Gulf North (St) 6,154,876 4,924 1,589,338 4
Port Said East (St) 6,416,476 5,133 1,624,388 4
Although turbo-expander installations involve high capital cost, the high annual N.G savings
cost explains the short payback period using unsubsidized N.G cost. The payback periods
depend on the N.G prices. Therefore, utilizing subsidized price results in long payback period.
As the turbo-expander power generated increases, the total capital costs increase as well which
explains the long payback period e.g. 5 years. The N.G avoided cost varies according to the
specific consumption of each plant. The inefficient plants involve high natural gas specific
consumption which explains the short payback period e.g. 2 years.

Boosting Capacity of Electric Generation through the use of Turbo-Expanders in Natural Gas Network
Environics in collaboration with Mohamed Salah Elsobki (jr) November 2013
The annualized cost of turbo-expander system is adopted using the following equation as the
sum of the system expenses which include capital costs over a lifetime associated with the
annual operating and maintenance costs. Table 5-2 demonstrates the total annual cost of turbo-
expander system.
Table 5-2 Turbo-Expander Annualized Total Cost
Company No. Station
T.Exp. Annual
Electricity
Generated
(GWh)
T.Exp. Total
Annualized
Cost ($)
Cairo
1 Shoubra El-Kheima (St) 36.84 394,615
2 Cairo West (St) 6.31 67,598
3 Cairo West Ext. (St) 42.65 456,876
4 Tebbin (St) 23.47 251,415
5 Cairo South I (CC) 17.13 183,521
6 Cairo South II (CC) 6.94 74,318
7 Cairo North (CC) 46.41 497,198
8 Wadi Hof (G) 1.36 14,528
9 6 October (G) 4.10 43,879
East
Delta
10 Ataka (St) 30.14 322,867
11 Abu Sultan (St) 26.43 283,139
12 Shabab (G) 1.08 11,563
13 Port Said (G) 0.64 6,819
14 EL-Arish (St) 2.60 27,869
15 Oyoun Mousa (St) 30.78 329,686
16 Damietta (CC) 40.21 430,786
17 New Gas Damietta (G) 21.20 227,104
18 New Gas Shabab (G) 45.80 490,675
Middle
Delta
19 Talkha (CC) 11.13 119,185
20 Talkha steam 210 (St) 14.81 158,617
21 Talkha 750 (CC) 15.91 170,476
22 Nubaria 1,2,3 (CC) 50.68 542,856
23 Mahmoudia (CC) 13.37 143,200
24 El-Atf (CC) 25.16 269,501

Boosting Capacity of Electric Generation through the use of Turbo-Expanders in Natural Gas Network
Environics in collaboration with Mohamed Salah Elsobki (jr) November 2013
Company No. Station
T.Exp. Annual
Electricity
Generated
(GWh)
T.Exp. Total
Annualized
Cost ($)
West
Delta
25 Kafr El-Dawar (St) 16.19 173,441
26 Damanhour Ext. 300 (St) 3.76 40,321
27 Damanhour (St) 8.52 91,316
28 Damanhour (CC) 6.25 67,005
29 Abu Kir (St) 35.40 379,198
30 El-Seiuf (G) 2.30 24,608
31 Sidi Krir (St) 23.47 251,415
32 Sidi Krir (CC) 24.02 257,345
33 Matroh (St) 2.93 31,427
Upper
Egypt
34 Kuriemat (St) 44.97 481,781
35 Kuriemat 1 (CC) 21.89 234,516
36 Kuriemat 2 (CC) 21.34 228,586
BOOT
37 Sidi Krir 3,4 (St) 25.32 271,280
38 Suez Gulf North (St) 23.44 251,119
39 Port Said East (St) 24.44 261,792
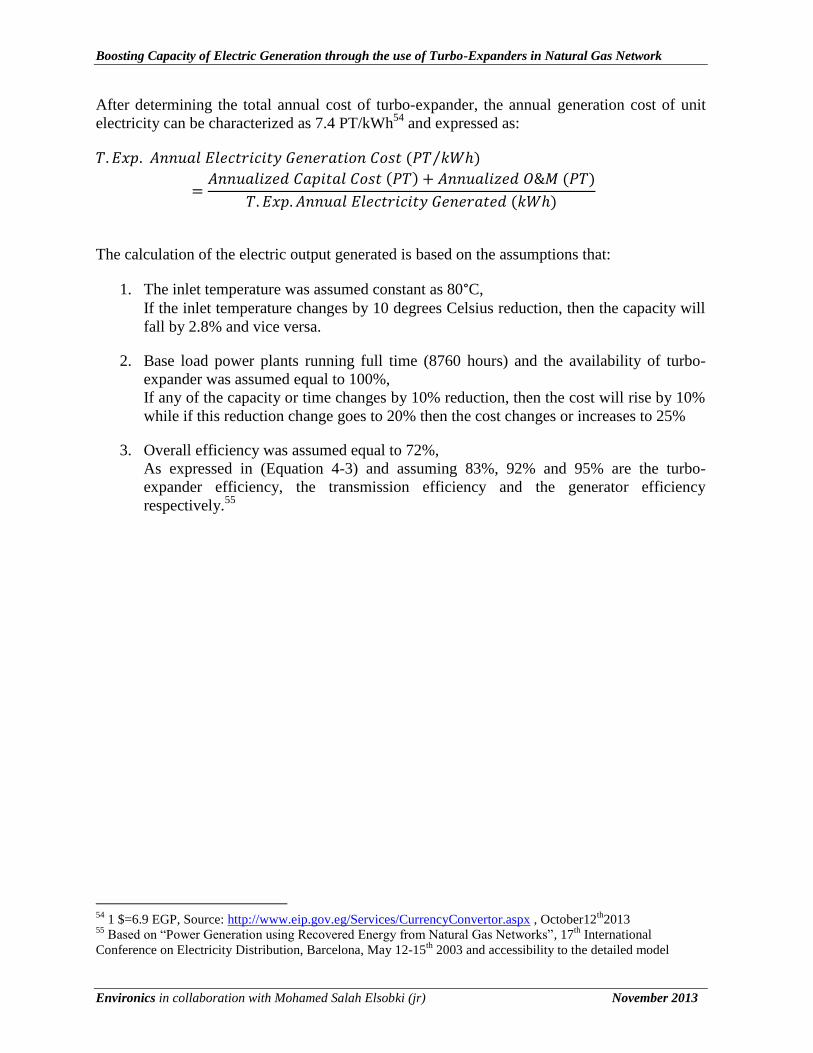
Boosting Capacity of Electric Generation through the use of Turbo-Expanders in Natural Gas Network
Environics in collaboration with Mohamed Salah Elsobki (jr) November 2013
After determining the total annual cost of turbo-expander, the annual generation cost of unit
electricity can be characterized as 7.4 PT/kWh54
and expressed as:
The calculation of the electric output generated is based on the assumptions that:
1. The inlet temperature was assumed constant as 80°C,
If the inlet temperature changes by 10 degrees Celsius reduction, then the capacity will
fall by 2.8% and vice versa.
2. Base load power plants running full time (8760 hours) and the availability of turbo-
expander was assumed equal to 100%,
If any of the capacity or time changes by 10% reduction, then the cost will rise by 10%
while if this reduction change goes to 20% then the cost changes or increases to 25%
3. Overall efficiency was assumed equal to 72%,
As expressed in (Equation 4-3) and assuming 83%, 92% and 95% are the turbo-
expander efficiency, the transmission efficiency and the generator efficiency
respectively.55
54
1 $=6.9 EGP, Source: http://www.eip.gov.eg/Services/CurrencyConvertor.aspx , October12th
2013 55
Based on “Power Generation using Recovered Energy from Natural Gas Networks”, 17th
International
Conference on Electricity Distribution, Barcelona, May 12-15th
2003 and accessibility to the detailed model

Boosting Capacity of Electric Generation through the use of Turbo-Expanders in Natural Gas Network
Environics in collaboration with Mohamed Salah Elsobki (jr) November 2013
5.3 Potential Profit Margin
The cost per kWh of the turbo-expander system is limited by the upper value shown in Table
5-3 which shows the average cost of energy from production stations. Thus, the system will be
feasible, if the turbo-expander generation cost of electricity is less than the values below.
Table 5-3 The Average Cost of Energy at Electricity Production Companies
Company No. Station
Cost of Service at that Station (2011/2012)
(PT/kWh)
With Subsidized
Price of N.G 56
With Unsubsidized
Price of N.G
Cairo
1 Shoubra El-Kheima (St) 13.52 29.20
2 Cairo West (St) 24.72 53.40
3 Cairo West Ext. (St) 24.72 53.40
4 Tebbin (St) 23.85 51.52
5 Cairo South I (CC) 14.25 30.78
6 Cairo South II (CC) 14.25 30.78
7 Cairo North (CC) 11.95 25.81
8 Wadi Hof (G) 23.16 50.03
9 6 October (G) 46.71 100.89
East Delta
10 Ataka (St) 14.91 32.21
11 Abu Sultan (St) 13.00 28.08
12 Shabab (G) 32.47 70.14
13 Port Said (G) 30.66 66.23
14 EL-Arish (St) 45.53 98.34
15 Oyoun Mousa (St) 14.14 30.54
16 Damietta (CC) 13.17 28.45
17 New Gas Damietta (G) 14.02 30.28
18 New Gas Shabab (G) 17.81 38.47
Middle
Delta
19 Talkha (CC) 9.52 20.56
20 Talkha steam 210 (St) 18.09 39.07
21 Talkha 750 (CC) 15.82 34.17
22 Nubaria 1,2,3 (CC) 18.07 39.03
23 Mahmoudia (CC) 14.26 30.80
24 El-Atf (CC) 17.78 38.40
56
“The Cost of Electricity Production, Transmission and Distribution Report, 2011/2012”, Egyptian Electric
Utility and Consumer Protection Regulatory Agency (EgyptERA)
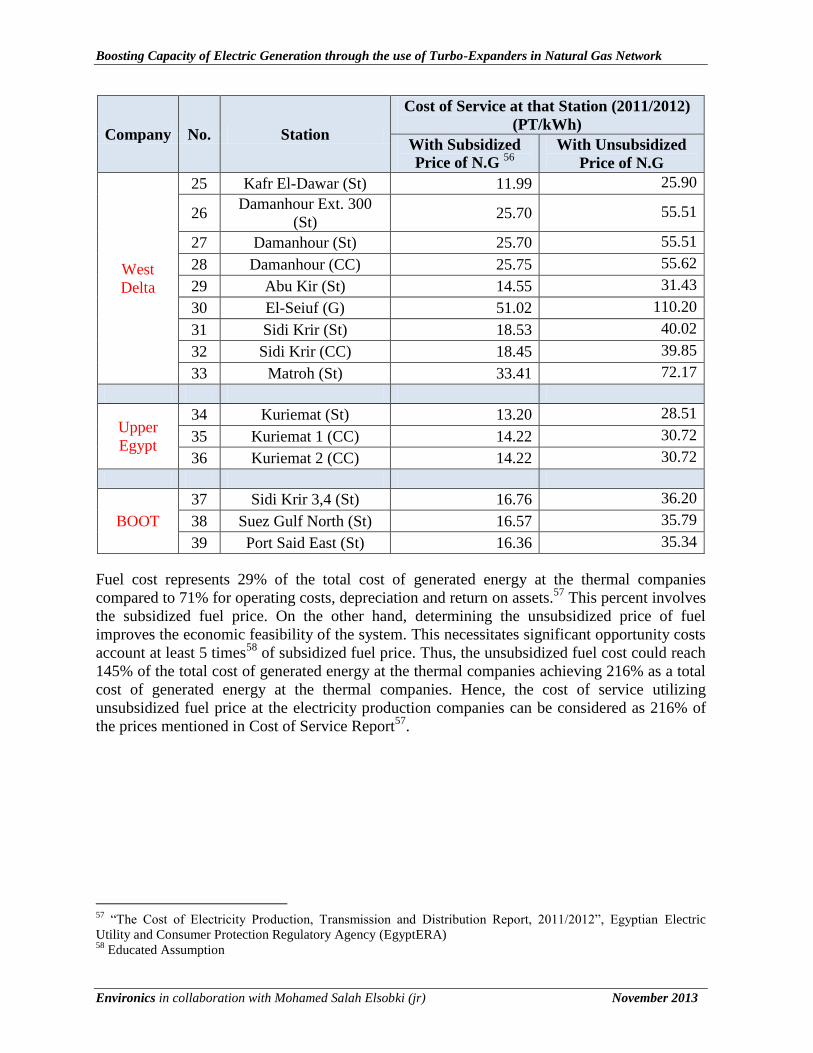
Boosting Capacity of Electric Generation through the use of Turbo-Expanders in Natural Gas Network
Environics in collaboration with Mohamed Salah Elsobki (jr) November 2013
Company No. Station
Cost of Service at that Station (2011/2012)
(PT/kWh)
With Subsidized
Price of N.G 56
With Unsubsidized
Price of N.G
West
Delta
25 Kafr El-Dawar (St) 11.99 25.90
26 Damanhour Ext. 300
(St) 25.70 55.51
27 Damanhour (St) 25.70 55.51
28 Damanhour (CC) 25.75 55.62
29 Abu Kir (St) 14.55 31.43
30 El-Seiuf (G) 51.02 110.20
31 Sidi Krir (St) 18.53 40.02
32 Sidi Krir (CC) 18.45 39.85
33 Matroh (St) 33.41 72.17
Upper
Egypt
34 Kuriemat (St) 13.20 28.51
35 Kuriemat 1 (CC) 14.22 30.72
36 Kuriemat 2 (CC) 14.22 30.72
BOOT
37 Sidi Krir 3,4 (St) 16.76 36.20
38 Suez Gulf North (St) 16.57 35.79
39 Port Said East (St) 16.36 35.34
Fuel cost represents 29% of the total cost of generated energy at the thermal companies
compared to 71% for operating costs, depreciation and return on assets.57
This percent involves
the subsidized fuel price. On the other hand, determining the unsubsidized price of fuel
improves the economic feasibility of the system. This necessitates significant opportunity costs
account at least 5 times58
of subsidized fuel price. Thus, the unsubsidized fuel cost could reach
145% of the total cost of generated energy at the thermal companies achieving 216% as a total
cost of generated energy at the thermal companies. Hence, the cost of service utilizing
unsubsidized fuel price at the electricity production companies can be considered as 216% of
the prices mentioned in Cost of Service Report57
.
57
“The Cost of Electricity Production, Transmission and Distribution Report, 2011/2012”, Egyptian Electric
Utility and Consumer Protection Regulatory Agency (EgyptERA) 58
Educated Assumption

Boosting Capacity of Electric Generation through the use of Turbo-Expanders in Natural Gas Network
Environics in collaboration with Mohamed Salah Elsobki (jr) November 2013
Sale prices to an electric utility can be considered up to 99% of the average cost of electricity
from power plants in accordance with the subsidized fuel price. Assuming 90% of the average
cost of electricity and subtract turbo-expander generation cost (7.4 PT/kWh) from this value
results in varies widely profit.
As mentioned before, the cost of service utilizing unsubsidized fuel price at the electricity
production companies is considered as 216% of the average cost of electricity from power
plants. Subtracting turbo-expander generation cost (7.4 PT/kWh) from this value results in the
annual profit in the unsubsidized case.
Table 5-4 Capital Cost of Turbo-Expander versus the Annual Profit
Company Station
Capital
Cost
(Mio
EGP)
Subsidized Unsubsidized
Annual
Profit
(Thousand
EGP)
Payback
period
(years)
Annual
Profit
(Thousand
EGP)
Payback
period
(years)
Cairo
Shoubra El-Kheima
(St) 67 1,756 38 8,032 8
Cairo West (St) 11 937 12 2,902 4
Cairo West Ext. (St) 77 6,333 12 19,617 4
Tebbin (St) 43 3,301 13 10,354 4
Cairo South I (CC) 31 929 33 4,005 8
Cairo South II (CC) 13 376 33 1,622 8
Cairo North (CC) 84 1,557 54 8,546 10
Wadi Hof (G) 2 182 13 578 4
6 October (G) 7 1,419 5 3,830 2
East Delta
Ataka (St) 55 1,814 30 7,476 7
Abu Sultan (St) 48 1,137 42 5,466 9
Shabab (G) 2 236 8 677 3
Port Said (G) 1 129 9 374 3
EL-Arish (St) 5 874 5 2,366 2
Oyoun Mousa (St) 56 1,639 34 7,122 8
Damietta (CC) 73 1,791 41 8,464 9
New Gas Damietta
(G) 38 1,106 35 4,851 8
New Gas Shabab
(G) 83 3,952 21 14,231 6
Middle
Delta
Talkha (CC) 20 130 155 1,465 14
Talkha steam 210 27 1,315 20 4,690 6

Boosting Capacity of Electric Generation through the use of Turbo-Expanders in Natural Gas Network
Environics in collaboration with Mohamed Salah Elsobki (jr) November 2013
Company Station
Capital
Cost
(Mio
EGP)
Subsidized Unsubsidized
Annual
Profit
(Thousand
EGP)
Payback
period
(years)
Annual
Profit
(Thousand
EGP)
Payback
period
(years)
(St)
Talkha 750 (CC) 29 1,088 27 4,260 7
Nubaria 1,2,3 (CC) 92 4,491 20 16,029 6
Mahmoudia (CC) 24 726 33 3,128 8
El-Atf (CC) 46 2,164 21 7,800 6
West
Delta
Kafr El-Dawar (St) 29 549 53 2,995 10
Damanhour Ext. 300
(St) 7 592 12 1,811 4
Damanhour (St) 15 1,341 12 4,101 4
Damanhour (CC) 11 987 11 3,016 4
Abu Kir (St) 64 2,016 32 8,506 8
El-Seiuf (G) 4 885 5 2,362 2
Sidi Krir (St) 43 2,177 20 7,657 6
Sidi Krir (CC) 44 2,211 20 7,796 6
Matroh (St) 5 665 8 1,900 3
Upper
Egypt
Kuriemat (St) 82 2,015 40 9,495 9
Kuriemat 1 (CC) 40 1,182 34 5,104 8
Kuriemat 2 (CC) 39 1,152 34 4,975 8
BOOT
Sidi Krir 3,4 (St) 46 1,946 24 7,294 6
Suez Gulf North (St) 43 1,761 24 6,655 6
Port Said East (St) 44 1,790 25 6,828 6

Boosting Capacity of Electric Generation through the use of Turbo-Expanders in Natural Gas Network
Environics in collaboration with Mohamed Salah Elsobki (jr) November 2013
6 Assessment of Operating the Proposed Units in Parallel with
the Existing Electricity Systems
When the turbo-expander is installed parallel to the throttling valve in a PRS, the pressure
reduction is only achieved by the turbo-expander. The throttling valve is only used during the
maintenance of the expander. The use of the turbo-expander shows more reliability and it does
not affect the performance of the pressure reduction station under different operating
conditions. The turbo-expander is used to drive an electric generator which either is
interconnected with the electricity grid or can be synchronized with the power plant existing
generator. The additional generator (drive by turbo-expander) will be connected to operate in
parallel with each other and supply power to the same load.
Synchronization is the process of connecting a generator to anther generator or to power grid.
This process is carried out in order to parallel a generator onto a live bus-bar, either with
multiple generator sets as the only supply, or to the utility. Three major advantages for
operating synchronous generators in parallel are:
1. The reliability of the power system increases when many generators are operating in
parallel, because the failure of any one of them does not cause a total power loss to the
loads.
2. When many generators operate in parallel, one or more of them can be taken out when
failures occur in power plants or for preventive maintenance.
3. If one generator is used, it cannot operate near full load (because the loads are
changing), then it will be inefficient. When several machines are operating in parallel, it
is possible to operate only a fraction of them. The ones that are operating will be more
efficient because they are near full load.
Generally, four essential paralleling conditions must be met to ensure perfect synchronization:
1. Their terminal voltage must be the same (Voltage magnitude of the two generators shall
be nearly equal within tolerance ),
The stator line voltage must be equal to the line voltage of the power grid. This is
achieved by controlling the rotor current (excitation).
2. Their frequencies must be the same (frequency of the two voltage sources shall be
equal within tolerance ),
The synchronous generator must be driven by the prime mover at a speed such that the
stator frequency is equal to the bus-bas frequency.
3. Their phase sequence must be the same (phase angle of the two generators shall be
equal within tolerance),
The phase sequence of the synchronous generator must be the same as the phase
sequence of the bus-bas.
4. No phase shift,
The phase angle of the synchronous generator must be equal to the phase angle of the
bus-bas.
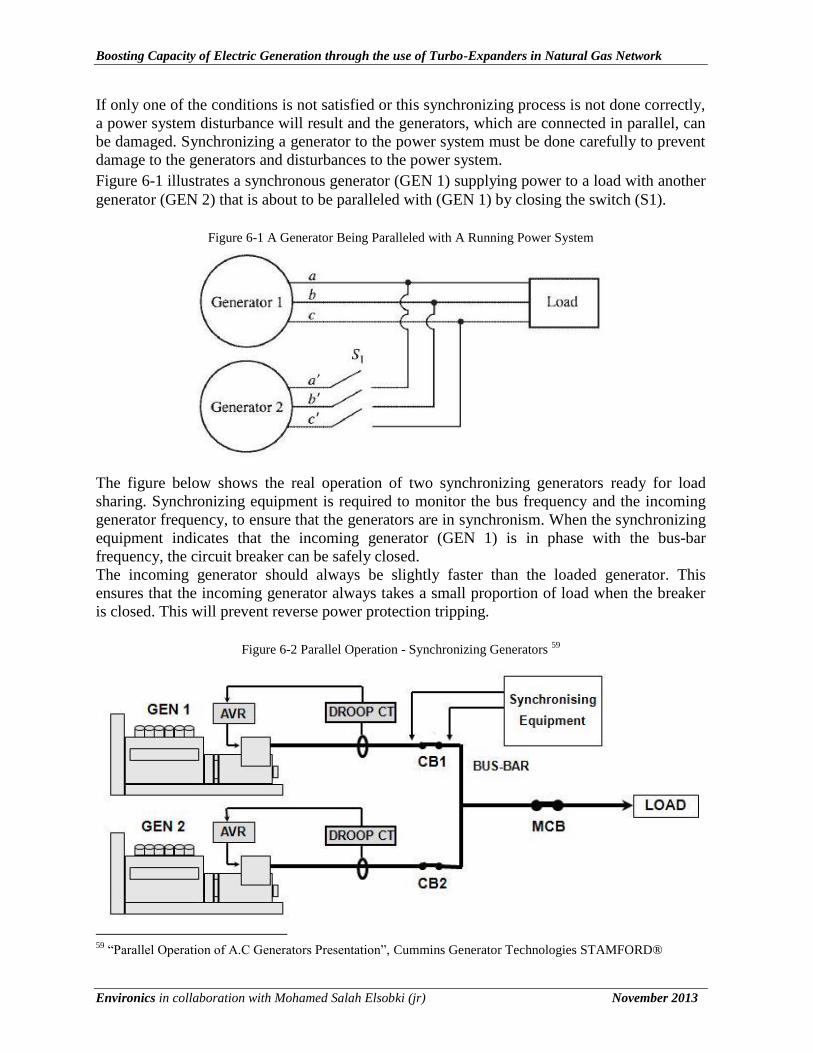
Boosting Capacity of Electric Generation through the use of Turbo-Expanders in Natural Gas Network
Environics in collaboration with Mohamed Salah Elsobki (jr) November 2013
If only one of the conditions is not satisfied or this synchronizing process is not done correctly,
a power system disturbance will result and the generators, which are connected in parallel, can
be damaged. Synchronizing a generator to the power system must be done carefully to prevent
damage to the generators and disturbances to the power system.
Figure 6-1 illustrates a synchronous generator (GEN 1) supplying power to a load with another
generator (GEN 2) that is about to be paralleled with (GEN 1) by closing the switch (S1).
Figure 6-1 A Generator Being Paralleled with A Running Power System
The figure below shows the real operation of two synchronizing generators ready for load
sharing. Synchronizing equipment is required to monitor the bus frequency and the incoming
generator frequency, to ensure that the generators are in synchronism. When the synchronizing
equipment indicates that the incoming generator (GEN 1) is in phase with the bus-bar
frequency, the circuit breaker can be safely closed.
The incoming generator should always be slightly faster than the loaded generator. This
ensures that the incoming generator always takes a small proportion of load when the breaker
is closed. This will prevent reverse power protection tripping.
Figure 6-2 Parallel Operation - Synchronizing Generators 59
59
“Parallel Operation of A.C Generators Presentation”, Cummins Generator Technologies STAMFORD®
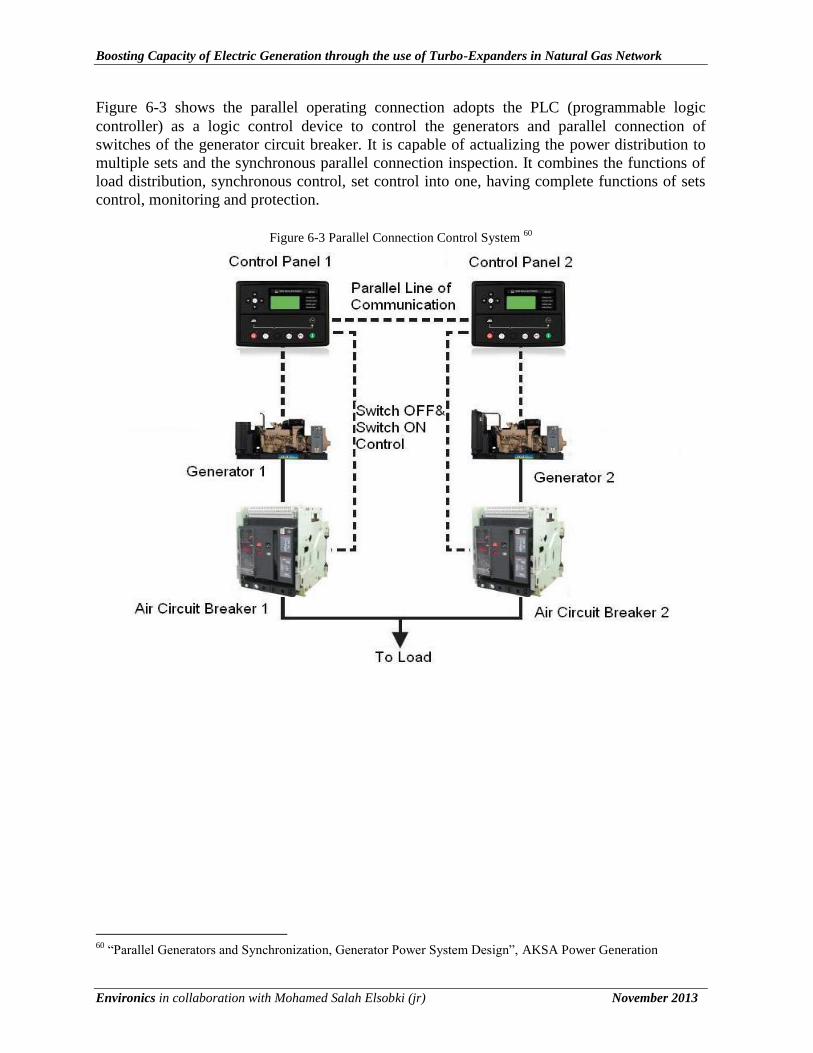
Boosting Capacity of Electric Generation through the use of Turbo-Expanders in Natural Gas Network
Environics in collaboration with Mohamed Salah Elsobki (jr) November 2013
Figure 6-3 shows the parallel operating connection adopts the PLC (programmable logic
controller) as a logic control device to control the generators and parallel connection of
switches of the generator circuit breaker. It is capable of actualizing the power distribution to
multiple sets and the synchronous parallel connection inspection. It combines the functions of
load distribution, synchronous control, set control into one, having complete functions of sets
control, monitoring and protection.
Figure 6-3 Parallel Connection Control System 60
60
“Parallel Generators and Synchronization, Generator Power System Design”, AKSA Power Generation

Boosting Capacity of Electric Generation through the use of Turbo-Expanders in Natural Gas Network
Environics in collaboration with Mohamed Salah Elsobki (jr) November 2013
7 The Current Institutional Setup and Relevant National
Legislations
7.1 Description of the Electricity Market Structure
The Ministry of Electricity and Energy (MoEE) is responsible for looking after the current
electricity market, through its:
Heading the board of directors of the electric regulatory agency by the Minster of
Electricity and Energy.
Semi/direct involvement in managing all the state owned utilities.
The current electricity market in Egypt is mainly composed of:
State owned utilities:
o Seven generation entities:
five thermal generation companies (covering around 81% of the generation)
one hydropower (covering around 8% of the generation) and,
one wind (covering around 1% of the generation)
o One transmission company and
o Nine distribution companies
Three Build Own Operate and Transfer (BOOT) projects (covering around 10% of the
generation).
A limited number of small isolated and/or semi connected Independent Service Providers
(ISP) (currently at the end of 2013; the number is 15 generation utilities and 24
distribution utilities); these ISP cover less than 0.5% of the electricity market so far, their
share is growing.
Figure 7-1 shows the current structure of the electricity market in Egypt which started in 2001.
The state utilities as well as the three BOOT projects currently operates under a single buyer
model, while the private sector ones operate under a competitive conditions.
Figure 7-1 Current Electricity Market in Egypt

Boosting Capacity of Electric Generation through the use of Turbo-Expanders in Natural Gas Network
Environics in collaboration with Mohamed Salah Elsobki (jr) November 2013
The arrows in figure 7.1 represent the flow of electricity (solid ones reflects actual agreements
while the doted ones reflects possible agreements which are not there). ISP are either
generating electricity and selling at the medium and low voltage levels, or buying bulk electric
energy and distributing that. It is also possible for ISP to sell electricity directly to any type of
customers at any voltage level, but this is not exercised at the Ultra High Voltage (UHV) and
High Voltage (HV) levels, mainly due to price competition with government owned utilities.

Boosting Capacity of Electric Generation through the use of Turbo-Expanders in Natural Gas Network
Environics in collaboration with Mohamed Salah Elsobki (jr) November 2013
8 Expected Roles for the Different Stakeholders including
Owners of the NG Networks and Pressure Reduction Stations In view of the current prevailing legislations that are governing the electricity market in Egypt
as well as both the investment and technical requirements needed the following would be
consider. The turbo expander location will be within the gas pressure reduction station; that
implies that its operation would be conducted by the staff of the PRS. On the other hand the
ownership of the turbo expander can be assumed by one of the following:
a) The owner of the PRS
b) An investor
c) The generation utility
In cases a) or b) the generated electricity would be sold to the generation utility at prices less
than its cost of production as indicated in section 5 of this study. In the third case c) the
generated electricity will be part of the overall generated electricity from the power station, but
at a less cost than the one being generated form the power station.

Boosting Capacity of Electric Generation through the use of Turbo-Expanders in Natural Gas Network
Environics in collaboration with Mohamed Salah Elsobki (jr) November 2013
Annexes
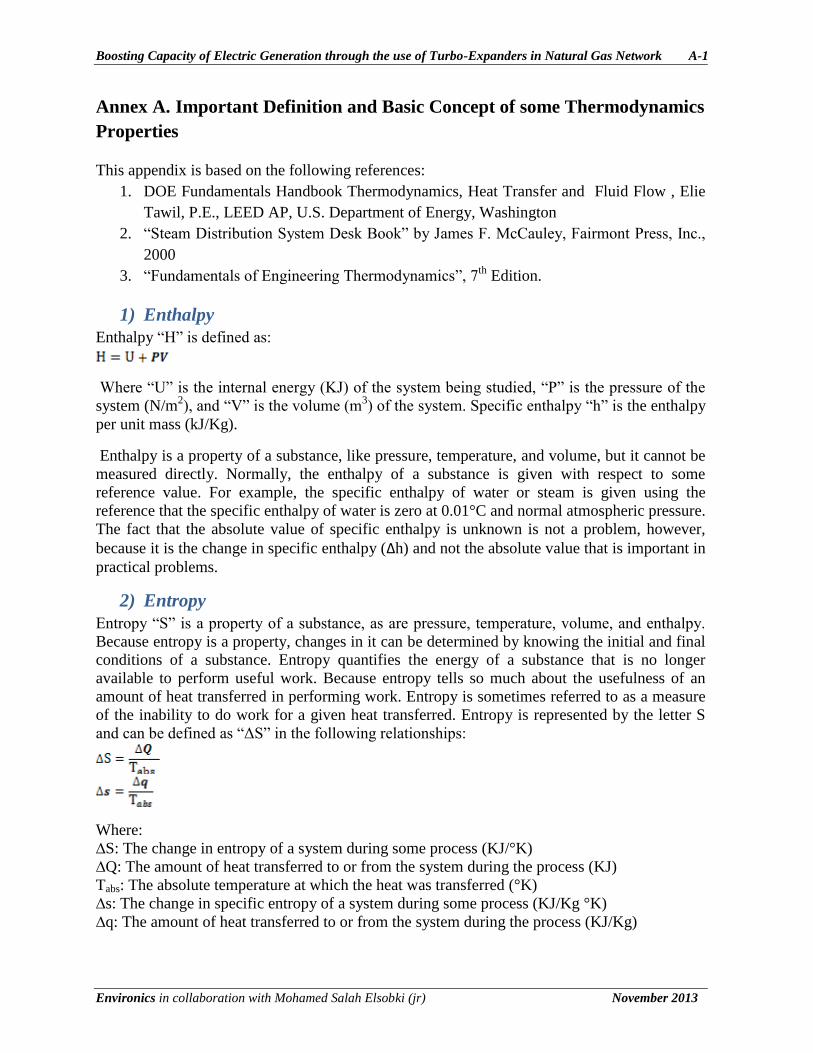
Boosting Capacity of Electric Generation through the use of Turbo-Expanders in Natural Gas Network A-1
Environics in collaboration with Mohamed Salah Elsobki (jr) November 2013
Annex A. Important Definition and Basic Concept of some Thermodynamics
Properties
This appendix is based on the following references:
1. DOE Fundamentals Handbook Thermodynamics, Heat Transfer and Fluid Flow , Elie
Tawil, P.E., LEED AP, U.S. Department of Energy, Washington
2. “Steam Distribution System Desk Book” by James F. McCauley, Fairmont Press, Inc.,
2000
3. “Fundamentals of Engineering Thermodynamics”, 7th
Edition.
1) Enthalpy
Enthalpy “H” is defined as:
Where “U” is the internal energy (KJ) of the system being studied, “P” is the pressure of the
system (N/m2), and “V” is the volume (m
3) of the system. Specific enthalpy “h” is the enthalpy
per unit mass (kJ/Kg).
Enthalpy is a property of a substance, like pressure, temperature, and volume, but it cannot be
measured directly. Normally, the enthalpy of a substance is given with respect to some
reference value. For example, the specific enthalpy of water or steam is given using the
reference that the specific enthalpy of water is zero at 0.01°C and normal atmospheric pressure.
The fact that the absolute value of specific enthalpy is unknown is not a problem, however,
because it is the change in specific enthalpy (∆h) and not the absolute value that is important in
practical problems.
2) Entropy
Entropy “S” is a property of a substance, as are pressure, temperature, volume, and enthalpy.
Because entropy is a property, changes in it can be determined by knowing the initial and final
conditions of a substance. Entropy quantifies the energy of a substance that is no longer
available to perform useful work. Because entropy tells so much about the usefulness of an
amount of heat transferred in performing work. Entropy is sometimes referred to as a measure
of the inability to do work for a given heat transferred. Entropy is represented by the letter S
and can be defined as “ΔS” in the following relationships:
Where:
∆S: The change in entropy of a system during some process (KJ/°K)
∆Q: The amount of heat transferred to or from the system during the process (KJ)
Tabs: The absolute temperature at which the heat was transferred (°K) ∆s: The change in specific entropy of a system during some process (KJ/Kg °K)
∆q: The amount of heat transferred to or from the system during the process (KJ/Kg)

Boosting Capacity of Electric Generation through the use of Turbo-Expanders in Natural Gas Network A-2
Environics in collaboration with Mohamed Salah Elsobki (jr) November 2013
Like enthalpy, entropy cannot be measured directly. Also, like enthalpy, the entropy of a
substance is given with respect to some reference value. For example, the specific entropy of
water or steam is given using the reference that the specific entropy of water is zero at 32 °F
(zero °K). The fact that the absolute value of specific entropy is unknown is not a problem
because it is the change in specific entropy “∆s” and not the absolute value that is important in
practical problems.
3) Reversible Process
A reversible process for a system is defined as a process that, once having taken place, can be
reversed, and in so doing leaves no change in either the system or surroundings. In other words
the system and surroundings are returned to their original condition before the process took
place.
In reality, there are no truly reversible processes; however, for analysis purposes, one uses
reversible to make the analysis simpler, and to determine maximum theoretical efficiencies.
Therefore, the reversible process is an appropriate starting point on which to base engineering
study and calculation. Although the reversible process can be approximated, it can never be
matched by real processes.
4) Irreversible Process
An irreversible process is a process that cannot return both the system and the surroundings to
their original conditions. That is, the system and the surroundings would not return to their
original conditions if the process was reversed. For example, an automobile engine does not
give back the fuel it took to drive up a hill as it coasts back down the hill.
There are many factors that make a process irreversible. Four of the most common causes of
irreversibility are friction, unrestrained expansion of a fluid, heat transfer through a finite
temperature difference, and mixing of two different substances.
Finally, a process is called irreversible if the system and all parts of its surroundings cannot be
exactly restored to their respective initial states after the process has occurred. A process is
reversible if both the system and surroundings can be returned to their initial states.
5) Adiabatic Process
An adiabatic process is one in which there is no heat transfer into or out of the system. The
system can be considered to be perfectly insulated (q=zero).
6) Isentropic Process
An isentropic process is one in which the entropy of the fluid remains constant. This will be
true if the process the system goes through is reversible and adiabatic. An isentropic process
can also be called a constant entropy process.
In an isentropic or constant entropy expansion, work is extracted during the expansion,
removing energy from the gas and resulting in a lower temperature of the expanded gas. The
figure below shows states having the same value of specific entropy.
Figure A-1 T–s and h–s Diagrams
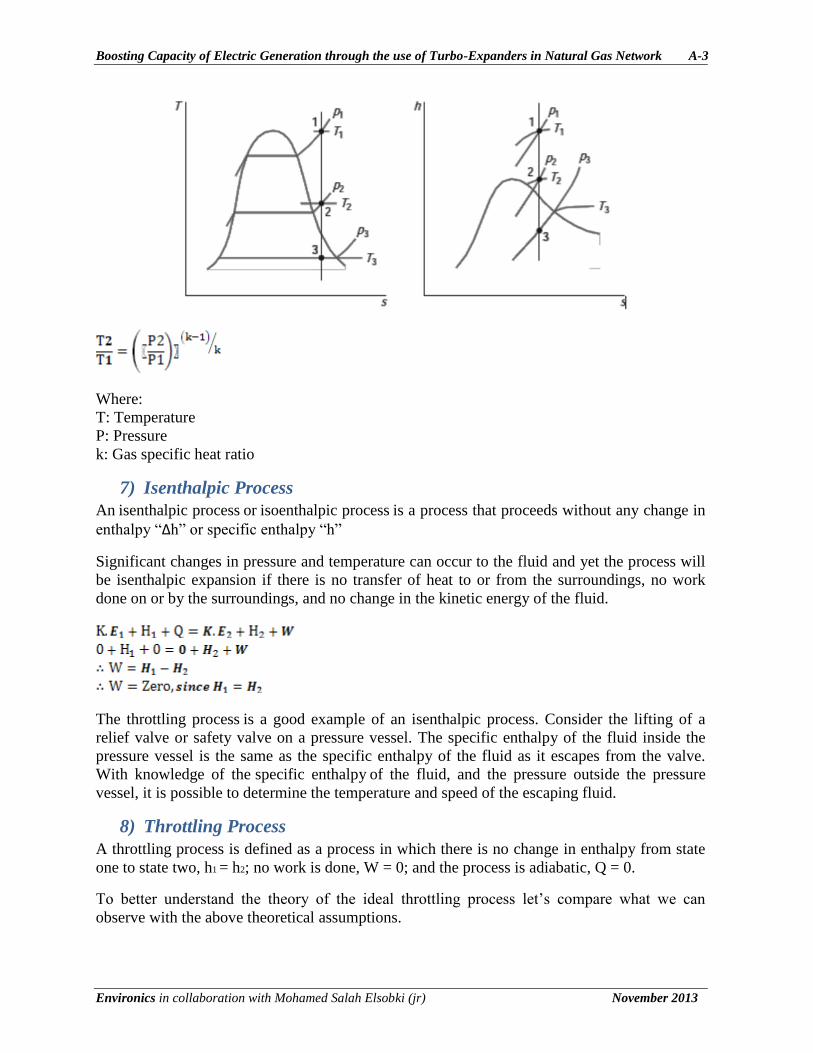
Boosting Capacity of Electric Generation through the use of Turbo-Expanders in Natural Gas Network A-3
Environics in collaboration with Mohamed Salah Elsobki (jr) November 2013
Where:
T: Temperature
P: Pressure
k: Gas specific heat ratio
7) Isenthalpic Process
An isenthalpic process or isoenthalpic process is a process that proceeds without any change in
enthalpy “∆h” or specific enthalpy “h”
Significant changes in pressure and temperature can occur to the fluid and yet the process will
be isenthalpic expansion if there is no transfer of heat to or from the surroundings, no work
done on or by the surroundings, and no change in the kinetic energy of the fluid.
The throttling process is a good example of an isenthalpic process. Consider the lifting of a
relief valve or safety valve on a pressure vessel. The specific enthalpy of the fluid inside the
pressure vessel is the same as the specific enthalpy of the fluid as it escapes from the valve.
With knowledge of the specific enthalpy of the fluid, and the pressure outside the pressure
vessel, it is possible to determine the temperature and speed of the escaping fluid.
8) Throttling Process
A throttling process is defined as a process in which there is no change in enthalpy from state
one to state two, h1 = h2; no work is done, W = 0; and the process is adiabatic, Q = 0.
To better understand the theory of the ideal throttling process let’s compare what we can
observe with the above theoretical assumptions.

Boosting Capacity of Electric Generation through the use of Turbo-Expanders in Natural Gas Network A-4
Environics in collaboration with Mohamed Salah Elsobki (jr) November 2013
The theory that hin = hout was confirmed. Remember h = u + Pv (v = specific volume), so if
pressure decreases then specific volume must increase if enthalpy is to remain constant
(assuming “u” is constant). Because mass flow is constant, the change in specific volume is
observed as an increase in gas velocity, and this is verified by our observations. The change in
velocity can be neglected as it is usually observed to be small.
The theory also states W = 0, clearly no work has been done by the throttling process. Finally,
the theory states that an ideal throttling process is adiabatic. This cannot clearly be proven by
observation since a real throttling process is not ideal and will have some heat transfer.
The purpose of throttling a gas is to reduce it from higher pressure to a lower pressure to
produce a substance in a more usable form. In theory this can be done at 100 percent
efficiency. However, the throttling process is extremely inefficient. In most cases so much so
that in reality when attempting to throttle the flow of a substance often times the process
approaches isentropic. See below.
Figure 8-2 Pressure Reducing Processes
What usually happens is that with the expansion of the gas from a higher pressure to a lower
pressure there is a cooling effect causing a change in “Q”. However, useful work is not
performed since the throttle in itself cannot convert heat energy to mechanical energy.
Therefore, a more profitable means of reducing the pressure of a gas is to expand it through a
turbine or other type of engine. By doing so, the lower pressure is attained while producing
mechanical work.

Boosting Capacity of Electric Generation through the use of Turbo-Expanders in Natural Gas Network A-5
Environics in collaboration with Mohamed Salah Elsobki (jr) November 2013
Consider Error! Reference source not found. and Error! Reference source not found., a
reducing valve and a turbine, respectively. In the reducing valve, Error! Reference source not
found., there is a large quantity of rejected heat while reducing the pressure from P1 to P2. In
the turbine, Error! Reference source not found., where the machine can be thoroughly
insulated, the rejected heat is negligible. Also the gas can be expanded isentropically from P1
to P2 and produce useful mechanical work in the rotating shaft of the turbine at the same time.
Figure 8-3 Throttle on Pressure Reducing Valve
Figure A-4 Turbine used as a Pressure Reducing Machine
Figure 8-5 Expansion of a Gas
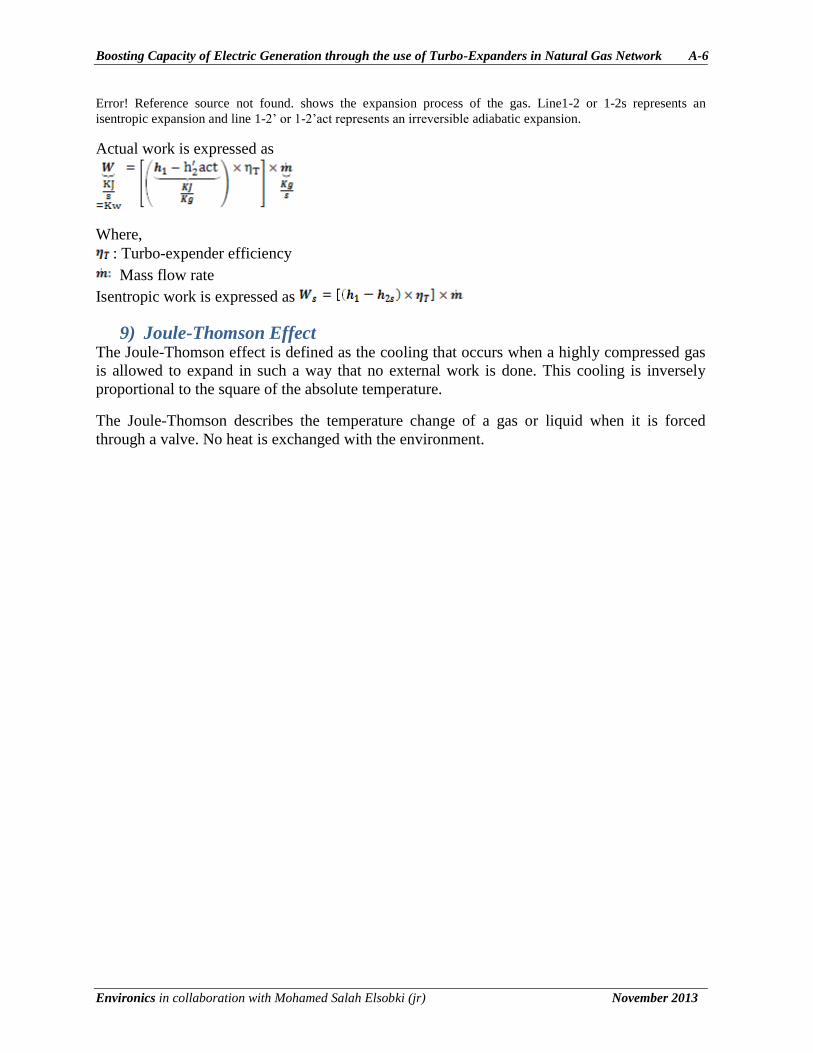
Boosting Capacity of Electric Generation through the use of Turbo-Expanders in Natural Gas Network A-6
Environics in collaboration with Mohamed Salah Elsobki (jr) November 2013
Error! Reference source not found. shows the expansion process of the gas. Line1-2 or 1-2s represents an
isentropic expansion and line 1-2’ or 1-2’act represents an irreversible adiabatic expansion.
Actual work is expressed as
Where,
: Turbo-expender efficiency
Mass flow rate
Isentropic work is expressed as
9) Joule-Thomson Effect The Joule-Thomson effect is defined as the cooling that occurs when a highly compressed gas
is allowed to expand in such a way that no external work is done. This cooling is inversely
proportional to the square of the absolute temperature.
The Joule-Thomson describes the temperature change of a gas or liquid when it is forced
through a valve. No heat is exchanged with the environment.

Boosting Capacity of Electric Generation through the use of Turbo-Expanders in Natural Gas Network B-1
Environics in collaboration with Mohamed Salah Elsobki (jr) November 2013
Annex B. Evaluating the Potential of Electricity Generation from Industrial
and Residential Sector
Based on published data and information on61
:
Natural gas consumption by different economic sectors e.g. electricity, industrial gas main
consumers such as fertilizer, cement, iron & steel, petroleum, residential in addition to
transport.
Characteristic data and information of some PRSs in Egypt and some other countries that
include natural gas flow rate, pressure of inlet and outlet gas as presented in Error!
Reference source not found..
Error! Reference source not found. illustrate the level of electricity that could be produced
from turbo expanders at different natural gas flow rates and pressure reduction ratios as
presented before.
PRS’ natural gas flow, inlet and outlet pressure at different consumers.
The level of electricity to be generated from turbo expanders at different locations of PRSs has
been estimated. The following section presents the detailed assumptions, calculations and
results of estimating electricity generation using turbo expanders at different natural gas
consumers based on the previous mentioned data and information.
As previously mentioned, for estimating the potential of electricity generation from natural gas
pressure reduction in the national grid using the turbo expanders instead of conventional
throttling valves the following assumptions have been considered:
Natural gas consumption by different economic sectors for the year 2010/2011.
Average pressure of natural gas at different points or locations of the whole gas
chain is as shown in Error! Reference source not found. and Figure 1-9 given before.
Table 8-1 Assumed Inlet and Outlet Pressures at PRS for Different Natural Gas Consumers
Location/ Sector P
(bars) Pi Po PR
Producing wells 100
Treatment & conditioning facilities 70
High pressure gas transmission lines 70
Medium pressure gas transmission lines 40
Low pressure gas transmission lines 20
PRS at HP industrial plants (cement, fertilizer and iron &
steel). 70 20 3.5
PRS at MP industrial plants (refractory, textile, food, etc.). 40 8 5
PRS at LP industrial plants 20 4 5
61
Letters were sent to the Chairmen of both the Egyptian Natural Gas Holding company EGAS and the Egyptian
Natural Gas company GASCO on February 27, 2013. A copy of the letter is presented in 0. In addition, a meeting
with some of GASCO staff responsible for natural gas network activities was done on early March 2013.
However, the team responsible for performing the study did not receive the data requested.

Boosting Capacity of Electric Generation through the use of Turbo-Expanders in Natural Gas Network B-2
Environics in collaboration with Mohamed Salah Elsobki (jr) November 2013
PRS at residential & commercial sectors 20 4 5
Where, P: pressure; Pi: inlet pressure; Po: outlet pressure; PR: pressure reduction ratio; HP:
high pressure; MP: Medium Pressure; LP: Low Pressure.
Industrial Plants Only main energy intensive industrial facilities; mainly cement, fertilizer and iron & steel have
been considered for estimating the potential of electricity generation as a result of natural gas
pressure reduction. Accordingly, total electricity potential is estimated at about 25 MW based
on natural gas flow rates and pressure levels at inlet and outlets points of the Pressure
Reduction Stations (PRS) at those plants.
Cement Plants
As shown in Error! Reference source not found., total capacity generation potential from
different cement plants as a result of utilizing turbo expanders is estimated at 8.7 MW based on
natural gas flow rates and pressure levels at inlet and outlets points of PRS at those plants.
Table 8-2 Total Expected Capacity Generation at Different Cement Plants Using Turbo-Expander
Sector Total
(MMCF/D) Pi Po PD PR
Estimated Capacity
Gen. (MW)
Torrah 25 70 20 50 3.5 0.80
Helwan 31 70 20 50 3.5 0.90
Alexandria 12 70 20 50 3.5 0.35
Kawmia 26 70 20 50 3.5 0.80
Suez 33 70 20 50 3.5 0.90
Assuit 32 70 20 50 3.5 0.90
America 29 70 20 50 3.5 0.90
Beni Sueif 10 70 20 50 3.5 0.35
Misr Beni Suief 11 70 20 50 3.5 0.35
Masria 54 70 20 50 3.5 1.50
Kena 11 70 20 50 3.5 0.35
Sinai (gray cement) 11 70 20 50 3.5 0.35
Sinai (white cement) 4 70 20 50 3.5 0.20
Menya (white cement) 2 70 20 50 3.5 062
Total 290 8.65
Fertilizer Plants
As shown in Error! Reference source not found., total electricity generation potential from
different fertilizer plants as a result of utilizing turbo expanders is estimated at 13 MW based
on natural gas flow rates and pressure levels at inlet and outlets points of the PRS at those
plants.
62
Very low flow rate

Boosting Capacity of Electric Generation through the use of Turbo-Expanders in Natural Gas Network B-3
Environics in collaboration with Mohamed Salah Elsobki (jr) November 2013
Table 8-3 Total Expected Capacity Generation at Different Fertilizer Plants
Sector Total
(MMCF/D) Pi Po PD PR
Estimated Capacity
Generation (MW)
Talkha (Delta) 80 70 20 50 3.5 2.40
Abu Qir 135 70 20 50 3.5 4.20
Suez 25 70 20 50 3.5 0.70
Alexandria 50 70 20 50 3.5 1.50
Masria (1& 2
plants) 90 70 20 50 3.5 2.70
Helwan 45 70 20 50 3.5 1.35
Total 425 13.02
Iron & Steel Plants
Only iron & steel plants with significant natural gas flow as shown in Error! Reference source
not found. have been considered in estimating the potential of electricity as a result of natural
gas pressure reduction. Accordingly; total capacity generation potential from iron & steel
plants as a result of utilizing turbo expanders is estimated at 3.8 MW based on natural gas flow
rates and pressure levels at inlet and outlets points of the PRS at those plants.
Table B-4 Total Expected Capacity Generation at Different Iron & Steel Plants
Sector Total
(MMCF/D) Pi Po PD PR
Estimated Capacity Generation
(MW)
EZZ
(Dekhila) 71 70 20 50 3.5 2.20
Beshaai 24 70 20 50 3.5 0.75
Attal 7 70 20 50 3.5 0.25
Kotta 11 70 20 50 3.5 0.30
Dawlia 9 70 20 50 3.5 0.30
Total 151 3.80
Other Natural Gas PRS
Based on the published data on some natural gas pressure reduction stations as shown from
Error! Reference source not found., the potential for electricity generation is estimated at about
24 MW.
Table 8-5 Estimated electricity production from some PRS
PRS Name Total
(MMCF/D) Pi Po PD PR
Estimated Power Generation
(MW)
Natgas 1 85 70 5 66 16 6.50

Boosting Capacity of Electric Generation through the use of Turbo-Expanders in Natural Gas Network B-4
Environics in collaboration with Mohamed Salah Elsobki (jr) November 2013
Natgas 2 85 55 5 51 12 6.00
Egypt Gas 170 70 40 30 2 3.50
TransGas 34 70 5 65 14 2.40
Nubaria Gas 271 70 27 43 3 5.15
Total 644 65 20 45 3 23.55

Boosting Capacity of Electric Generation through the use of Turbo-Expanders in Natural Gas Network C-1
Environics in collaboration with Mohamed Salah Elsobki (jr) November 2013
Annex C. Request Letters sent to EGAS and GASCO

Boosting Capacity of Electric Generation through the use of Turbo-Expanders in Natural Gas Network C-2
Environics in collaboration with Mohamed Salah Elsobki (jr) November 2013

Boosting Capacity of Electric Generation through the use of Turbo-Expanders in Natural Gas Network C-3
Environics in collaboration with Mohamed Salah Elsobki (jr) November 2013

Boosting Capacity of Electric Generation through the use of Turbo-Expanders in Natural Gas Network C-4
Environics in collaboration with Mohamed Salah Elsobki (jr) November 2013

Boosting Capacity of Electric Generation through the use of Turbo-Expanders in Natural Gas Network D-1
Environics in collaboration with Mohamed Salah Elsobki (jr) November 2013
Annex D. Units Conversion Tables
1) Decimal Multiples and Sub-Multiples
Name Symbol Equivalent Name Symbol Equivalent
Tera
Giga
Mega
kilo
hector
deca
T
G
M
k
h
-
1012
109
106
103
102
10
deci
centi
milli
micro
nano
pico
d
c
m
µ
n
p
10-1
10-2
10-3
10-6
10-9
10-12
2) Length Units
Millimeters Centimeters Meters Kilometers Inches Feet Yards Miles
mm cm m km in ft yd mi
1 0.1 0.001 0.000001 0.03937 0.003281 0.001094 6.21e-07
10 1 0.01 0.00001 0.393701 0.032808 0.010936 0.000006
1000 100 1 0.001 39.37008 3.28084 1.093613 0.000621
1000000 100000 1000 1 39370.08 3280.84 1093.613 0.621371
25.4 2.54 0.0254 0.000025 1 0.083333 0.027778 0.000016
304.8 30.48 0.3048 0.000305 12 1 0.333333 0.000189
914.4 91.44 0.9144 0.000914 36 3 1 0.000568
1609344 160934.4 1609.344 1.609344 63360 5280 1760 1
3) Area Units
Millimeter
square
Centimeter
square
Meter
square
Inch
square
Foot
square
Yard
square
mm2
cm2
m2
in2
ft2
yd2
1 0.01 0.000001 0.00155 0.000011 0.000001
100 1 0.0001 0.155 0.001076 0.00012
1000000 10000 1 1550.003 10.76391 1.19599
645.16 6.4516 0.000645 1 0.006944 0.000772
92903 929.0304 0.092903 144 1 0.111111
836127 8361.274 0.836127 1296 9 1
4) Volume Units
Centimeter
cube
Meter
cube Liter
Inch
cube
Foot
cube
US
gallons
Imperial
gallons
US
barrel
(oil)
cm3
m3
ltr in3
ft3
US gal Imp. gal US brl
1 0.000001 0.001 0.061024 0.000035 0.000264 0.00022 0.000006
1000000 1 1000 61024 35 264 220 6.29

Boosting Capacity of Electric Generation through the use of Turbo-Expanders in Natural Gas Network D-2
Environics in collaboration with Mohamed Salah Elsobki (jr) November 2013
1000 0.001 1 61 0.035 0.264201 0.22 0.00629
16.4 0.000016 0.016387 1 0.000579 0.004329 0.003605 0.000103
28317 0.028317 28.31685 1728 1 7.481333 6.229712 0.178127
3785 0.003785 3.79 231 0.13 1 0.832701 0.02381
4545 0.004545 4.55 277 0.16 1.20 1 0.028593
158970 0.15897 159 9701 6 42 35 1
5) Mass Units
Grams Kilograms Metric
tonnes Short ton Long ton Pounds Ounces
g kg tonne shton Lton lb oz
1 0.001 0.000001 0.000001 9.84e-07 0.002205 0.035273
1000 1 0.001 0.001102 0.000984 2.204586 35.27337
1000000 1000 1 1.102293 0.984252 2204.586 35273.37
907200 907.2 0.9072 1 0.892913 2000 32000
1016000 1016 1.016 1.119929 1 2239.859 35837.74
453.6 0.4536 0.000454 0.0005 0.000446 1 16
28 0.02835 0.000028 0.000031 0.000028 0.0625 1
6) Density Units
Gram/milliliter Kilogram/meter
cube Pound/foot cube Pound/inch cube
g/ml kg/m3
lb/ft3
lb/in3
1 1000 62.42197 0.036127
0.001 1 0.062422 0.000036
0.01602 16.02 1 0.000579
27.68 27680 1727.84 1
7) Volumetric Liquid Flow Units
Liter/second Liter/minute Meter
cube/hour
Foot
cube/minute
Foot
cube/hour
US
gallons/minute
US
barrels
(oil)/day
L/sec L/min m3/hr ft
3/min ft
3/hr gal/min US brl/d
1 60 3.6 2.119093 127.1197 15.85037 543.4783
0.016666 1 0.06 0.035317 2.118577 0.264162 9.057609
0.277778 16.6667 1 0.588637 35.31102 4.40288 150.9661
0.4719 28.31513 1.69884 1 60 7.479791 256.4674
0.007867 0.472015 0.02832 0.01667 1 0.124689 4.275326
0.06309 3.785551 0.227124 0.133694 8.019983 1 34.28804
0.00184 0.110404 0.006624 0.003899 0.2339 0.029165 1

Boosting Capacity of Electric Generation through the use of Turbo-Expanders in Natural Gas Network D-3
Environics in collaboration with Mohamed Salah Elsobki (jr) November 2013
8) Volumetric Gas Flow Units
Normal meter cube/hour Standard cubic feet/hour Standard cubic feet/minute
Nm3/hr scfh scfm
1 35.31073 0.588582
0.02832 1 0.016669
1.699 59.99294 1
9) Mass Flow Units
Kilogram/hour Pound/hour Kilogram/second Ton/hour
kg/h lb/hour kg/s t/h
1 2.204586 0.000278 0.001
0.4536 1 0.000126 0.000454
3600 7936.508 1 3.6
1000 2204.586 0.277778 1
10) High Pressure Units
Bar Pound/square
inch Kilopascal Megapascal
Kilogram
force/
centimeter
square
Millimeter
of
mercury
Atmospheres
bar psi kPa MPa kgf/cm2 mm Hg atm
1 14.50326 100 0.1 1.01968 750.0188 0.987167
0.06895 1 6.895 0.006895 0.070307 51.71379 0.068065
0.01 0.1450 1 0.001 0.01020 7.5002 0.00987
10 145.03 1000 1 10.197 7500.2 9.8717
0.9807 14.22335 98.07 0.09807 1 735.5434 0.968115
0.001333 0.019337 0.13333 0.000133 0.00136 1 0.001316
1.013 14.69181 101.3 0.1013 1.032936 759.769 1
11) Low Pressure Units
Meter of
Water
Foot of
water
Centimeter
of
mercury
Inches of
mercury
Inches of
water Pascal
mH2O ftH2O cmHg inHg inH2O Pa
1 3.280696 7.356339 2.896043 39.36572 9806
0.304813 1 2.242311 0.882753 11.9992 2989
0.135937 0.445969 1 0.39368 5.351265 1333
0.345299 1.13282 2.540135 1 13.59293 3386
0.025403 0.083339 0.186872 0.073568 1 249.1
0.000102 0.000335 0.00075 0.000295 0.004014 1

Boosting Capacity of Electric Generation through the use of Turbo-Expanders in Natural Gas Network D-4
Environics in collaboration with Mohamed Salah Elsobki (jr) November 2013
12) Speed Units
Meter/second Meter/minute Kilometer/hour Foot/second Foot/minute Miles/hour
m/s m/min km/h ft/s ft/min mi/h
1 59.988 3.599712 3.28084 196.8504 2.237136
0.01667 1 0.060007 0.054692 3.281496 0.037293
0.2778 16.66467 1 0.911417 54.68504 0.621477
0.3048 18.28434 1.097192 1 60 0.681879
0.00508 0.304739 0.018287 0.016667 1 0.011365
0.447 26.81464 1.609071 1.466535 87.99213 1
13) Dynamic Viscosity Units
Centipoise Poise Pound/foot·second
cp poise lb/(ft·s)
1 0.01 0.000672
100 1 0.067197
1488.16 14.8816 1
14) Temperature Conversion Formulae
Degree Celsius (°C)
Degree Fahrenheit (°F)
Kelvin (K)
15) Power Units
Giga Joule Mega Watt
hour
Giga Watt
Kalori
Million units,
temperature
British
Tons of oil
equivalent
GJ MWh GW Kalori Mio BTU toe
41.87 11.63 10 39.69 1
1.05 0.29 0.25 1 0.025
4.19 1.16 1 3.97 0.1
3.6 1 0.86 3.41 0.086
1 0.28 0.24 0.95 0.034

Boosting Capacity of Electric Generation through the use of Turbo-Expanders in Natural Gas Network E-1
Environics in collaboration with Mohamed Salah Elsobki (jr) November 2013
Annex E. Natural Gas Measurements and Conversions
995 tons of oil equivalent = Tons of crude oil
1,111 tons of oil equivalent = Tons of natural gas
1.125 tons of oil equivalent = Ton liquid propane gas (LPG)
972 tons of oil equivalent = Tons of fuel oil
1,086 tons of oil equivalent = Tons of kerosene
1,103 tons of oil equivalent = Tons of gasoline
1,066 tons of oil equivalent = Tons diesel
7.3 barrels of oil = Tons of crude oil
0.67 tons of oil equivalent = Tons of coal
5000 cubic feet of natural gas = Barrels of natural gas
1330 m3
= Tons of natural gas
35,315 cubic feet = Cubic meters of natural gas
1 cubic foot natural gas (NG) – wet = 1,109 Btu
1 cubic foot – dry = 1,027 Btu
1 cubic foot – dry = 1,087 kilojoules
1 cubic foot – compressed = 960 Btu
1 pound = 20,551 Btu
1 gallon – liquid = 90,800 Btu – HHV
1 gallon – liquid = 87,600 Btu – LHV
1 million cubic feet = 1,027 million Btu
1 metric ton liquefied natural gas
(LNG)
= 48,700 cubic feet of natural gas
1 billion cubic meters NG = 35.3 billion cubic feet NG
1 billion cubic meters NG = 0.90 million metric tons oil equivalent
1 billion cubic meters NG = 0.73 million metric tons LNG
1 billion cubic meters NG = 36 trillion BTUs
1 billion cubic meters NG = 6.29 million barrels of oil equivalent
1 billion cubic feet NG = 0.028 billion cubic meters NG
1 billion cubic feet NG = 0.026 million metric tons oil equivalent
1 billion cubic feet NG = 0.021 million metric LNG
1 billion cubic feet NG = 1.03 trillion BTUs

Boosting Capacity of Electric Generation through the use of Turbo-Expanders in Natural Gas Network E-2
Environics in collaboration with Mohamed Salah Elsobki (jr) November 2013
1 billion cubic feet NG = 0.18 million barrels oil equivalent
1 million metric tons LNG = 1.38 billion cubic meters NG
1 million metric tons LNG = 48.7 billion cubic feet NG
1 million metric tons LNG = 1.23 million metric tons oil equivalent
1 million metric tons LNG = 52 trillion BTUs
1 million metric tons LNG = 8.68 million barrels oil equivalent
1 million metric tons oil equivalent = 1.111 billion cubic meters NG
1 million metric tons oil equivalent = 39.2 billion cubic feet NG
1 million metric tons oil equivalent = 0.805 million tons LNG
1 million metric tons oil equivalent = 40.4 trillion BTUs
1 million metric tons oil equivalent = 7.33 million barrels oil equivalent
1 million barrels oil equivalent = 0.16 billion cubic meters NG
1 million barrels oil equivalent = 5.61 billion cubic feet NG
1 million barrels oil equivalent = 0.14 million tons oil equivalent
1 million barrels oil equivalent = 0.12 million metric tons of LNG
1 million barrels oil equivalent = 5.8 trillion BTUs
1 trillion BTUs = 0.028 billion cubic meters NG
1 trillion BTUs = 0.98 billion cubic feet NG
1 trillion BTUs = 0.025 million metric tons oil equivalent
1 trillion BTUs = 0.2 million metric tons LNG
1 trillion BTUs = 0.17 million barrels oil equivalent1 short ton
= 53,682.56 cubic feet
1 long ton = 60,124.467 cubic feet
1 cubic foot = 0.028317 cubic meters
1 cubic meter – dry = 36,409 BTU
1 cubic meter – dry = 38.140 Mega Joules
1 cubic meter = 35.314 cubic feet

Boosting Capacity of Electric Generation through the use of Turbo-Expanders in Natural Gas Network 3
Environics in collaboration with Mohamed Salah Elsobki (jr) November 2013
Annex F. Characteristics of some Gas Pressure Regulating and Metering
Station in Egypt and other Countries
National Gas Company “NATGAS“, Egypt:
Gas Pressure Regulating and Metering Station
(City Gate) Capacity/Flow: 100.000 m³/h Natural Gas
Inlet Pressure: 70 barg
Outlet Pressure: 4,5 barg
Heating Facility: 3.200 kW
Commissioning: 2000
National Gas Company “NATGAS”, Egypt:
Gas Pressure Regulating and Metering Station
(City Gate)
Capacity/Flow: 100.000 m³/h
Inlet Pressure: 55 barg
Outlet Pressure: 5,0 barg
Heating Facility: 2.580 kW
Commissioning: 2003
Egypt Gas, Cairo/Egypt:
Gas Pressure Reduction/Fuel Gas Supply Station:
Capacity/Flow: 200.000 m³/h
Inlet Pressure: 70 barg
Outlet Pressure: 40 barg
Commissioning: 2003
Transgas, Cairo/Egypt:
Gas Pressure Regulating and Metering Station:
Capacity/Flow: 40.000 m³/h
Inlet Pressure: 70 barg
Outlet Pressure: 4,5 barg
Heating Facility: 990 kW
Commissioning: 2004
Egypt, Nubaria Gas Company, Cairo /2004-2005 Gas Pressure Reducing & Metering Station – 2 lines
100%
Flow: 320.000 Nm³/h
Inlet pressure: 32-70 bar(g)
Outlet pressure: 27 bar(g)
Sub contract via Actaris
Design by: B. Wiede
Executed by: Egypt Gas, Cairo
City of Nubaria
Nile Delta/
Power Plant
Germany, SHELL /2010
Gas Pressure Reducing & Metering Station – 2 lines
100%
Flow: 50.000 Nm³/h
Inlet pressure: 30-65 bar(g)
Outlet pressure: 27-46 bar(g)
Executed by: GEVA, Germany
Godorf, Germany/
Power Plant
Bakhrabad Gas Systems Ltd., Bangladesh
Gas Pressure Regulating and Metering Station:
Capacity/Flow: 18.000 m³/h
Inlet Pressure: 69 barg
Outlet Pressure: 4 barg
Commissioning: 2002
HKM Hüttenwerke Krupp Mannesmann, Germany
Gas Pressure Reducing and Metering System
Capacity/Flow Rate: 103.000 m³/h
Inlet Pressure: 60 barg
Outlet Pressure: 14,5 barg
Commissioning: 2003
VA TECH Combined Cycle, Austria
Turnkey Gas Fuel System, Turkey:
Capacity/Flow: 150.000 m³/h
Inlet Pressure: 75 barg
Outlet Pressure: 30 barg
Commissioning: 2004
Wintershall AG, Germany
Gas Pressure Regulating and Metering Station
Capacity/Flow: 50.000 m³/h
Inlet Pressure Class: ANSI 600, 100 bar
Inlet Pressure: 84 bar
Outlet Pressure: 30 bar

Boosting Capacity of Electric Generation through the use of Turbo-Expanders in Natural Gas Network 4
Environics in collaboration with Mohamed Salah Elsobki (jr) November 2013
Commissioning: 2004
Wintershall AG, Germany
Gas Pressure Regulating and Metering Station
Capacity/Flow: 52.000 m³/h
Inlet Pressure Class: ANSI 600, 100 bar
Inlet Pressure: 84 bar
Outlet Pressure: 21 bar/4 bar/1,5 bar
Commissioning: 2004
WINGAS GmbH, Germany
Gas Pressure Regulating and Metering Station
Capacity/Flow: 80.000 m³/h
Inlet Pressure Class: ANSI 600, 100 bar
Inlet Pressure: 70 bar
Outlet Pressure: 40 bar
Commissioning: 2004
Transgaz S. A., Medias/Romania
Gas Pressure Reducing and Metering System
Capacity/Flow: 140.000 m³/h
Inlet Pressure: 40 barg
Outlet Pressure: 6 barg
Commissioning: 2004
Pratiwi Putri Sulung, Indonesia
Offtake Station
Capacity/Flow: 212.000 m³/h
Inlet Pressure: 52 barg
Outlet Pressure: 22 barg
Commissioning: 2004
Bayer Industry Services, Germany
Gas Pressure Reducing and Metering System
Capacity/Flow: 100.000 m³/h
Inlet Pressure: 90 barg
Outlet Pressure: 34 barg
Commissioning: 2005
Algeria, Sonelgaz Production d’Èlectricite /1986
1x HP Reducing & Metering Station
Flow: 165.000 Nm³/h
Inlet pressure: 40 bar(g)
Outlet pressure: 6 bar(g)
1x LP Reducing & Metering Station
Flow: 165.000 Nm³/h
Inlet pressure: 40 bar(g)
Outlet pressure: 1 bar(g)
Sub contract via Technopromexport
Design by: B. Wiede
Executed by: Rombach Germany
Jijel, Algeria/
Power Plant
Greece
PUBLIC POWER
CORPORATION S.A. /
1966-1997 Gas Pressure Reducing Station - 2 lines 100%
with heater and silencer
Flow: 60.000 Nm³/h
Inlet pressure: 18 bar(g)
Outlet pressure: 1,5 bar(g)
Sub contract via Technopromexport
Executed by: whb Germany
Greece, Athens/
Power Plant
Iran
IPDC (Iran Power
Development Company) /
1997-1998
Gas Pressure Reducing & Metering Station – 3 lines
50%
with silencer
Flow: 225.000 Nm³/h
Inlet pressure: 7 bar(g)
Outlet pressure: 1 bar(g)
Sub contract via Technopromexport
Executed by: whb Germany
Esfahan TPS, Unit 8
4x200 MW/
Power Plant

Boosting Capacity of Electric Generation through the use of Turbo-Expanders in Natural Gas Network 5
Environics in collaboration with Mohamed Salah Elsobki (jr) November 2013
Iran IPDC (Iran Power Development Company) /
1997-1998
Gas Pressure Reducing & Metering Station – 3 lines
50%
with silencer Flow: 207.000 Nm³/h
Inlet pressure: 19 bar(g)
Outlet pressure: 1,5 bar(g)
Sub contract via Technopromexport
Executed by: whb Germany
Ramin TPS, Unit 5-6
2x315 MW/
Power Plant
Uzbekistan, State Electricity Board /2000-2002
Gas Pressure Reducing & Metering Station – 2 lines
100%
with silencer Flow: 2x225.000 Nm³/h
Inlet pressure: 13 bar(g)
Outlet pressure: 1 bar(g)
Sub contract via Siemens
Executed by: whb Germany
Talimardjan TPE
1x 800 MW/
Power Plant
Libya Sirte Oil Company / 2002 Gas Pressure Reducing & Metering Station – 4 lines
50%
with scrubber, filter, heater
Flow: 4x3.729 Nm³/h
Inlet pressure: 60 bar(g)
Outlet pressure: 25 bar(g)
Sub contract via MAN
Design by: B. Wiede
Executed by: Rombach Germany
Wachkan Compression
Facilities/
Process Gas
Iraq Gerneral Company for Electrical Projects /
2002-2004 Gas Pressure Reducing & Metering Station – 2 lines
100%
with filter, heater and silencer
Flow: 2x110.000 Nm³/h,
Inlet pressure: 10-70 bar(g)
Outlet pressure: 6 bar(g)
Sub contract via Technopromexport
Design by: B. Wiede
Executed by: GEVA Germany
Youssifiyah TPS,
2x210 MW/
Power Plant
Iraq Gerneral Company for Electrical Projects /
2002-2004 Gas Pressure Reducing Station – 2 lines 100%
with silencer
Flow: 2x55.000 Nm³/h
Inlet pressure: 6 bar(g)
Outlet pressure: 1 bar(g)
Sub contract via Technopromexport
Youssifiyah TPS,
5x210 MW/
Power plant
Iran Mobin Petrochemical Co. / 2004-2005
1x HP Metering Station
Flow: 220.000 Nm³/h
Pressure: 50 bar(g)
1x HP Metering Station
Flow: 101.000 Nm³/h
Pressure: 50 bar(g)
6x Gas Pressure Reducing & Metering Station
Flow: 1.500 to 50.000 Nm³/h
Inlet pressure: 31 bar(g)
Outlet pressure: 4 to 11 bar(g)
Sub contract via Actaris
Design by: B. Wiede
Executed by: GEVA, Germany
Assaluyeh,
Persian Gulf Region/
Process Gas
Germany Krupp – Mannesmann 2005
Gas Pressure Reducing & Metering Station – 2 lines
100%
Flow: 35.000 Nm³/h
Inlet pressure 40-60 bar(g)
Outlet pressure 10 bar(g)
Executed by: GEVA Germany
Aachen, Germany/
Power Plant
Germany STEAG / BASF / 2005
Gas Pressure Reducing & Metering Station – 2 lines
100%
Flow: 20.000 Nm³/h
Inlet pressure: 25-30 bar(g)
Outlet pressure: 3 bar(g)
Executed by: GEVA Germany
Ludwigshafen,
Germany/ Power Plant Belgium,
ELECTRABEL/2006
Germany E.ON Ruhrgas / 2007
Gas Pressure Reducing & Metering Station – 2 lines

Boosting Capacity of Electric Generation through the use of Turbo-Expanders in Natural Gas Network 6
Environics in collaboration with Mohamed Salah Elsobki (jr) November 2013
Gas Pressure Reducing & Metering Station – 2 lines
100%
Flow: 50.000 Nm³/h
Inlet pressure: 58-60 bar(g)
Outlet pressure: 19 bar(g)
Executed by: GEVA Germany
Brüssel, Belgium/
Heating Plant
100% Flow: 40.000 Nm³/h
Inlet pressure: 30-65 bar(g)
Outlet pressure: 27-46 bar(g)
Executed by: GEVA Germany
Wülfrath,
Germany/
Process Gas
Germany, E.ON Ruhrgas /2008 Gas Pressure Reducing & Metering Station – 2 lines
100%
Flow: 114.000 Nm³/h
Inlet pressure: 30-65 bar(g)
Outlet pressure: 27-46 bar(g)
Executed by: GEVA Germany
Nette Eisenbeck,
Germany/
Power Plant
Germany, Hagen Kabel / 2008
Gas Pressure Reducing & Metering Station – 2 lines
100% Flow: 50.000 Nm³/h
Inlet pressure: 30-65 bar(g)
Outet pressure: 27-46 bar(g)
Executed by: GEVA Germany
Hagen, Germany/
Heating Plant
Croatia, HEP-PROIZVODNJA/ 2010-2012
Gas Pressure Reducing & Metering Station – 2 lines
100%
Flow: 59.900 Nm³/h
Inlet pressure: 30 bar(g)
Outlet pressure: 23,5 bar(g)
Sub contract via Technopromexport
Design by: B. Wiede
Executed by: GEVA Germany