efina financial services landscape in nigeria full …...financial services landscape in nigeria v...
TRANSCRIPT
FINANCIAL SERVICES LANDSCAPE IN NIGERIA
September 2010
(FULL REPORT)


Table of contents
List of tables and figures ii
Abbreviations iii
Executive Summary v
1 Introduction 1
1.1 Methodology 1
1.2 Report layout 2
2 The Nigerian Context 3
2.1 Background 3
2.2 A decade of economic reforms 4
2.3 The profile of poverty in Nigeria 8
3 The Financial Sector in Nigeria – the demand side 13
3.1 Access in Nigeria 13
3.2 International comparisons 18
4 The Financial Sector in Nigeria – the supply side 20
4.1 Introduction 20
4.2 Banking industry consolidation and other recent developments 20
4.3 Regulatory framework 25
4.4 Deposit Money Banks 27
4.5 Microfinance Banks 33
4.6 Other financial services providers 35
4.7 Cooperatives 39
4.8 Nigerian Agricultural Cooperative and Rural Development Bank Ltd 40
4.9 The landscape of access 41
5 Constraints to Access to Financial Services 45
5.1 Contextual constraints affecting financial services 45
5.2 Regulatory constraints 51
5.3 Systemic constraints 56
5.4 Organisational and product based constraints 58
6 Financial Institutions Response to Challenges that Constrain Access 64
7 Windows of Opportunity to Improve Access to Finance 67
7.1 Windows of opportunity for a more inclusive financial sector 67
7.2 Other elements to consider 74
8 Conclusions 77
8.1 Conclusions 77
References 78
Annex A Institutions interviewed for this survey 82
Annex B Sample questionnaire 84

Financial Services Landscape in Nigeria
ii
List of tables and figures
Table 2.1 Evolution of some economic indicators 5
Table 2.2 Distribution of poverty in Nigeria (1980-2004) 9
Table 2.3 Inequality by location and zone (1985-2004) 10
Table 3.1 Income distribution in geo-political zones 15
Table 4.1 CBN regulated financial institutions 20
Table 4.2 Financial soundness indicators, 2006 -2009 22
Table 4.3 Bank credit relative to GDP (%) – country comparisons (2003-2007) 23
Table 4.4 Regulatory initiatives to improve access to financial services 26
Table 5.1 Constraints to the expansion of access to financial services 45
Table 5.2 Reasons for not banking 60
Table 5.3 Cost of banking transactions 61
Figure 2.1 Geo-political zones of Nigeria 4
Figure 2.2 Relationship between poverty and inequality (1980-2005) 11
Figure 2.3 Relationship between poverty and GDP growth (1980-2005) 11
Figure 3.1 Distribution of access to financial services 13
Figure 3.2 Access to finance by demographic sub-groups 14
Figure 3.3 Access to finance – income related subgroups 15
Figure 3.4 Reasons for not having a bank account (% of adults) 16
Figure 3.5 Usage of financial products 17
Figure 3.6 Comparisons of access strands 18
Figure 4.1 The structure of the FSRCC 26
Figure 4.2 Branches per million inhabitants of selected banks, by state 29
Figure 4.3 Costs and assets per employee in Nigerian banks 30
Figure 4.4 Segmentation of the card market 32
Figure 4.5 Distribution of MFBs in Nigeria 34
Figure 4.6 Percentage of adults without access to financial services 41
Figure 4.7 Usage of financial products by banked people 42
Figure 7.1 Subscribers to mobile phones in Nigeria 1999-2009 73
Figure 7.2 The centralized model of connectivity 75
Financial Services Landscape in Nigeria
iii
Abbreviations
ACGS Agricultural Credit Guarantee Scheme
AFI Alliance for Financial Inclusion
AMC Asset Management Company
AML/CFT Anti-Money Laundering and Combating the Financing of Terrorism
ATM Automated Teller Machine
BoI Bank of Industry
BOFI Banks and Other Financial Institutions
BSD Banking Supervision Department (Central Bank of Nigeria)
CBN Central Bank of Nigeria
CBU Complaint Bureau Unit
CGAP Consultative Group to Assist the Poor
CIBN Chartered Institute of Bankers of Nigeria
CoT Commission on Turnover
DA Development Associates
DFD Development Finance Department (Central Bank of Nigeria)
DMBs Deposit Money Banks
EFCC Economic and Financial Crimes Commission
EFInA Enhancing Financial Innovation & Access
FCT Federal Capital Territory
FGN Federal Government of Nigeria
FIRS Federal Inland Revenue Service
FIU Financial Inclusion Unit
FMAWR Federal Ministry of Agriculture and Water Resources
FMBN Federal Mortgage Bank of Nigeria
FSRCC Financial Services Regulation and Coordinating Committee
FSS 2020 Financial System Strategy
HDR Human Development Report
ICPC Independent Corrupt Practices and Other Related Offences Commission
ICT Information and Communications Technology
IMF International Monetary Fund
KYC Know Your Customer
LGAs Local Government Areas
MDGs Millennium Development Goals
MDRI Market Development and Restructuring Unit
Financial Services Landscape in Nigeria
iv
MFB Microfinance Bank
MFI Microfinance Institution
MIS Management Information System
MoF Federal Ministry of Finance
MSME Micro, Small and Medium Enterprises
MTO Money Transfer Operator
NACRDB Nigerian Agricultural, Cooperative and Rural Development Bank
NAICOM National Insurance Commission
NBS National Bureau of Statistics
NCC Nigerian Communications Commission
NDIC Nigerian Deposit Insurance Corporation
NEEDS National Economic Empowerment and Development Strategy
NEXIM Nigerian Export Import Bank
NHIS National Health Insurance Scheme
NPC National Planning Commission
NPLs Non Performing Loans
OFID Other Financial Institutions Department (Central Bank of Nigeria)
OPM Oxford Policy Management
PEA Political Economy Analysis
PenCom National Pension Commission
PIN Personal Identification Number
PoS Point of Sale
ROSCAs Rotating Savings and Credit Associations
SEC Securities and Exchange Commission
SME Small and Medium Enterprises
SMECGS Small and Medium Enterprises Credit Guarantee Scheme
SMEEIS Small and Medium Enterprises Equity Investment Scheme
ToR Terms of Reference
UDBN Urban Development Bank of Nigeria Plc
UNDP United Nations Development Programme
Nigerian Naira (NGN) exchange rate used in this report: US$1 = N150.7 (11 May 2010)

Financial Services Landscape in Nigeria
v
Executive Summary
Enhancing Financial Innovation & Access (EFInA) is an independent, professional and non-profit organisation funded by the UK’s Department for International Development (DFID) and the Bill & Melinda Gates Foundation. EFInA’s purpose is to promote Financial Sector Development and Financial Inclusion in Nigeria.
EFInA conducted the Access to financial services in Nigeria survey in 2008, which covered the demand for financial services. They commissioned a supply side survey in 2010 that together with the earlier demand side survey will contribute towards a better understanding of the constraints to expanding access to finance in Nigeria and will thus help policy-makers, service providers and other stakeholders to build a more inclusive financial system.
This section of the document summarises the findings of the supply side survey. The full report provides an overview of Nigeria’s financial infrastructure, the level of access and usage from a supply perspective, and analyses the main access barriers to the usage of financial services, and is designed to inform the discussion on the following key issues:
• The influence of economic context in Nigeria – what is the relationship between the economic context and financial development?
• The supply of financial services – who are the main actors in the Nigerian financial sector? Are their services sufficiently affordable, accessible and appropriate to meet the unsatisfied demand of the low income segment in Nigeria?
• The access constraints – what is the nature of these constraints and what are their main effects?
• The response of the industry – how are financial services providers responding to the challenges of financial exclusion?
• The windows of opportunity to increase access to financial services – what are the opportunities and how best can they be exploited?
The analysis shows that the banking consolidation policy provided the banking industry with a capital buffer against potential losses during the current global economic crisis. As a result, the crisis has affected Nigeria somewhat less than many other oil producers. The decline in revenues and in real public expenditure has been less than in some other countries. However, the large swing in oil prices, the resulting depreciation of the Naira, the huge losses sustained through margin loans and a significantly depreciating domestic stock market all contributed to growing pressure on the banking system.
Analysis of data shows a correlation between wealth and access to financial services. Thus, not only are wealthier people more likely to be banked, but wealthier areas in the country have a higher proportion of banked people. Financial inclusion, therefore, is a key to tackling the ‘poverty trap’ in Nigeria and to increasing economic growth.
According to the EFInA’s Access to financial services in Nigeria 2008 survey, the challenge that financial institutions face in Nigeria can be summarized as follows:
• Only 1 in 5 Nigerian adults has a bank account
• Over half of the adult population (52.5%), equivalent to 46 million people, is financially excluded – that is, without recourse to any formal or informal financial products

Financial Services Landscape in Nigeria
vi
This challenge is particularly acute in rural areas, where 86% of the rural population is unbanked, compared to only 61% of the urban population, as a result of the juxtaposition of three factors (i) less cost-effective distribution across great distances, (ii) a much poorer customer base; and (iii) an economy dominated by agriculture.
Regarding the supply of financial services, the sector is clearly dominated by the 24 Deposit Money Banks (DMBs), with an asset base of N14.795 trillion at the end of 2009. The dominance of DMBs is illustrated by the fact that the more than 900 Microfinance Banks (MFBs) operating in the country have a combined asset base of N157.3 billion, which is equivalent to a little over 1% of the asset base of the 24 DMBs. 1
The consolidation process in the Nigerian banking industry reduced the number of DMBs operating in the country from 89 in 2004 to 25 in January 2006. This consolidation was the result of the decision of the Central Bank of Nigeria (CBN) in July 2004 to raise the minimum capital for all universal banks to N25 billion (US$ 204 million). In 2007, Stanbic Bank, Nigeria merged with IBTC Chartered Bank to reduce the number of DMBs to 24. A second critical phase in the banking industry was the post-consolidation ‘reality’ period which began in August 2009, following a special audit that led to the removal of management of 8 DMBs – Union Bank, Afribank, Intercontinental Bank, Oceanic Bank, FinBank, Bank PHB, Spring Bank and Equitorial Trust Bank. A total of N620 billion (over US$4 billion) was injected into these eight banks to boost liquidity and prevent systemic crisis. The reasons adduced for these drastic steps included: loan concentration; excessive exposure to margin loans exacerbated by the capital market crash; and oil and gas trading that was badly affected by the decline in international oil prices leading to deteriorating asset quality.
While consolidation and the post-consolidation ‘reality’ periods have created more solid financial institutions, access to finance has actually worsened as deposit money banks took a flight to safety by drastically cutting down on lending to the private sector, more specifically individuals and small enterprises, in preference for government lending through very large investment in government securities.
The reduction in lending to the private sector reflects a serious problem - intermediation is still highly skewed towards the public sector compared to other developing countries. Although some deposit money banks are currently pursuing branch expansion strategies as a means of reaching out to more customers, the distribution of branches remains extremely uneven, with a great concentration in the southern states. This means that DMBs current branch expansion strategies will have little impact in terms of increasing the number of people getting access to financial services, especially in rural areas, which tend to have larger segments of the unbanked population.
In terms of affordability, the analysis of the tariff structure of a sample of DMBs shows that there is no ‘barrier effect’ inhibiting access: that is, conditions such as minimum balances do not exclude the low income segment from accessing an account. There is, however, an ‘inhibitor effect’ meaning that using the account is likely to be too expensive for most low income people.
The analysis of the distribution of MFBs shows a striking result, in that the MFBs tend to be concentrated in the Southern states, and that the Northern states are relatively very poorly served. This means that MFBs do not fulfil the role that they were initially meant to serve, covering areas not served by the DMBs. The impact of MFBs in reducing financial
1 Central Bank of Nigeria

Financial Services Landscape in Nigeria
vii
exclusion is negligible - only 0.6% of adults in Nigeria have an account with an MFB, compared to 21% who have an account with a DMB. 2
Insurance is the second largest industry in the financial sector after banking. Recapitalisation of the Insurance industry took place in 2007, leading to considerable consolidation: there are currently 51 insurance companies as against 107 companies three years ago. However, access to insurance in Nigeria remains very low and except for the oil and gas industries and mandatory insurance products (e.g. buildings, motor vehicles), there is very low market awareness of the need for insurance.
Other financial institutions (pension providers, asset management, discount houses, finance companies, bureaux de change, and development finance institutions) also play a marginal role in promoting financial exclusion.
The landscape of access in terms of services can be summarised as follows:
• Transaction banking and transmission services: there is a reasonable diversity of bank-supplied transaction services at what appear to be relatively low cost. Typically these come in the form of basic savings accounts. It would appear that usage of such accounts is constrained mainly because of physical access issues and affordability for the low income segment
• Savings services are the main vehicle through which deposit money banks offer basic transaction services to low income earners, although physical access and affordability constraints still affect the take-up of savings services. However, there are positive signs - some DMBs are experimenting with esusu-style innovations in agent banking in order to reduce accessibility problems
• The usage of credit is highly constrained for low income and self-employed individuals although there is considerable diversity of products for salaried individuals. The cost of credit (typically 20-25% per annum for most categories) and the short tenure of many loans mean that debt servicing costs are highly exclusionary for the vast majority of Nigerians
• The insurance and pension industries are still very small
2 EFInA Access to financial services in Nigeria 2008 survey

Financial Services Landscape in Nigeria
viii
The study identified the following constraints preventing access to financial services.
Contextual Constraints
- Demographic and poverty pressures
- Complex political organization
- Poor level of infrastructure
- Financial sector culture
- Public interventionism
- Lack of policy coordination
Regulatory constraints
- Mobile payments regulation
- Know Your Customer
- Interest rate caps
- Secured transaction law
- Bankruptcy laws
- MFB regulation
Systemic constraints
- Skewed delivery infrastructure
- Lack of financial sector data
- Lack of credit information
- Absence of an integrated ID system
- Skills shortage
Organizational & Product based constraints
- Physical accessibility
- Appropriateness
- Affordability
Demand constraints
- Gender-related constraints
- Income-related constraints
- Ethnicity
- Financial capability
The response from the industry to these constraints is far from homogeneous. Among DMBs, some have curtailed their expansion plans as a result of the crisis, while others are consolidating their market positions, concentrating on absorbing the influx of new customers who, in a ‘flight to quality’ are deserting the weaker institutions.
Among the MFBs, many are struggling with the financial implications of their previous growth strategies, with many now actively looking for capital. Others have grown successfully but have reached the limit of what their capital base will allow them to do.
The insurance industry is both financially and reputationally weak, though its reputation is improving. Its capacity for expansion and diversification is limited and appears more focussed on stabilising its mainstream business than on expanding outreach into unserved markets, though there are some microinsurance related initiatives now underway.
Technology is present in many of the strategies to increase financial inclusion, despite the challenges faced by technology-based innovative strategies such as a high level of fraud in the country; the need for greater insight into customers’ needs and aspirations; and the tendency to focus on better services to existing customers rather than reaching out to the unbanked.
The study also analysed the Windows of Opportunity that are opening up to create a more inclusive financial sector. These are:
• A shift in DMBs perception of the bankability of the low income segment. Although the downscaling process will be long and gradual, generating early and visible results

Financial Services Landscape in Nigeria
ix
that can be replicated by other banks (demonstration effect) can contribute to reinforce this change of mentality within the banking industry
• The creation of a Financial Inclusion Unit within the CBN, that may (a) collect and disseminate reliable information on financial inclusion; (b) participate actively in the decision-making process of the different divisions of the CBN; (c) support evidence-based policy making; (d) contribute to guaranteeing the correct implementation of measures aimed at increasing access to financial services; and (e) disseminate good practices and lessons learnt on financial inclusion
• Financial System Strategy 2020 has the potential to bring overall guidance and policy stability to the financial sector. Maintaining a high level of ownership during the implementation of reforms, creating an effective monitoring & evaluation and implementation assessment framework to increase public accountability and transparency, and obtaining a high level of political support will contribute to strengthen this window of opportunity
• The recent creation of a National Association of MFBs creates new opportunities (a) to provide an arena where public and private agents may discuss weaknesses and opportunities for the microfinance subsector; (b) to encourage transparency, good practices and ethical codes amongst MFBs; and (c) to contribute to the dissemination and exchange of information
• The outreach of telecom companies in Nigeria experience in other African countries shows the potential of mobile banking services to expand the frontier of financial services. DMBs are aware of this situation and with a mobile phone penetration rate of 50% of the population, they see the combination of agent banking with mobile banking as the most likely route to downscale their services
The key conclusions can be summarised as follows:
• It is important to bear in mind the context of the supply of financial services in Nigeria, which is an exceptionally big and complex country – physically, demographically and economically
• The Federal Government has achieved some correspondingly big successes in the reform of the financial sector, but continues to face important obstacles, including the serious problem of lack of access to financial services, particularly by low income men and women
• Inclusive financial sector development makes two complementary contributions to poverty alleviation: it is a driver of economic growth which indirectly reduces poverty and inequality; and accessible, affordable and appropriate financial services for low income people can improve their welfare and reduce their vulnerability
• Financial exclusion is widespread despite the wealth of Nigeria, and is the result of a combination of contextual factors and factors within the financial sector
• There are, however, encouraging signs at the governmental and industry level of a movement towards the creation of a more inclusive financial sector. For example:
- The Government is committed to FSS 2020 as an integral part of Vision 2020
- There are effective champions of reform, particularly the CBN
- A number of deposit money banks are already piloting a number of interesting products and services targeted at the low income segment
- Some MFBs are achieving sustainability
- There are interesting opportunities for the development of agent banking, given the esusu/adashi tradition in Nigeria

Financial Services Landscape in Nigeria
x
- There is also fertile ground for mobile banking, given that 50% of the Nigerian population has access to a mobile phone

Financial Services Landscape in Nigeria
1
1 Introduction
Oxford Policy Management (OPM) in association with Development Associates Limited (DA) Nigeria was contracted by Enhancing Financial Innovation & Access (EFInA) to undertake a survey of financial services providers in Nigeria from the perspective of access and financial inclusion. Access to a range of affordable, safe and reliable financial services (such as savings, credit, insurance and transfer services), provide the necessary lubricant for economic growth. Increased access to financial services will contribute to reducing poverty in Nigeria. The objective of this study is to establish the extent to which Nigeria’s financial market is inclusive, i.e., serves the majority of Nigerians and in particular low income households. The focus is therefore very much on financial services for households; consideration is given to other areas such as SME finance and agricultural and rural finance only when they are directly or indirectly relevant to financial services for households.
There is a wide consensus among analysts that the three key dimensions of financial inclusion are that financial services should be accessible to the poor, affordable by the poor and appropriate to the needs of the poor.3 During the survey and subsequent analysis, the study team has therefore focused on these three dimensions of financial services.
1.1 Methodology
In order to carry out this analysis and achieve the objectives of this assignment, the study was undertaken in four phases:
• Phase 1 – Review of literature and available documentation (desk-based)
• Phase 2 – Field visit and survey
• Phase 3 – Synthesis and analysis of information and data gathered
• Phase 4 – Presentation and discussion of study findings
1.1.1 Phase 1 – Review of literature and available documentation (April – May 2010 - desk-based)
The review of studies, reports and other documentation constituted the first step in the assignment. An inception report was prepared by the team to outline the key issues emerging from the desk-based review and elaborate the details of the research design, specifying in particular the sample of institutions to be surveyed and questionnaires to be administered during field work and proposed data analysis in Phase 2 and 3. The inception report preparation process also facilitated discussions amongst team members to improve collective understanding of the team.4 The desk based review was supplemented by further documents accessed during field visits in Nigeria.
3 See for example: Daryl Collins, Jonathan Morduch, Stuart Rutherford and Orlanda Ruthven,
Portfolios of the Poor: How the World's Poor Live on $2 a Day, and earlier studies referred to in that work. See also G20: Access through Innovation Sub-Group of the G20 Financial Inclusion Experts Group: Principles and Report on Innovative Financial Inclusion, 25 May 2010
4 The study was undertaken by Oxford Policy Management and Development Associates: the team
consisted of Robert Stone (Team Leader), Olu Adetunmbi, Sukhwinder Arora, Mateo Cabello, Jeremiah Grossman, Samuel Mshelia, Mark Napier, Nils Riemenschneider, Kayode Sufianu, and Jack Wills. Dr Obadiah Mailafia provided Quality Assurance inputs

Financial Services Landscape in Nigeria
2
1.1.2 Phase 2 – Field visit and survey (June 2010)
Most members of the study team participated in field visit in Nigeria during 7-25 June 2010. During the field work team members visited both the financial services providers (deposit money banks, insurance companies, microfinance banks, development financial institutions) and regulators (CBN, NAICOM) in Abuja, Lagos, Kaduna and Ibadan. The final sample selection was based on those institutions: (a) whose current or planned branch network is more widespread or closer to the target group, (b) currently providing financial services or products that are important to or allow ease of entry by low income clients, and/or (c) that have expressed a particular interest in down-scaling. The list of institutions surveyed is provided at Annex A and the questionnaires used are provided at Annex B.
1.1.3 Phase 3 – Synthesis and analysis of information and data gathered (July 2010)
The results of the desk-based review and information gathering during the field visit was then synthesized and organized by the study team. Key findings and issues were drawn up and fed into a team brainstorming session, which informed the production of the survey report and associated PowerPoint presentation of key findings and recommendations.
1.1.4 Phase 4 – Presentation and discussion of study findings (August 2010)
The findings from this study were presented at EFInA’s Innovation forum titled ‘the Nigerian Retail Finance landscape’ on August 10, 2010.
1.2 Report layout
Chapter 2 provides a brief description of the Nigerian context. Chapter 3 assesses the demand for financial services in Nigeria, drawing on the findings from the EFInA’s Access to financial services in Nigeria 2008 survey and comparing access to finance in Nigeria with that in other countries. Chapter 4 reviews the financial sector in Nigeria on the supply side and provides analysis of key suppliers (deposit money banks, microfinance banks, other providers) and brings together the elements of the landscape of access. Chapter 5 reviews the constraints to access in Nigeria. Chapter 6 summarises the response of financial institutions to challenges that constrain access. Chapter 7 identifies potential opportunities to improve access to financial services in Nigeria. The last Chapter summarised the key conclusions emerging from the study.

Financial Services Landscape in Nigeria
3
2 The Nigerian Context
2.1 Background
With a population of 150 million people, which is increasing at a rate of just over two per cent a year, Nigeria is the most populous country in Africa. The composition of the population is in the main youthful, with over 58% below 18 years, and an increasing dependency ratio, estimated at 83.5%.5 A large proportion of the population is living in the rapidly expanding urban areas: although the figures vary according to the source consulted, the urban population is presently estimated to be between 45% and 48% of the total and forecast to be 55.4% by the year 2015 (United Nations Statistics Division, World Statistics Pocketbook, 2010). According to the 2006 Census carried out by the National Population Commission, the states of Kano (9.4 million) and Lagos (9 million) are the most populated in the country.6 Overall, of the total of 140 million as at 2006, 50.8% were male and 49.2% female. Of the total population aged 15 and above (totalling 81.7 million), 70% are literate (38% male and 32% female).7
With a per capita income of about US$1,980 in 2009, around 70 million Nigerians are living on less than one dollar a day. The UN Human Development Index ranked Nigeria 158 out of 182 countries in 2008. Given an annual population growth in 2009 of about 2.3%8 and an average GDP growth rate of around 6% during the period 2000-2008, poverty remains pervasive. Nigeria's dependence on oil and gas and its wider social, political and economic ramifications have contributed to significant development shortfalls: for example, the country is presently on track towards achieving, in part or in whole, only three out of the eight Millennium Development Goals (MDGs), namely, basic education, HIV prevalence and the global partnership for development.9
All these elements are obviously of crucial importance to the supply side survey, given the well known constraints to the supply of financial services to the low income segment of the population.
Another important contextual point is the size and complexity of the government and administrative structure of the country, which has implications for formulating and implementing policies at the macro level to tackle financial exclusion. The Constitution of the Federal Republic of Nigeria provides for the operation of three tiers of government, the Federal, State and Local governments. There are 36 States in Nigeria, and one capital
5 The dependency ratio is a measure of the portion of a population that is composed of dependents (people who are too young or too old to work). The dependency ratio is equal to the number of individuals aged below 15 or above 64 divided by the number of individuals aged 15 to 64, expressed as a percentage. UNDP, Nigeria Human Development Report (HDR) 2009
6 This illustrates the uncertain nature of the population data: although the 2006 Census indicates that Kano State is more populous than Lagos State, many informants believe that Lagos is significantly more populous than Kano. The 2006 census found that Kano State had 9,383,682 people and Lagos State 9,013,384 people – the UN reckons the population of Lagos to be between 13 and 15 million
7 Computed from 2006 Population & Housing Census of the Federal Republic of Nigeria, National Population Commission, Priority Table Volume I, August 2009 8 United Nations Population Fund (2009). Nigeria – an overview. UNFPA, 2010
9 United Nations Development Programme (2010). Human Development Report Nigeria – achieving
growth with equity. UNDP

Financial Services Landscape in Nigeria
4
territory (Federal Capital Territory), which form the second tier of the administrative structure in Nigeria. The Local government is the third tier of the administrative structure in Nigeria, with 774 Local Government Areas (LGAs).
Nigeria’s Federal States are commonly grouped following basic geographic criteria into six geo-political zones, as shown in Figure 2.1 namely: (i) North East; (ii) North West; (iii) North Central; (iv) South West; (v) South East; and (vi) South South. These delineations of geo-political zones are the ones used in this report.
Figure 2.1 Geo-political zones of Nigeria
In the following sections the most important economic and institutional reforms in the last decade and how they affect poverty levels and income distribution patterns are explored. Contextual constraints specifically affecting the supply of financial services, which are described in Section 5, are a central factor in this analysis.
2.2 A decade of economic reforms
2.2.1 The National Economic Empowerment and Development Strategy
The financial sector is an integral part of the economy. The supply side study therefore took account of the impact of the National Economic Empowerment and Development Strategy (NEEDS) reforms, the central objective of which is to stabilize the Nigerian economy, to improve budgetary planning and execution and to provide a platform for sustained economic diversification and non-oil growth. NEEDS focused on four main areas: improving the macroeconomic environment, pursuing structural reforms, strengthening public expenditure management and implementing institutional and governance reforms. A major challenge was to de-link public expenditures from oil revenue earnings by introducing an appropriate fiscal rule. The adoption of such a rule could enable the accumulation of government savings,

Financial Services Landscape in Nigeria
5
which would be valuable, whether for precautionary reasons, for smoothing public expenditures or for ensuring intergenerational equity.
In order to consolidate macroeconomic reforms, a broad range of structural reforms were also implemented to improve the domestic business climate and enhance competitiveness, to deregulate and reduce government activity in various economic sectors, and to address various structural constraints to growth. The main areas of structural reforms were privatization of public companies, the civil service, trade policy and the banking industry. It is also important to mention non-banking reforms in pension funds, insurance services and the capital markets. Although the country is still far from where it ought to be in these sectors, there have been significant improvements. These improvements were recognized in 2005 by the Paris Club of creditor nations, which agreed a debt relief deal with Nigeria worth $18bn. That represented an overall reduction of about 60% of its debt to the Paris Club.
As for the financial sector, prior to the NEEDS reforms, the Nigerian banking industry (which dominates the financial sector in Nigeria in terms of assets and numbers of customers)10 was weak and fragmented – more focused on short-term opportunities than productive private investments. The imposition of interest rate ceilings had resulted in negative real interests rates. Supervision was weak. To strengthen the sector, a consolidation exercise within the banking industry was launched in 2004. The details of the banking industry reforms and recent developments from August 2009 are covered in the next chapter.
Table 2.1 reflects the changes in some Nigerian economic indicators as a consequence of the reforms introduced in the last decade.
Table 2.1 Evolution of some economic indicators
(in percent, except otherwise stated)
2
nd
Qtr 07
3rd
Qtr 07
4th Qtr 07
1st
Qtr 08
2nd
Qtr 08
3rd Qtr 08
4th
Qtr 08
1st
Qtr 09
2nd
Qtr 09
3rd
Qtr 09
4th
Qtr 09
1st Qtr 10
Gross Domestic Product (annual growth rate)
5.5 6.6 7.8 5.8 5.2 6.0 7.1 4.5 7.2 7.1 7.4 6.7
Oil share of GDP 18.7 18.6 18.0 21.6 16.7 16.9 15.7 18.7 16.0 15.5 14.7 17.6
Non-oil share of GDP 81.3 81.4 82.0 78.4 83.3 83.1 84.3 81.3 84.0 84.5 85.3 82.4
Inflation Rate 5.9 5.9 5.4 5.8 7.0 9.2 11.6 13.1 13.7 10.4 13.9 14.8
Interest rates (Max. lending rate)
18.7 18.2 18.2 18.1 17.9 18.1 19.7 22.2 22.8 22.8 23.1 23.1
Interest rates (Ave. term deposit rate)
8.97 8.99 8.69 9.35 10.7 11.0 11.6 12.2 11,8 12.3 11.7 9.44
Credit to private sector (%) 14.8 20.6 21.5 18.1 13.6 10.4 7.9 2.1 4 14.7 3.5 -1.7
Sources: 1. Central Bank of Nigeria Economic Reports for the 2
nd, 3
rd & 4
th Quarter of 2009, 1
st Quarter 2010
2. IMF Country Report No. 09/315, November 2009 3. National Bureau of Statistics, National Accounts, 2006 4. Inflation Rate for 4
th Qtr 2009 and 1
st Qtr 2010 reflect adjusted figures provided by NBS in August 2010
10
The asset base of the 24 deposit money banks, for example, are around N15 trillion, compared to N157 billion for the 901 microfinance banks

Financial Services Landscape in Nigeria
6
From an overall perspective, the results of the reform process can be summarized as follows:
• The reforms have left the economy better prepared to deal with the global economic crisis. Central to this success is the oil-price-based fiscal rule, which broke the link between public spending and oil prices and created an oil-savings cushion of $18 billion as well as foreign reserves that peaked in 2008 at $62 billion, but it is currently below $40 billion, which is still a healthy position enough to finance about 17 months of imports
• The consolidation in the banking industry provided deposit money banks with a capital buffer against potential losses during the global economic downturn
• Increased confidence in economic prospects was reflected in improved growth and lower inflation. Non-oil growth averaged over 7% from 2006 to 2009, as agriculture, telecommunications, construction, and financial services expanded
• Single digit inflation up till the third quarter of 2008. Subsequently it has witnessed a steady rise due to the world food crisis and the Naira depreciation due to dwindling foreign exchange earnings resulting from the global economic problems
• Real incomes have risen significantly, although it is too early to say whether this has contributed significantly to poverty reduction
This positive economic performance underscores the break from past episodes of the oil price cycle. In previous episodes, fiscal policy was highly pro-cyclical because of both mounting oil revenues and debt financing. Periods of high oil prices increased access to debt and pushed up indebtedness. When oil prices fell the economy went through periods of severe contraction.11 The only indicator that has shown significant deterioration since the end of 2007 is credit to the private sector.
These advances provide a relatively favourable environment for tackling the problems of access to financial services for low income households. Nigeria still faces many challenges that have a significant impact on financial sector development such as:
• Extending reforms to the sub-national levels
• Focusing on non-oil growth and employment generation
• Improving the domestic business climate
• Expanding and maintaining investments in infrastructure
• Strengthening domestic institutions
• Tackling unrest in the Niger Delta
• Increasing the quality of social sector spending
• Improving access to services in general, including health and education as well as financial services12
11
Okonjo-Iweala, N. and Osafo-Kwaako, P. (2007). Nigeria’s economic reforms: progress and challenges. Brookings Global, Working Paper No 6
12 Op.cit

Financial Services Landscape in Nigeria
7
2.2.2 The current economic situation
One of the immediate effects of the current global economic crisis is that the pace of economic activity in Nigeria has slowed in the last two years. A decline in real public sector demand of about 2% is restricting activity, and credit to the private sector was broadly flat in 2009.
In the last couple of years, oil and gas production was constrained by unrest in the Niger Delta,13 and by OPEC production quotas, resulting in a decrease of 20% in the volume of oil produced. Despite this, the crisis has affected Nigeria somewhat less than many other oil producers: the decline in revenues has been less than in some other countries, and the compression in real public expenditure has been more modest, mainly because of the new fiscal regime. Non-oil growth, though falling slightly in absolute terms, remains a steady percentage of GDP and is set to hold up better than in many other countries. However, Nigeria has seen a greater reduction in international reserves than many other oil producers because it sought to curtail the decline in the nominal value of the Naira.
One of the issues that needed to be investigated in the supply side study is whether or not the global crisis has magnified the challenges faced by the financial system in Nigeria. If the answer is yes, what is the real extent of this impact? This is particularly relevant because it appears that Nigerian deposit money banks did not have exposure to complex domestic or foreign financial instruments and foreign bank ownership was low. Nevertheless the large swing in oil prices, the resulting depreciation of the Naira, the huge losses sustained through margin loans and a significantly depreciating domestic stock market all contributed to growing pressure on the banking system. Signs of stress in the banking system became evident in the inter-bank market where activity diminished as the crisis developed. Following special examinations in 2009, the Central Bank of Nigeria (CBN) intervened in eight DMBs in 2009 by replacing management and injecting funds into them. Governance in these DMBs had been weak and legal actions are pending. These developments have contributed to a tightening of lending.
This, of course, has an impact on growth as well as on access to finance. Partly as a result of the tightening in credit, growth is expected to remain slower than in recent years. Reduced financing (both foreign and domestic), constraints on public spending and uncertainty about global and domestic prospects have weighed on consumption and investment. The CBN sought to limit pressure on the Naira from lower oil prices and became a net seller of foreign exchange. Deposit money banks have reined in their lending. The slowdown in activity and tight credit conditions should dampen inflationary pressures considerably and offset the impact of Naira depreciation on prices. However, recent market information indicates a crash in deposit rates in 2010 to as low as 2% for term deposits which is way below the rate of inflation and could adversely affect savings and further worsen financial exclusion, whereas lending rates have remained generally high at between 16 – 25%.14
Historical evidence shows that financial institutions as well as financial authorities in some developing countries use financial crises as an ‘excuse’ to justify their reluctance to adopt
13
Other challenges to the security in Nigeria are the ethno-sectarian conflict in the North and in the Middle Belt
14 CBN – Average Deposit and Lending Rates as at 11 June 2010

Financial Services Landscape in Nigeria
8
more inclusive financial policies. A review of the last five years rather than the last two or three years would be required to achieve a wider perspective on the efforts of the financial authorities in Nigeria to find the right balance between the often conflicting goals of stability, growth and access.
2.2.3 The matter of resource-rich economy and non-oil growth
There have been various arguments on the impact of the so-called Dutch Disease15 on the growth of non-oil economy in Nigeria. In most countries that are rich in oil, minerals and other natural resources, economic growth over the long haul tends to be slower than in most countries that are not. Of 65 countries (including Nigeria) that can be classified as natural-resource rich, only four managed to attain both (a) long-term investment exceeding 25% of GDP on average from 1970 to 1998, equal to that of various successful industrial countries lacking raw materials, and (b) per capita GNP growth exceeding 4% per year on average over the same period. These four countries are Botswana, Indonesia, Malaysia, and Thailand.16 However, this seems to be where the similarity stops because what tends to be important is what each natural-resource rich country does with its riches or what it does to avert the dangers that accompany the gift of nature. In Nigeria, recent work suggests another explanation for Dutch Disease, that is an abundance of natural resources leads to poorer governance and conflicts (according to a World Bank Private Sector Development Blog (PSD Blog), April 28, 2009). It gives rise to governments that are less accountable to the people, have little incentive for institution-building, and fail to implement growth enhancing reforms. Greater emphasis on institution-building and government accountability should help to counter the resource curse. Poor institutional infrastructure will impact financial inclusion policies as well as any other non-oil growth policies. The sheer size of Nigerian oil economy (it contributes over 90% of export earnings and constitutes a substantial part of overall government revenue) has provided easy business for DMBs on both sides of the balance sheet and it has been postulated as one of the reasons why DMBs have in the past had a lacklustre approach to taking financial services downmarket.
2.3 The profile of poverty in Nigeria
Nigeria experienced rising poverty levels during the 1980s and 1990s. The total poverty head count rose from 28.1% in 1980 to 65.6% in 1996 (the poverty head count is the proportion of the total population living below the national poverty line). During this period the urban poor rose from 17.2% in 1980 to 58.2% in 1996 and the rural poor rose from 28.3% to 69.3%. Between 1996 and 2004, however, the total poor declined from 65.6% to 54.4%. This
15
The traditional explanations of poor performance in oil-rich countries include the so-called Dutch Disease named after Holland’s poor record in managing its natural gas wealth in the 1960s. That is, revenue from natural resources hurts traditional manufacturing through an increase in the exchange rate; also, resources such as labour and capital need to be moved from manufacturing to natural resource production 16
Gylfason, T. (2001). Lessons from the Dutch Disease: Causes, Treatment and Cures. Institute of Economic Studies, Working Paper Series, August 2001

Financial Services Landscape in Nigeria
9
improvement was more evident in urban than rural areas (43.2% of poverty in the former and 63.3% in the latter).17
Table 2.2 provides the key data on poverty by sector and zones.
Table 2.2 Distribution of poverty in Nigeria (1980-2004) (Percentage of population)
Source: National Bureau of Statistics (NBS) 2004
The poverty problem in Nigeria is partly a feature of high inequality, which manifests in highly unequal income distribution and differing access to basic infrastructure, education, financial services and job opportunities. The Nigerian Gini coefficient is estimated at 0.429, which is very similar to most sub-Saharan African countries – Kenya 0.477, Cameroon 0.446, Senegal 0.396, Central African Republic, 0.436, to name a few. Significantly, it is much better than South Africa’s (0.576).18 But there are significant regional differences within Nigeria, as shown in Table 2.3 below, which also shows the negative effects of the economic stagnation period during the 1980s and 1990s as well as the positive impact of structural reforms carried out in the last decade. In this sense, it is particularly interesting to observe how the intra-region poverty gap has widened.
17
UNDP (2009) and (2010)
18 The Gini coefficient is a measure of inequality in a country's wealth distribution. It contrasts actual
income and property distribution with perfectly equal distribution. The value of the coefficient, or index, can vary from 0 (complete equality) to 1 (complete inequality). United Nations Development Programme (2009). Nigeria HDR

Financial Services Landscape in Nigeria
10
Table 2.3 Inequality by location and zone (1985-2004)
Source: NBS 2004
When exploring poverty and inequality in Nigeria, it is important to take into account that inequality is a multidimensional issue. Thus, economic, political and socio-cultural inequalities tend to be correlated with each other, as well as correlated with gender and location. Ethnicity, as mentioned below, reinforces this situation. The result is a kind of ‘poverty trap,’ a situation in which people experience long-lasting barriers to access and participation. Access to a range of services, including financial services, is a necessary condition for escaping from this poverty trap.
The determinants of poverty need to be understood in order to develop appropriate financial instruments and delivery channels for financial services for the low income groups. The literature suggests that there are four main determinants of poverty in Nigeria, namely education of household head, household size, occupation and area of residence. The more educated the household head, the less the probability of the household falling into poverty. In addition to this, the larger the size of the household, the larger the resources required to meet basic needs of food and other necessities. Area of residence is also an important determinant of poverty in Nigeria. Key studies suggest that being a rural dweller raises the probability of being poor. This has further implication for the occupational dimension of poverty – since most rural dwellers are likely to work in agriculture, this confirms that poverty is more prevalent among those who work in the agricultural sector.19 Those who work in agriculture are generally vulnerable to a range of external factors including weather and fluctuating prices for inputs and for outputs: they need specific savings and credit services to deal with these vulnerabilities.
It is important to note that, determinants of poverty vary when considered from a gender perspective. This is particularly relevant for the supply side study as many of the end users of financial institutions providing microfinance services are women. While gender gaps are particularly notable in access to education, household decision-making and political representation, lack of access to credit is also mentioned frequently as one of the main factors contributing to the perpetuation of gender inequality. This is reinforced by the lack of access to agricultural land and inputs (women do not inherit land in many Nigerian cultures),
19
UNDP (2010). Human Development Report Nigeria – achieving growth with equity. UNDP

Financial Services Landscape in Nigeria
11
and lack of access to justice (legal and social institutions have continued to widen the gender gap by keeping women in a subordinate position to men).20
Figure 2.2 shows the relationship between poverty and inequality from 1980 to 2005. The fact that they both move in the same direction suggests that as inequality deepened in Nigeria, the poverty situation has deteriorated further.
Figure 2.3 shows for the same period of time, the relationship between poverty and economic growth. They move in opposite directions, implying that as growth improves in the country, the incidence of poverty begins to fall.
Figure 2.2 Relationship between poverty and inequality (1980-2005)
Source: UNDP (2010)
Figure 2.3 Relationship between poverty and GDP growth (1980-2005)
Source: UNDP (2010)
20
United Nations Development Assistance Framework (2008) Nigeria UNDAF II 2009-2010. UNDAF, Abuja

Financial Services Landscape in Nigeria
12
From the standpoint of these relationships, poverty reduction may be achieved either by increasing growth or by reducing inequality, or both. There is considerable evidence worldwide that access to financial services contributes both to economic growth and to a reduction in inequality. Employment is usually identified as one of the key elements in the growth-poverty reduction nexus. The incidence of poverty in rural areas is much higher than in urban areas. Data from the National Bureau of Statistics (NBS) indicates that 68% of the rural poor are farmers. That means that increasing access to financial services for agriculture production will be important in reducing poverty levels.
Financial Services Landscape in Nigeria
13
3 The Financial Sector in Nigeria – the demand side
3.1 Access in Nigeria
According to the EFInA Access to financial services in Nigeria 2008 survey, the challenge that financial institutions face in Nigeria can be summarized as follows:21
• Only 1 in 5 Nigerian adults has a bank account
• Over half of the adult population (52.5%), equivalent to 46 million people, is financially excluded – that is, without recourse to any formal or informal financial products
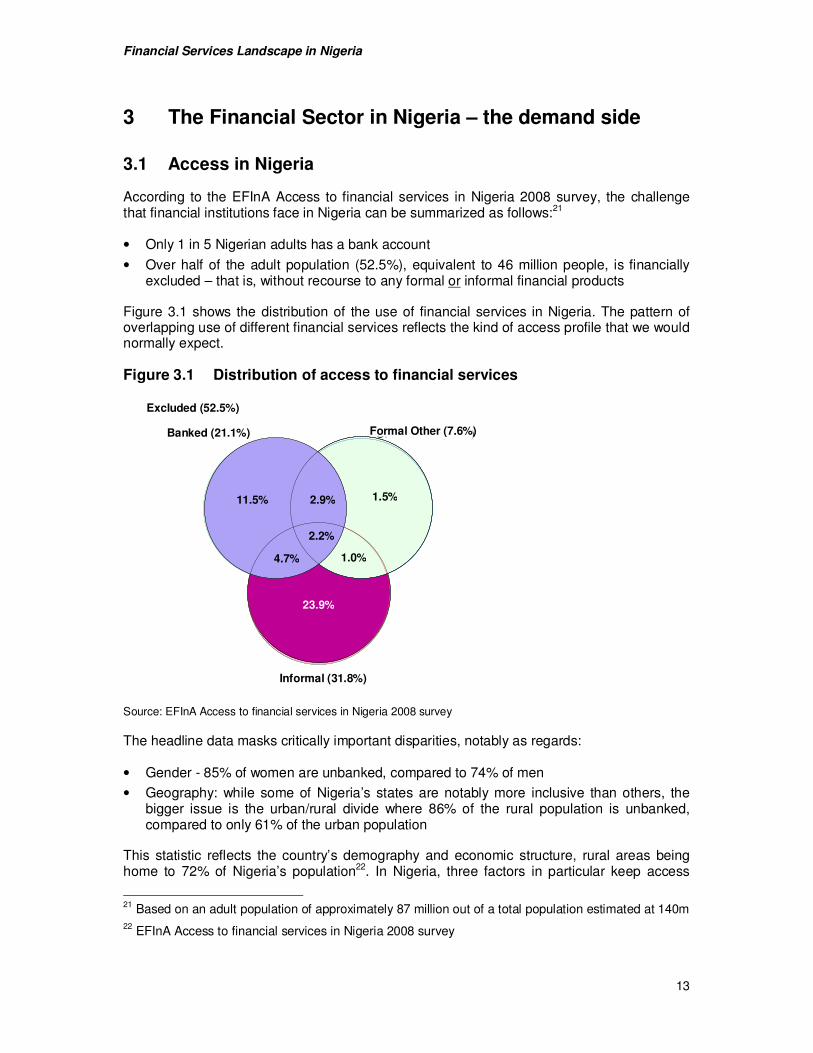
Figure 3.1 shows the distribution of the use of financial services in Nigeria. The pattern of overlapping use of different financial services reflects the kind of access profile that we would normally expect.
Figure 3.1 Distribution of access to financial services
Source: EFInA Access to financial services in Nigeria 2008 survey
The headline data masks critically important disparities, notably as regards:
• Gender - 85% of women are unbanked, compared to 74% of men
• Geography: while some of Nigeria’s states are notably more inclusive than others, the bigger issue is the urban/rural divide where 86% of the rural population is unbanked, compared to only 61% of the urban population
This statistic reflects the country’s demography and economic structure, rural areas being home to 72% of Nigeria’s population22. In Nigeria, three factors in particular keep access
21 Based on an adult population of approximately 87 million out of a total population estimated at 140m
22 EFInA Access to financial services in Nigeria 2008 survey
Banked (21.1% Other formal (7.6%)
Informal (31.8%)
Excluded: 52.5%
11.5%
4.7%
2.9%
2.2%
1.5%
1.0%
23.9%
11.5% 2.9%
2.2%
4.7%
1.5%
1.0%
23.9%
Informal (31.8%)
Formal Other (7.6%) Banked (21.1%)
Excluded (52.5%)

Financial Services Landscape in Nigeria
14
levels low in rural areas: (i) the challenge of providing cost-effective distribution across great distances, (ii) a much poorer customer base and (iii) an economy dominated by agriculture. A more detailed breakdown of access by demographic sub-groups is shown in Figure 3.2.
It should be noted that in Figure 3.2 and later access strand figures, the categories are mutually exclusive, with people included in the highest category in which they fall. Thus, for example, someone with access to both banked and other informal services will fall into the category of banked and will not be included in formal other (or in informal) even if they use such services. Those who have access to bank accounts or to other formal services are defined as formally served; the formally served together with those with access to informal services are defined as financially included. 23
Figure 3.2 Access to finance by demographic sub-groups
Source: EFInA Access to financial services in Nigeria 2008 survey
23 It is for this reason (as well as rounding) that some of the numbers in the Total access strand at the top of Figure 3.2 differ from those in the Venn diagram in Figure 3.1. Thus the 2% ‘other formal’ category in Figure 3.2 consists of those who are not banked but who use other formal services, which is 2.5% (1% + 1.5%) in the Venn diagram; the 24% in the ‘informal’ category in Figure 3.2 consists of those who are not banked and do not use other formal services but who do use informal services, which is 23.9% in the Venn diagram
21
39
14
27
15
14
24 25 25
22
21
22
14 8
26
34
25
9
33 29
13
15
24
19 26
22
26
19 26
26
28 26
21
30
23
21
24
20 27
21
20
23
19
19
53
40
57
49
57
65
48
46 45
51 56
46
60 68
47
44
47
67 45 46
68 62
0% 10% 20% 30% 40% 50% 60% 70% 80% 90% 100%
Total
Urban (28%) Rural (72%)
Male (52%) Female (48%)
Age group
18-24 (27%)
25-34 (27%)
35-44 (18%)
45-54 (14%)
55-64 (8%)
65+ (5%)
Geo-political Zone
North central (16%)
North East (13%)
North West (21%)
South East (13%)
South West (18%)
South South (20%)
Ethnicity
Hausa (24%) Yoruba (17%)
Igbo (15%) Fulani (2%)
Ijaw (4%)
Banked Formal Other Informal Financially Excluded

Financial Services Landscape in Nigeria
15
Almost 100 million Nigerians live below a poverty threshold of $1.25 a day.24 Analysis of EFInA’s Access to financial services in Nigeria 2008 survey data by income shows the correlation between income and banking status, with the proportion of people banked dropping away sharply where monthly income is N6,000 or less, as shown in Figure 3.3.
Figure 3.3 Access to finance – income related subgroups
Source: EFInA Access to financial services in Nigeria 2008 survey
As Table 3.1 shows, the proportion of banked respondents across different zones is in line with income distribution. It is clear from the table that wealthier areas have a higher proportion of banked people (see for example South South compared to North West). It should be noted that the level of refusals is high, at 32% overall.
Table 3.1 Income distribution in geo-political zones
Region No income
1001-3000
3001-6000
6001-13000
13001 - 20000
>20000 refused to answer/DK
Total
North Central 10 12 12 14 8 10 34 100
North East 12 13 15 16 9 10 26 100
North West 13 21 17 14 8 6 19 100
South East 8 10 11 11 7 8 44 100
South West 7 7 10 10 8 8 48 100
South South 10 8 10 13 10 11 39 100
Total 10 12 13 13 9 9 35 100
Source: EFInA Access to financial services in Nigeria 2008 survey
24
UNDP/UNCDF figure cited in Access to Finance in Nigeria (World Bank, 2009)
21
10 7
13
21
39
64 17
34
28
71
15
24
21
28
30
31
25 13
21
23
23
11
26
53
67
62
52
45
34
20 61
40 47
16
57
0% 20% 40% 60% 80% 100%
Total
Monthly Income
No income or less than 1000 (10%)
1001-3000 (12%)
3001-6000 (13%)
6001 - 13000 (13%)
13001 - 20000 (9%)
>20000 (9%)
Refused to answer/ DK (35%)
Possession of National ID card
Yes (39%)
No (61%)
Salary regular source of income
Yes (11%)
No (89%)
Banked Formal Other Informal Financially Excluded

Financial Services Landscape in Nigeria
16
A variety of reasons are given by the unbanked for not having a bank account, as shown in Figure 3.4.
Figure 3.4 Reasons for not having a bank account (% of adults)
Source: EFInA Access to financial services in Nigeria 2008 survey
In common with other markets, Figure 3.4 shows that demand side constraints (‘I don’t have enough money’, ‘I don’t have a regular income’) dominate the reasons why people do not have a bank account. But physical distance and affordability play their part too – 24% say they do not have a bank account because the bank is far away, while 16% say that it is expensive to have a bank account. 10% also cite the cost of transport to the bank as a deterrent. Interestingly, 11% of people living in urban areas also consider the bank is too far away. While physical distance from a bank is not the main reason why people do not bank – even in rural areas, only 28% say they do not bank because the bank is too far away – it has important implications for promoting access through the various branchless banking models currently being developed in many countries, like Brazil (agent banking), or the Philippines and Kenya (mobile banking).
These issues are extremely important because these demand-side barriers constrain the capacity of individuals to access available services and products. Other demand-side barriers affecting customers in Nigeria may include socio-economic and cultural elements, challenges posed by the lack of formal identification systems, ability to track an individual’s financial history, low levels of financial literacy, and the absence of appropriate consumer protection mechanisms.
The EFInA Access to financial services in Nigeria 2008 survey also highlighted the important and related issues of the effectiveness of deposit money banks’ communication with the customers (a supply side constraint), and financial literacy in general (a demand side constraint but with clear implications for suppliers’ communication strategies). While 9% appear to have made a conscious choice not to bank (‘I prefer dealing in cash’), 11% say they ‘have never thought about it/have no need for it’ and a therefore may never have

Financial Services Landscape in Nigeria
17
considered the benefits of an account. 12% (i.e. 10m adults) say they don’t know how to open an account and 14% say they don’t have enough information about bank products and services. These figures suggest the need for a much greater effort on the part of the banking industry to communicate the benefits of banking to the unbanked and underbanked population.
Financial literacy data confirms that knowledge of even very basic terms like ‘savings account’ or ‘insurance’ or ‘Automated Teller Machine (ATM)’ is poor, across all age groups. Not surprisingly, newer concepts like ‘mobile banking’ are less well understood (78% have never heard of this term).
Figure 3.5 shows the usage of financial products in Nigeria among the currently banked population: the product with highest penetration is savings accounts.
Figure 3.5 Usage of financial products
Source: EFInA Access to financial services in Nigeria 2008 survey
In common with many other African markets, insurance penetration (at 2% of the adult population) is extremely low.
Where penetration of formal financial services is low, it is to be hoped that informal services fill the gap. But, in fact, usage of informal products at 24% is only slightly higher than usage of formal products at 23%.
Trust in informal savings-type associations is also not as high as might be expected – 38% do not trust them. In any case, there is a relatively higher involvement in informal savings by female consumers as opposed to their male counterparts who are more inclined to use formal methods due to trust issues.25
There is some cause for optimism in the generally disappointing picture on access. Most obviously, this comes through in the data on mobile phone access and usage, both of which,
25
EFInA - Savings mobilization in Nigeria: scoping study on informal savings in Lagos, 2009

Financial Services Landscape in Nigeria
18
are at almost half the population and growing. 25 million people who do not have a bank account have access to mobile phones, which augurs well for mobile-enabled branchless or mobile payments initiatives in the future, assuming service providers are effective at marketing these products, as suggested above.
3.2 International comparisons
In the absence of trend data from Nigeria26 we can derive useful insights by comparing Nigeria’s state of access with other countries in Africa. FinScope access strands provide a robust basis of comparison (see Figure 3.6). 27
Figure 3.6 Comparisons of access strands
Source: FinMark Trust (February 2010)
The strands essentially separate into two groups, the more formalised middle income countries of southern Africa, and the rest. Nigeria is close to the top of the lower income country group, bettered only by Kenya, which benefits from a higher percentage banked and a more vibrant informal sector but also the widespread use of the M-PESA product, captured under Formal Other. In aggregate, therefore, a far smaller percentage of Kenya’s adult population is excluded, compared to Nigeria, which has a percentage of excluded broadly similar that of to Malawi, Tanzania and Rwanda, whose average GDP per capita is less than half of Nigeria’s.28
While Nigeria’s banked population should arguably be bigger, given the size of its banking industry (as we have suggested above), the very small percentage of Formal Other is worthy
26 EFInA is preparing a repeat of the survey with the results due in Quarter 4, 2010
27 Although the Nigerian survey is known as EFInA Access to financial services in Nigeria and Kenya’s
equivalent is called FinAccess, the methodology in both is the same as in the other 12 countries where FinScope surveys have been conducted
28 From IndexMundi (referencing CIA World Factbook): PPP US$, accurate as at 1 January 2009
60
45
41
23
21
19
18
15
14
12
12
4
2
18
18
2
7
3
12
7
4
1
10
2
8
27
24
19
17
12
26
27
10
26
52
33
33
53
55
62
62
52
56
78
RSA '09
Namibia '07
Botswana '09
Kenya '09
Nigeria '08
Malawi '08
Uganda '06
Zambia '05
Rwanda '08
Tanzania '09
Mozambique '09
Banked Formal Other Informal Financially Excluded

Financial Services Landscape in Nigeria
19
of note. This segment of the strand captures non-bank formal (i.e. regulated) financial services such as microfinance banks, insurance, etc.
The strands are therefore useful not just as a league table (which tends to draw attention to the percentage banked) but as a guide to the institutional composition of access within the country – in other words, whether access is delivered through formal or informal means. The indicators provided by the strand (e.g. percentage banked, percentage formally served, etc) are critical elements in setting the vision and policy framework for financial access.

Financial Services Landscape in Nigeria
20
4 The Financial Sector in Nigeria – the supply side
4.1 Introduction
This chapter describes Nigeria’s financial sector with a particular focus on the characteristics of the sector that relate to access and financial inclusion. The chapter draws on a range of sources, including a review of existing literature, an analysis of sector and institutional data where available, and the survey interviews of the institutions listed in Annex A.
The financial sector in Nigeria includes a range of institutions offering a wide range of services such as savings, credit, currency exchange, microfinance, consumer lending, SME lending, mortgages and other products. The formal financial sector institutions regulated by the CBN are listed in Table 4.1
Table 4.1 CBN regulated financial institutions
Category Number
Deposit Money Banks 24
Microfinance Banks 901
Development Finance Institutions 5
Bureaus de Change (including 50 Class A) 126
Finance Companies (Non Bank Financial Institutions) 112
Primary Mortgage Institutions 98
Discount Houses 5
Source: CBN (2010)
In addition, the Nigerian financial system consists of 51 insurance companies, 25 pension fund administrators, 6 closed pension funds and 4 pension custodians and many capital market players including stock broking firms, investment banking and asset management houses (non-bank) and several Microfinance Institutions (MFIs).
The following sections focus on the evolution of the financial sector in the past 5 years and the challenges it faces.
4.2 Banking industry consolidation and other recent developments
There are three distinct phases of recent banking development in Nigeria: pre-consolidation (period up to December 2005), post-consolidation (from January 2006 to August 2009) and post-consolidation ‘reality check’ period (after August 2009 to date).
Before the consolidation, overall costs for the industry were high due to the relatively modest size of many of Nigeria's deposit money banks, each with expensive head offices, separate investment in Information, Communications and Technology (ICT), substantial fixed costs and operating expenses and with branches in a few commercial centres – mainly Lagos, Ibadan, Port-Harcourt and Kano. During the pre-consolidation period, the fundamental problems facing smaller banks were persistent illiquidity, poor asset quality and generally

Financial Services Landscape in Nigeria
21
unviable operations. The three tiers of government (federal, state and local) and parastatals accounted for over one fifth of total deposits and in some instances this ratio was almost 50%. Government funds made deposit money banks highly vulnerable to fluctuations in the global oil market and encouraged an unhealthy focus on Forex and Treasury bill trading, providing little, if any, benefit to the real economy (Siddiqi, 2005).
The consolidation process in the Nigerian banking industry reduced the number of deposit money banks operating in the country from 89 in 2004 to 25 in January 2006. This consolidation was the result of the CBN's decision in July 2004 to raise the minimum capital for all deposit money banks to N25 billion (US$204 million). In 2007, Stanbic Bank, Nigeria merged with IBTC Chartered Bank to reduce the number of DMBs to 24. The CBN reports that over US$1 billion of foreign investment has been made in the industry, and that total capitalization of the banks increased in these years from N293 billion (US$2.5 billion) to over N1.1 trillion (US$9.4 billion). The number of branches increased substantially during the period 2005 to 2009 from 3,357 to 5,13429 in the domestic market and from 40 to 70 branches/subsidiaries in foreign markets.
The post-consolidation ‘reality’ period began in August 2009, following a special audit that led to the removal of management of 5 DMBs – Union Bank, Afribank, Intercontinental Bank, Oceanic Bank and FinBank – which together accounted for 40%, 30% and 31% of banking industry total loans, deposits and assets, as at May, 2009.30 Three additional banks – Bank PHB, Spring Bank and Equatorial Trust Bank – were later added to the list. A total N620 billion (over US$4 billion) was injected into these eight banks to boost liquidity and prevent systemic crisis31. The reasons adduced for these drastic steps included: loan concentration; excessive exposure to margin loans exacerbated by the capital market crash; oil and gas trading that was badly affected by the decline in international oil prices leading to deteriorated asset quality; which led to the need for huge loan loss provisions and capital erosion. As at September 2009, 12 of the 14 banks declared healthy by the CBN had over N262 billion in non-performing loans (NPLs). The CBN reported in December 2009 that the total NPLs of the eight rescued DMBs were N1.52 trillion (which was 61% of the industry’s total NPLs).
Thus the financial soundness of the banking industry and its ability to provide the much needed intermediation for economic growth and financial access will be assessed from the post-consolidation period up to 2008 and ‘reality’ period after August 2009. This is because it is necessary to study the historical evolution of the financial reforms in Nigeria in order to understand how those reforms have impacted on the sector (including their unintended consequences) in order to make appropriate recommendations on the direction of future reform.
From the financial soundness indicators presented in Table 4.2, from 2006 to March 2009, the Nigerian banking industry would have been judged to be quite sound with robust capital adequacy, asset quality, earnings and liquidity. But those indicators were based on returns made by DMBs to the CBN and it is now clear from the revelations of August 2009, that some of this information must have been misleading.
29
Making Finance Work for the Poor, Convocation Lecture by Prof. C.C Soludo, Governor, CBN, 15 Feb 2008
30 Address by the Governor of the Central Bank of Nigeria, 14 August 2009
31 Op cit

Financial Services Landscape in Nigeria
22
Table 4.2 Financial soundness indicators, 2006 -2009
(Per cent except otherwise stated)
2006 2007 2008 200932
(March)
Capital Adequacy
Regulatory capital to risk weighted assets 22.8 21.0 21.9 21.5
Capital (net worth) to assets 14.7 16.3 18.0 18.4
Asset Quality
Non performing loans to total gross loans 8.8 8.4 6.3 6.6
Non performing loans net of loan – loss provision to capital 21.3 22.7 16.8 5.5
Earnings & profitability
Return on assets 1.6 2.1 4.0 1.8
Return on equity 10.4 13.1 22.0 10.0
Int. margin to gross income 39.6 40.8 39.4 39.8
Non int. expense to gross income 52.7 46.0 43.1 45.5
Personnel expenses to non int. Expenses 42.7 44.2 42.1 44.3
Trading & fee income to total income 33.3 30.0 12.9 13.1
Liquidity
Liquid assets to total assets 32.5 32.1 28.1 20.4
Liquid assets to total deposits 63.7 62.6 54.2 38.4
Customer deposits to total (non- inter bank) loans 73.7 85.8 117.4 116.3
Foreign currency denominated liabilities to total liabilities 12.5 5.7 6.6 7.1
Source: CBN (In IMF Country Report No 09/315, November 2009)
In early 2010, the Governor of the CBN announced the introduction of a ‘new banking model,’ marking the end of universal banking in Nigeria. Under the new model, distinct activities – such as retail banking, investment banking, insurance etc. – can no longer be undertaken within a single company. Separate companies will need to be established for each type of activity, under an appropriate holding company structure. The details are still being finalised, but all the deposit money banks interviewed said they could adjust to the new model without significant detriment to their business.
4.2.1 Growing financial intermediation but substantial financial exclusion
The post-consolidation period between 2006 and 2008 was marked by a substantial increase in intermediation. As at 2005, bank lending to the private sector amounted to 21% of GDP and this jumped to 50% by end of 2008 as DMBs were under pressure to provide returns on the increased capital.33 Most of the increased lending went to finance infrastructure projects,
32
Reflects bank data available prior to the special audits of banks balance sheet by the Central Bank
33 These figures should be taken only as indicative, as there are inconsistencies between the various sources

Financial Services Landscape in Nigeria
23
and oil and gas transactions.34
However, other funds went into unsecured margin loans to finance purchase of shares in the capital markets. This led to a massive stockpile of ‘toxic assets’ when the domestic stock market crashed, for which the CBN is setting up an Asset Management Company (the President of Nigeria signed the AMC bill into law on July 19, 2010).
Comparing the historical trend of bank credit to the private sector in Nigeria with that of other developing economies explains why the country’s real development and poverty alleviation has been slow. Literature reviewed suggested that traditionally, intermediation in Nigeria showed much higher concentration of government borrowing relative to GDP.35 We also found that most of the lending to the private sector went to bigger companies and less to small businesses and individuals. In addition, there were high interest rates and short loan maturities which together made credit less easily accessible by small businesses and individuals. Although post-consolidation reform has contributed to improve this, compared to other developing countries intermediation is still highly skewed towards the public sector. For example in South Africa as shown in Table 4.3, private sector credit/GDP was 84.2% and 92.1% in 2006 and 2007 respectively compared to 21.5% and 31.4% in Nigeria.
Table 4.3 Bank credit relative to GDP (%) – country comparisons (2003-2007)36
Country 2002 2003 2004 2005 2006 2007
Benin 11.4 14.2 14.6 16.3 17.0 16.9
Egypt 52.1 58.7 50.7 48.3 45.9 42.4
Morocco 48.5 49.3 50.3 54.4 59.4 60.7
Nigeria 18.4 20.5 21.0 21.9 21.5 31.4
Tunisia 64.2 66.7 65.1 65.0 64.2 63.0
South Africa 62.4 69.1 70.0 75.2 84.2 92.1
Source: Fitch Ratings, Bank Systemic Risk Report, September 2007
Other reasons adduced for limited access to financial services include:
• Laxity in regulation that was (partly) responsible for bank failures in the past and emergence of ‘wonder’ (unapproved) ‘banks’ leading to loss of money (and thereby confidence in the financial sector) by unsuspecting depositors, mainly individuals
• Low interest rates on savings relative to inflation
• Low real income levels leading to higher cash holding
• Lack of credit reference mechanisms, e.g. credit bureau (until recently)
• Legal loopholes being exploited by defaulters
• Shortage of qualified manpower in the sector
34
IMF Country Report No. 09/315, November 2009 35
King, D. (2003). Nigerian Financial Sector Assessment Report. USAID/Nigeria 36
There are inconsistencies in the figures for 2007 with the official figures cited in section 2.2.1 above

Financial Services Landscape in Nigeria
24
• High level of risk aversion due to policy-induced market disequilibrium as described in Section 5.1.4
Other examples of the very challenging context for the Nigerian financial sector are:
• The NDIC’s 2008 Annual Report revealed that 313 bank staff of various categories stole a staggering N53 billion in the year 2008 and the number of bank staff involved in stealing increased by 14.65% from 2007. NDIC identified the causes of the theft as institutional or internal factors such as poor accounting, weak internal control systems, ineffective supervision of subordinates, uncompetitive remuneration and a perceived sense of inequity in reward as well as environmental or external factors, such as low moral values, slow and tortuous legal process, lack of deterrence for potential fraudsters and fear of negative publicity by the deposit money banks, leading to failure to report fraud cases to the authorities for prosecution
• In December 2009, Nigerians who claimed to be victims of unauthorised ATM withdrawals filed a N50 billion suit against all 24 deposit money banks, Interswitch, as well as the CBN, at the Federal High Court in Lagos
• There are increasing reports of bank robbery, which forces DMBs to remain confined to secured locations
• Fraudulent practices amongst some bank officials have also created opportunities for the informal operators to thrive in money remittances. One such operator confided to 234 Next ‘Apart from the huge bank charges, there have been instances where some dubious bank officials collect the password, prepare an identity card for somebody else and they collect your money’37
• The previous MD of the Nigeria Deposit Insurance Corporation (NDIC), Mr Ogunleye noted that the creditor rights mechanism requires a drastic overhaul through appropriate legislation. The procedures for taking and enforcing collateral are inefficient as debtors easily frustrate creditor banks by abusing the judicial process. The Corporation has come across debtors who would prefer to engage solicitors that would protract cases in court for many years rather than making effort to resolve their debt obligations
Available market information for the post-consolidation ‘reality’ period has indicated that access to finance has actually worsened as deposit money banks have taken a ‘flight to safety’ by drastically cutting down on lending to the private sector, more especially individuals and small enterprises, in preference to government lending through very large investments in government securities.
4.2.2 Financial System Strategy 2020
The Government of Nigeria has set out an ambitious national development strategy called Vision 2020: ‘By the year 2020 Nigeria will be one of the 20 largest economies in the world able to consolidate its leadership role in Africa and establish itself as a significant player in the global economic and political arena.’38 To achieve this vision, the country needs to maintain an annual average growth rate of 12.4% during 2005-20. The need for a robust and vibrant financial system that will power the economy was recognised in the Financial System Strategy 2020 (FSS 2020), adopted in September 2007, which is an integral part of Vision 2020. It is the financial sector element of the Vision 2020 strategy, and the CBN is represented on both the National Council and the National Steering Committee for Vision
37 http://234next.com/csp/cms/sites/Next/Money/5455551-147/story.csp, accessed on July 2010
38 http://www.nv2020.org/ accessed on July 2010

Financial Services Landscape in Nigeria
25
2020. To drive rapid and sustainable economic growth in Nigeria, a three pronged strategy was adopted: strengthening domestic financial markets; enhancing integration with external financial markets; and engineering Nigeria’s evolution into an international financial centre.39 FSS 2020 is a comprehensive long term strategic plan to address the problems in the financial sector through key reforms in order to spearhead growth and stability in the sector. It remains the government’s fundamental strategy for the financial sector with SME finance,
microfinance and branchless banking as key aspects of the strategy.40
The banking crisis of 2008-10, coupled with the change in the Governorship at the CBN in 2009, meant that the FSS 2020 strategy took a back seat for a while. Furthermore, there is currently a lack of consensus among the stakeholders involved in the FSS 2020 about the scope of the programme and the institutional or management arrangements and as a result the full reform programme, including its access-related components, has not yet been initiated.
4.3 Regulatory framework
An appropriate enabling environment is crucial to the expansion of access to financial services, including the regulatory framework that determines that environment. The main statutory regulatory institutions are: the CBN, the Securities and Exchange Commission (SEC), the Nigerian Insurance Commission (NAICOM) and the National Pension Commission (PenCom), together with the Nigerian Stock Exchange.41 Others including the Nigerian Deposit Insurance Corporation (NDIC), Investment and Securities Tribunal, the Debt Management Office, and the main professional bodies/associations, e.g. Money Market Association, Chartered Institute of Bankers, Association of Issuing Houses and Chartered Institute of Stockbrokers, provide additional regulatory support and assist in enforcing market discipline amongst respective professional members and market participants.
The regulatory framework is schematically indicated in Figure 4.1. The statutory regulatory institutions regulate respective individual operators, including products they issue and also authorize individuals through their sponsored functionalities. They license, make rules and regulations, supervise and sanction breaches. The Financial Services Regulation and Coordinating Committee (FSRCC) is a non-statutory body that was set up to provide top level forum through which the five statutory regulators meet quarterly with a view to preventing regulatory arbitrage.
39
The Nigerian banks have historically been marginal or fringe players within international and regional markets. The total assets of the South African giant, Standard Bank Group ($109.33bn) were 4.5 times those of the Nigeria’s deposit money banks combined
40 Central Bank of Nigeria, (2007) ‘Financial System Strategy 2020’ available online at
http://www.cenbank.org/OUT/SPEECHES/2007/GOVADD18-4-07.PDF
41 Although the Nigerian Stock Exchange is a not a statutory body, it has regulatory functions
delegated to it by the SEC

Financial Services Landscape in Nigeria
26
Figure 4.1 The structure of the FSRCC
FSRCC
NAICOM PENCOMSECCENTRAL
BANK
Banks
Microfinance banks
Mortgage banks
Discount houses
DFIs
Pension
functionalities
InsuranceCapital and
Securities
Markets
Support, Market Discipline, Information Sharing, Professional Membership
Bankers Committee
Mortgage Banks Ass.
Chartered Inst. of
Bankers
Money Market Ass.
Ass. of Pension
Fund Administrators
Chartered Inst.
of Insurance
Investment &
Securities
functionalities;
Issuing Houses Ass.
Chartered Inst. of
Stockbrokers
NDIC
Deposit
insurance
Table 4.4 summarises recent regulatory initiatives aimed at improving access to financial services in Nigeria.
Table 4.4 Regulatory initiatives to improve access to financial services
Land Use Act Amendments have been proposed to ease the requirement to obtain the State Governor’s approval to create security interest in land.
42
Securitization & Collateralization Bill This bill, which would create a collateral assets registry, was proposed
in 2007 and is still pending. Such a registry would help to eliminate the use of a single asset as collateral for multiple loans.
Guidelines for the Licensing, Operations and Regulation of Credit Bureaus in Nigeria
In October 2008, credit bureau guidelines were enacted.43
While implementation is still in the early stages, a number of experts stated that they felt that a credit registry could play an important role in expanding access to finance by reducing information asymmetries and the cost of doing business in rural areas.
42
Kris Muo, Secretary, Financial System Strategy 2020 Legal Implementation Committee (July 12, 2010)
43 See CGAP, Access to Finance in Nigeria, p42

Financial Services Landscape in Nigeria
27
Digital Storage & Electronic Transactions Bill
This Bill was drafted by the FSS 2020’s Legal Implementation Committee and submitted to the National Assembly for consideration. If enacted, this Bill would facilitate e-commerce by providing legal recognition to electronic transaction data and records.
44
Leasing Bill As of early 2009, a Leasing Bill had been passed by National Assembly, but not yet signed into law.
45
Bankruptcy Act The current bankruptcy legal framework is in the process of being reviewed.
46
4.4 Deposit Money Banks (DMBs)
As described in section 4.2, Nigeria’s banking industry experienced a major transformation in 2004 resulting from the CBN recapitalisation programme, a radical initiative that resulted in the number of banks in Nigeria shrinking from 89 to 25 in January 2006. The number of banks has now reduced to 24 following the merger of Stanbic Bank and IBTC Chartered Bank. These 24 DMBs are the dominant operators in the financial sector: they are licensed to offer all banking and financial services directly or through subsidiaries. The banking recapitalization and consolidation policy resulted not only in a lot of mergers and acquisitions, but also in a diversification of the banks’ ownership base, with a substantial dilution of large individual and government control. The asset base of the DMBs in Nigeria was N14.795 trillion at the end of 2009.
4.4.1 Types of DMB
In 2008, the International Monetary Fund (IMF) classified the 24 deposit money banks into four groups as follows: 47
• Group 1 comprises: DMBs that achieved the capital threshold mostly on their own and may have also consolidated long established affiliates and acquired one or two smaller banks. Group 1 banks, therefore, have significant advantages in terms of franchise and a large resource base. They are First Bank, Union Bank, Intercontinental Bank, Oceanic Bank, Zenith Bank, GTBank and UBA
• Group 2 constitutes: DMBs that achieved the capital threshold by merging through voluntary partnerships. They are Access Bank, Diamond Bank, Ecobank, ETB, Fidelity Bank, IBTC-Chartered Bank,* Bank PHB, WEMA Bank and Afribank
44 Kris Muo, Secretary, Financial System Strategy 2020 Legal Implementation Committee (July 12, 2010) 45
See CGAP, Access to Finance in Nigeria, p64 46
Kris Muo, Secretary, Financial System Strategy 2020 Legal Implementation Committee (July 12, 2010)
47 IMF, Nigeria: Article IV Consultation – Selected Issues, February 2008. Nigerian DMBs have been
grouped in a number of ways; we consider that the criteria that best reflects the current situation of the market is the one used by the IMF, which is based on the way that banks have achieved their capital threshold. However, this classification must be taken with some caution as it does not reflect some of the changes that have taken place in the banking industry in the last couple of years. For example, it is important to note that Stanbic Bank and IBTC Chartered Bank have merged and the injection of N620 billion (over US$4 billion) into eight banks in 2009 to boost liquidity and prevent systemic crisis has altered the composition of the capital

Financial Services Landscape in Nigeria
28
• Group 3 comprises: DMBs that achieved the capital threshold through four or more banks partnering out of necessity – First City Monument Bank, FinBank, Skye Bank, Spring Bank and Unity Bank
• Group 4 constitutes: DMBs with majority or wholly foreign ownership - Citibank, Stanbic Bank* and Standard Chartered
Note: * Stanbic Bank and IBTC Chartered Bank have merged to become Stanbic IBTC Bank
The consolidation process resulted in major structural reforms in the structure of the market, with the top ten DMBs now accounting for approximately 75% of the banking sector.48 The top seven DMBs account for a substantial part of this in terms of assets and market capitalization. With these developments, the size classification by IMF has shifted significantly. Given the predicament of Union Bank, Intercontinental Bank and Oceanic Bank, a number of second tier banks have subsequently aggressively targeted growth and may have moved up the ladder.
As described in the introduction, the three key dimensions of financial inclusion are that financial services should be accessible, affordable and appropriate. We therefore consider in turn the branch network, the costs of bank services, how DMBs segment their clients and the range of products.
4.4.2 Bank branch network
Some of the DMBs surveyed in the course of this study are pursuing an aggressive branch expansion strategy as a means of reaching out to more customers. However, the distribution of branches is extremely uneven, with a greater concentration in the southern states, as shown in Figure 4.2. The highest concentrations of bank branches of over 25 branches per million inhabitants are in Lagos (56) and Abuja (33). Most of the northern states have less than 6 branches per million inhabitants while the South West and Central states have 6-8 branches per million inhabitants.
48
According to Agusto & Co – leading bank rating agency in Nigeria

Financial Services Landscape in Nigeria
29
Figure 4.2 Branches per million inhabitants of selected banks, by state49
Source: OPM analysis of surveyed deposit money banks
As indicated in section 3.1 above, physical access to bank outlets is clearly a problem for many people: 24% of those who do not have a bank account give as their reasons that the bank is too far away, and 10% that it costs too much to reach a bank. There is therefore clearly a major problem of access in most of the states of the North West and North East, and in states such as Niger, Nassarawa, Taraba and Bayelsa that have less than 8 branches per million inhabitants.
4.4.3 Affordability and the cost structures of banks
Although, as shown in Figure 3.4 above, only 16% of people without a bank account indicated that it is expensive to have a bank account, 48% gave reasons related to not having enough money and 38% related to income, both of which have a dimension of affordability. The issue of affordability is discussed in detail in section 5.3, but the question that needs to be addressed in this section is the extent to which the cost structures of the
49
The map shows the distribution of branches of six of the large DMBs covered in the current study: Diamond Bank, First Bank, GTBank, Intercontinental, Stanbic IBTC and UBA. These were the only six banks among the 12 interviewed for which full branch data were available, but we believe from the interviews that the pattern is consistent with the distribution of bank branches on aggregate

Financial Services Landscape in Nigeria
30
deposit money banks will enable them to develop more affordable, basic bank accounts for low income people.
Figure 4.3 below has as its horizontal axis the average income earning assets per employee at seven of the DMBs interviewed in this survey plus Access Bank.50 The vertical axis shows operating costs per employee.
The dotted lines show the relationship of a bank’s operating costs to its assets: thus if a bank’s annual costs are N20 million per employee and its income earning assets are N400 million, then the annual costs are 5% of the assets and the bank falls on the 5% line. At the other extreme, if the costs are N20 million and the assets are N100 million, then the costs are 20% of the assets and the bank falls on the 20% line. The reason for using this ratio, even though it compares a flow (P&L) number with a stock (balance sheet) number is that it shows the relative cost of managing the assets, whether the bank has high or low assets per employee. The bubble size in Figure 4.3 denotes the number of branches that each bank has.
There are thus two elements of affordability: firstly, does a bank appear in the high balance (high cost, high assets) segment of the graph or are they in the low balance (low cost, low asset) segment, which would enable them to service low balance bank accounts. Secondly, are the banks inefficient (around the 20% line) or do they have a low cost to asset ratio (around the 5% line) which would enable them to profit from servicing low balance bank accounts?
Figure 4.3 Costs and assets per employee in Nigerian banks
Access
Diamond
First Bank
Intercontinental
Stanbic
UBA
WEMA
Skye
0
5
10
15
20
25
0 50 100 150 200 250 300 350 400 450 500
Interest earning assets per employee (Million N)
Op
era
tin
g c
osts
per
em
plo
yee (M
illio
n N
)
Source: OPM Analysis of bank Annual Reports (2010)
50
The seven were the only interviewed banks for which the full financial and employee data were available to construct this chart.
Low balance segment
Financial Services Landscape in Nigeria
31
The blue circles are based on the 2009 accounts and the red ones on the 2008 accounts. It is also important to mention that the figures for Diamond Bank are adjusted to allow for the change in year end in 2009 (it published accounts for 8 months ended 31 December 2009).
For purposes of comparison, two banks noted for their success in expanding access to finance are also shown on the graph (using 2009 year end exchange rates): Equity Bank Kenya, a fairly efficient low cost, low asset bank, with 5 million customers and ABSA Bank in South Africa, an extremely efficient but relatively high cost high asset bank.
Four DMBs, i.e. Diamond Bank, First Bank, Stanbic IBTC Bank and Skye Bank, clustered together, are relatively efficient with costs per employee (between 6% and 8%) comparable with ABSA. Given the impact of the financial crisis of 2008, it can be assumed that UBA (whose 2008 figures are used here) would also be in that cluster in 2009, and possibly Intercontinental – though as we have noted in section 4.2 that the 2008 accounts may be unreliable. This cluster is positioned between ABSA and Equity Bank, and it would not present insurmountable difficulties for them to move at least part of their business, to the low cost, low asset segment to serve low income customers with basic, low cost savings accounts.
The outliers in Figure 4.3 are Wema Bank and Access Bank. Wema Bank’s high operating cost per employee may be connected with a series of long drawn internal board conflict and leadership succession problems with massive litigation and apathy in the market during the period. Wema Bank originally had a large government ownership with substantial political influence in its day to day management until the bank’s recapitalization policy reversed that position. The bank’s staffing situation, however, remained unfavourable until the CBN mandated the bank to recapitalize, following the result of the corrective bank examination carried out in September 2009. Though the bank did not benefit from the bailout package, it was given a nine month period to recapitalize or lose its license. Access Bank, though very efficient, with a 5% cost to asset ratio, is at the very high cost-high asset end of the market, seeking relatively big-ticket business. Although Access Bank was not interviewed in the survey, it is included in Figure 4.3 for purposes of comparison, as an efficient bank with a low (4.9%) cost to asset ratio but in the high costs and assets segment.
4.4.4 How deposit money banks segment their clients
In order to assess the appropriateness of DMB services, it is necessary to understand how banks segment their clients. The segmentation is also important because the management structure of banking operations is usually based on it, and the ability of each division to call upon the resources of the bank and the attention of senior management is determined by the perceived importance, or potential importance, of a segment to the bank’s business as a whole.
All of the DMBs interviewed segment their customer base between retail and corporate clients (which some divide in turn between national and multinational corporations).51 Virtually all DMBs classify MSMEs as part of the retail segment – though in some cases there is a separate team managing MSME relationships within the retail division. Retail accounts (including MSMEs) constitute 70-90% of the number of accounts for most banks, though the retail accounts are much smaller and therefore account for a smaller proportion of
51
The classification of firms between corporate and retail/MSME is often on the basis of turnover of the firm. Diamond Bank, for example, says in its 2009 Annual Report that a firm is classified as retail rather than corporate if its turnover is less than N1.2 billion a year – though in practise the level of borrowings is also taken into account

Financial Services Landscape in Nigeria
32
revenues and profits (between 6% and 30%, compared to 70-85% for corporates – the balance being activities like investment banking, insurance etc).52
For many DMBs, MSMEs constitute a major part of the retail business. Within MSMEs, a breakdown of the number of accounts would typically be around 70% micro, 25% small and 5% medium sized businesses. At the microenterprise level it is of course very difficult to distinguish between personal and business banking – as a microentrepreneur does not normally make distinctions between household and business finances.53
When it comes to cards and smart cards a rather different classification applies, based on card usage. Interswitch, for example, provides payment switching and processing for deposit money banks and some larger MFBs.54 They segment the card market into super-premium, global, ‘glocal’ and the low-end mass market, or ‘bottom of the pyramid,’ as shown in Figure 4.4.
Figure 4.4 Segmentation of the card market
Source: Interview with Interswitch
52 Most banks classify public sector clients as ‘corporate’ though some classify them separately, particularly those focused on the high-end market, like Access Bank
53 A typical example would be a civil servant who has a business on the side, where salary, business
finances and household expenses are all run through the same bank account
54 Interswitch runs a domestic card scheme that provides support for locally branded prepaid/cash
cards. In 2002, Interswitch developed its standard cards, mainly for prepaid transactions. This has evolved into the Verve brand which is the acceptance mark for Interswitch in Nigeria

Financial Services Landscape in Nigeria
33
4.4.5 The appropriateness of DMB products
We also need to find out which products are appropriate to the general population. Do people have the information they need to make their choices? If not, is this because banks are unsuccessful at disseminating it, or are they just not trying to reach out to this market?
Savings products are mainly generic in the sense that all the sampled DMBs have two main savings products: (a) regular savings accounts to keep idle cash, from which withdrawals can be made as the customer wishes; and (b) special savings products mostly targeted at specific activities or events, i.e. meeting a time bound social need such as school fees, vacation, asset purchase, etc. In terms of appropriateness, a number of DMBs have savings products targeted specifically at ‘low income earners’ characterized by low minimum opening and operating balances.
Generally the loan products of DMBs are targeted at salaried workers as most of the loan products stipulate that potential borrowers must earn a minimum monthly income of N30,000-50,000 to be eligible for loans. Such loans are usually without collateral and generally used for consumer finance by salaried employees. Interest rate on such loans range from 12 to 22% per annum with the repayment period spread over 2-3 years.
4.5 Microfinance Banks (MFBs)
MFBs are financial institutions licensed to provide diversified, affordable and dependable financial services to the active poor, in a timely and competitive manner that would enable them to undertake and develop long-term, sustainable entrepreneurial activities to a designated geographical area with Local Government jurisdiction as unit locations.55 In December 2005, the CBN issued new regulations mandating the 757 community banks operating in Nigeria to convert to microfinance banks (MFBs) by December 2007. To date there are over 900 MFBs in the country with a combined asset base of N157.3 billion (equivalent to just over 1% of the asset base of the 24 DMBs).56
The distribution of MFBs shown in Figure 4.5 is similar to DMBs, in that the MFBs tend to be concentrated in more prosperous states, and that the Northern states are relatively very poorly served. Other interesting characteristics of the distribution of MFBs are as follows:
• The five states with the highest ratio of MFBs per million inhabitants were Abuja (29.9), Anambra (18.9), Lagos (18.4), Ogun (14.5) and Oyo (10.2)
• It is interesting that Lagos does not have the highest concentration of MFBs: this may be because, as suggested below, MFBs are competing with DMBs in many areas and in Lagos the DMBs have a good branch network through which they are already starting to target the low end market
• Anambra is a key economic centre in the Eastern part of the country with one of the largest wholesale and distributive markets in the country. This state is just a bridge away from Delta State. The same applies to Abia and Enugu57
55 The definition is based on CBN, Microfinance Policy, Regulatory and Supervisory Framework for Nigeria, December 2005
56 Figures from OFID, CBN as at April 2010
57 Anambra has 79 MFBs, far more than Enugu, with 22 MFBs. But Anambra has a population of 4.2
million compared to 3.3 million for Enugu, resulting in a ratio of 19 MFBs per million for Anambra and 7 MFBs per million for Enugu.

Financial Services Landscape in Nigeria
34
Figure 4.5 Distribution of MFBs in Nigeria
Source: OPM analysis of CBN data
The distribution of MFBs is similar to DMBs within the states as well as between states. Most of these microfinance banks are located in urban/peri-urban areas without much consideration for the inclusive and complementary role MFBs were initially meant to serve. Despite the large number of MFBs, only 541,000 (0.6%) adults in Nigeria have an account with an MFB, compared to 21% who have an account with DMBs.58
There is an interesting discrepancy between the perception of observers of the market for deposits that the MFBs are targeting and what is revealed by the EFInA Access to financial services in Nigeria 2008 survey. A number of key informants told us that the biggest challenge for MFBs is that most of them are targeting the same market for deposits as deposit money banks. Yet the EFInA survey reveals that only 2.5% of people who have an account with an MFB also have account with a deposit money bank, and only 14% of people who borrow from an MFB also borrow from a deposit money bank. So the MFBs clearly are reaching a different market from the DMBs, particularly with their deposit services.
To underscore the credit risk problems of the MFBs, there was a unanimous call among those interviewed for credit bureau services to further boost lending operations in MFBs. They argued that a credit registry would enable them to check the credit record of potential borrowers, and they would willingly share their own client information with the bureau to enable them to do that. MFBs do not appear to find the Know Your Customer (KYC) rules burdensome; indeed the KYC rules are fairly flexible, for example a national ID card,
58
EFInA Access to financial services in Nigeria 2008 survey

Financial Services Landscape in Nigeria
35
passport or drivers’ license is preferred, but not mandatory. They can also accept a utility bill (supported with a physical visit by a staff officer) or a letter from a community head.
Generally there is a problem of poor penetration of the National ID cards and the situation is much worse in peri-urban and rural populations where availability is quite low. There are also difficulties with the harmonisation of data, with each data carrier wanting to maintain their own system and their own data. There is a proliferation of agencies carrying data (Nigerian Communications Commission (NCC), the Federal Inland Revenue Service (FIRS), Immigration, etc), and there are plans to reduce the number of data carrying agencies from 17 to 5.
Regulatory Issues: There were two main complaints about the regulations. Firstly, the restriction on MFBs expansion into nearby towns across the state borders until sufficient geographic coverage in the existing state had been met was widely reported by all MFBs interviewed.59
Secondly, some MFBs indicated that the reporting requirements are burdensome. In particular, they have to submit separate returns (with much of the same information) to many different regulators: CBN, NDIC, EFCC, etc. Other MFBs, on the other hand, said that they did not regard this as a major problem as they could adapt the same information for the different regulators.
In order to address these issues, the CBN is pursuing an aggressive reform agenda to clean up the subsector, build human capacity and make regulation more effective. Hopefully if these happen better results might emerge in coming years.
MFB Association: All the MFBs interviewed were very comfortable with the new, merged National Association of Microfinance Banks. They feel that the Association does represent their views and that their voice is heard. The President of the Association listed the immediate priorities of the association as follows:
• Reversing the negative image of MFBs
• Getting rid of the toxic loans and high PAR that is prevalent among MFBs
• Developing membership services and training of MFBs
• Promoting rating agencies and pro-active self regulation
4.6 Other financial service providers
4.6.1 Insurance Companies
Insurance is the second largest industry in the financial services sector, after banking. The recapitalisation in the industry that took place in 2007 led to considerable consolidation and reduced the number of insurance companies from 107 to 51.60 There are presently 2 re-
59
This feedback from MFBs was consistent with the finding of the CGAP team that ‘The geographic restrictions associated with the unit and state licenses have concentrated the most aggressive MFBs in urban areas, and will limit the growth opportunities of both small and large MFBs as the sector develops’ and that ‘The geographic restrictions may also impede beneficial specialization, consolidations and mergers.’ CGAP, Access to Finance in Nigeria, January 2010, p. 54
60 The new capital requirements are N2bn for Life Services, N3bn for General Services, N5bn for
Composite Services and N10bn for Re-insurers

Financial Services Landscape in Nigeria
36
insurers and 48 underwriters. There are 600 registered insurance brokers, with only a few controlling a significant proportion of the risks and, hence, premium income of the industry. There are over 5,000 part-time or full-time registered insurance agents and 42 loss adjusters who provide technical advice to insurance companies on valuation. NAICOM carries out a review of operational guidelines every year.
Market perception is gradually changing, thanks to improved capitalization and regulation, increasing competition and improved customer rights. The Market Development and Restructuring Initiative (MDRI) of the Commission encourages firms to set performance targets and meet customer expectations. The goal is to work towards an ’orderly and well regulated insurance industry’ through (i) claim payments within three months and (ii) registration of companies within two months. The initiative has led to increased competition and improved service quality: insurance policies can now be easily read in a few minutes despite the small print and sometimes competitive pressures force some insurance companies to disregard some harsh clauses to protect its reputation of quick settlement and customer service. MDRI appears to have helped to reverse the past adverse reputation of the industry as unresponsive to claims settlement and customer unfriendly. NAICOM set up a Complaint Bureau Unit (CBU) for consumers: the number of complaints has declined from 100 to about 10 per month, which NAICOM attributes to improved industry performance.
The distribution channels for insurance services are still limited to physical branches, agents and insurance brokers. Most of the delivery outlets are in Lagos State, major urban centres and big cities, a similar trend to the skewed distribution of financial services delivery generally. According to some of the firms surveyed, it costs about N10-15 million to set up a branch. Some insurance companies are looking at expanding access through larger cooperatives and MFBs.
The study shows that except for the oil and gas industries and mandatory insurance products (e.g. buildings, motor vehicles), there is very low market awareness of the need for insurance. Exacerbating this situation is the recent financial sector turmoil which affected the insurance business in several ways:
• Reduced project financing has resulted in reduced demand for project related insurance
• Many customers closed their voluntary insurance (e.g. life) and opted for cheaper insurance products for mandatory insurance (e.g. third party rather than comprehensive vehicle insurance) leading to higher redemption and liquidity pressures
• Reduced asset prices and market activity has also impacted on demand for insurance
As part of the drive to increase insurance penetration in Nigeria, NAICOM is strongly advocating for microinsurance. Though the Commission declined to provide information on insurance companies with the capacity to effectively engage in microinsurance initiatives, they said all the insurance companies are fairly strong and should have the capacity to serve the mass market. They believe mandatory insurance such as National Health Insurance Scheme (NHIS) and workmen compensation would be suitable for the mass market; however, operators would require approval from the Commission to launch such products. NAICOM is also engaged in awareness campaigns and programmes to deepen and broaden the insurance industry. They strongly believe that awareness and further research is required to enable insurance companies to serve the mass market. Regulatory reforms can produce a more inclusive financial sector as long as there are data, feasibility studies and analysis to support them.

Financial Services Landscape in Nigeria
37
4.6.2 Pension providers
The total assets in the Nigerian pension industry as at May 2010 was N1.8 trillion (US$12.6 billion) with 4.3 million workers registered with Pension Fund Administrators under the contributory pension scheme61. Pension services are provided by:
• 25 pension fund administrators, who manage pension assets and administer retirement benefits
• 6 closed pension funds, who operate closed pension schemes for large oil and trading companies
• 4 pension fund custodians, who hold pension assets on behalf of contributors and settle transactions arising from pension fund management
Like insurance products, pension schemes have reached a very limited number of Nigerians.
The Pension Reform Act 2004 introduced compulsory defined benefit schemes for employers with five or more employees (judges and state employees were exempted). Industry respondents told us that they experience problems persuading smaller companies to fulfil their obligations. The general custom in Nigeria is for an employer to give an employee a lump sum when he/she retires or leaves employment, but it is usually quite small, not nearly enough to fund a decent pension. It is therefore difficult to persuade SMEs to join defined contribution schemes which involve monthly payments, even though they are legally required to do so. The problem is even more intractable for the large majority of people who work in the informal sector, who have little or no pension provision.
There is also, according to interviewees, a major flaw in the current provision, which is based solely on employer (company) pension schemes. Your pension is portable, but only to another employer/company. If you want to start your own business, or move to a company with fewer than 5 employees and no pension scheme, you will lose the pension fund that has been built up by your existing employer as there is no pension scheme to which the fund can be transferred. The only way to preserve your accumulated fund in this scenario is to find a company to sponsor your scheme. Sometimes former employers may agree to do this, or an SME can get their large company customer to remit the pensions through their schemes, but this is a very ad hoc process, and rarely successful.
4.6.3 The securities market
The Nigerian Stock Exchange is one of the largest in Africa. It has 261 listed companies with a total market capitalization of about N8.37 trillion (US$56 billion) as at end July 201062. The Exchange has over 250 stockbrokers (dealing members of the Exchange) and six branches in the major commercial cities of the country.
According to the EFInA Access to financial services in Nigeria 2008 survey, 6% of the adult population, or about 5 million people hold shares or unit trust investments.63 This is consistent with the figures provided during the interview with the Nigerian Stock Exchange, who said that there are about 5 million accounts in the Central Securities Clearing System: allowing for
61
Mohamed Ahmed, DG, PenCom. Businessday, August 2010 62
http://www.nigerianstockexchange.com/downloads/monthaug.pdf. (Assessed on August 9 2010)
63 3.75% of adults say they have shares, 2.03% have investment with asset management companies
and 0.88% have offshore investments. There will of course be some overlap between these numbers
Financial Services Landscape in Nigeria
38
dormant accounts and multiple holdings, the Exchange estimated that this represents about 3 million individuals and firms who are active holders and traders of shares. There was a setback in the expansion of the exchange following the global financial crises of 2008-9, but numbers are now recovering and new entrants are back to their pre-2008 levels of around 17,000 a month.
According to survey respondents, including the NSE, participation in the market has been largely confined to relatively prosperous, mainly urban investors. Some schemes have been launched that theoretically target the low income, but in practice they have succeeded in engaging only the affluent. So until better distribution channels are established, it is unlikely that securities markets will be an important investment product for low income people in Nigeria.
4.6.4 Other financial institutions
Discount Houses: They specialise in trading money market securities, with specific mandate to provide liquidity and play market-making roles for short-term money market instruments. There are 5 discount houses in Nigeria.
Finance Companies: These are financial institutions whose business and primary function include lending to individuals. Finance companies cannot accept deposits. There are 112 finance companies in Nigeria. Bureaux de Change: These are companies that carry out foreign exchange business on a stand-alone basis, in accordance with Foreign Exchange (Monitoring & Miscellaneous Provisions) Act of 1995. There are about 126 licensed bureau de change in Nigeria.
Primary Mortgage Institutions: These are usually private savings and loans institutions (or building societies) focusing on mortgages for the purchase of homes to clients who also save with the institutions. There are 98 Primary Mortgage Institutions in Nigeria.
Development Finance Institutions (DFIs): These are usually government-owned financial institutions established to finance certain development objectives of the government mainly in the agriculture, commerce, and industrial sectors of the economy. There are 5 DFIs in Nigeria (Bank of Industry, Nigeria Export Import Bank, Nigerian Agricultural Co-operative and Rural Development Bank, Federal Mortgage Bank of Nigeria and Urban Development Bank of Nigeria). The Nigerian Agricultural Co-operative and Rural Development Bank is the most relevant in terms of access to financial services and is discussed in detail in section 4.8.
4.6.5 Other players and service providers
Other key players in the Nigerian financial sector include:
Nigeria Inter-Bank Settlement System (NIBSS) Plc: This is jointly owned by the CBN and
all the banks. It provides cheque clearing, bulk electronic funds transfers and settlements, and also serves as a central gateway.
Automatic Teller Machine (ATM) Service Providers: The ATM Consortium Ltd deploys and manages ATMs in Nigeria. The company, which is independently managed, is a consortium jointly owned by Accenture and nine other banks in Nigeria. The CBN has also

Financial Services Landscape in Nigeria
39
licensed two other companies (Spark ATM and ACM) to provide off-site ATM services.
Valucard Nigeria Plc: This is a jointly owned company by a consortium of leading Nigerian DMBs and Visa International Services Association (Visa). It is a provider of e-payment processing infrastructure for both its own banks as well as other banks that wish to subscribe to its services.
Transaction Processors: These companies provide electronic transaction switching and payment processing, e-commerce, telecommunications value-added services, e-billing and payment collections monitoring services for Nigerian banks. They also provide a platform for online processing of transactions between banks. Transaction processors include 3Line Card Management, Cards Technology, eTranzact Nigeria, Intermarc Consulting, Interswitch and CoralPay Technology.64
4.7 Cooperatives
In theory, cooperatives are well suited to address the large unmet demand for financial services in Nigeria (especially in rural areas). Being member owned, financed and managed by, for and of its members, cooperatives have many advantages:
• They can significantly reduce operating costs as many members provide services on a voluntary basis
• Members live in physical proximity to each other and can therefore avoid high monitoring and enforcement costs
• Cooperatives do not need sophisticated, dispersed offices to provide services to its members
There is virtually no aggregated data available on cooperatives. Given the constraints of the study, it was agreed that the field work would therefore be restricted to one successful cooperative apex organization, to assess the potential for cooperatives in improving access to financial services.
The cooperative visited was Bauchi State Cooperative Financing Agency (CFA) Limited, which was set up in 1976 following the creation of Bauchi State. This apex cooperative has 3,000 primary cooperatives as its members. The primary cooperatives range from 10 to 300 members spread over two or three neighbouring villages. This provides CFA an outreach to about 500,000 members across the entire state. The key activities of the CFA are to:
• Source and provide funds to members for agricultural activities
• Undertake crop processing, storage and marketing
• Purchase and distribute crop inputs
• Undertake other activities to promote coop movement in the state
CFA considers itself a successful cooperative as it:
• Is an independent organisation, owned and managed by its members; governed by 7 duly elected board of directors
64
For details see www.3lineng.com/, www.cardstechnology.com, www.etranzact.com, www.intermarc-ng.com, www.interswitchng.com and www.coralpay.com

Financial Services Landscape in Nigeria
40
• Employs 50 core staff and has the capacity to reach all its members across the state within 2-3 days
• Successfully deals with political pressures e.g. appointment of staff/ board members
• Has incurred no losses in the last five years
CFA works closely with government at state and local levels and was commissioned by an Agricultural Development Project of the World Bank/Government to recover outstanding loans. CFA was able to recover in a month most of the outstanding loans for which the project had been struggling with for three years. CFA notes the unmet demand for financial services in rural areas and that most MFBs and DMBs are not financing farmers as they are urban focused and find agricultural financing very risky.
Many of the CFA members (primary cooperatives) have their own saving activities. CFA has had microfinance operations in the past with high repayment rates e.g. in 2006 CFA took a bulk loan of N873 million and repaid the entire loan. CFA would like to get loans at single digit interest rate (e.g. from the N200 billion allocated for commercial agriculture) and is considering linking MFBs with local cooperative members. Both the CFA and the national cooperative officials acknowledged, however, that for every successful cooperative, there are many examples of fraud, political capture and sheer non-performance of other cooperatives.
The lack of data on the extent of outreach of cooperatives and their potential to meet the financial needs of their current and potential members makes it impossible to determine the optimal strategy for expanding cooperative financial services, including Savings and Credit Cooperatives, in Nigeria.
4.8 Nigerian Agricultural Cooperative and Rural Development Bank Ltd (NACRDB)
The bank was established by the Federal Government of Nigeria in 2000 through the merger of three rural and microfinance institutions namely Nigerian Agricultural Cooperative Bank (NACRDB), People’s Bank of Nigeria (PBN) and the risk assets of the specialized agency Family Economic Advancement Programme (FEAP). The purpose of the NACRDB is to grant credit facilities to both individuals and co-operative groups at macro and micro levels in the fields of agriculture agro-processing.
NACRDB has the potential to be a significant player on the financial sector stage in Nigeria, from a financial inclusion perspective, because of its extensive branch network in rural areas. With 201 branches65, NACRDB had an outstanding portfolio of about N16.69 billion as of April 2010, which is equivalent to about 11% of all the MFBs and about 0.1% of the banking industry. The bank is wholly owned by the Federal Government.
Some of the challenges faced by the bank include; under-capitalization, ownership-governance conflict, political interference, unclear regulatory framework, high levels of non-performing loans, poor Management Information Systems (MIS), poor image of the Bank, staff limitations, high operating costs, etc.
To address these challenges, the Federal Government (through the Federal Ministry of Agriculture and Water Resources, FMAWR) sought and received advice from the World Bank (WB) on how best to address the situation of NACRDB. A review and scoping mission
65
Data provided during interview
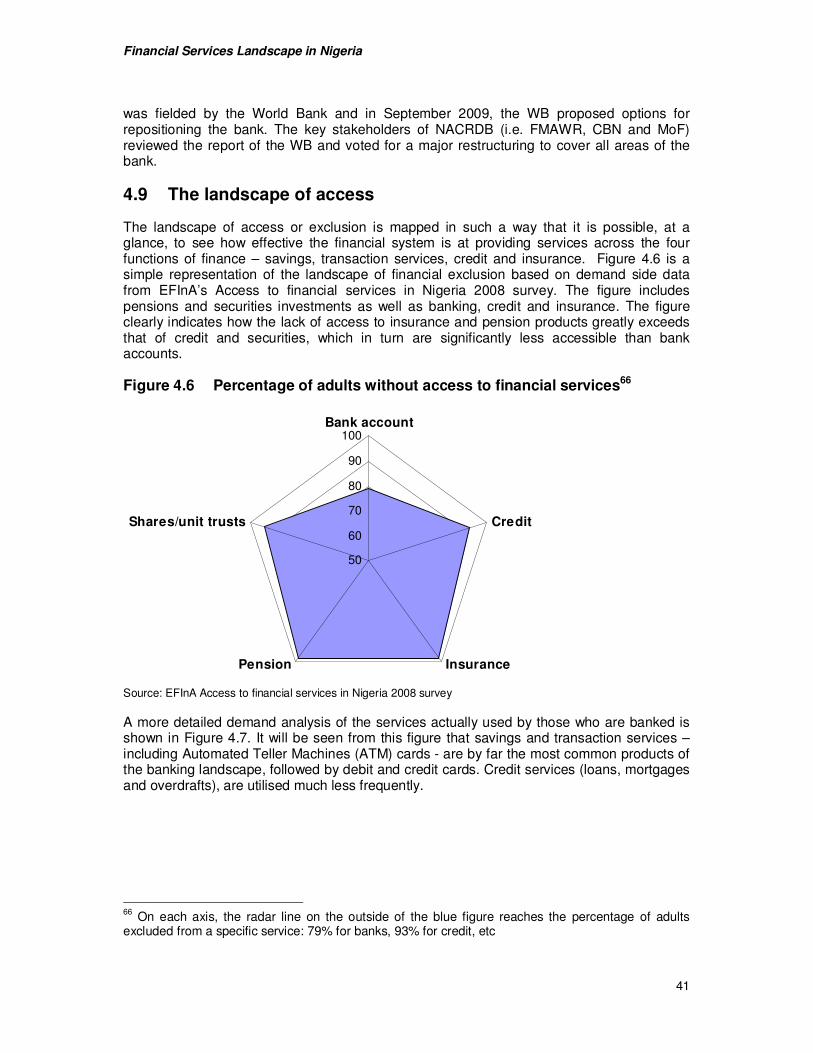
Financial Services Landscape in Nigeria
41
was fielded by the World Bank and in September 2009, the WB proposed options for repositioning the bank. The key stakeholders of NACRDB (i.e. FMAWR, CBN and MoF) reviewed the report of the WB and voted for a major restructuring to cover all areas of the bank.
4.9 The landscape of access
The landscape of access or exclusion is mapped in such a way that it is possible, at a glance, to see how effective the financial system is at providing services across the four functions of finance – savings, transaction services, credit and insurance. Figure 4.6 is a simple representation of the landscape of financial exclusion based on demand side data from EFInA’s Access to financial services in Nigeria 2008 survey. The figure includes pensions and securities investments as well as banking, credit and insurance. The figure clearly indicates how the lack of access to insurance and pension products greatly exceeds that of credit and securities, which in turn are significantly less accessible than bank accounts.
Figure 4.6 Percentage of adults without access to financial services66
50
60
70
80
90
100Bank account
Credit
InsurancePension
Shares/unit trusts
Source: EFInA Access to financial services in Nigeria 2008 survey
A more detailed demand analysis of the services actually used by those who are banked is shown in Figure 4.7. It will be seen from this figure that savings and transaction services – including Automated Teller Machines (ATM) cards - are by far the most common products of the banking landscape, followed by debit and credit cards. Credit services (loans, mortgages and overdrafts), are utilised much less frequently.
66
On each axis, the radar line on the outside of the blue figure reaches the percentage of adults excluded from a specific service: 79% for banks, 93% for credit, etc

Financial Services Landscape in Nigeria
42
Figure 4.7 Usage of financial products by banked people
Source: EFInA Access to financial services in Nigeria 2008 survey
Although useful up to a point, not least because they are nationally representative, these kinds of graphical representation are not especially effective at quantifying the gap between usage and access67 but we can trace an approximate landscape of access using supply side data as described below.
For transaction banking and transmission services:
• There is a reasonable diversity of bank-supplied transaction services at what appears to be relatively low cost. Typically these come in the form of basic savings accounts (see below). It would appear that usage of such accounts is constrained mainly because of physical access issues (the time it takes to travel to a bank and the cost of doing so, and limited roll-out of financial infrastructure) and affordability
• For low income consumers, being able to access cash easily is a core part of the value proposition of formal financial services. Although the ATM network (10,000 machines) is growing, it is still far smaller than it needs to be. The installed base of POS machines (11,000 units) is particularly low, hampered, like ATMs by the intermittent supply of electricity
• It has yet to be determined if, Know Your Customer (KYC) requirements distort the landscape of access to any material extent although the greater availability of national identity documents would clearly help
67
The access frontier methodology described in “The Access Frontier as an approach and tool in making markets for the poor” (Porteous, 2005) would be one way to quantify the gap

Financial Services Landscape in Nigeria
43
For savings:
• As savings accounts are the main vehicle through which banks offer basic transaction services to low income consumers, it follows that physical access and affordability constraints affect the take-up of savings services
• The inconvenience and cost of banking for low income consumers is not compensated for through the interest they receive on their savings, since savings interests are very low
• The MFB network is meant to offer easy access to savings and loans. Although there are over 900 MFBs, the branch network is skewed geographically to urban areas and concentrated in certain states
• Furthermore, there is evidence to suggest that the success that many MFBs have garnered is based on deposits from people connected to the founders of the MFB (business associates, family, friends, etc) rather than from a wide pool of low income savers
• Deposit money banks are experimenting with esusu-style innovations in agent banking in order to bring accessible savings to (for example) market traders. Although these are positive developments, they are at quite an early stage
For credit:
• Usage of credit is highly constrained for low income and self-employed consumers although there is considerable diversity of products for salaried people
• The cost of credit (typically 20-25% per annum for most categories) and the short tenure of many loans means that debt servicing costs are highly exclusionary for the vast majority of Nigerians
• This may explain why only 3% of those with access to a bank have a loan from the bank, compared to 92% with savings accounts, as shown in Figure 4.7
• The banks still appear to have little incentive to reduce the spreads and increase the availability of small loans, given the relative ease of finding larger and more lucrative lending opportunities in the oil and gas sectors and in Government debt
For insurance:
• Insurance remains dominated by the oil and gas industry and compulsory motor vehicle insurance, with discretionary insurance such as life assurance used by only a small fraction of the population
• Some insurance companies have indicated interest in developing micro insurance products although this is more of an aspiration rather than a concerted strategy and, in any case, Nigeria does not have a formal regulatory framework for micro insurance
• A key constraint on the expansion of access to insurance products appears to be the difficulty of distribution in Nigeria
For pensions:
• The pension fund market in Nigeria is still very small, assessed by only 4.3 million Nigerian adults. This is partly because of the reluctance of SME employers to set up employee pensions schemes, despite the Pension Reform Act 2004, which introduced compulsory defined benefit schemes

Financial Services Landscape in Nigeria
44
• The Pension Reform Act 2004 makes it difficult for people who move jobs to a microenterprise or to start their own business to retain the pension benefits they have built up in employment
For investments in securities:
• Surprisingly, as at 2008, more people held investments in securities (in shares or in unit trusts) than had insurance policies or pension schemes: 6% of the adult population
• The market appears to be recovering from the problems of 2008-2009, and the number of investors is picking up. Participation in the market is still, however, largely confined to relatively prosperous, mainly urban investors

Financial Services Landscape in Nigeria
45
5 Constraints to Access to Financial Services
Table 5.1 provides a summary of all the constraints that we will explore in this section.
Table 5.1 Constraints to the expansion of access to financial services
Contextual Constraints
- Demographic and poverty pressures
- Complex political organization
- Poor level of infrastructure
- Financial sector culture
- Public interventionism
- Lack of policy coordination
Regulatory constraints
- Mobile payments regulation
- Know Your Customer (KYC)
- Interests rate caps
- Secured transaction law
- Bankruptcy laws
- MFB regulation
Systemic constraints
- Skewed delivery infrastructure
- Lack of financial sector data
- Lack of credit information
- Absence of an integrated ID system
- Skills shortage
Organizational and Product based constraints68
- Physical accessibility
- Appropriateness
- Affordability
Demand constraints69
- Gender-related constraints
- Income-related constraints
- Ethnicity
- Financial capability
5.1 Contextual constraints affecting financial services
5.1.1 Demographic and poverty pressures
Demographics in Nigeria can be seen in both a positive and a negative light. On the one hand, the market for financial services is clearly expanding in absolute terms – not necessarily in strict correlation to population growth but expanding nonetheless. Rapid urbanisation should make it easier for providers of formal financial services to reach out to unserved population groups in the future, especially as those living in urban areas are more likely to have much better access to the internet as well as to mobile telephony than those living in rural areas. On the other hand, this vast and growing, urbanising population is overwhelmingly poor and, with few prospects of formal employment (partly because Nigeria has such a weak small business sector), many people will have to rely on informal activities to make ends meet. In such an environment, money transfer mechanisms and agent banking models that offer people an easy and cheap way to keep their surplus cash safe ought to
68 These issues were initially discussed in Chapter 4 above
69 These issues have been discussed in Chapter 3 above

Financial Services Landscape in Nigeria
46
prosper but formal credit extension is likely to lag behind.70 However, one needs to also take into account the risks associated with provision of services to a ballooning urban youth population – itinerant, often squatting in temporary accommodation. The ‘faceless’ nature of such youth is exacerbated by the limited reach of the National Identity card scheme, which makes Know Your Customer (KYC) requirements of formal financial services difficult to achieve.
The challenge of absorbing so many people into the banking system is immense. Nigeria already has around 21% of adults banked compared to 60% in South Africa.71 For Nigeria to significantly improve its indicators of financial access (e.g. the percentage of adults formally included) while its population is growing as fast as it is, will require a very rapid uptake of non-traditional formal financial services which, in turn, will require a highly flexible and enabling regulatory position vis-à-vis technology-led innovation, especially in the mobile phone arena. Point of Sale (PoS) outreach, which remains surprisingly limited, will also need to expand substantially. ‘Bricks and mortar’ banking will probably contribute only a few additional percentage points to the formally included in the future. We explore these issues in greater detail later in Section 5.3 when we consider physical access constraints.
5.1.2 Complex political organization
Another important contextual point is the size and complexity of the government and administrative structure of the country, which has implications for the formulation and implementation of policies at the macro level to tackle financial exclusion. Although the country’s federal structure was not cited by survey respondents as an insurmountable constraint (and therefore should not be overstated), it can be surmised that it has contributed to an environment in which information on the financial sector is not centralised, which inevitably makes the job of investors, operators and regulators much more difficult.
5.1.3 Poor level of infrastructure
Infrastructure, and in particular electricity, was cited on numerous occasions by respondents as a key constraint to supply. Although the poor quality of the fixed line telephony network was cited as a major constraint to the roll-out of ATMs and PoS devices, intermittent power supply emerged as the key infrastructural issue, with its obvious impact on the banks’ ability to maintain a functional network or to process transactions in real time. ATMs positioned outside banking halls require their own dedicated power supply, which often makes it unprofitable to offer such services (according to one leading deposit money bank), so the bank was happy to agree to new regulations from CBN that restricted deposit money banks to providing ATM services only from their own banking premises.
The problem of power also has a negative impact on bank clients, particularly enterprises. According to the National Planning Commission (NPC), there are 60 million generators in the country which cost N7.3 trillion annually to run. Consequently, practically anything that is manufactured or delivered by way of a service is more expensive than should otherwise be.
70
It is important to note that the headline figures on access will probably stay quite depressed in percentage terms because each year so many young Nigerians will reach the age at which they are eligible for a bank account but will not actually be banked, until they become economically active. It will be important for EFInA to look beneath the percentages and focus in addition on the absolute numbers of people included and excluded
71 Based on the FinScope 2009 Survey

Financial Services Landscape in Nigeria
47
It should be noted that a reliable power supply and network connectivity will become all the more vital in the kind of banking environment that Nigeria must aspire to if it is to bring large numbers of the unbanked population into the financial system.
5.1.4 Financial sector culture
It is arguable that excess liquidity from the oil and gas sector was one of the root causes of the crisis in a large part of Nigeria’s banking industry in 2008/9. In the first instance, a number of DMBs were over-exposed to the oil and gas sector. The first five DMBs to be taken into curatorship by the CBN in August 2009 had total exposure to the oil and gas sector of N2.8 trillion, which represents 17% of their total loan portfolio. Margin loans by those same five deposit money banks, i.e. loans to firms and individuals to facilitate speculation in the stock market, were 16% of the total loan portfolio, almost as much as their exposure to oil and gas.
The combined over-exposure of all DMBs to oil and gas and to the stock market (described as ‘huge’ by the Governor of the CBN)72 was 33%. It is a stark illustration of how the oil and gas industry, and the government business that comes from this, has drawn financing capacity away from a broader range of potential beneficiaries and therefore can be described as a constraint on financial inclusion. Although the oil and gas sector will continue to absorb financing capacity away from the non-oil sector for as long as there is oil in Nigeria, it may be that CBN’s new focus on macro-prudential regulations in the wake of the banking crisis will dampen the banks’ incentives to lend into the sector as much as they did in the past. Certainly, the Governor of the CBN has been keen to stress how important it is for the financial sector to be responsive to the needs of the economy as a whole.
It should be noted that the insurance sector is also dominated by the oil and gas sector, which partly helps to explain why outreach is so small in terms of numbers of people served. It is also very difficult to achieve expanded outreach in the insurance industry when banking outreach is low.
The banking industry grew at a fast pace over a 20 year period (volume of bank deposits grew 300 times from N30 billion to N8.7 trillion between 1989 and 200973). The number of DMBs also proliferated – from 14 in 1985 to 79 in 1995 and 89 in 2004 before subsequent reduction to 25 in 2006 via consolidation. It is hard to see how this could have happened without oil. Margin trading and manipulation of stock prices to keep them artificially high, led to a speculative bubble which collapsed – at great cost to Nigeria in terms of bail-out costs and lost output.
A serious negative consequence of the boom and bust that is undoubtedly a constraint on access is that it has created a deeply cynical financial culture in which debts are not taken seriously, which increases the reluctance of banks to lend. This is probably exacerbated by the ready availability of government-supplied loans (e.g. for agriculture) that are guaranteed and often subsidized, as discussed below, and very often not repaid.74 The ratio of domestic
72
Speech by CBN Governor Sanusi Lamido Sanusi, 14 August 2009 73
Web article: http://socyberty.com/issues/the-current-issue-in-the-bank-sector-in-nigeria-is-a-test-of-the-efficacy-of-ndic-and-cbn-growth-in-insurance-business/, accessed on July 2010
74 CBN’s 2005 Annual Report noted that 68% of NACRDB’s portfolio was delinquent

Financial Services Landscape in Nigeria
48
credit to the private sector as a proportion of GDP is a mere 18% in Nigeria compared to 30% for sub-Saharan Africa as a whole and 117% for Malaysia.75
Whether Nigeria’s banking crisis has a direct impact on financial access remains to be seen. We have not seen evidence to suggest, for example, that the roll-out of bank branches has slowed materially across the industry as a whole; on the contrary, all the DMBs interviewed in the survey said that they are expanding, or planning to expand, their branch network. While deposit money banks that were recapitalised have shelved their expansion plans, a number of those that came through the crisis in good shape have actually increased both their customer base and their branch network, so it is difficult to determine what the net position is for the industry. Furthermore, it would appear that most of the banks that are operating normally are experimenting with new models of distribution such as agent banking and hub and spoke banking, as described in section 5.3.
Given the history of Nigeria’s banks, and the pervasive issue of fraud in the financial sector, it is remarkable that trust levels in the banking system are not lower and that lack of trust is not an obvious constraint to access. EFInA’s Access to financial services in Nigeria 2008 survey suggests that people trust banks considerably more than MFBs or even savings clubs. Furthermore, only 5% said that they do not trust banks or other financial institutions. However, the results of the Focus Group Discussions conducted in EFInA’s Access to financial services in Nigeria 2010 survey (Qualitative phase) show that the collapse of banks in 2009 and the unstable financial environment have contributed to a reduction of the level of trust in deposit money banks. Our fieldwork also revealed anecdotal evidence to suggest that ATM utilisation had declined recently as a result of fraud, and especially compromised Personal Identification Numbers (PIN)76. Deposit money banks have invested considerable sums in trying to restore confidence in this area, including providing consumer education on how to keep PINs safe.
We conclude therefore that the banking crisis does not appear to be a constraint to access (at least not yet) but that the essential factor which led inexorably to the banking crisis (excess liquidity from oil and gas) was also responsible for reducing deposit money banks’ incentives to downscale their services.
5.1.5 Public Interventionism
It is conventional wisdom to suggest that direct government intervention in the financial sector, however well-intentioned, constrains access because it crowds out the private sector, distorts the market, restricts choice for consumers and forces them to rely on services that are often very poorly delivered. Nigeria has a long track record of financial intervention and there is no evidence that this will stop. However, we have found no compelling evidence to suggest that government interventions have constrained access to a material extent – on the contrary, in the marginal market segments that are being targeted by these interventions we have found a number of banks participating fairly effectively alongside government.
In addition, some enhancements to certain schemes suggest that the government is aware of the value of market-style design features: for example, the Interest Drawback Program (IDP), which offers an interest rebate where loans are repaid on time, has enhanced the effectiveness of the Agricultural Credit Guarantee Scheme (ACGS). The ACGS has been in existence since 1977. The soon-to-be-launched Agricultural Credit Support Scheme
75 An Assessment of the Investment Climate in Nigeria (Larossi et al, World Bank 2009)
76 One CBN official described the problem of ATM fraud to us as ‘mind-blowing’
Financial Services Landscape in Nigeria
49
(effectively a public private partnership between the large deposit money banks and government) also contains an interest rate rebate which reduces the cost of a loan by 6% for prompt payers.
Some of the sectors that have received government support (perhaps especially in rural finance) are not seen as good business opportunities by private sector providers. Even when there were 89 banks in existence, fewer than 6 participated in ACGS; now, with 24 DMBs in existence, only 4 are in the scheme. The banks are not interested in this sector - they think it is too risky. In such circumstances an efficiently delivered subsidy programme could be both desirable and justifiable on developmental grounds.
It is clear from the following list that the Federal Government of Nigeria (FGN) has responded to the challenge of financial access with a comprehensive mix of access-related initiatives (both policy- and finance- based) that have included:
• Establishing new institutions (e.g. the Nigeria Agriculture Credit Bank, the precursor of the Nigerian Agricultural, Cooperative and Rural Development Bank (NACRDB), or the People’s Bank of Nigeria)
• Guarantee schemes (e.g. the ACGS)
• Subsidized interest rates for targeted groups
• Matched funding (e.g. the National Poverty Eradication Programme, under which state governments matched funding by deposit money banks)
• Directed lending/investment (e.g. the Small and Medium Enterprises Equity Investment Scheme (SMEEIS)
• New policy frameworks (e.g. the Microfinance Policy, Regulatory and Supervisory Framework in 2005 and the evolving Financial System Strategy 2020 which has access to finance as one of its core components)
• Regulation (e.g. increased minimum capital requirement and the forced conversion of community banks into microfinance banks; CBN setting targets for rural branches)
The latest intervention is the proposed N200 billion Small and Medium Enterprises Credit Guarantee Scheme (SMECGS), announced in April 2010. The sheer scale of this programme creates potential for market distortion but as yet few details have emerged on how the money is to be disbursed. It is known, however, that the scheme is targeting the manufacturing sector in particular, that SMEs with assets not exceeding N300 million and have between 11 to 300 employees will be eligible and that the maximum amount that would be guaranteed is N100 million.
NACRDB stands out as requiring radical reform. It is financially unsustainable and the extent of its infrastructure77 would suggest that a different business model might be more beneficial for access than NACRDB’s current model. As described in section 4.8 above, the Federal Government has already received advice from the World Bank and others and a government committee has been formed to decide what to do with NACRDB. A decision is expected imminently.
While these initiatives have not all been wholly unsuccessful there is, in general, a lack of transparency about what worked and what did not.78 It is also not clear why some 77
201 branches, 830,000 savers and 47,000 borrowers as at November 2006 (data from NACRDB) 78
Interestingly, the World Bank has argued that where interventions have been backed up by rigorous monitoring and evaluation, this has resulted in much better performance

Financial Services Landscape in Nigeria
50
interventions were made in the first place and structured in the way that they were. This points to an important underlying systemic weakness which the World Bank has argued has constrained access – namely, a lack of information across financial markets on outreach, financial performance and market demand.79
It also reveals that some policies has been made in a highly selective way, singling out (for example) SME finance or rural finance for particular attention, in the absence of a coherent set of principles governing policy formation for market-based financial system development, or a substantial body of specific evidence to support the proposed intervention.
We suggest that more emphasis needs to be placed on evidence based policy-making, designing intervention schemes appropriately, monitoring their effectiveness, enhancing their operational effectiveness on the back of good quality data, and closing them down if they underperform. We note the analysis by the World Bank which indicates a clear correlation between successful interventions and good monitoring and evaluation (M&E) – those schemes that perform well are also those that have an effective M&E system in place.80
It is indeed the case that some forms of direct intervention may sometimes be necessary to address the most basic financial needs of low income people living outside formal financial services provision (the ‘unserved’). Getting basic loans to subsistence farmers would fall into this category.
However, for the very substantial population of low income earners, whose financial needs are slightly more complex, the Government may need to develop a greater acceptance of the need to tackle systemic (i.e. market) constraints in order to encourage a better quality of access for these people who may have a basic form of bank account but who lack other products such as housing finance, insurance or pensions. It would make sense for the Federal Government to use its resources to address systemic constraints such as information gaps and skills shortages to allow a broader range of products to be delivered through the market.
So, we conclude our analysis of government interventions by suggesting that these are not constraints to access (most are actually marginally beneficial) with the possible exception of NACRDB; but that the FGN should make much better use of data and research to support the design of its interventions and a more systematic approach to establishing baselines and targets and to monitor and evaluate the effectiveness of the interventions.
5.1.6 Lack of policy coordination
In much of the analysis of Nigeria’s financial markets there is a pervasive sense of lost opportunity. It is as if organisations make progress despite government not because of it. The reality is certainly more nuanced than this but it is nevertheless our belief that a lack of policy coordination around access has contributed to Nigeria’s poor indicators on access today.
There has been no shortage of public acknowledgement of the problem of financial exclusion: successive CBN Governors have made policy pronouncements and launched initiatives to combat exclusion. But they seem to lack follow-through. There has not been policy leadership by the Finance Ministry on access over the years, but Nigeria is no different
79 Access to Finance in Nigeria (World Bank, 2009)
80 World Bank, (2008). Rural Finance in Nigeria – Integrating New Approaches, World Bank

Financial Services Landscape in Nigeria
51
in this respect from many other African countries where the central bank takes a de facto lead on much of the financial policy that is made, including on access.
Various divisions within the CBN have been active in pushing forward aspects of the access agenda, despite the very considerable distraction of the banking crisis. Good progress has been made, especially in the payments arena but perhaps also in microfinance too. Capacity within the CBN is good in parts but our interviews revealed a tendency for officials to compartmentalise the tasks around access, so that there does not appear to be an integrated CBN policy on financial access.
A potential problem is the centralisation of CBN’s developmental role on Development Finance Department (DFD), the division responsible for government interventions in sectors such as agriculture and SMEs: this risks perpetuating the notion that ‘pro-poor finance’ requires some form of subsidy and entrenching the divide between the mainstream financial industry and the needs of low income Nigerians. This is at odds with the CBN Governor’s eloquent and repeated calls for the financial sector to be more responsive to the needs of the Nigerian economy.
CBN concluded a major reorganisation in March 2010 with the establishment of a new Financial Policy and Regulation department under the Deputy Governor (Financial System Stability). Although this will address gaps in regulatory capacity (such as the lack of any macro-prudential supervisory function at present), no provision has been made in the reorganisation (as yet) for any department to coordinate specifically the CBN’s multiple activities to support financial access.
The establishment of a Financial Access Unit (which is covered in more detail in Chapter 7) under a clear mandate from the Governor could be very beneficial to CBN and FGN’s efforts to expand access in the future by elevating the status of the issue within the CBN and sending a strong signal to the industry demonstrating the extent to which CBN attaches importance to financial access. The success of the Inclusive Finance Advocacy staff at the Banko Sentral ng Pilipinas and the Access to Finance Dept at the CNBV in Mexico in increasing coordination to design and implement pro-access to financial services validate the importance of having a specialized Financial Access Unit within the CBN. Without it, we believe that financial inclusion will stay constrained for longer than is necessary.
5.2 Regulatory constraints
5.2.1 Mobile Payments Regulations
There are observers who maintain that the CBN stance on mobile banking (i.e., not allowing a telco-led model) is a constraint on mobile banking development, but the current survey has found that the situation is complex and highly nuanced: it is too soon to say whether the CBN approach will adversely affect the impact of mobile banking on financial access in Nigeria.
In June 2009, the CBN issued Mobile Payments Regulations. Some key characteristics of Nigeria’s regulations include the following:81
• The framework allows for three types of models: (i) Bank-Focused (where a bank – deposit taking financial institution - delivers banking services to existing and prospective bank customers using the mobile phone as a delivery channel; (ii) Bank-Led (where a
81
Regulatory Framework for Mobile Payments Services in Nigeria, Sections 2 and 5

Financial Services Landscape in Nigeria
52
bank collaborates with another service provider, to jointly deliver banking services leveraging on the mobile banking system); and (iii) Non-bank Led (where a nonbank organization delivers mobile payments services to customers)
• The only institutions that are not permitted to lead a Non-bank Led model are telecommunication companies (‘telcos’)
• Maximum transaction limits range from N3,000 to N100,000, depending upon the level of required KYC
The CBN is confident that the prospects for bank-led mobile banking/payments are bright, and that once one bank succeeds, the others will quickly follow suit. In addition, concerns about inability to effectively control telcos and to supervise payments made through telcos led the CBN to prohibit the telco-led model, at least for now.82
There is some evidence that a bank-led model can make a significant contribution to financial inclusion. In Colombia, for example, banking agents were introduced in 2006, when only 30% of the population was banked. Three years later, there were over 5,000 banking agents, and the banked population had increased to 57%.83 Similarly, Brazil experienced a dramatic increase in financial access points through banking agents, which increased by over 500% from fewer than 6,000 agents in 2000 to over 38,000 in 2004.84
Critics of the regulations, however, question why telcos are being excluded. They note that one of the world’s most successful85 branchless banking model is Safaricom’s M-PESA in Kenya, a telco-led model that has gained over 10 million customers and has been praised as an example of the potential for expanding access to finance through a combination of a visionary business model and an open-minded regulator.
5.2.2 Know Your Customer (KYC)
Like most countries, Nigeria requires financial service providers to verify their customers’ identity to combat money laundering and terrorist financing. The primary law is the Money Laundering (Prohibition) Act, 2004. Secondary documents include the CBN’s Know Your Customer Manual for Banks and Other Financial Institutions in Nigeria, the Advance Fee Fraud and Related Offences Act, the Guidelines on Electronic Banking in Nigeria, and various CBN Circulars.
In response to comments from CGAP and others that noted apparent conflicts among the various Anti-Money Laundering & Combating the Financing of Terrorism (AML/CFT) regulations, the CBN issued a revised AML/CFT Manual in March 2009 to consolidate the various circulars and documents in one manual.86 However, in response to stakeholder comments, the CBN issued a revised draft AML/CFT Manual in October 2009 and requested
82
It is worth noting, however, that the Nigerian Communications Commission is in the process of developing its own mobile payment policies
83 See Banca de las Oportunidades, Growth on Non-Bank Correspondents in Colombia (PPT) & http://www.asobancaria.com/categorias.jsp?id=227&sup=1, accessed on July 2010 84
Kumar et al (2006). Expanding Bank Outreach through Retail Partnerships: Correspondent Banking in Brazil
85 ‘Success’ can be defined in many ways, but for the purposes of simplicity, we will define success by
considering uptake and use of services
86 Circular BSD/Dir/Gen/Aml/03/009/1, Anti-Money Laundering/Combating Financing of Terrorism
(AML/CFT) Compliance Manual for Banks and Other Financial Institutions in Nigeria, accessed July 2010

Financial Services Landscape in Nigeria
53
comments. It is unclear whether this manual (or an amended version thereof) has yet been finalized.87
In the draft AML/CFT Manual, the CBN lists a number of KYC requirements, the main requirements are the verification of identity and address. Importantly, the Manual also provides for greater flexibility for those who cannot produce traditional proof of identity (such as national identity card, driver’s license, etc.) or address (such as utility bills, bank statement, driver’s license, tenancy agreement, etc.). Financial institutions may accept a letter from a respected member of the community (such as a solicitor, doctor, religious leader, or teacher) that can verify the individual’s identity and address. This letter should include a phone number to allow the institution to verify the information, and the institution must independently verify this information as well. Furthermore, accounts that are opened in such a manner should be subject to additional monitoring to ensure that they are not abused. Financial institutions are mandated to develop internal procedures to guide staff on how to proceed in such cases. 88
By clarifying the AML/CFT framework and providing flexibility to ensure that identification requirements do not prevent unbanked Nigerians from accessing formal financial services, the CBN appears to have effectively addressed the key concerns about the framework. This, combined with the fact that EFInA’s Access to financial services in Nigeria 2008 survey found that only 7% of unbanked Nigerians cited lack of appropriate identity documents as one of the reasons for not having a bank account, suggests that this should no longer be a major concern. Although the CBN’s efforts to consolidate and clarify the AML/CFT framework are laudable, it is still too soon to say that all KYC constraints have been totally and effectively removed.
5.2.3 Interest Rate Caps
In the last decade, deposit and lending activities have been periodically subject to interest rate restrictions, including the following:
• In July 2002, the CBN issued a circular limiting lending rates to a maximum of 4% above the Minimum Rediscount Rate (MRR). This was done with the goal of helping to develop the ‘productive sector of the economy’89
• In April 2004, after noting that some banks were not complying with this requirement, the CBN reemphasized the importance of compliance90
• At some point over the next four years, the CBN stopped trying to enforce this policy and shifted to a completely market-based system for determining lending rates. In February 2008, the CBN sought to dispel any confusion by clarifying that the aforementioned lending rate limits ‘had long ceased to be operational’91
87
Circular BSD/DIR/GEN/CIR/03/027, Revised CBN Anti-Money Laundering/Counter Terrorism Financing (AML/CFT) Manual, 2009 (Draft), accessed July 2010. The CBN website has not indicated that this revised draft Manual has been finalized
88 Revised Draft AML/CFT Manual, Sections 2.6.1.5.6-12
89 Circular BSD/06/2002, Moderation of Interest Rate, accessed July 2010
90 Circular BSD/02/2004, The Need to Adhere to the Agreed Lending Rates and Other Charges as
Provided in the Guide to Bank Charges, accessed July 2010
91 Circular BSD/DIR/GEN/CIR/V.1/001, RE: Moderation of Interest Rates, accessed July 2010

Financial Services Landscape in Nigeria
54
• By April 2009, however, temporary interest rate caps were in effect both for lending (max. 22%, plus up to 2% for fees and other charges) and for deposit-taking (max. 15%). According to the Circular, these caps were to remain in effect from April to December 2009.92 While no further Circulars have been issued to clarify this point, it seems that these interest rate caps expired on 31 December 2009, so banks and other financial service providers are now free to set their own rates
It appears that the combination of periodic policy reforms, non-compliance by certain financial service providers, and difficulties with enforcement have contributed to an environment of uncertainty with respect to interest rate caps. Some providers believe that caps are still in effect, while others do not. There are wide disparities in the market and even within the CBN as to whether interest rate caps exist, how they are to be calculated and whether they will be seriously enforced.’93 The same uncertainty still prevails among those interviewed in the course of the current survey.
5.2.4 Secured Transactions Law
In most cases, prospective borrowers are required to provide collateral. However, the process for registering loan collateral is both costly and time-consuming. Although credit bureaux are at an infancy stage, hopefully in the long term they will provide reliable information on customers’ creditworthiness, which may encourage banks to provide loans and consumer credit to the Nigerian mass market.
Registration of Land or Real Estate: The process of creating a security interest in real estate or land is particularly complex, as all land and real estate in Nigeria is held by the Governors of the respective States of the Nigerian Federation in trust and on behalf of the people; the Governor is authorized to grant 99-year leases. Therefore, the Land Use Act requires parties to seek the Governor’s consent to use land as a security interest.94 This process is both costly and time-consuming. In addition, other fees such as stamp duties (Stamp Duties Act) and registration fees (Companies & Allied Matters Act, state-specific Land Instrument Registration Acts) drive up the cost of creating security interests.95
Registration of Movable Assets: With respect to movable assets, Nigeria is a signatory to the Cape Town Treaty and the International Registry of Mobile Assets. There is a plan to set up a registry for movable assets. Nevertheless, the process for registering movable assets, while quicker than that for real estate and land, is still costly due to stamp duties and registration fees.96
When viewed on a global scale, Nigeria has one of the world’s most costly and time-consuming property registration regimes. The typical cost for registering property in Lagos is over four times the average for OECD countries and more than twice the average for sub-Saharan Africa. In addition, the process takes over three times as long in Nigeria as in the
92
Circular BSD/DIR/GEN/CIR/03/003, Sanctions for the Violation of the Decision on Maximum Deposit Rate, Lending Rate and Other Charges. (April 8, 2009)
93 See CGAP, Access to Finance in Nigeria, p65
94 Land Use Act, Sections 1, 22
95 Atty. Tominiyi Owolabi, Head of Specialised Transactions Practice, Olaniwun Ajayi LP (July 13,
2010)
96 Atty. Tominiyi Owolabi, Head of Specialised Transactions Practice, Olaniwun Ajayi LP (July 13,
2010)

Financial Services Landscape in Nigeria
55
average OECD country. Overall, Nigeria is ranked #178 out of 183 countries for ease of property registration.97
5.2.5 Bankruptcy Law
While the legal framework for corporate insolvency is fairly well-developed,98 the legal framework for individual bankruptcy has come under criticism. In practice, creditors rarely initiate individual bankruptcy proceedings, largely because they would have to obtain a judgment and serve a notice of judgment against the debtor prior to initiating bankruptcy proceedings.99 As a result, this procedure is cumbersome and costly for creditors to enforce their rights against debtors.100 This may serve as a further disincentive for creditors to lend to individuals.
The lack of a debt recovery tribunal exacerbates the inherent weaknesses in the legal framework by forcing creditors to go through the Federal or State High Courts, which suffer from limited capacity. A specialized debt recovery tribunal could fast-track the judicial process, saving time and money and allowing the tribunal to specialize in such matters.101 However, the Nigerian Constitution would appear to prohibit the establishment of such a tribunal unless it was subordinate to a High Court,102 which would not likely solve the problem.
5.2.6 Regulation of Microfinance Banks (MFBs):
The current framework has already led to a MFB subsector that consists largely of small, poorly capitalized institutions with low capacity and high risk of failure. Many argue that there is a need to reduce the number of institutions (as at June 2010, there were 901 MFBs103, 98.9% of which were Unit MFBs104). Furthermore, current geographic restrictions may limit growth opportunities.
International experience suggests that the costs of supervising a large number of small financial institutions may be significant. In the Philippines, for example, the creation of a new regulatory window for rural banks in the 1990s led to a proliferation of 824 institutions, which constituted 83% of the total institutions under the central bank’s supervision. These institutions accounted for only 2% of total banking industry assets. However, since many of these institutions were weak (20% were shut down in the early 1990s), a great deal of
97
http://www.doingbusiness.org/ExploreEconomies/?economyid=143#RegisteringProperty, accessed in July 2010
98 There are significant challenges in the court system that affect implementation; but the legal
framework itself is sound
99 In contrast, British creditors, for example, may submit a statutory demand notice for debt payment, and the debtor must apply to set aside the notice within three weeks, or else the creditor may proceed with the bankruptcy petition
100 Eghobamien, Osaro, Bankruptcy Law: A Need for Urgent Reform accessed in July 2010
101 Kris Muo, Secretary, Financial System Strategy 2020 Legal Implementation Committee (July 12,
2010)
102 Constitution of the Federal Republic of Nigeria, Section 6
103 OFID, CBN
104 As of October 2008. See CGAP, Access to Finance in Nigeria, p14
Financial Services Landscape in Nigeria
56
supervisory capacity was spent on these small institutions, thereby reducing available resources for supervising larger banks.105
5.3 Systemic constraints
Although the meso106 layer captures a wide range of factors, we have chosen to touch on a small number of issues that appear to be dominant. A number of these observations would benefit from greater empirical evidence (which is lacking in Nigeria) but as they came through quite consistently from the fieldwork as important issues we believe they should be addressed.
5.3.1 Lack of accessible consolidated financial sector data
‘The lack of readily accessible market and financial institution performance data undermines the decision-making of all stakeholders in the financial sector: policy makers, regulators, investors, and the public.107 Even for DMBs it is also difficult to get data on individual institutions in order to make comparisons and observe trends: even some of the deposit money banks and MFBs/MFIs interviewed in this survey were unable or unwilling to provide comprehensive data. As a result, is difficult to have a complete picture of the financial sector without consolidated data: analysis had to be based on the CBN data, or on DMB Annual Reports, which are difficult to consolidate, and not always up to date (some DMBs, for example, had not, at the time of writing (July 2010) published their Annual Reports for 2009).
There is clearly a great need for data among financial institutions. Financial service providers reported that they find it difficult to get the market data they need to develop financial inclusion strategies.
Given the emphasis throughout this study on the importance of evidence-based policy development and the need for financial institutions to respond to market signals, the shortage of appropriate data constitutes a significant constraint to the access agenda108.
5.3.2 Lack of credit information
Lack of credit information is still a problem but is being rectified. There are two functional privately run credit bureaux – CRC Credit Bureau in Lagos and XDS in Abuja, and a third has been licensed (Credit Registry). Inevitably there is a lag between the licensing of the credit bureau and when comprehensive data which will be valuable to its users is available. However, the regulatory requirement for all financial institutions to register with at least 2 bureaux will help to build critical mass. Thus, an important constraint to access, especially for lending to SMEs, will start to diminish. The issue will remain as to how much the microfinance subsector will benefit from the system. The incentives for MFBs to participate are much weaker than for DMBs – the membership fee (N200,000 for DMBs and N175,000 for MFBs) is obviously a more material cost to MFBs than to DMBs. So far, only 5 MFBs (all in Lagos) are actively contributing to CRC. Interestingly, the lack of access to credit information (i.e. on borrowers) was cited as the main constraint to growth by a number of MFBs interviewed.
105
See Christen & Rosenberg, The Rush to Regulate, pp5-6
106 The enabling environment including payment systems, credit information, etc
107 CGAP, Access to Finance in Nigeria, 2009, p.54
108 The most appropriate data is market information on demand as well as credit information

Financial Services Landscape in Nigeria
57
5.3.3 Lack of an integrated national ID system
The lack of an integrated national ID system affects banks and insurance companies and has a direct impact on access because of KYC requirements. Not all Nigerians have a National ID card (despite long standing initiatives by the Federal Government to extend coverage). Therefore, relevant agencies have had to develop their own identification systems and so there has been a proliferation of parallel ID systems in the market which is clearly inefficient.
5.3.4 Skills shortages
It would be surprising if the banking industry had grown as fast as it had without experiencing extreme skills shortages in certain areas. The banking consolidation is considered to have forced an improvement in the professionalism of bank staff but, still, keeping pace with growth has required a huge investment in training. Currently there are simply not enough qualified bank staff with the requisite skills to serve a mass market as large as Nigeria’s, still fewer with the more specialised skills required to serve the market at the bottom of the pyramid. One consequence of this is that some banks have chosen to expand internationally instead of addressing opportunities in the domestic market.
The Chartered Institute of Bankers of Nigeria was established in 1976 to set the standards for skills in the industry and to conduct professional examinations leading to certification of qualified personnel. It also organises lectures, seminars and training programmes. Our sense is that, whilst it is critically important to have such an institution as part of the financial system, it could make a greater contribution than it currently does, especially relating to policy. The consolidation has also led to people with mainstream banking skills being recycled into the microfinance subsector. Whilst on the one hand it has allowed some MFBs to introduce and operate some deposit money bank-style processes reasonably effectively, it has also had two consequences (apparent from our field work) that do not augur well for the long term health of the MFB subsector.
Firstly, there is some evidence that some ex-bankers have been trying to run MFBs with all the trappings of mainstream banks (e.g. well-appointed offices, inappropriate expansion strategies) and have allowed costs to get out of control. These ‘hobby microfinanciers’, seem to be motivated by the status of the banking license rather than the desire to develop a real business.
Secondly, many MFBs have not been able to develop scalable credit products that meet the particular needs of their client base and have attempted instead to lend in more conventional ways, with the result that they find few lending opportunities. The result is a significant mismatch of assets and liabilities. This kind of business model is clearly not financially sustainable in the long term.
The microfinance subsector would benefit from the shared costs and efficiencies of a centralized training facility, the absence of which is clearly a challenge for the smaller MFBs although the larger ones, such as LAPO109 with its Academy for Microfinance and Enterprise Developments, can develop their own facilities.
MFBs make quarterly returns to CBN (and other regulators) but CBN discloses very little of this data publicly, either by individual MFB or by subsector. Indeed the only data that is
109
LAPO was granted an MFB license in June 2010, prior to that it operated as a MFI

Financial Services Landscape in Nigeria
58
publicly available is an annual high level summary for the subsector produced in CBN’s annual report. This is clearly insufficient from a consumer protection point of view and is also unhelpful for investors as well as for any banks wishing to explore operational linkages with MFBs. OFID suggested this lack of disclosure was because of operational constraints, rather than wanting to manage the information flow.
Capacity constraints at NAICOM, the insurance industry regulator, are also thought to be part of the reason why insurance penetration is so low. The industry has developed a poor reputation partly because its regulator is weak and has not been able to crack down on abuses such as the existence in the market of fake insurance policies110. Capacity constraints at NAICOM extend beyond human capital constraints and include very rudimentary IT systems.111
5.4 Organisational and product based constraints
If organisations are not able to deliver appropriate, affordable products to the low income segment profitably, then access will not improve without some form of subsidy.
There are two aspects to this which needs to be considered. The first is the way the strategic positioning of a bank feeds into its cost structure and determines its efficiency. The second is whether the entry-level products that are available in the market (savings accounts, loans and money transfer products) are within the reach of the target market – i.e. are affordable, physically accessible and appropriate. ‘Appropriate’ is essentially a combination of whether the product meets the needs of the target market and does not exclude through design features or eligibility criteria.
5.4.1 Organisational constraints: physical accessibility
As regards physical accessibility, it is clear from Section 4 that there are stark regional differences. While the debate on access to financial services has switched in recent years to focus on the potential for branchless banking, physical points of presence will still have a significant role to play in the years to come, either as ‘hubs’ in hub-and-spoke distribution models or as centres for client servicing on transactions that are difficult to fulfil using mobile phones (e.g. credit assessment).
The issue is as much about population density per bank branch or ATM as it is about physical distance to travel although we know from EFInA’s Access to financial services in Nigeria 2008 survey that 24% of people say that they do not bank because the bank is far away and 10% say that it costs too much to travel there. EFInA’s survey indicates that over 50% of the banked population spend over N50 on a one-way trip to get to the bank.
EFInA’s research (Scoping Study on Payments Systems in Nigeria) estimates that there are 10,000 ATMs deployed in Nigeria including those operated by non-bank independent ATM providers, which equates to about 70 ATMs for every million Nigerian. By way of international
110 It is estimated that 60-80% of compulsory motor vehicle insurance ‘policies’ are fake
111 Achieving Nigeria’s Financial System Strategy 2020 (World Bank, May 2010)

Financial Services Landscape in Nigeria
59
comparison, Kenya has 40 ATMs per million112 and South Africa (according to 2005 data) had approximately 175 ATMs for every million inhabitants113.
Penetration of PoS devices is also extremely low. EFInA research (Scoping Study on Payments Systems in Nigeria) indicates that there were about 11,000 PoS machines deployed in Nigeria at the end of 2009, a ratio of 80 PoS terminals per million inhabitants, compared to 14,000 in South Africa, worse even than Zimbabwe, with its 130 PoS terminals per million inhabitants. The same research estimates that only 23% of installed PoS machines in Nigeria are active.
Whilst some geographic areas have practically no bank branches, bank branches in other areas are swamped with people – at least two of the leading banks we spoke to referred to the problem of people ‘clogging up ‘ their banking halls as a major (if not the major) client-servicing challenge.
CBN is also exploring ways of providing financial services through the 7,000 Post Office (NIPOST) branches. This is a very interesting opportunity for expanding outreach in the future but the project is at an early stage. Deposit money bank branches and points of service are of course only part of the picture. To this, must be added the outreach of the development finance institutions and MFBs.
NACRDB, as we have discussed, has a branch network of 201 (more than GTBank or Diamond Bank) and while not enough to cover the entire country is nevertheless a substantial presence as its sizeable customer base indicates.
Considerable hope has been placed in the outreach of the MFBs which, although numerous, still only reach about 0.6% of adults. We have obtained data on MFBs from OFID which is extensive but incomplete. For example, of Nigeria’s 901 MFBs, 166 are in Lagos and 42 are in Abuja. Katsina and Jigawa, meanwhile, have only 5 and 7 MFBs respectively, whilst these states have populations of 5.7 million and 4.3 million respectively. The concentration of MFBs in urban areas is one of the motivations for the proposed revision of the Microfinance Policy Framework.
5.4.2 Product-based constraints: affordability and appropriateness
Affordability114
It has been suggested that affordability is determined by the ‘barrier’ effect and the ‘inhibitor’ effect.115 The barrier effect prevents people from owning a bank account (e.g. because of minimum opening balance requirements), while the inhibitor effect prevents people from making use of the bank account because of the recurrent cost of transaction fees.
Our reference point is EFInA’s Access to financial services in Nigeria 2008 survey which reports that of those who disclosed their income, 40% had monthly income in the range 112
Figures from FinAccess 2009 and CIA World Fact Book 113
Figures from Reaching Out: Access to and use of banking services across countries, a World Bank paper (Beck, Demirguc-Kunt and Peria, 2006)
114 We consider the pricing of ‘entry level’ savings and loan account to ascertain whether pricing is
exclusionary. Clearly, such considerations are entirely academic if a product is not physically accessible
115 See Telecoms demand: Measures for improving affordability in developing countries (Milne, C,
2006)

Financial Services Landscape in Nigeria
60
N3,000 to N13,000. We focus our analysis on the poorest of these, at N3,000 a month, and the mid-point, at N8,000 a month,116 against which to compare the price of banking products. We realise that the absolute level of income alone is not the only determinant of affordability – the nature of that income, such as its source and lumpiness, also matters – but it is a useful starting point.
We also preface our comments by noting that relatively few people regard the cost of banking as a deterrent, according to EFInA’s Access to financial services in Nigeria 2008 survey, as Table 5.2 shows.
Table 5.2 Reasons for not banking
Reasons for not banking Per cent of unbanked
population (%)
It is expensive to have a bank account 16
Charges and fees are too high (e.g. account opening fee, monthly maintenance fee
4
Interest [on savings] is low 7
It is clearly not immaterial that 16% say that it is expensive to have a bank account but relative to the demand side constraints such as ‘I don’t have enough money to open an account’ (48%), it is modest.
One of the encouraging developments in Nigeria’s financial markets (which is covered in greater detail in Chapter 6), is the extent of innovation taking place around the access frontier, by both niche providers and by mainstream banks, thus ensuring there is a reasonable chance that these innovations will achieve some scale.
Our general conclusions on affordability, however, are that despite encouraging signs that some product innovation is taking place that is sensitive to the affordability issue; banking is expensive for the majority and not especially good value for those who can afford a bank account.
The rates published on 11 June 2010 show that the average interest receivable on savings deposits and on time deposits was 1.8% and 4.4% per annum respectively, while lending rates for most categories of lending (e.g. mortgage, oil and gas, real estate, etc.) were in a range of 20-25% inclusive of charges and commissions117.
116
We recognise that perhaps as many as a third of the population have less income than this but it has to be acknowledged that there is a level of income below which banks (or even MFBs) will simply not go. Note also that almost half of this ‘bottom third’ say they have no income at all
117 Of course this differential is academic to a low income individual who would probably not qualify for
a loan anyway

Financial Services Landscape in Nigeria
61
It has been difficult to get a clear picture on transaction costs attached to savings and current accounts and the volume of heated blog and other internet-based comments on the subject attest to the fact that this is a highly annoying issue for Nigerian consumers who object to having to pay fees for basic banking transactions.
There are probably two issues here – the absolute cost of a typical basket of transactions for a low income customer; and the additional cost of Commission on Turnover (CoT) and VAT.
More significant are the fees that consumers are required to pay for withdrawals and money transfer. One way to assess whether banking is affordable to the target market is to calculate the cost of a monthly basket of transactions and compare this to the person’s monthly income. The rule of thumb is that if that cost comes to more than 2% of income, it is considered to be expensive118. The major difficulty of determining a standard basket of transactions is that transaction patterns vary substantially. However, if we focus our analysis on traditional banking and construct a simple and hypothetical basket of monthly charges (albeit based on a selection of our field work interviews from a range of institutions including banks and MFBs) it is clear that costs to the user could mount up quite rapidly to a level that someone on an income of N3,000 would simply not regard as affordable and would probably be prohibitive even for someone earning N8,000 a month, as Table 5.3 shows.
Table 5.3 Cost of banking transactions
No. of transactions per month
Transaction type Cost per
transaction Total monthly
charge
2 ATM withdrawal N100 N200
1 Deposit - -
1 Money transfer N200 N200
2 Withdrawal of N2,000
N10* N20
Total N420
Total costs as a proportion of N3,000 14.00%
Total costs as a proportion of N8,000 5.25%
* Current accounts only
So, while further analysis would be needed to come up with a better approximation for a standard basket of transactions and charges, we conclude that affordability does not exclude lower income people from accessing an account (‘barrier effect’) but that using the account probably is likely to be too expensive for most people in the target income range. (‘inhibitor effect’).
In Table 5.3, the money transfer charge is the biggest single charge and there appears to be a wide range of charges for money transfer in the market, depending, for example, on whether it’s local or international.
118
This is a complex area, though. See ‘An investigation into the 2% affordability threshold for transactional banking and a cross-country analysis on factors influencing bank usage’ (Genesis Analytics, for FinMark Trust, 2008) for a fuller exploration of the theoretical justification for the so-called ‘2% rule’

Financial Services Landscape in Nigeria
62
One can surmise, however, that with increased competition in the mobile payments market (most of the banks we spoke with are involved in bids for mobile payments licences), the money transfer charge is likely to reduce quite materially.
As regards loans, there is a general lack of information available from many banks’ websites (beyond descriptions of basic loan types) as to how much (or how little) potentially can be borrowed and at what total cost. Minimum loan sizes are particularly hard to come by.
Loans are generally unaffordable for lower income consumers in Nigeria for two main reasons: high interest rates and short repayment periods. High interest rates are function of the general climate (CBN regularly publishes the lending rates of banks, by industry sector – banks are lending into all sectors at 20-25% per annum inclusive of charges and commissions119) and the extra costs associated with servicing small loans. MFBs lend at between 2.5% and 5% per month. Repayment periods are typically 6-9 months, sometimes a little longer.
Let us assume that a borrower takes out a loan of N30,000 over 9 months and pays interest on the loan at 3.5% per month. Monthly repayments of interest and capital120 would be N4,383. If we assume, further, that it would be imprudent for debt servicing to absorb more than one-third of the borrower’s total monthly income, then customers would have to earn at least N13,281 per month to qualify.
However, few DMBs lend in amounts as low as this and so it is clear that most people in the target N3,000 – N13,000 range would only be able to borrow from MFBs, which have limited outreach. It would appear that the bottom of the income range for most credit providers would be a monthly income of at least N20,000 which would suggest repayment capacity for loans of above N50,000. If we are correct in assuming this is where the real access frontier for loans is, this would exclude about 85% of the population.
World Bank research121 estimated that a relatively efficient rural client-focussed MFI would need to charge between 20% and 30% per annum in Nigeria – which is not out of line with what the urban MFBs we spoke with are charging. If we follow the same analysis as above, this means that unless loan sizes are significantly lower in rural areas, there will be significantly fewer borrowers in rural areas to lend to who would be credit-worthy on the basis of income alone – simply because income levels are lower (and more unpredictable). The World Bank research explicitly acknowledges that there are people in rural areas who could not ever pay back loans at these levels of interest (or even lower levels) and suggest that grants programmes to build assets might be one way to start addressing the affordability problem. The same research acknowledges that adashi loans122 that are much more expensive than this are routinely used in the absence of other choices.
Given the affordability constraints on relatively small loans for the target N3,000 – N13,000 income bracket, mortgage finance for the same market seems like a pipe dream. Recent research for EFInA and FinMark Trust estimates that 52% of the population, or 65m of households, are caught in an affordability gap around housing finance for reasons which 119
CBN data at 11 June 2010
120 A straight apportionment across the 9 months, i.e. no bullet repayment at the end of the loan term
121 Rural Finance in Nigeria – Integrating New Approaches (World Bank, 2008)
122 Expressed in terms like “take 1000 pay 1100”, i.e. 10% per month. The same report suggests that
itinerant esusu/adashi collectors are used by people who pay up to 45% pa for the privilege of a safe place to save
Financial Services Landscape in Nigeria
63
include: the high cost of plots of land and housing in urban areas, lack of affordable housing stock; the short tenure and high interest rates associated with bank-supplied mortgage finance; and operational difficulties experienced by the government-led initiative to supply subsidised housing finance through the National Housing Trust Fund working through the Federal Mortgage Bank of Nigeria and the Primary Mortgage Institutions. People who cannot access formal sources of housing finance traditionally access ajo or esusu loans (which are used for a wide variety of purposes) but they cannot meet customer demand.
OFID informed us that housing microfinance was cited as the one product’s that customers wanted from MFBs but was not currently provided. This was not a regulatory constraint, it was related to the difficulty of sourcing longer term finance for MFBs.
Appropriateness
We now consider the question of whether the products and services available to lower income consumers are appropriate to their circumstances and needs.
Typically, this would require analysis of whether products:
• Are or are not exclusionary as regards their eligibility criteria. Products that exclude through eligibility might include those that require account opening documentation that low income consumers often do not have (e.g. a passport); those that require a payslips, thus excluding informally employed people, or: age- or gender-related exclusions, e.g. where a product requires a woman to obtain her husband’s consent
• Have features that do not take into account the users’ social or economic circumstances, or needs. Examples would include long loan repayment terms (e.g. mortgages - these are unattractive to people whose economic prospects are unpredictable); complex documentation; service related issues such as bank opening hours
The functionality of some of the DMB’s basic bank accounts does not appear to be too restrictive. Savers receive interest on their balances; they get an ATM card and have access to internet and mobile banking. The only restriction is to ensure the balance on the account does not exceed a certain amount, typically between N500,000 and N1 million (which, if one earns only N3,000-13,000, is unlikely to be breached).
As regards loans, the major divide, in Nigeria as in most other countries, is employment status. For example, none of the personal loan types advertised on a specific DMB’s website would be accessible by someone who was not salaried (or has collateral).

Financial Services Landscape in Nigeria
64
6 Financial Institutions Response to Challenges that Constrain Access
In a market as large and diverse as Nigeria, it is no surprise that there is an extraordinary range of responses by the financial institutions (in particular the deposit money banks) to the challenges that constrain access.
While some organisations are more bullish than others, the dominant mood seems to be that there is both a need and an opportunity to (i) keep growing (even if the rate of growth is slower, in the wake of the banking crisis, than it was before) and (ii) innovate into new market areas. Overwhelmingly the rationale for exploring new markets, including those in lower income segments, is commercial. While the CBN Governor has been vocal about the need for banks to be responsive to the needs of the wider economy (i.e. the non-oil sector and underserved market segments), the banks also seem happy to accept the encouragement to diversify because it is what they feel they need to do anyway.
The response from the banking industry is partly shaped by the banking crisis. Those banks that were rescued by CBN have curtailed some of their expansion plans. Of those that did not need to be rescued, some of the more established players are consolidating their market positions, concentrating on absorbing the influx of new customers who, in a ‘flight to quality’ are deserting the weaker institutions, but not yet expanding outreach aggressively. There is a small group of newer institutions that are growing rapidly with what appears to be real enthusiasm for the underserved market segments. It is very positive for Nigeria that there is such diversity of approaches, with a wide range of commercial strategies and institutional types, within the banking industry.
Among the MFBs, many are struggling with the financial implications of their previous growth strategies, with many now actively looking for capital. In some cases, MFBs were founded without a coherent and viable business model, soon used up their capital and fairly quickly ran out of money. Others have grown successfully but have reached the limit of what their capital base will allow them to do123.
The insurance industry is both financially and reputationally weak. Its capacity for expansion and diversification is limited and appears more focused on stabilising its mainstream business than on expanding outreach into unserved markets, although there are some micro insurance related initiatives now underway. The industry, having only recently been through a consolidation, has been rocked by a sharp drop-off in demand from the oil and gas sector (the most important sector for the industry) in the wake of falling oil prices. The collapse in share prices has also had a serious impact on profitability. Even personal lines of insurance (e.g. life assurance), small as they are, have been hit by the economic downturn with people cancelling discretionary policies. To cost effectively collect large numbers of small premiums and efficiently serve an expanding customer base, the insurance industry would need better coverage by the banking industry, improved interconnectivity and greater trust of banked customers to sign up to direct debits for payment of insurance premiums.
Despite the challenges that many market players are contending with, there is considerable innovation taking place. The following list provides a selection of some of the innovative
123
This conclusion is based on interviews with MFBs and CBN

Financial Services Landscape in Nigeria
65
strategies currently being pursued or planned by financial institutions to expand the outreach of their products:
• Basic savings accounts – no minimum balances, etc
• Using 3rd party companies to operate agent networks
• Mobile banking (in various forms)
• Using informal-type networks to mobilise savings
• Reaching out to younger people through schools, cooperatives, okada riders
• ‘Prize’ savings accounts
• Virtual touch points
• Microinsurance
• Call centres to enhance the effectiveness of distributed banking models
• Low cost bank branches; hub and spoke branching strategies
• Non-interest (Sharia) banking
• Target savings accounts for Muslim and Christian pilgrimages
• Children’s savings accounts
• Bank-on-wheels
• Tie-ups (potentially) with the post office
• Leasing products for farming tools; agricultural products for cooperatives
There is no way to determine how successful these initiatives will be and in some cases we have not verified if these initiatives are real. However, we believe that they provide a highly positive backdrop on how to improve financial access in Nigeria. With this extent of experimentation going on, there are surely grounds for considerable optimism that Nigeria is well on the way to becoming more financially inclusive in the future.
We consider first how the industry has dealt with the challenge of physical access. As regards investment in infrastructure, some of the banks surveyed in this study have continued to open branches and roll out ATMs despite the banking crisis and have plans to open more in the coming years. This positive outlook for outreach contrasts with a more measured view of branch openings in the future from some of the banks interviewed who believe that there are fewer locations that could support a new branch profitably. But unless banks actively close branches, it is clear that there will be many more bank branches in Nigeria by 2015. A number of institutions are also showing interest in low-cost bank branch designs to keep minimise the cost of their physical infrastructure.
For MFBs by contrast their branch network expansion is constrained by both capital and regulations. One of the larger more established MFBs we spoke to was absorbing a 30% increase in its branch network in recent years and was ‘drawing breath.’ Another successful MFB suggested that it would like to expand incrementally by opening a small number of branches in locations outside the state border but perhaps only 20 minutes away from head office, and was assessing whether it would make sense for it to apply for a national license so that it could do this.
Attitudes towards the mass market are mixed, with some institutions embracing the opportunities whole-heartedly while others are more cautious. One established institution confirmed that it had cut back its lending to lower income customers (but was nevertheless exploring opportunities in agriculture and lending through informal or semi-formal

Financial Services Landscape in Nigeria
66
organisations). A number of banks appear to be experiencing operational challenges with absorbing large numbers of customers from weaker financial institutions.
For product development:
• The extent of experimentation with so-called esusu-style savings mobilisation schemes (involving, typically, the hiring of third party service provider to operate a network of agents using hand held devices to capture transactions remotely) would indicate that the banks are still primarily focussed on densely-populated urban areas, rather than on the very poorly served rural locations. Such experiments are still small in scale, and it is really too early to tell how transformational they will be for financial services in Nigeria. But they are encouraging, not least because they offer savers a pathway to a loans and perhaps therefore to some form of income-generating activity. These schemes, in a sense, symbolise what seems to be the recognition on the part of the industry – that they really need a complete rethink about how financial services can be delivered at scale. There is some interest from a relatively small number of institutions in lending to agriculture and allied activities but issues of high risks and costs of delivery still need to be addressed
• There is acknowledgement from banks and MFBs of the scale of unmet demand among SMEs but as yet only a cautious response (with a few exceptions). Institutions were still grappling with how to deal with the lack of collateral and information gaps that have constrained SME lending
• A small number of banks were interested in exploring opportunities in the affordable housing area but were some way off actually committing to that sector
Clearly developments in the mobile payments arena is creating considerable excitement and most of the banks we spoke to are involved in licence applications in one way or another. Only one bank sounded a more cautious note about mobile money but agreed that, even if it was unlikely to make banks much money, it was an important part of the services that banks needed to offer its customers. However, it is not just banks that are participating in this area: ‘non bank’ payment services providers are also responding to the opportunity and, if successful in obtaining licences and rolling out their business models, will add to the diversity and competition in the sector, to the benefit of consumers.
Technology is an important part of the package and will significantly add to the institutional capacity to efficiently deal with large number of micro/small transactions, but with the following challenges:
• Many technology oriented initiatives are currently focusing on improving services to existing customers rather than reaching out to the unbanked
• The levels of fraud and lack of effective/timely redress mechanisms discourages rapid take up of new technologies (e.g. ATM usage)
• Moreover, technology without comprehensive insights of customers needs is unlikely to be successful
A major conclusion of this study is that some banks are considering the bottom of the pyramid with a range of products/services (mainly technology driven). However a cost effective, customer friendly and scalable model is yet to emerge.

Financial Services Landscape in Nigeria
67
7 Windows of Opportunity to Improve Access to Finance
In parallel with the quantitative analysis of the supply of financial services in Nigeria, questionnaires used during our interviews contained qualitative sections to help us to better understand the policy-making process behind the financial system in the country. This task was undertaken using Political Economy Analysis (PEA).124 Information was gathered on how decisions are made, what actors get involved in the process, what their motivation and priorities are, and how they interact with other public and private sector agents. Key informants were also consulted on related issues like the sort of incentives that should be promoted to expand the provision of financial services by financial institutions.
The objective was to identify windows of opportunity that may play a role in creating a more inclusive financial sector in Nigeria.
From a PEA perspective, windows of opportunity can be created in many different ways – the appointment of a new minister, the merger of several financial institutions, the introduction of some technological innovation, the creation of new channels for public-private dialogue, etc. Often windows of opportunity result from the conjunction of several factors rather than individual factors. All windows of opportunity have something in common, irrespective of how they arise: they have the potential to create a more enabling environment to initiate a new reform process or to strengthen an existing one.125
This section identifies (i) windows of opportunity with the potential to create a more inclusive financial sector in Nigeria; and in each case (ii) factors that may contribute to closing these windows of opportunity; and (iii) how to maximize the impact of the windows of opportunity that are currently opening up in Nigeria.
7.1 Windows of opportunity for a more inclusive financial sector
7.1.1 A shift in deposit money banks’ perception of the bankability of low income segments
During our meetings in Nigeria it was apparent that there is a growing consensus among bankers that their current customer segments are becoming saturated (i.e., corporates and high net worth individuals). Therefore deposit money banks need to downscale to find new sources of both liabilities and assets. That implies exploring new opportunities to reach not only the lower segments of the middle market but, more importantly, to the bankable segments of the low income population, where constitutes most of unbanked in Nigeria. The implications of this shift are deeper, because the objectives of the government regarding
124
PEA cannot lead to quick fixes but it can be practical and useful for enhancing strategies and operations. PEA does not deliver any magic bullet but experience shows that it can be practically oriented and valuable, setting out options and solutions rather than mainly pointing to obstacles. Issues such as the political culture, the way institutions influence economic development, or the links between international agents, like donors, and local actors are important to understand better the context surrounding the financial sector in any given country
125 Windows of opportunity should not be confused with tipping points. A tipping point is a small, often seemingly insignificant adjustment that, however, may produce far-reaching reforms. Windows of opportunity may or may not produce far-reaching reforms. That is why it is so important, when discussing windows of opportunity, to explore what actions result in windows of opportunity being neutralized or maximized. For more information on this issue, see: Pierson, P. (2004) Politics in time, history, institutions and political analysis. Princeton University Press, Princeton

Financial Services Landscape in Nigeria
68
financial inclusion are also aligned with the strategic objectives of deposit money banks.126
Factors that may contribute to closing this window of opportunity
One of the main conclusions of the fieldwork is that it is very unlikely that the banks’ downscaling process will produce in the short term a significant impact in terms of outreach or scale. The adjustment process will be long and gradual, with small quick wins helping to consolidate more ambitious actions.
Appropriate sequencing of banks’ downscaling is therefore crucial to the success of the process.127 The correct sequencing can be difficult to achieve, particularly in relation to regulation and supervision. New interventions require regulations and even laws to be revisited and revised as the market develops. A flexible approach is often useful, introducing relatively light-touch supervision when a market begins to develop, keeping a close eye on developments, and introducing tighter regulations as the market matures.
The capacity of the CBN to facilitate, or hamper, the appropriate sequencing of the process by creating regulatory and supervision incentives/disincentives for banks downscaling will be critical during these early stages. The capacity of the CBN to deal with what are perceived by many as conflicting objectives (security as against extended outreach) will also determine its capacity to create incentives/disincentives.
How to maximize the impact of the shift in the perception of deposit money banks regarding the bankability of low income segments of population
The creation of working groups comprising deposit money banks involved in downscaling processes and the CBN can be useful (a) to identify constraints and barriers, and (b) to define road maps to achieve the objectives both from the perspective of deposit money banks and the CBN. The FIU described in section 7.1.2 could play an important role as a facilitator between these two groups.
However, the most important way to maximize the impact of the shift in the mentality of banks is by generating early and visible results that can be replicated by other banks. In other words, creating a demonstration effect to prove that low income segments of population are bankable and profitable is critical.
By providing support to deposit money banks’ initiatives to downscale their services, EFInA’s Innovation Fund can continue to play an important role in catalysing innovation. The Fund
126
Subjective perception of problems determines the agenda-setting of policy reforms. This is why very often different actors, each of them with a different perception of the same problem, react in different ways. For decision makers, source and motivation of perception can be formed either internally or externally (Grindle and Thomas, 1991). In the case of Nigerian bankers, their perception is formed both internally and externally – decreasing profits margin help to shape internal perception, while the existence of public policies on financial inclusion help to shape external perception
127 The sequencing of banks´ downscaling is a context-specific process. There is therefore no widely
accepted recipe. However, there are some “common sense principles” that should be observed in any process. There would, for example, be little point in introducing a sophisticated real time gross settlement system for deposit money banks before the management information systems of a significant number of banks are able to support internal and external electronic clearing. On the regulatory side, the introduction of international accounting standards (IAS) must obviously be completed before reporting standards based on IAS are imposed. Similarly, the introduction of sophisticated international standards of compliance and supervision designed for mature and complex financial sectors, at too early a stage will hamper the development of that market

Financial Services Landscape in Nigeria
69
will provide support on a competitive basis, for initiatives that are sustainable in the long term but need financial support to undertake the risks involved in downscaling. The existence of such funds can also contribute to strengthening the position of champions of reforms within deposit money banks.128
7.1.2 The creation of a Financial Inclusion Unit (FIU) within the CBN
This is potentially the most important window of opportunity to increase access to finance in Nigeria. Improving access to and use of financial services, for growth and welfare, is one of the main policy principles captured in FSS 2020. However, putting into practice this principle will be extremely difficult without the creation of a specific unit that can (a) collect and disseminate reliable information on financial inclusion; (b) participate actively in the decision-making process of the different divisions of the CBN; (c) support evidence-based policy making; (d) contribute to guaranteeing the correct implementation of measures aimed at increasing access to financial services; and (e) disseminate good practices and lessons learnt on financial inclusion.
The overall objective of such a Unit should be to make financial inclusion a cross-departmental theme within the CBN.
Factors that may contribute to closing this window of opportunity
The chances of success of a Financial Inclusion Unit will be dramatically reduced if it does not have (a) adequate means, (staff and resources) and (b) an ample mandate to achieve its objectives. The FIU needs to have the capacity to consolidate financial inclusion as a cross-cutting theme within the CBN. That means acting proactively to help different departments to give their policies a more inclusive edge.
Only in this way, will it be possible to introduce reforms in the organizational culture of the CBN. That means that all strategies, policies and actions should be reviewed in light of their potential implications for financial inclusion. If the FIU is given a merely reactive or consultative role, a change in mind-set within the CBN will be more difficult to achieve. This kind of organizational change is path-dependent – gaining momentum during the initial stages is critical. If the FIU does not receive enough support and have a strong mandate, it may be marginalised.
How to maximize the impact of the Financial Inclusion Unit as a window of opportunity
The Alliance for Financial Inclusion (AFI) is a global knowledge-sharing network designed exclusively for financial inclusion policymakers from developing countries.129 AFI has more than 80 members who represent more than 70% of the world’s unbanked population. AFI’s
128
Although bankers consulted agree that banks need to downscale their services, it would be naïve to think that reformers will not face different degrees of internal resistance to such movements. This is particularly evident if we consider that the structure of the banking industry was defined as oligopolistic before 2004 (Chukwuma, 2007). Although the situation has changed significantly in recent years, some features from the past remain: virtually all banks are still working in the same segment of the market, with the same clients and offering very similar products. This situation, together with the absence of a dominant or leading institution in the market creates a paradox in terms of competition: banks’ strategic decision making is heavily influenced by other banks’ actions, creating a situation of stalemate, where everybody is ‘afraid’ of doing something radically new. However, the experiences of Equity Bank in Kenya show that with the right leadership and the right business model it is possible to break with this stalemate
129 http://www.afi-global.org/

Financial Services Landscape in Nigeria
70
objective is to support developing country knowledge exchange on financial inclusion policy that will enable an extra 50 million people living under the poverty line have access to basic financial services by 2012. AFI’s Steering Committee is comprised of five member organizations. The Committee provides overall strategic guidance on meeting objectives and building the network. In 2010, the CBN became the fifth member of the Steering Committee, together with the Central Banks of Mexico, Kenya, the Philippines and Thailand.
Promoting institutional cooperation is one of the key strategies to strengthen the FIU. The presence of the CBN in the Steering Committee of an institution like AFI will help to reinforce the institutional cooperation capacity of the FIU both at national and international levels. That is critical to strengthening technical capabilities within the CBN. It will also raise the public profile of the Unit, which is critical to creating public support for reforms.
7.1.3 Financial System Strategy 2020 (FSS 2020)
Aimed at creating the safest and fastest growing financial system amongst emerging markets, FSS 2020 has the potential to bring overall guidance and policy stability to the financial sector. This is particularly important because decades of weak governance and political instability in Nigeria ‘created a high level of public cynicism towards government’ (Utomi et al, 2007, pg. 26).130 Stakeholders agree that policy inconsistencies, poor levels of co-ordination and communication between actors, as well as the lack of an overarching framework contribute to constraining the potential of the financial system, weaken its credibility and therefore reduce the trust of the public and international actors in it. 131 The following strengths of the FSS 2020 may play an important role to correct all these issues:
• It has a broad-based vision – it includes all segments of financial sector
• It is able to bring all stakeholders to the discussion table
• It recognizes and endorses the need for systemic rather than incremental change
Factors that may contribute to closing this window of opportunity
Changing organizational culture is a challenging task. For the reforms proposed by the FSS 2020 to succeed a change of mind set is required by financial authorities. In this process, the CBN will be faced with multi-layered challenges (internal and external) to transform its organizational culture. That involves championing a highly complex, interactive process with ramifications both at internal and external levels. Without a serious and immediate effort to move from vision and strategic objectives to implementation, the FSS 2020 will lose momentum.
How to maximize the impact of the FSS 2020 as a window of opportunity
Interviewees mentioned the high level of participation and the sense of ownership as the main strength of the FSS 2020. Maintaining the same level of ownership during the implementation of reforms is even more important. The best way to do this will be by actively involving stakeholders and civil society during this phase. To do so, it is necessary to create
130
Utomi, P., Duncan, A. and Williams, G. (2007). Nigeria, the political economy of reform: strengthening the incentives for economic growth. The Policy Practice, October 2007
131 Experience demonstrates that the level of trust in a financial system is an important factor
determining the attractiveness of investing in a country. Poor levels of accountability and communication also contribute to increasing this effect

Financial Services Landscape in Nigeria
71
new dialogue channels or to reform the already existing ones, like the Bankers Committee.132 Public - private cooperation needs to be fostered as a way to facilitate alignment of objectives.
Developing an effective monitoring and evaluation (M&E) process, as proposed in section 5.1.5 is critical. Implementation needs to be accompanied by the establishment of a M&E assessment framework that will not only increase public accountability and transparency but will also help to overcome vested interests. This structure will help financial authorities to increase stability and to improve evidence-based decision-making.
Another key success factor for FSS 2020 is the level of political support that CBN and regulators may receive. Experience shows that the level of political awareness and support received by initiatives like FSS 2020 is directly proportional to the level of development of financial inclusion strategy and policy.133
7.1.4 The National Association of MFBs
One of the main features of the political economy landscape in Nigeria is that while interested parties have played a major role in enabling and blocking reforms, they have often acted singly, rather than collectively or in coalitions, and through personalised connections with political leaders. A good example of that is the absence of a Bankers Association in Nigeria, i.e. an association of banks formed to pursue common interests and act as a pressure group.134 The recent creation of a National Association of MFBs (NAMB) creates
132
Experience in many countries Latin America countries, like Bolivia, Peru or El Salvador shows how the formation of “financial sector roundtables” effectively contributes to building more stable financial sectors. Formed by a relatively small number of members (between five and ten) representing public and private sector agents as well as international actors, these spaces create new opportunities for a heightened level of dialogue, which is central to improved market co-ordination
“Financial sector roundtables” are built following a pyramid structure, with representatives of one particular sector being elected by its own members. Meetings are held periodically, usually quarterly, although monthly meetings can be arranged to monitor progress on particularly important issues at critical times. The advantages of such structure are twofold:
Upwards, it promotes more effective participation, creating new opportunities for financial institutions to be heard
Downwards, it is an incentive for institutions with similar interests to strengthen their links, facilitating intra-sector dialogue and communication
These groups play an advisory rather than an executive role, though they may also act as a counterbalance within the decision-making process. By bringing together public and private financial sector agents, as well as donors, these groups could have a positive impact (a) as an arena where financial sector agents can meet to discuss weaknesses and opportunities within the financial sector, providing comments and suggestions to authorities about the best way to overcome the former and enhance the latter; (b) encouraging transparency, good practices and ethical codes; and (c) contributing to the dissemination and exchange of information and encouraging the creation of new bonds of trust between financial sector agents 133
AFI (2010). State of financial inclusion policy in the developing world. Alliance for the Financial Inclusion, Bangkok
134 The Bankers Committee – a committee formed by bank Manager Directors and the CBN, with the
CBN Governor as Chairman, cannot be seen as an equivalent to a bankers association. The committee meets once a month and the meeting serves, according to stakeholders, mainly as a forum to pass down instructions by the CBN or, as best, to persuade banks to buy into some government or CBN-sponsored developmental initiatives. Being chaired by the CBN, the Committee cannot meet

Financial Services Landscape in Nigeria
72
new opportunities (a) to provide an arena where public and private agents may discuss weaknesses and opportunities for the microfinance subsector; (b) to encourage transparency, good practices and ethical codes amongst MFBs; and (c) to contribute to the dissemination and exchange of information.
Factors that may contribute to closing this window of opportunity
The NAMB has formidable challenges ahead, including achieving public awareness and acceptance, reversing the public’s negative image of the subsector, developing a culture of membership services and supporting capacity building measures. Eventually the NAMB aims to be able to oversee a MFB subsector that is partly self-regulated, but this role is a somewhat distant aspiration at present.
However, none of these objectives will be achievable unless the NAMB is seen as legitimate by the entire MFB subsector. That involves the creation of an adequate governance structure that guarantees dialogue and participation and well as representation.
How to maximize the impact of the NAMB
International experience has shown that microfinance industry associations almost always suffer from financial and managerial capacity constraints. The role that development agencies or institutions like EFInA may play to fill these gaps is critical during the early stages of the NAMB. However, providing this kind of support also involves important challenges. A number of lessons have been learned on how these challenges should be approached: (a) providing external technical assistance only in response to genuine demand; (b) recognising that many of the greatest challenges will be at governance level; (c) adopting a sufficiently long term-scale for the institutional development of the NAMB; and (d) providing technical assistance not just to the NAMB, but also to its associates.
In addition, it will be necessary for the NAMB to focus on a small number of objectives and deliver these well rather than spreading itself too thinly. Skills development is surely one area that it should prioritise, not necessarily delivering training services itself but coordinating training activities by a variety of partners.
7.1.5 The outreach of telecom companies in Nigeria.
While 79% of population in Nigeria remains unbanked, there were more than 70 million mobile lines in the country, resulting in a penetration rate of 50% of the population (Figure 7.1)135. The EFInA Access to financial services in Nigeria 2008 survey found that over 25 million people that have access to a mobile phone are unbanked.
without the CBN to air differences in confidence and cannot therefore function as an independent industry association
The Chartered Institute of Bankers of Nigeria cannot be seen as an association of bankers formed to pursue common interests and act as a pressure group. Their main responsibility is banking training and certification and their contribution to the design, formulation and implementation of banking policies has been weak over the years, according to interviewees
135 Pyramid, (2010). The impact of mobile services in Nigeria: how mobile technologies are
transforming economic and social activities. Pyramid Research, Abuja March 2010

Financial Services Landscape in Nigeria
73
Figure 7.1 Subscribers to mobile phones in Nigeria 1999-2009
Source: Pyramid Research, Abuja, 2010
Experience in other African countries has demonstrated the potential of mobile banking services to expand the frontier of financial services.136 Deposit money banks are aware of this situation and they see the combination of agent banking with mobile banking as the most likely route to downscale their services. Some DMBs are actively developing mobile banking products, and most of those we interviewed have applied or are considering applying for a mobile payments licence, either as a lead or as a member of a consortium.
Factors that may contribute to closing this window of opportunity
The establishment of proportionate regulations that provide an open but safe environment is a key element in determining whether mobile banking will contribute to reducing financial exclusion in Nigeria. The underlying concern about safety is the consideration for policy makers to ensure e-money and related services are provided by adequately capitalized and reputable institutions. There needs to be an honest and open dialogue involving the CBN and private actors (telecom and deposit money banks) to ensure that the regulations are appropriate.
How to maximize the impact of the outreach of telecom companies in Nigeria
Creating an enabling and trusting environment for public-private dialogue is often seen as a pre-condition to develop safe and successful mobile banking models. The development of pilots aimed at (a) validating the feasibility of the proposed model, from a technical, business model, and processes perspective; (b) validating the potential positive impact of the model in terms of adoption, usage, etc.; and (c) enabling stakeholders to gain experience and allowing
136
M-PESA has experienced rapid growth and currently enjoys a subscription base of more than 10 million registered customers (more than half the adult population of Kenya many previously unbanked). The usage of semi-formal financial services (including m-payments platforms such as M-PESA) has increased from 8.1% in 2006 to 17.9% in 2009, while the proportion of the population with access to only informal financial services, decreased from 35% to 26.8% and the share of the population excluded from any financial service decreased from 38.3% to 32.7% – suggesting strong gains in financial inclusion coinciding with the introduction of M-PESA. (Information from Financial Sector Deepening Trust Kenya and OPM research)

Financial Services Landscape in Nigeria
74
regulations to evolve in tandem with market, can also contribute to developing more successful mobile banking models.
7.2 Other elements to consider
7.2.1 Who is championing reforms in Nigeria?
When approaching financial reforms from a political-economy perspective, the identification of who is championing these reforms and the motivational forces driving the process needs to be addressed.
In the case of Nigeria, senior management of CBN, led by the Governor, can be seen as the champion of the reforms. Most of those interviewed during the survey agreed on this point. The CBN’s blueprint for reforming the Nigerian financial system in the next decade is built around four pillars:
Pillar 1: Enhancing the quality of banks
Pillar 2: Establishing financial stability
Pillar 3: Enabling healthy financial sector evolution
Pillar 4: Ensuring the financial sector contributes to the real economy
The current Governor of the CBN is often defined as ‘courageous’ and ‘charismatic’. It is also mentioned that he possesses a ‘sense of mission’. Those interviewed agreed that it is likely that he will encounter obstacles in implementing the reform programme inside as well as outside the CBN.
Some stakeholders have suggested that the best way to provide support to the reform process initiated by the CBN is by strengthening the linkages between the CBN and some key external allies, including international institutions and donors. In our opinion, this suggested approach does not take into sufficient account the peculiarities of the national culture in Nigeria.137 In fact, any external support received by a reformer can even be counterproductive if it does not adopt a low-key approach that respects Nigerian leadership and ownership.
The best way to increase the political capital of reform champions and generate pressure for further progress is by broadening the wins of the reforms process in the financial system. That is, by strengthening the positive effects of Pillar 4 of the CBN programme (ensuring the financial sector contributes to the real economy) by allowing more low income people to get access to and make better use of financial services.
Breaking the glass ceiling (as many stakeholders put it) between the financial sector and the real economy will not only increase the political capital of the CBN but it will also put it in a better position to exert more moral suasion on stakeholders to embrace the reform process.
137
During the fieldwork stage in Nigeria we had many opportunities to see that this is a proud country, with people keen to proclaim its power, sovereignty and independence. This was easily appreciated not only by reading the newspapers or watching TV but also during informal conversations with people in the street

Financial Services Landscape in Nigeria
75
7.2.2 Facilitating connectivity within the financial system
The analysis of the Nigerian financial sector reveals a low level of connectivity in the system, which in turn may create negative path-dependence. 138 This is not to suggest that there is no cross-industry collaboration at all – the banks’ investments in NIBSS (the Nigerian Inter-Bank Settlement System, which owns the Nigerian Central Switch) and the CRC Credit Bureau demonstrate that banks are prepared to collaborate in the wider interests of the industry. We believe, however, that the industry would benefit from a collaborative process around the development of more inclusive markets in general (rather than collaborating ad hoc on a project by project basis).
Despite this willingness to collaborate, the lack of proper institutional channels for inter-agent dialogue and communication acts as an important barrier. In fact, all communication channels start and end in the CBN, who acts both as gatekeeper and baggage handler of the system. The hub and spoke model can be represented as a nucleus communicating with many smaller agents, none of them connected to the others, as shown in Figure 7.2.
Figure 7.2 The centralized model of connectivity
The reforms in the financial system in recent years have contributed to the improvement of connectivity, although some of those interviewed suggested that they have created islands of progress. Indeed, the Governor of the CBN in his speech of 26 Feb 2010 acknowledged the need to strengthen the connectivity even between CBN and NDIC when he made reference to NDIC warnings to CBN pre-August 2009 which were not heeded by the latter.
The hub and spoke structure reflects the wider economic landscape in the country, as explained Chapter 2, where the state is the owner of the key resources and distributes them according to its priorities and necessities. Communication, coordination and policy discussion is heavily centralized, with information regarded as a valuable asset. This reduces agents’ capacity to undertake any kind of collective action.
138 Negative path-dependence is very often behind the failure of reform processes. The appeal of path-dependence resides in the simple truth that history matters: in a particular institution, initial organizational culture plays a vital role in determining its subsequent evolution. These initial choices encourage the emergence of ‘elaborate social and economic networks, greatly increasing the cost of adopting once-possible alternatives and therefore inhibiting exit’ (Pierson, 2000: 492)

Financial Services Landscape in Nigeria
76
Increasing the connectivity of the system is not only about creating more dialogue or discussion between CBN and the banking industry – it is also about creating more counterbalances within the system. Industry associations can play a variety of roles in this process – as interlocutors between policy-makers and the industries they represent; as advocates for their members, representing the interests of the industry; as providers of information to external stakeholders (e.g. investors, analysts etc); and as coordinators of research on matters of relevance to the development of their industries.

Financial Services Landscape in Nigeria
77
8 Conclusions
8.1 Conclusions
The key conclusions may be summarised as follows:
• It is important to bear in mind the context of the supply of financial services in Nigeria which is an exceptionally big and complex country – physically, demographically and economically
• The Federal Government has achieved some correspondingly big successes in the reform of the financial sector, but continues to face important obstacles, including the serious problem of lack of access to financial services, particularly by low income men and women
• Inclusive financial sector development makes two complementary contributions to poverty alleviation: financial sector development is a driver of economic growth which indirectly reduces poverty and inequality; and accessible, affordable and appropriate financial services for low income people can improve their welfare and reduce their vulnerability139
• Financial exclusion is widespread despite the wealth of Nigeria, and is the result of a combination of contextual factors and factors within the financial sector, analysed in detail in chapters 2 to 5
• There are, however, encouraging signs at the governmental and industry level of a movement towards the creation of a more inclusive financial sector. For example:
- The Government is committed to FSS 2020 as an integral part of Vision 2020
- There are effective champions of reform, particularly the CBN
- A number of deposit money banks are already piloting a number of interesting products and services targeted at the low income segment
- Some microfinance banks are achieving sustainability
- There are interesting opportunities for the development of agent banking, given the esusu/adashi tradition in Nigeria
- There is also fertile ground for mobile banking, given that 50%140 of the Nigerian population already has access to a mobile phone
However there are also significant constraints to the development of an inclusive financial sector, which were described in detail in Chapter 5 of this report.
139
G20: Access through Innovation Sub-Group of the G20 Financial Inclusion Experts Group: Principles and Report on Innovative Financial Inclusion, 25 May 2010
140 See Section 7.1.5

Financial Services Landscape in Nigeria
78
References
AFI (2010). State of financial inclusion policy in the developing world. Alliance for the Financial Inclusion, Bangkok.
Anyanwu, C.M. (2004). MFIs in Nigeria: policy, practice and potentials. Paper presented at the G24 Workshop on ‘Constraints to growth in Sub Saharan Africa’, Pretoria, South Africa, 2004
Ajakaije, O. and Fakiyesi, T. (2009). Nigeria, Global Financial Crisis Discussion Series, Paper 8, Overseas Development Institute.
Beck, Demirguc-Kunt and Peria (2006) Reaching Out: Access to and use of banking services across countries, a World Bank paper
Budina, N. (2007). Nigerian Growth Record: Dutch Disease or Debt Overhang? World Bank Policy Research Working Paper 4256, June 2007
CBN (2005). Microfinance policy, regulatory and supervisory framework for Nigeria. Abuja: Central Bank of Nigeria.
CBN (2006). 2006 Annual Report, Abuja: Central Bank of Nigeria
CBN (2008). Supervision Annual Report, Abuja: Central Bank of Nigeria.
CGAP (2009). Access to Finance in Nigeria: microfinance, branchless banking and SME finance, CGAP, World Bank, 2009.
Daryl Collins, Jonathan Morduch, Stuart Rutherford and Orlanda Ruthven (2009) Portfolios of the Poor: How the World's Poor Live on $2 a Day, Princeton University Press
EFInA (2008). EFInA Access to Financial Services in Nigeria 2008 Survey: Key findings. EFInA
EFInA (2008). EFInA Access to Financial Services in Nigeria, 2008 Survey: Questionnaire. EFInA
EFInA (2009). Savings mobilization in Nigeria: scoping study on informal savings in Lagos, EFInA
Egwakhe, A.J., Evans, S. and Osabuchien, C. (2009). Positioning Nigerian service sector towards vision 2020: stylized facts from banking sub-sector. Pakistan Economic and Social Review, Vol. 47, No 2. pp.139-156
G20: Access through Innovation Sub-Group of the G20 Financial Inclusion Experts Group: Principles and Report on Innovative Financial Inclusion, 25 May 2010
Genesis Analytics (2008) Testing the significance of the 2% affordability rule for transactional banking FinMark Trust, South Africa
Gylfason, T. (2001). Lessons from the Dutch Disease: Causes, Treatment and Cures. Institute of Economic Studies, Working Paper Series, August 2001.
Hanning, A. and Jansen, S. (2009). Financial inclusion and financial stability: current policy issues. Brookings Papers on Economic Activity.

Financial Services Landscape in Nigeria
79
Honohan, P. (2007). Cross-country variation in household access to financial services The World Bank, Washington.
IMF (2001) Nigeria: 2001 Article IV Consultation. IMF Country Report 01/131, Washington DC: IMF
IMF (2003) Nigeria: 2002 Article IV Consultation. IMF Country Report 03/3, Washington DC: IMF
IMF (2009) Nigeria: 2009 Article IV Consultation. IMF Country Report 09/315, Washington DC
Isern, J. (2009) Diagnostic on access to finance in Nigeria, available online at www.cgap.org accessed on May 2010.
King, D. (2003). Nigerian Financial Sector Assessment Report. USAID/Nigeria.
Kumar et al (2006). Expanding Bank Outreach through Retail Partnerships: Correspondent Banking in Brazil, The World Bank
Martin Oluba, N. (2003). Rethinking the Nigerian Banking System: a Prologue. Economic Reflections Vol. B. No. 3.
Mohammed, A. and Zubair, H. (2008). Microfinance in Nigeria and the prospects of introducing its Islamic version there in the light of selected Muslim countries’ experience.
MPRA Paper No 8287, available online at http://mpra.ub.uni-muenchen.de accessed on April 2010
Nzotta, S. and Okereke, E. (2009). Financial deepening and economic development of Nigeria: an empirical investigation. African Journal of Accounting, Economics, Finance and Banking Research, Vol. 5, No 5.
Obafunmilayo, A. (2007). Challenges and opportunities in the consolidating Nigerian banking sector, available online at www.cenbank.org accessed on May 2010
Ogunleye, G.A. (2005). Regulatory challenges in a consolidated Nigerian banking system – NDIC perspective. Document presented at the 14th Delegates Conference of the Money Market Association of Nigeria, Lagos, February 2005.
Okonjo-Iweala, N. and Osafo-Kwaako, P. (2007). Nigeria’s economic reforms: progress and challenges. Brookings Global, Working Paper No 6.
Olaitan, M.A. (2006). Finance for SMEs: Nigeria’s agricultural credit guarantee scheme fund. Journal of International Farm Management Vol 3, No 2.
Pyramid, (2010). The impact of mobile services in Nigeria: how mobile technologies are transforming economic and social activities. Pyramid Research, Abuja March 2010.
Rosenberg, Richard and Christen, Robert Peck (2000) The Rush to Regulate: Legal Frameworks for Microfinance, CGAP
Salawu, B. (2010). Ethnic factor and development question in Nigeria: a consideration of its implications for the transformation of rural Nigeria. European Journal of Scientific Research, Vol. 41, No 3, pp. 328 – 335

Financial Services Landscape in Nigeria
80
Soludo. C.C. (2007). Nigeria’s financial system Strategy 2020 Plan ‘Our Dream’ available online at www.cenbank.org accessed on May 2010
Soludo. C.C. (2009). Global financial and economic crisis: how vulnerable is Nigeria? available online at www.cenbank.org accessed on May 2010
Utomi, P., Duncan, A. and Williams, G. (2007). Nigeria, the political economy of reform: strengthening the incentives for economic growth. The Policy Practice, October 2007.
UNDAF (2008) Nigeria UNDAF II 2009-2010. UNDAF, Abuja
UNDP (2009). Human Development Report (HDR). UNDP
UNDP (2010). Human Development Report Nigeria – achieving growth with equity. UNDP
USAID/Nigeria PRISMS (2005) Micro, Small and Medium Enterprise Financial Services Demand Survey. USAID
UNFPA (2009). Nigeria – an overview. UNFPA, 2010.
World Bank, (2008) Rural Finance in Nigeria: integrating new approaches, The World Bank
World Bank (2009) Making finance work for Nigeria. The World Bank
World Bank (2010) Achieving Nigeria’s Financial System Strategy 2020, The World Bank
Weblinks (accessed April - July 2010)
www.efina.org.ng
http://www.nv2020.org/
CBN, (2007) ‘Financial System Strategy 2020’ available online at http://www.cenbank.org/OUT/SPEECHES/2007/GOVADD18-4-07.PDF
Central Bank of Nigeria, (2007) ‘Financial System Strategy 2020’ available online at http://www.cenbank.org/OUT/SPEECHES/2007/GOVADD18-4-07.PDF
http://socyberty.com/issues/the-current-issue-in-the-bank-sector-in-nigeria-is-a-test-of-the-efficacy-of-ndic-and-cbn-growth-in-insurance-business/
Jon Offei-Ansah, ‘Fresh impetus for the Nigerian banking sector,’ www.africareview.net See Banca de las Oportunidades, Growth on Non-Bank Correspondents in Colombia (PPT) & http://www.asobancaria.com/categorias.jsp?id=227&sup=1, accessed on July 2010
Circular BSD/Dir/Gen/Aml/03/009/1, Anti-Money Laundering/Combating Financing of Terrorism (AML/CFT) Compliance Manual for Banks and Other Financial Institutions in Nigeria
Circular BSD/DIR/GEN/CIR/03/027, Revised CBN Anti-Money Laundering/Counter Terrorism Financing (AML/CFT) Manual, 2009 (Draft)

Financial Services Landscape in Nigeria
81
Circular BSD/06/2002, Moderation of Interest Rate
Circular BSD/02/2004, The Need to Adhere to the Agreed Lending Rates and Other Charges as Provided in the Guide to Bank Charges,
Circular BSD/DIR/GEN/CIR/V.1/001, RE: Moderation of Interest Rates, accessed on July 2010
Circular BSD/DIR/GEN/CIR/03/003, Sanctions for the Violation of the Decision on Maximum Deposit Rate, Lending Rate and Other Charges. (April 8, 2009).
http://www.doingbusiness.org/ExploreEconomies/?economyid=143#RegisteringProperty, Eghobamien, Osaro, Bankruptcy Law: A Need for Urgent Reform
http://www.afi-global.org/
Global Development Research Center, (2005). ROSCAs: What’s in a Name? available online at www.gdrc.org/icm/rosca/rosca-names.html
See Bokea, C. (2008). The Case Study of M-PESA in Kenya, BCK. Available at http://www.bouldermicrofinance.org/bergamowiki/index.php?title=Breakout_1C#Technology_and_the_Financial_Access_Frontier, accessed on July 2010
Oluba, M. (2007). Trends in Financial Inclusion in Nigeria, available online at www.martinoluba.com accessed on May 2010
Oluba. M. (2008). Rethinking the Nigerian banking system: a prologue, available online at www.martinoluba.com accessed on May 2010
In addition to specific links above, websites for many of the institutions surveyed were visited

Financial Services Landscape in Nigeria
82
Annex A Institutions interviewed for this survey
Amore Microfinance Bank
ACCION MFB
Afribank
Bam Microfinance Bank
Central Bank of Nigeria, Banking Supervision Unit
Central Bank of Nigeria, Development Finance Department
Central Bank of Nigeria, Research Department
Central Bank of Nigeria, Other Financial Institutions Department
Community Development Foundation
Consumer Protection Council
Cooperative Finance Agency
CRC Credit Bureau
Diamond Bank Plc
Department for International Development
Eartholeum Networks
Enhancing Financial Innovation & Access
Farmers Development Union
Federal Department of Cooperatives
Financial Institutions Training Centre
First Bank
Fortis Microfinance Bank
FSS 2020 Secretariat
Gains Microfinance Bank
GTBank Plc
Hasal Microfinance Bank
Industrial and General Insurance
Interswitch
Intercontinental Bank Plc
Kofi Microfinance Bank
Lift Above Poverty
Leadway Assurance
Ministry of Finance - Home Department
National Association of Microfinance Banks
National Insurance Commission

Financial Services Landscape in Nigeria
83
National Planning Commission
Nigerian Agricultural and Rural Development Bank
Nigerian Institute of Social and Economic Research
Nigerian Stock Exchange
Oceanic Bank
Peopleserve Microfinance Bank
Skye Bank Plc
Stanbic IBTC Bank
Stanbic IBTC Pensions
Sterling Bank Plc
United Nations Development Programme
United Bank for Africa
Unity Bank
University of Ibadan, Banking and Finance
University of Ibadan, Agric. Economics
Urban Development Bank
USAID Markets
Wema Bank Plc
World Bank (MSME programme)

Financial Services Landscape in Nigeria
84
Annex B Sample questionnaire
In this Annex we have reproduced one example of the questionnaires used to structure the interviews undertaken in the course of the survey. The example is of a questionnaire used for the deposit money banks.
NIGERIA SUPPLY SIDE STUDY: SURVEY OF FINANCIAL INSTITUTIONS
Deposit money Banks
Name of Institution
Address
Indicate general orientation of branches
���� Urban ���� Peri-urban ���� Rural
Key Manager/s (Name and Designation of People Met)
Your answers are important to us – as they will help us characterize the financial sector landscape in Nigeria and identify the constraints and opportunities faced by different types of financial service providers in expanding access to financial services. The findings of this study, together with EFInA Access to Financial Services in Nigeria 2008 demand side study, will contribute to improved understanding of access to finance in Nigeria and to make recommendations as to how financial inclusion can be enhanced in Nigeria. All responses will be confidential.
If you have any questions or queries regarding this study, please do not hesitate to contact (DA Contact)……….. or …….Oxford Policy Management Ltd, UK). Kindly send your completed questionnaire to _________________________.
1. Overview and recent history
Provide some brief background information about:
- The overall impact of the financial reforms in the last years in the banking sector.
- The impact of the examinations carried out by the Central Bank last year on the industry and
in particular your bank.
- Impact of current credit squeeze on your bank’s lending business.
- The potential impact of the recently announced banking reforms, particularly the re-
categorization of banks. In your opinion, how are banks are most likely to proceed?
At the light of all these happenings, what is the most likely strategy that your bank will follow to
grow their business in the short term?

Financial Services Landscape in Nigeria
85
2. Products and services
Provide a list of all products offered by your bank and their features (a) for savings products – minimum opening and maintaining balances, terms and conditions, interest rate paid, other important features and charges; (b) for loan products (including credit cards and overdraft facilities) - minimum and maximum amounts, terms and conditions, maturity, interest rate and other fees charged, other important features. (c ) for current accounts – terms and conditions, interest rate paid, fees and charges for transactions , other important features
Savings Accounts 1.
2.
Current Accounts
3.
4.
Cards
5.
6.
Fixed Deposit Accounts
7.
8.
Payments and Transfers
9.
10
Loans (including overdraft facilities)
11.
12.
Insurance
13.
14.
Pensions
15.
16.
Other Products

Financial Services Landscape in Nigeria
86
For each product, provide an estimate of total annual transactions by volume and by value
3. Distribution channels
Describe the channels that your bank uses to distribute its products: i.e. direct or indirect service provision. Also briefly explain:
- Why this strategy was chosen?
- How this strategy is conditioned by external factors: infrastructure, telecommunications, etc.
- Use the following table to describe the geographical distribution of your branches
Geographical Zones Full branches
Sub branches
Other
1. North Central
2. North East
3. North West
4. South East
5. South West
6. South South
TOTAL
4. Relationship bank-clients
Describe what measures have been taken to improve the relationship between the bank and its clients, particularly:
- Has your bank implemented Customer Relationship Management Tools?
- Has your bank implemented any measure to improve the quality of information that its clients
receive?
- Has your bank implemented any other measure to improve clients’ protection?
- Please, use the following table to describe the documents that individuals must provide to
get access to your services
Documents that individuals must provide to access:
Current accounts
Deposits / savings
Credit facilities
Remittances
National Identity Card Utility bill with address (electricity, water, phone
Pay slip
Letter of reference (from chief, employer)
Proof of domicile Others: please specify –

Financial Services Landscape in Nigeria
87
5. Client base
Provide some information about:
- How does your bank carry out customer segmentation?
- How many customers does your bank have in total? And for each of your customer
segments?
- What is your bank’s level of customer churn?
- Is your bank interested in serving the low income market? If yes, how and if no, why not?
- What is your bank’s definition of low income i.e. minimum threshold?
- Describe briefly your bank’s customer acquisition strategy
- How does your bank measure profitability by client or by product or both?
- How does your bank maximise cross selling opportunities?
6. Regulatory issues
Provide some information about:
- Are there any regulatory obstacles to conducting your business?
- How/why these obstacles were created?
- Are these obstacles different for each customer segment?
- What changes to regulations/policies do you think would help to improve access to finance
and foster better financial inclusion?
How the process leading to these improvements can be stimulated?
7. Inclusion policies
Provide some information about:
- Is there any overarching policy in your bank aimed to promote better access to and use of
financial services?
IF YES,
- When was this policy created? Was this policy the result of discussions with public agents or
groups of clients? Does this policy favour any particular type of client, e.g. women, farmers,
any ethnic group? Is this policy implemented at national level or only in some specific
regions?
- What were the main internal obstacles to adopt changes aimed to increase access?
IF NO,
- Does your bank plan to create a strategy to increase access to financial services any time
soon? Why?

Financial Services Landscape in Nigeria
88
8. Financial and management
Provide some brief information about:
- What is the current management focus?
- Are there any capacity related issues in terms of infrastructure, technology and skilled
manpower?
Kindly provide us with your most recent audited financial statements (December 2009) and
the previous 2 years
EFInA is an independent, professional, non-profit organisation and its purpose is to promote Financial Sector Development and Financial Inclusion in Nigeria. Possible role for EFInA
What recommendations would you make to EFInA to help increase access to formal financial services in Nigeria?