efficient nonlinear amplitude recording of holographic gratings in electrolytically colored...
TRANSCRIPT

Efficient nonlinear amplitude recording ofholographic gratings in electrolytically coloredpotassium bromide crystals
Erik Raita, Andris Ozols, and Olli Salminen
838 APPLIED OPTICS @
The nonlinear amplitude recording of volume holographic gratings is theoretically and experimentallystudied in electrolytically colored potassium bromide crystals. A maximum diffraction efficiency of10.8% is obtained, which substantially exceeds the 3.7% maximum diffraction efficiency for linearrecording.Key words: Holography, optical recording, holographic gratings, color centers.
1. Introduction
Transmission-type volume amplitude gratings areusually regarded as inefficient because their first-order diffraction efficiency 1h2 cannot exceed 3.7% atlinear recordingwhen they are sinusoidal.1 However,the situation changes significantly when nonsinusoi-dal gratings are considered. The hmax 5 25% istheoretically found for the volume absorption gratingwith the optimal profile in the form of a set of the dfunctions.2 This is an experimentally unattainablegrating profile. In Ref. 3 it was shown theoreticallythat the grating profile approaching the optimal onecan be obtained with the nonlinear response of photo-chromic materials with large initial optical densityDi , in the range of 4 to 5. h values up to 12% werepredicted. However, it seems that, until this study,no attempts of efficient nonlinear volume amplituderecording have been made.In this paper nonlinear amplitude recording of
holographic gratings 1HG’s2 in electrolytically colored1EC2 potassium bromide 1KBr2 crystals is studiedboth theoretically and experimentally based on theideas of Refs. 2 and 3. The hmax 5 10.8% is experi-mentally obtained. This is the highest diffraction
When this work was performed, the authors were with theVaisala Laboratory, Department of Physics, University of Joensuu,P.O. Box 111, Joensuu SF-80101, Finland. A. Ozols is nowwith theInstitute of Solid State Physics, University of Latvia, Kengaragaiela 8, LV-1063, Riga, Latvia.Received 15 February 1994; revised manuscript received 22
September 1994.0003-6935@95@050838-04$06.00@0.
r 1995 Optical Society of America.
Vol. 34, No. 5 @ 10 February 1995
efficiency value, to our knowledge, experimentallyachieved for volume amplitude gratings.
2. Nonlinear Recording of Holographic Gratings inPhotochromic Materials
In this section we consider some theoretical details ofnonlinear holographic recording in photochromic ma-terials such as KBr crystals with F centers. They arerelevant for our experiments. We use a simple ap-proach based on the theory of Refs. 1, 4, and 5.Let us expose a photochromic material to an inter-
ference pattern from two symmetrically incident planelight waves with a sinusoidal intensity distribution
I 5 I011 1 V cos Kx2, 112
where I0 is average light intensity, V is fringe visibil-ity, K 5 2p@L is spatial frequency, and L is the periodof fringes. If 1as in the case of EC KBr2 the materialis isotropic, with local nonlinear response, a sinusoi-dal exposure results in a nonsinusoidal amplitude–phase HG,4,5 which can be described by the Fourierexpansions of the light-intensity absorption coeffi-cient k and refractive index n:
k 5 k0 1 k1 cos Kx 1 k2 cos 2Kx 1 k3 cos 3Kx 1 · · · ,
122
n 5 n0 1 n1 cos Kx 1 n2 cos 2Kx1n3 cos 3Kx 1 · · · .
132
Fourier-expansion coefficients k0, k1, k2, . . . , and n0,n1, n2, . . . , vary with thickness because of the lightabsorption during the exposure. However, to calcu-
late the HG h, we need only the grating parametersaveraged over the thickness.6 Therefore we furtherassume that Eqs. 122 and 132 are averaged over thethickness. For simplicity, we formally include thereflection losses in k0. In the case of linear recording,only the first two terms in Eqs. 122 and 132 remain.For volume recording and readout of the HG at thefirst Bragg angle, only these terms contribute to h inthe case of nonlinear recording because of the Braggcondition. Therefore the h of an arbitrary amplitude–phase transmission HG at the Bragg readout can befound according to the well-known expression1
h 5 exp12 k0d
cos u23 1sinh2 k1d
4 cos u1 sin2
pn1d
l cos u2 , 142
where d is thickness, u is the readout-beam incidenceangle inside the HG, and l is the readout-beamwavelength in free space. Nonlinear recording canbe more efficient than the linear one if the spatialmodulation amplitudes k1 and n1 are larger in thenonlinear case.In photochromic materials, n1 ~ k1, and they are
usually related by the dispersion photorefraction effi-ciency,4
r 54p
l
n1k1
. 152
If the HG recording is due to the photobleaching of theGaussian absorption band4 1e.g., the F band in ECKBr2,
r 52
Œpe0
v
exp1t22dt, 162
where the normalized frequency detuning v by thedefinition is given by
v 521ln 221@2"c
H 1 1l021
l2 . 172
Here " is Planck’s constant, c is light velocity in freespace, H is the FWHM width of the absorption band,and l0 is the wavelength of the absorption peak. TheparametersH and l0 depend on temperature.Equation 142 is simplified if one introduces the
normalized average optical density of the HG, a 5
k0d@cos1u2, and the HG contrast, µ 5 0k1 0@k0. Also,taking into account Eq. 162, we can write
h 5 exp12a21sinh2 µa@4 1 sin2 rµa@42. 182
We further use the formulas 152–182 to determine thephase contribution to h in our experiments.Using Eq. 182, one can optimize a for given values of
µ and r and find hmax.5 In the case of the amplitude
HG, r 5 0 and the optimal average optical density ofthe HG is
D0opt 5
0.868 cos U
µln2 1 µ
2 2 µ, 192
where the relation D0 5 0.434a3cos1u24 is taken intoaccount. Equation 192 is valid for µ , 2. Using theexpressions for Fourier coefficients k0 and k1 and theexpression for the HG contrast µ 5 0k1 0@k0, one canfind
µ 5 2
0 e2L@2
1L@2
k1x2cos Kxdx0
e2L@2
1L@2
k1x2dx
# 2; 1102
i.e., the HG contrast can never exceed 2. In a moredetailed way this result was first obtained in Ref. 2.The hmax versus µ andD0
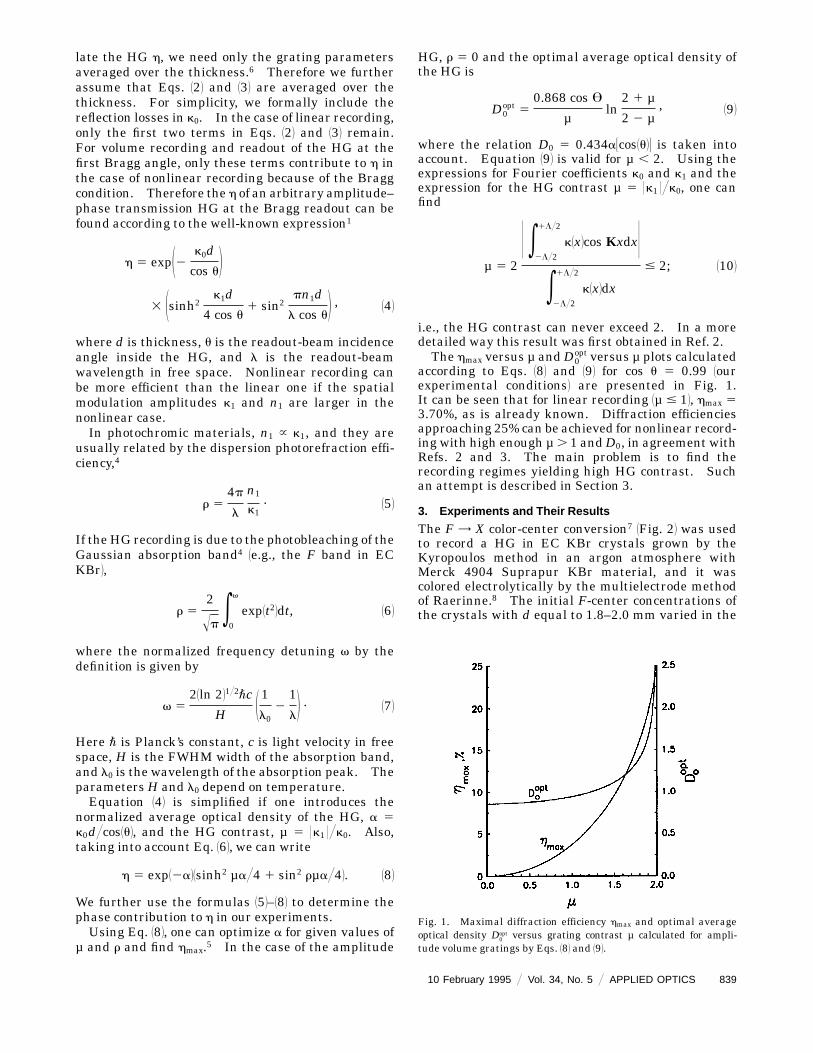
opt versus µ plots calculatedaccording to Eqs. 182 and 192 for cos u 5 0.99 1ourexperimental conditions2 are presented in Fig. 1.It can be seen that for linear recording 1µ # 12, hmax 53.70%, as is already known. Diffraction efficienciesapproaching 25% can be achieved for nonlinear record-ing with high enough µ. 1 andD0, in agreement withRefs. 2 and 3. The main problem is to find therecording regimes yielding high HG contrast. Suchan attempt is described in Section 3.
3. Experiments and Their Results
The F = X color-center conversion7 1Fig. 22 was usedto record a HG in EC KBr crystals grown by theKyropoulos method in an argon atmosphere withMerck 4904 Suprapur KBr material, and it wascolored electrolytically by the multielectrode methodof Raerinne.8 The initial F-center concentrations ofthe crystals with d equal to 1.8–2.0 mm varied in the
Fig. 1. Maximal diffraction efficiency hmax and optimal averageoptical density D0
opt versus grating contrast µ calculated for ampli-tude volume gratings by Eqs. 182 and 192.
10 February 1995 @ Vol. 34, No. 5 @ APPLIED OPTICS 839

range 0.75 to 2.25 3 1017 cm23 1the initial opticalthicknesses Di equal to 1.5–5.52. Recording was per-formed at elevated temperatures of the crystal, Tequal to 180–220 °C 1measured by the thermocoupleat the crystal edge2, which are necessary for efficient F= X reaction. Readout of HG was made at therecording temperature. The recording temperatureswere optimized, and they decreased with increasingDi. These results are not included in this paper.Two symmetrically incident, equally strong He–Ne
laser beams 1l 5 632.8 nm2 with I0 5 0.064 W@cm2
were used to record the transmission HGwith L 5 1.5µm. Readout was also made at l 5 632.8 nm.Equal intensities of the recording beams and theirnearly zero path difference ensured high fringe visibil-ity V < 1, which was necessary to achieve high HGcontrast µ. For the same reason we chose I0 5 0.064W@cm2 because in this case the bleaching rates in themaxima and the minima of the HG differ the mostwhen the nonlinear bleaching rate intensity depen-dent9 is taken into account.The volume character of our HG was proved by
their high Klein’s factors Q 5 2pLd1n0L2221 . 20001even if the light absorption is taken into account2,high angular selectivity, and the absence of diffractionorders other than the first and zero orders.1To ensure that our results were really related to the
amplitude recording, we found the phase contribu-tion to h by performing special measurements andusing Eqs. 162–182. It can easily be seen from Eq. 182that the phase contribution to h 3i.e., the relativesignificance of the second term in Eq. 1824 is the largestat fixed r when a = 0. In the opposite case 1a = `2the unlimited growth of the first term in Eq. 182compared with the limited second term makes thephase contribution negligible. Thismeans that, over-estimating the phase contribution, we can find it fromEq. 182 by using approximations sinh21µa@42 < 1µa@422and sin21rµa@42 < 1rµa22. Then the relative phase
Fig. 2. F-center absorption band of an electrolytically colored KBrcrystal 1d5 1.8mm2measured at different temperatures: 1, roomtemperature; 2, 60 °C; 3, 100 °C; 4, 140 °C; 5, 180 °C; 6, 220 °C.The X band at room temperature is also shown with the dashedcurve.
840 APPLIED OPTICS @ Vol. 34, No. 5 @ 10 February 1995
contribution to h is
hphase
h#
r2
1 1 r2. 1112
To find out r, we measured absorption spectra of anEC KBr crystal at different temperatures 1Fig. 22.One can find from Fig. 2 that l0 5 632 nm and H 50.465 eV at T 5 180 °C 1temperature of our bestrecording2. Thus we found out v 5 20.11 at l 5632.8 nm from Eq. 172. Further, Eq. 162 gives r 520.12 at v 5 20.11, and expression 1112 at v 5 20.12gives the relative phase contribution of less than1.5%. Consequently HG’s in our experiments werealmost completely amplitude ones.Typical experimental time dependencies of h for
different Di values are presented in Fig. 3. One canclearly see that hmax is increasing when Di is in-creased, in agreement with Refs. 2 and 3 and Fig. 1.We had some scatter in the maximal h values, evi-dently caused by the instabilities of our experimentalsetup in the course of prolonged exposures at elevatedtemperatures. However, it did not influence themain features shown in Fig. 3. Our best result ishmax 5 10.8% at t 5 60 min. 1recording energy 14 Jcm22%2, Di 5 5.0, and T 5 180 °C. At the end of thisexposure we found D0 < 1. These results fit quitewell, even quantitatively, the theoretical predictionsof Jaaskelainen3 1see Section 12.Let us show that efficient amplitude recording in
our experiments is really caused by the nonlinearrecording regime of the HG. The highest relativebleaching DD@Di in our experiments did not exceed0.80. AssumingDi 5 0.434kid, one can find that
µmax 50k1 0@ki
1 2 0k1 0@ki5
0.4
1 2 0.4< 0.67 1122
and that hmax 5 1.58% for the linear recording1Fig. 12. Consequently our best results for thick-
Fig. 3. Typical diffraction-efficiency kinetics of holographic grat-ings recorded in electrolytically colored KBr crystals with differentinitial optical densities Di at optimal temperatures: 1, Di 5 1.5and T 5 220 °C; 2, Di 5 2.8 and T 5 200 °C; 3, Di 5 5.0 and T 5
180 °C. The other recording and readout parameters are l 5
632.8 nm, L 5 1.5 µm, I0 5 0.064 W@cm2, and V < 1.

enough samples with Di $ 2.8 when hmax $ 3.2% aredue to the nonlinear amplitude recording. The mea-sured hmax values would be higher if the plane waveswere used for the recording instead of the Gaussianlaser beams.10 Therefore our best experimental re-sult hmax 5 10.8% corresponds µ $ 1.6 1Fig. 12, thusproving the highly nonlinear recording.
4. Conclusions
The nonlinear amplitude recording of volume holo-graphic gratings in EC KBr crystals has been studiedtheoretically and experimentally. Diffraction efficien-cies 1h2 up to 10.8% and HG contrasts 1µ2 up to 1.6 areachieved for the first time, to our knowledge, whereasonly hmax 5 3.7% and µmax 5 1 are possible for linearrecording. The theoretical predictions of Jaaskel-ainen3 are thus confirmed experimentally.We think that this study supports the idea of using
the nonlinear response of the material to improve theefficiency of amplitude, amplitude–phase, and phaseholographic recording. Although hmax 5 100% forphase HG’s even for linear recording, nonlinear re-cording can also in some cases be advantageous toreduce the necessary exposure. Volume holographicoptical elements are possible applications of efficientnonlinear recording in photochromic materials.
References1. H. Kogelnik, ‘‘Coupled wave theory for thick hologram grat-
ings,’’ Bell Syst. Tech J. 48, 2909–2917 119692.2. A. V. Alekseev-Popov, ‘‘Limiting diffraction efficiency of three-
dimensional amplitude holograms,’’ Sov. Phys. Tech. Phys.28, 1275–1278 119812.
3. T. Jaaskelainen, ‘‘Diffraction efficiency of photochromic absorp-tion gratings,’’ Opt. Communun. 45, 145–148 119832.
4. W. J. Tomlinson, ‘‘Volume holograms in photochromic materi-als,’’Appl. Opt. 14, 2456–2467 119752.
5. A. Ozols, ‘‘The ultimate characteristics of amplitude-phaseholograms recorded in additively coloured KBr crystals,’’ Latv.PSR Zinat. Akad. Vestis 5, 16–25 119782.
6. T. Kubota, ‘‘Characteristics of thick hologram grating re-corded in absorptive medium,’’ Opt. Acta 25, 1035–1053119782.
7. J. H. Schulman, and W. D. Compton, Color Centers in Solids1Pergamon, London, 19632, Chap. 9, pp. 261–269.
8. P. Raerinne, ‘‘A method for homogeneous electrolytic coloura-tion of alkali halide crystals,’’ Meas. Sci. Technol. 3, 75–79119922.
9. A. Ozols, ‘‘The dependence of bleaching kinetics on F-lightintensity in additively coloured KBr crystals and storage ofholograms,’’ Latv. PSR Zinat. Akad. Vestis 4, 28–36 119782.
10. M. G. Moharam, T. K. Gaylord, and R. Magnusson, ‘‘Braggdiffraction of finite beams by thick gratings,’’ J. Opt. Soc. Am.70, 300–304 119802.
10 February 1995 @ Vol. 34, No. 5 @ APPLIED OPTICS 841