efficient export of carbon to the deep ocean through dissolved organic matter
TRANSCRIPT
8. Richter, P. H. & Ross, J. Concentration oscillations and efficiency: Glycolysis. Science 211, 715–717
(1981).
9. Harris, D. C. Quantitative Chemical Analysis 5th edn 312–313 (Freeman, New York, 1999).
10. Edblom, E. C., Luo, Y., Orban, M., Kustin, K. & Epstein, I. R. Kinetics and mechanism of the
oscillatory bromate–sulfite–ferrocyanide reaction. J. Phys. Chem. 93, 2722–2727 (1989).
11. Rabai, G., Orban, M. & Epstein, I. R. Design of pH-regulated oscillators. Acc. Chem. Res. 23, 258–263
(1990).
12. Berridge, M. J. Calcium oscillators. J. Biol. Chem. 265, 9583–9586 (1990).
13. Szucs, A. et al. Interacting biological and electronic neurons generate realistic oscillatory rhythms.
Neuroreport 11, 563–569 (2000).
Acknowledgements This work was supported by the Hungarian Academy of Sciences (HAS), the
US National Science Foundation (NSF) and a US-Hungarian Cooperative Research Grant from
NSF and HAS. We thank L. Yang for assistance in preparing the figures.
Competing interests statement The authors declare that they have no competing financial
interests.
Correspondence and requests for materials should be addressed to I.R.E. ([email protected]).
..............................................................
Efficient export of carbon tothe deep ocean throughdissolved organic matterCharles S. Hopkinson Jr & Joseph J. Vallino
The Ecosystems Center, Marine Biological Laboratory, Woods Hole, Massachusetts02543, USA.............................................................................................................................................................................
Oceanic dissolved organic carbon (DOC) constitutes one of thelargest pools of reduced carbon in the biosphere. Estimated DOCexport from the surface ocean represents 20% of total organiccarbon flux to the deep ocean1–3, which constitutes a primarycontrol on atmospheric carbon dioxide levels4. DOC is thecarbon component of dissolved organic matter (DOM) and anaccurate quantification of DOM pools, fluxes and their controls istherefore critical to understanding oceanic carbon cycling. DOCexport is directly coupled with dissolved organic nitrogen andphosphorus export. However, the C:N:P stoichiometry (byatoms) of DOM dynamics is poorly understood. Here we studythe stoichiometry of the DOM pool and of DOM decompositionin continental shelf, continental slope and central ocean gyreenvironments. We find that DOM is remineralized and producedwith a C:N:P stoichiometry of 199:20:1 that is substantially lowerthan for bulk pools (typically >775:54:1), but greater than forparticulate organic matter (106:16:1—the Redfield ratio). Thusfor a given mass of new N and P introduced into surface water,more DOC can be exported than would occur at the Redfieldratio. This may contribute to the excess respiration estimated tooccur in the interior ocean5. Our results place an explicitconstraint on global carbon export and elemental balance viaadvective pathways.
Accurate quantification of DOM pools, fluxes and their controlsis critical to understanding oceanic carbon cycling and how theoceans will respond to increasing concentrations of atmosphericCO2 and climate change4,6,7. The nitrogen and phosphorus cycles inthe ocean are closely coupled with the carbon cycle and the Redfieldratio has been a unifying paradigm describing the stoichiometry ofthis coupling. It is an implicit assumption that the amount ofcarbon that can be exported to depth is directly related to thequantity of ‘new’ nutrients (NO3
2 and PO432) that are brought back
to the surface through physical processes and added via nitrogenfixation and atmospheric deposition8. The production, export and
remineralization of particulate organic matter, which accounts for80% of total organic carbon flux to the deep ocean, operate withRedfield stoichiometry. An extreme paucity of data on simultaneousmeasures of DOC, dissolved organic nitrogen and phosphorus(DON and DOP) and lack of information on production,decomposition and export processes have held back progress inunderstanding the coupled dynamics of these pools. Recent studiesof DOM dynamics show large departures from Redfield trajectories.DOM pools in surface and deep-ocean waters deviate widely fromthe Redfield ratio with reports of C:N:P ratios in excess of4,000:300:1 (refs 9–12). Production of new DOM is often N-poorrelative to C, with elevated C:N ratios measured during andimmediately after diatom blooms13. A number of studies haveshown that N and P preferentially remineralize relative to C(refs 9–11 and 14–16). But how can overall organic matter exportconform to the Redfield ratio while DOM stoichiometry apparentlydeviates so greatly? Is our understanding of the magnitude of Cexport relative to N and P correct? If estimates of DOC export arecorrect and the stoichiometry of DOM export deviates substantiallyfrom the Redfield ratio, we urgently need to understand themechanisms that control the stoichiometry of DOM production,export and remineralization so that predictions of the response toclimate and CO2 changes can be made.
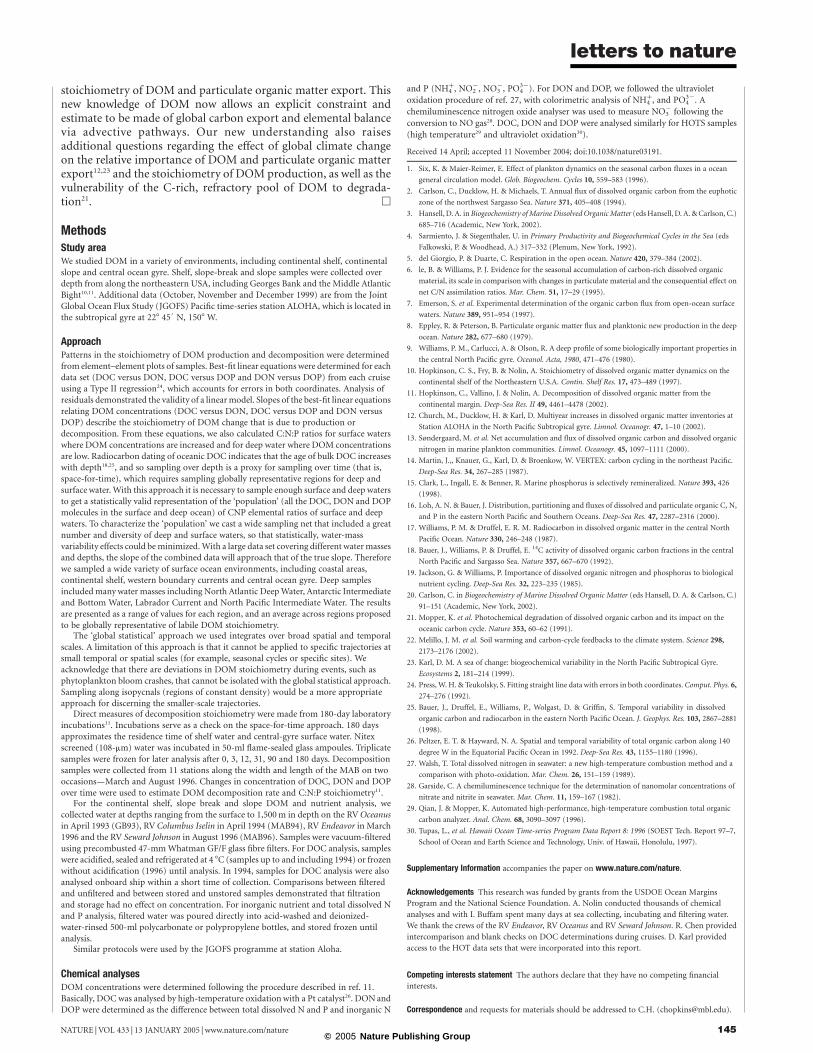
We studied DOM pool and decomposition stoichiometry incontinental-shelf, continental-slope and central-ocean-gyreenvironments. The observed C:N:P ratios for bulk DOM deviatedsubstantially from the Redfield ratio. The average C:N:P ratio for allsamples across all depths was 778:54:1. In general, C:N:P ratios werelower when DOM concentrations were higher and were higher withlow DOM concentrations (Table 1). The average C:N, C:P and N:Pratios for surface waters with increased DOM concentrations were14:1, 374:1 and 27:1, respectively, and these ratios differed onlymoderately between locations and time (Table 1). The average C:N,C:P and N:P ratios for deep waters, which have low DOM concen-trations, were substantially higher, averaging 22:1, 3511:1 and 202:1,respectively.
The stoichiometry of production and decomposition is deter-mined from the slope of DOM element–element plots for samplescollected throughout the ocean, for example, DON versus DOC(Fig. 1). It is implicit in this type of analysis that the stoichiometry ofproduction and decomposition is the same. The stoichiometry ofthe decomposable DOM pool averaged 199:20:1. Thus C:N and C:Pratios were significantly C-rich: 62% and 87% higher than theRedfield ratio. The N:P ratio was higher than the Redfield, but notsignificantly (20 versus 16:1). These results show that the C:N:Pstoichiometry of DOM decomposition is much lower than theC:N:P ratios of surface or deep-water pools. Although the bulkDOM is extremely rich in C relative to N and N relative to P, thespace-for-time patterns of DOM decomposition indicate that thestoichiometry of the degradable DOM pool is also C-rich but at alevel intermediate to that of Redfield and bulk DOM.
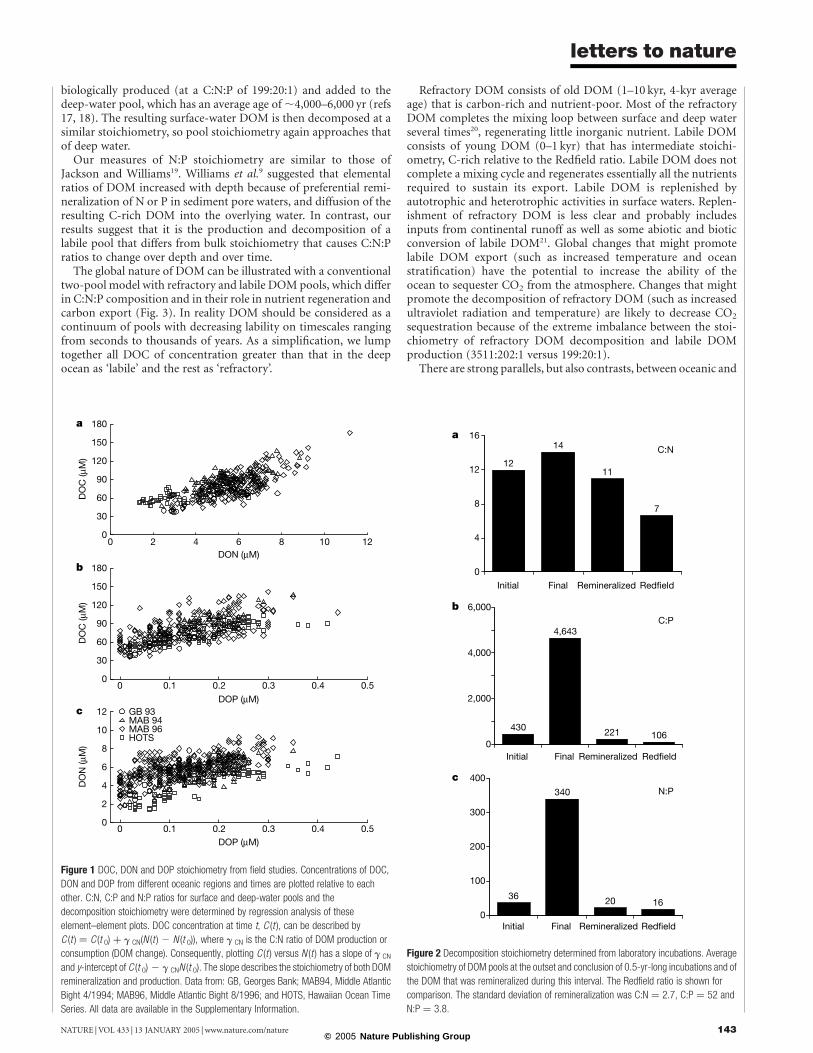
The decomposition stoichiometry was also determined indepen-dently by directly observing changes in DOM composition duringlaboratory incubations of shelf and slope waters. The incubationsrevealed (Fig. 2) that the decomposable fraction of the bulk DOMvaried for DOC, DON and DOP, but loss rates were similar11. Thestoichiometry of the fraction that decomposed was substantiallylower than that of the initial bulk pool and averaged 221:20:1.Laboratory decomposition studies agreed favourably with the fieldspace-for-time approach, suggesting that the patterns found fromfield observations are robust.
Although there are numerous reports of greatly increased C:Nratios of DOM production, especially after phytoplankton blooms(see, for example, ref. 13), our results indicate that, on average, thestoichiometry is only moderately increased (10.7:1). The C:N:P ofupwelled, deep-water DOM (3511:202:1) is brought closer to theRedfield ratio (C:N:P drops) in surface waters as new DOM is
letters to nature
NATURE | VOL 433 | 13 JANUARY 2005 | www.nature.com/nature142© 2005 Nature Publishing Group
biologically produced (at a C:N:P of 199:20:1) and added to thedeep-water pool, which has an average age of ,4,000–6,000 yr (refs17, 18). The resulting surface-water DOM is then decomposed at asimilar stoichiometry, so pool stoichiometry again approaches thatof deep water.
Our measures of N:P stoichiometry are similar to those ofJackson and Williams19. Williams et al.9 suggested that elementalratios of DOM increased with depth because of preferential remi-neralization of N or P in sediment pore waters, and diffusion of theresulting C-rich DOM into the overlying water. In contrast, ourresults suggest that it is the production and decomposition of alabile pool that differs from bulk stoichiometry that causes C:N:Pratios to change over depth and over time.
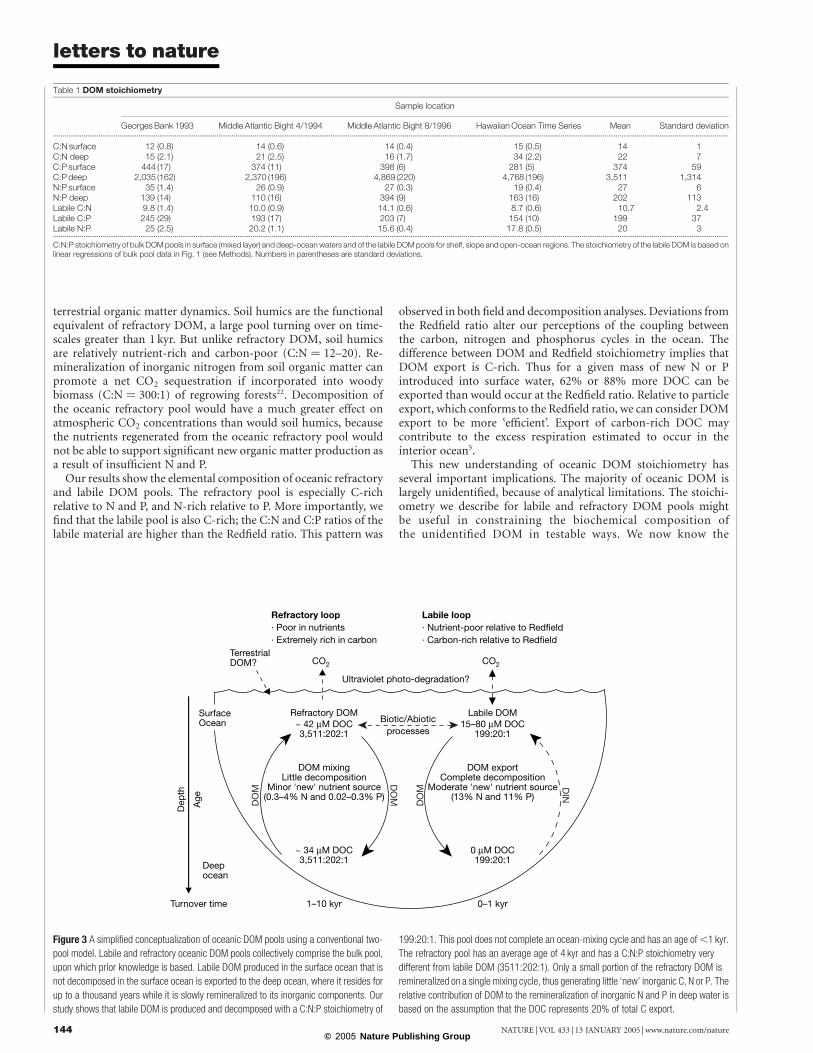
The global nature of DOM can be illustrated with a conventionaltwo-pool model with refractory and labile DOM pools, which differin C:N:P composition and in their role in nutrient regeneration andcarbon export (Fig. 3). In reality DOM should be considered as acontinuum of pools with decreasing lability on timescales rangingfrom seconds to thousands of years. As a simplification, we lumptogether all DOC of concentration greater than that in the deepocean as ‘labile’ and the rest as ‘refractory’.
Refractory DOM consists of old DOM (1–10 kyr, 4-kyr averageage) that is carbon-rich and nutrient-poor. Most of the refractoryDOM completes the mixing loop between surface and deep waterseveral times20, regenerating little inorganic nutrient. Labile DOMconsists of young DOM (0–1 kyr) that has intermediate stoichi-ometry, C-rich relative to the Redfield ratio. Labile DOM does notcomplete a mixing cycle and regenerates essentially all the nutrientsrequired to sustain its export. Labile DOM is replenished byautotrophic and heterotrophic activities in surface waters. Replen-ishment of refractory DOM is less clear and probably includesinputs from continental runoff as well as some abiotic and bioticconversion of labile DOM21. Global changes that might promotelabile DOM export (such as increased temperature and oceanstratification) have the potential to increase the ability of theocean to sequester CO2 from the atmosphere. Changes that mightpromote the decomposition of refractory DOM (such as increasedultraviolet radiation and temperature) are likely to decrease CO2
sequestration because of the extreme imbalance between the stoi-chiometry of refractory DOM decomposition and labile DOMproduction (3511:202:1 versus 199:20:1).
There are strong parallels, but also contrasts, between oceanic and
Figure 2 Decomposition stoichiometry determined from laboratory incubations. Average
stoichiometry of DOM pools at the outset and conclusion of 0.5-yr-long incubations and of
the DOM that was remineralized during this interval. The Redfield ratio is shown for
comparison. The standard deviation of remineralization was C:N ¼ 2.7, C:P ¼ 52 and
N:P ¼ 3.8.
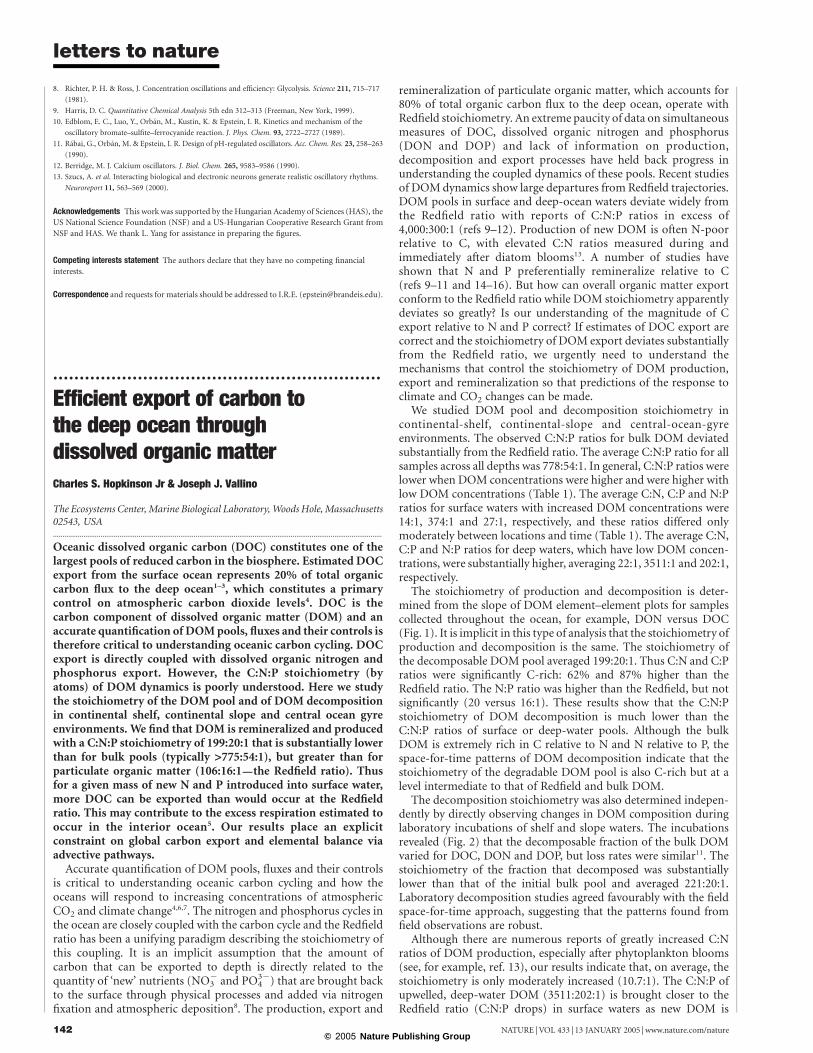
Figure 1 DOC, DON and DOP stoichiometry from field studies. Concentrations of DOC,
DON and DOP from different oceanic regions and times are plotted relative to each
other. C:N, C:P and N:P ratios for surface and deep-water pools and the
decomposition stoichiometry were determined by regression analysis of these
element–element plots. DOC concentration at time t, C (t ), can be described by
C (t ) ¼ C (t 0) þ g CN(N (t ) 2 N (t 0)), where g CN is the C:N ratio of DOM production or
consumption (DOM change). Consequently, plotting C (t ) versus N (t ) has a slope of g CN
and y-intercept of C (t 0) 2 g CNN (t 0). The slope describes the stoichiometry of both DOM
remineralization and production. Data from: GB, Georges Bank; MAB94, Middle Atlantic
Bight 4/1994; MAB96, Middle Atlantic Bight 8/1996; and HOTS, Hawaiian Ocean Time
Series. All data are available in the Supplementary Information.
letters to nature
NATURE | VOL 433 | 13 JANUARY 2005 | www.nature.com/nature 143© 2005 Nature Publishing Group
terrestrial organic matter dynamics. Soil humics are the functionalequivalent of refractory DOM, a large pool turning over on time-scales greater than 1 kyr. But unlike refractory DOM, soil humicsare relatively nutrient-rich and carbon-poor (C:N ¼ 12–20). Re-mineralization of inorganic nitrogen from soil organic matter canpromote a net CO2 sequestration if incorporated into woodybiomass (C:N ¼ 300:1) of regrowing forests22. Decomposition ofthe oceanic refractory pool would have a much greater effect onatmospheric CO2 concentrations than would soil humics, becausethe nutrients regenerated from the oceanic refractory pool wouldnot be able to support significant new organic matter production asa result of insufficient N and P.
Our results show the elemental composition of oceanic refractoryand labile DOM pools. The refractory pool is especially C-richrelative to N and P, and N-rich relative to P. More importantly, wefind that the labile pool is also C-rich; the C:N and C:P ratios of thelabile material are higher than the Redfield ratio. This pattern was
observed in both field and decomposition analyses. Deviations fromthe Redfield ratio alter our perceptions of the coupling betweenthe carbon, nitrogen and phosphorus cycles in the ocean. Thedifference between DOM and Redfield stoichiometry implies thatDOM export is C-rich. Thus for a given mass of new N or Pintroduced into surface water, 62% or 88% more DOC can beexported than would occur at the Redfield ratio. Relative to particleexport, which conforms to the Redfield ratio, we can consider DOMexport to be more ‘efficient’. Export of carbon-rich DOC maycontribute to the excess respiration estimated to occur in theinterior ocean5.
This new understanding of oceanic DOM stoichiometry hasseveral important implications. The majority of oceanic DOM islargely unidentified, because of analytical limitations. The stoichi-ometry we describe for labile and refractory DOM pools mightbe useful in constraining the biochemical composition ofthe unidentified DOM in testable ways. We now know the
Figure 3 A simplified conceptualization of oceanic DOM pools using a conventional two-
pool model. Labile and refractory oceanic DOM pools collectively comprise the bulk pool,
upon which prior knowledge is based. Labile DOM produced in the surface ocean that is
not decomposed in the surface ocean is exported to the deep ocean, where it resides for
up to a thousand years while it is slowly remineralized to its inorganic components. Our
study shows that labile DOM is produced and decomposed with a C:N:P stoichiometry of
199:20:1. This pool does not complete an ocean-mixing cycle and has an age of,1 kyr.
The refractory pool has an average age of 4 kyr and has a C:N:P stoichiometry very
different from labile DOM (3511:202:1). Only a small portion of the refractory DOM is
remineralized on a single mixing cycle, thus generating little ‘new’ inorganic C, N or P. The
relative contribution of DOM to the remineralization of inorganic N and P in deep water is
based on the assumption that the DOC represents 20% of total C export.
Table 1 DOM stoichiometry
Sample location
Georges Bank 1993 Middle Atlantic Bight 4/1994 Middle Atlantic Bight 8/1996 Hawaiian Ocean Time Series Mean Standard deviation...................................................................................................................................................................................................................................................................................................................................................................
C:N surface 12 (0.8) 14 (0.6) 14 (0.4) 15 (0.5) 14 1C:N deep 15 (2.1) 21 (2.5) 16 (1.7) 34 (2.2) 22 7C:P surface 444 (17) 374 (11) 398 (6) 281 (5) 374 59C:P deep 2,035 (162) 2,370 (196) 4,869 (220) 4,768 (196) 3,511 1,314N:P surface 35 (1.4) 26 (0.9) 27 (0.3) 19 (0.4) 27 6N:P deep 139 (14) 110 (16) 394 (9) 163 (16) 202 113Labile C:N 9.8 (1.4) 10.0 (0.9) 14.1 (0.6) 8.7 (0.6) 10.7 2.4Labile C:P 245 (29) 193 (17) 203 (7) 154 (10) 199 37Labile N:P 25 (2.5) 20.2 (1.1) 15.6 (0.4) 17.8 (0.5) 20 3...................................................................................................................................................................................................................................................................................................................................................................
C:N:P stoichiometry of bulk DOM pools in surface (mixed layer) and deep-ocean waters and of the labile DOM pools for shelf, slope and open-ocean regions. The stoichiometry of the labile DOM is based onlinear regressions of bulk pool data in Fig. 1 (see Methods). Numbers in parentheses are standard deviations.
letters to nature
NATURE | VOL 433 | 13 JANUARY 2005 | www.nature.com/nature144© 2005 Nature Publishing Group
stoichiometry of DOM and particulate organic matter export. Thisnew knowledge of DOM now allows an explicit constraint andestimate to be made of global carbon export and elemental balancevia advective pathways. Our new understanding also raisesadditional questions regarding the effect of global climate changeon the relative importance of DOM and particulate organic matterexport12,23 and the stoichiometry of DOM production, as well as thevulnerability of the C-rich, refractory pool of DOM to degrada-tion21. A
MethodsStudy areaWe studied DOM in a variety of environments, including continental shelf, continentalslope and central ocean gyre. Shelf, slope-break and slope samples were collected overdepth from along the northeastern USA, including Georges Bank and the Middle AtlanticBight10,11. Additional data (October, November and December 1999) are from the JointGlobal Ocean Flux Study (JGOFS) Pacific time-series station ALOHA, which is located inthe subtropical gyre at 228 45 0 N, 1508 W.
ApproachPatterns in the stoichiometry of DOM production and decomposition were determinedfrom element–element plots of samples. Best-fit linear equations were determined for eachdata set (DOC versus DON, DOC versus DOP and DON versus DOP) from each cruiseusing a Type II regression24, which accounts for errors in both coordinates. Analysis ofresiduals demonstrated the validity of a linear model. Slopes of the best-fit linear equationsrelating DOM concentrations (DOC versus DON, DOC versus DOP and DON versusDOP) describe the stoichiometry of DOM change that is due to production ordecomposition. From these equations, we also calculated C:N:P ratios for surface waterswhere DOM concentrations are increased and for deep water where DOM concentrationsare low. Radiocarbon dating of oceanic DOC indicates that the age of bulk DOC increaseswith depth18,25, and so sampling over depth is a proxy for sampling over time (that is,space-for-time), which requires sampling globally representative regions for deep andsurface water. With this approach it is necessary to sample enough surface and deep watersto get a statistically valid representation of the ‘population’ (all the DOC, DON and DOPmolecules in the surface and deep ocean) of CNP elemental ratios of surface and deepwaters. To characterize the ‘population’ we cast a wide sampling net that included a greatnumber and diversity of deep and surface waters, so that statistically, water-massvariability effects could be minimized. With a large data set covering different water massesand depths, the slope of the combined data will approach that of the true slope. Thereforewe sampled a wide variety of surface ocean environments, including coastal areas,continental shelf, western boundary currents and central ocean gyre. Deep samplesincluded many water masses including North Atlantic Deep Water, Antarctic Intermediateand Bottom Water, Labrador Current and North Pacific Intermediate Water. The resultsare presented as a range of values for each region, and an average across regions proposedto be globally representative of labile DOM stoichiometry.
The ‘global statistical’ approach we used integrates over broad spatial and temporalscales. A limitation of this approach is that it cannot be applied to specific trajectories atsmall temporal or spatial scales (for example, seasonal cycles or specific sites). Weacknowledge that there are deviations in DOM stoichiometry during events, such asphytoplankton bloom crashes, that cannot be isolated with the global statistical approach.Sampling along isopycnals (regions of constant density) would be a more appropriateapproach for discerning the smaller-scale trajectories.
Direct measures of decomposition stoichiometry were made from 180-day laboratoryincubations11. Incubations serve as a check on the space-for-time approach. 180 daysapproximates the residence time of shelf water and central-gyre surface water. Nitexscreened (108-mm) water was incubated in 50-ml flame-sealed glass ampoules. Triplicatesamples were frozen for later analysis after 0, 3, 12, 31, 90 and 180 days. Decompositionsamples were collected from 11 stations along the width and length of the MAB on twooccasions—March and August 1996. Changes in concentration of DOC, DON and DOPover time were used to estimate DOM decomposition rate and C:N:P stoichiometry11.
For the continental shelf, slope break and slope DOM and nutrient analysis, wecollected water at depths ranging from the surface to 1,500 m in depth on the RV Oceanusin April 1993 (GB93), RV Columbus Iselin in April 1994 (MAB94), RV Endeavor in March1996 and the RV Seward Johnson in August 1996 (MAB96). Samples were vacuum-filteredusing precombusted 47-mm Whatman GF/F glass fibre filters. For DOC analysis, sampleswere acidified, sealed and refrigerated at 4 8C (samples up to and including 1994) or frozenwithout acidification (1996) until analysis. In 1994, samples for DOC analysis were alsoanalysed onboard ship within a short time of collection. Comparisons between filteredand unfiltered and between stored and unstored samples demonstrated that filtrationand storage had no effect on concentration. For inorganic nutrient and total dissolved Nand P analysis, filtered water was poured directly into acid-washed and deionized-water-rinsed 500-ml polycarbonate or polypropylene bottles, and stored frozen untilanalysis.
Similar protocols were used by the JGOFS programme at station Aloha.
Chemical analysesDOM concentrations were determined following the procedure described in ref. 11.Basically, DOC was analysed by high-temperature oxidation with a Pt catalyst26. DON andDOP were determined as the difference between total dissolved N and P and inorganic N
and P (NH4þ, NO2
2, NO32, PO4
32). For DON and DOP, we followed the ultravioletoxidation procedure of ref. 27, with colorimetric analysis of NH4
þ, and PO432. A
chemiluminescence nitrogen oxide analyser was used to measure NO32 following the
conversion to NO gas28. DOC, DON and DOP were analysed similarly for HOTS samples
(high temperature29 and ultraviolet oxidation30).
Received 14 April; accepted 11 November 2004; doi:10.1038/nature03191.
1. Six, K. & Maier-Reimer, E. Effect of plankton dynamics on the seasonal carbon fluxes in a ocean
general circulation model. Glob. Biogeochem. Cycles 10, 559–583 (1996).
2. Carlson, C., Ducklow, H. & Michaels, T. Annual flux of dissolved organic carbon from the euphotic
zone of the northwest Sargasso Sea. Nature 371, 405–408 (1994).
3. Hansell, D. A. in Biogeochemistry of Marine Dissolved Organic Matter (eds Hansell, D. A. & Carlson, C.)
685–716 (Academic, New York, 2002).
4. Sarmiento, J. & Siegenthaler, U. in Primary Productivity and Biogeochemical Cycles in the Sea (eds
Falkowski, P. & Woodhead, A.) 317–332 (Plenum, New York, 1992).
5. del Giorgio, P. & Duarte, C. Respiration in the open ocean. Nature 420, 379–384 (2002).
6. le, B. & Williams, P. J. Evidence for the seasonal accumulation of carbon-rich dissolved organic
material, its scale in comparison with changes in particulate material and the consequential effect on
net C/N assimilation ratios. Mar. Chem. 51, 17–29 (1995).
7. Emerson, S. et al. Experimental determination of the organic carbon flux from open-ocean surface
waters. Nature 389, 951–954 (1997).
8. Eppley, R. & Peterson, B. Particulate organic matter flux and planktonic new production in the deep
ocean. Nature 282, 677–680 (1979).
9. Williams, P. M., Carlucci, A. & Olson, R. A deep profile of some biologically important properties in
the central North Pacific gyre. Oceanol. Acta, 1980, 471–476 (1980).
10. Hopkinson, C. S., Fry, B. & Nolin, A. Stoichiometry of dissolved organic matter dynamics on the
continental shelf of the Northeastern U.S.A. Contin. Shelf Res. 17, 473–489 (1997).
11. Hopkinson, C., Vallino, J. & Nolin, A. Decomposition of dissolved organic matter from the
continental margin. Deep-Sea Res. II 49, 4461–4478 (2002).
12. Church, M., Ducklow, H. & Karl, D. Multiyear increases in dissolved organic matter inventories at
Station ALOHA in the North Pacific Subtropical gyre. Limnol. Oceanogr. 47, 1–10 (2002).
13. Søndergaard, M. et al. Net accumulation and flux of dissolved organic carbon and dissolved organic
nitrogen in marine plankton communities. Limnol. Oceanogr. 45, 1097–1111 (2000).
14. Martin, J.,, Knauer, G., Karl, D. & Broenkow, W. VERTEX: carbon cycling in the northeast Pacific.
Deep-Sea Res. 34, 267–285 (1987).
15. Clark, L., Ingall, E. & Benner, R. Marine phosphorus is selectively remineralized. Nature 393, 426
(1998).
16. Loh, A. N. & Bauer, J. Distribution, partitioning and fluxes of dissolved and particulate organic C, N,
and P in the eastern North Pacific and Southern Oceans. Deep-Sea Res. 47, 2287–2316 (2000).
17. Williams, P. M. & Druffel, E. R. M. Radiocarbon in dissolved organic matter in the central North
Pacific Ocean. Nature 330, 246–248 (1987).
18. Bauer, J., Williams, P. & Druffel, E. 14C activity of dissolved organic carbon fractions in the central
North Pacific and Sargasso Sea. Nature 357, 667–670 (1992).
19. Jackson, G. & Williams, P. Importance of dissolved organic nitrogen and phosphorus to biological
nutrient cycling. Deep-Sea Res. 32, 223–235 (1985).
20. Carlson, C. in Biogeochemistry of Marine Dissolved Organic Matter (eds Hansell, D. A. & Carlson, C.)
91–151 (Academic, New York, 2002).
21. Mopper, K. et al. Photochemical degradation of dissolved organic carbon and its impact on the
oceanic carbon cycle. Nature 353, 60–62 (1991).
22. Melillo, J. M. et al. Soil warming and carbon-cycle feedbacks to the climate system. Science 298,
2173–2176 (2002).
23. Karl, D. M. A sea of change: biogeochemical variability in the North Pacific Subtropical Gyre.
Ecosystems 2, 181–214 (1999).
24. Press, W. H. & Teukolsky, S. Fitting straight line data with errors in both coordinates. Comput. Phys. 6,
274–276 (1992).
25. Bauer, J., Druffel, E., Williams, P., Wolgast, D. & Griffin, S. Temporal variability in dissolved
organic carbon and radiocarbon in the eastern North Pacific Ocean. J. Geophys. Res. 103, 2867–2881
(1998).
26. Peltzer, E. T. & Hayward, N. A. Spatial and temporal variability of total organic carbon along 140
degree W in the Equatorial Pacific Ocean in 1992. Deep-Sea Res. 43, 1155–1180 (1996).
27. Walsh, T. Total dissolved nitrogen in seawater: a new high-temperature combustion method and a
comparison with photo-oxidation. Mar. Chem. 26, 151–159 (1989).
28. Garside, C. A chemiluminescence technique for the determination of nanomolar concentrations of
nitrate and nitrite in seawater. Mar. Chem. 11, 159–167 (1982).
29. Qian, J. & Mopper, K. Automated high-performance, high-temperature combustion total organic
carbon analyzer. Anal. Chem. 68, 3090–3097 (1996).
30. Tupas, L., et al. Hawaii Ocean Time-series Program Data Report 8: 1996 (SOEST Tech. Report 97–7,
School of Ocean and Earth Science and Technology, Univ. of Hawaii, Honolulu, 1997).
Supplementary Information accompanies the paper on www.nature.com/nature.
Acknowledgements This research was funded by grants from the USDOE Ocean Margins
Program and the National Science Foundation. A. Nolin conducted thousands of chemical
analyses and with I. Buffam spent many days at sea collecting, incubating and filtering water.
We thank the crews of the RV Endeavor, RV Oceanus and RV Seward Johnson. R. Chen provided
intercomparison and blank checks on DOC determinations during cruises. D. Karl provided
access to the HOT data sets that were incorporated into this report.
Competing interests statement The authors declare that they have no competing financial
interests.
Correspondence and requests for materials should be addressed to C.H. ([email protected]).
letters to nature
NATURE | VOL 433 | 13 JANUARY 2005 | www.nature.com/nature 145© 2005 Nature Publishing Group