efficiency of energy utilization and fecal mineral
TRANSCRIPT

University of Nebraska - LincolnDigitalCommons@University of Nebraska - Lincoln
Theses and Dissertations in Animal Science Animal Science Department
Fall 12-2-2015
Efficiency of Energy Utilization and Fecal MineralExcretion in Holstein and Jersey Dairy CowsGabriel Garcia GomezUniversity of Nebraska-Lincoln, [email protected]
Follow this and additional works at: http://digitalcommons.unl.edu/animalscidiss
Part of the Dairy Science Commons
This Article is brought to you for free and open access by the Animal Science Department at DigitalCommons@University of Nebraska - Lincoln. It hasbeen accepted for inclusion in Theses and Dissertations in Animal Science by an authorized administrator of DigitalCommons@University of Nebraska- Lincoln.
Garcia Gomez, Gabriel, "Efficiency of Energy Utilization and Fecal Mineral Excretion in Holstein and Jersey Dairy Cows" (2015).Theses and Dissertations in Animal Science. 112.http://digitalcommons.unl.edu/animalscidiss/112

EFFICIENCY OF ENERGY UTILIZATION AND FECAL MINERAL
EXCRETION IN HOLSTEIN AND JERSEY DAIRY COWS
by
Gabriel Garcia Gomez
A THESIS
Presented to the Faculty of
The Graduate College at the University of Nebraska
In Partial Fulfillment of Requirements
For the Degree of Master of Science
Major: Animal Science
Under the Supervision of Professor Paul J. Kononoff
Lincoln, Nebraska
December, 2015

EFFICENCY OF ENERGY UTILIZATION, AND NITROGEN AND MINERAL
EXCREATION, IN HOLSTEIN AND JERSEY DAIRY COWS
Gabriel Garcia Gomez, M.S.
University of Nebraska, 2015
Advisor: Paul J. Kononoff
Eight multiparous Holstein and 8 Jersey excretion dairy cows were used to complete
energy balance trials designed to determine the effect of breed on the production and
energy efficiency of milk, and energy partitioning. A repeated switchback design was
used to compare the effect of cow breed. Diets consisted of 24.5% corn silage, 18.4%
alfalfa hay, 6.9% grass hay, with either 22.9% rolled corn and 14.8% soybean meal
(CON) or 8.95% rolled corn and 28.8% reduced fat distillers grains (RFDDGS) DM-
basis. Diets were offered ad libitum for a 28 d adaptation period and 95% ad libitum for a
4 d collection period. During the collection days, nutrient digestibility and energy use
was measured; indirect calorimeter respiration head boxes were used to determine heat
production. Across diets, Holstein had a lesser (P < 0.01) DMI as a proportion of BW
than Jersey cows (3.54 vs. 4.22 ± 0.13 DMI % BW, respectively). Milk protein (3.76 %
vs. 3.21% ± 0.11 for Jersey and Holstein, respectively; P < 0.01), and fat (4.97 % and
3.70 % ± 0.19 for Jersey and Holstein, respectively; P < 0.01) concentration increased
with Jersey compared with Holstein cows. Nevertheless, yield of ECM per unit of DM
consumed was not affected by breed and averaged 1.58 ± 0.05 kg/kg of DMI (P = 0.50).
The milk energy output per kg of DMI, per kg of BW0.75, and as a proportion of GEI did
not differ between breeds (P = 0.47). However, Jersey cows had a greater fecal energy
output per kg of DMI, per kg BW0.75, and as proportion of GEI (P = 0.03). Consequently,

ME as a proportion of GEI of Holstein was greater than that of Jersey cows (59.1 vs. 55.4
± 0.65% for Holstein and Jersey, respectively; P < 0.01). Milk energy output as a
proportion of ME was not affected by breed and averaged 47.0 ± 1.84 % of ME. Results
from this study suggest that breed had no effect on any of the dairy efficiency variables
measured.

iv
ACKNOWLEDGEMENTS
I would like to thank Dr. Paul Kononoff for opening the doors and letting me
learn more about dairy nutrition. Thanks to my committee member, Dr. Jim McDonald
and Dr. Phillip Miller who taught me important concepts of ruminant nutrition during
their lectures and also helped me to improve this thesis. I would like extend my gratitude
to the research team of USDA MARC including Dr. Tami Brown-Brandl, Dr. Harvey
Freetly, and Dale Janssen who provided their knowledge, experience, and facilities
throughout the duration of this project.
Thanks to former graduate students and friends Alison Foth and Chad Jenkins
who helped me during collection periods and shared their research experience. I would
really like to thank Hugo Ramirez and Barbara for being a great support for me and my
wife during my first semester at UNL. Thanks to my officemate Henry Paz for his
unrestricted help.
I really appreciate the work of Darren Strizek and Erin Marotz because without
their help and support none of the research projects would be possible. Special thanks to
Kiley Algya and Kellyn Saathoff who helped me during collection periods and lab
analysis of the samples. I was privileged to have the help Jana Harding who helped me to
learn many of the lab procedure and was patient enough to answer my questions.
. My family in Bolivia also deserves my gratitude for their support and encouraging
words while living abroad. I am blessed to have the support and affection of my lovely
wife Susan, everything you do for me proves that love conquers all. God I am grateful for
all your blessings.
“For unto every one that hath shall be given, and he shall have abundance: but from him
that hath not shall be taken away even that which he hath.”
-25 Matthew 29 NIV
“There is nothing from without a man that entering into him can defile him: but the
things which come out of him, those are they that defile the man.”
-7 Mark 15NIV

vi
TABLE OF CONTENTS
Chapter Page
CHAPTER 1
INTRODUCTION........................................................................................................... 1
LITERATURE REVIEW .............................................................................................. 3
Dairy Breeds ..................................................................................................................... 3
Milk Components.............................................................................................................. 4
Energy Balance ................................................................................................................. 5
Heat Production ............................................................................................................ 6
Methane energy ............................................................................................................. 8
Energy Requirements for Maintenance ............................................................................ 9
Energy Requirements for Lactation .................................................................................. 10
Feed Efficiency ................................................................................................................. 11
Nutrient Excretion ............................................................................................................. 14
Manure excretion .............................................................................................................. 14
Mineral and Nitrogen Excretion ....................................................................................... 16
Nitrogen Excretion ........................................................................................................ 17
Phosphorus Excretion ................................................................................................... 18
Potassium Excretion...................................................................................................... 19
Excretion of other Macro-minerals ............................................................................... 20
Trace Minerals Excretion .............................................................................................. 22
CONCLUSIONS ............................................................................................................. 23
REFERENCES ................................................................................................................ 24
TABLES AND FIGURES .............................................................................................. 32
APPENDIX I: Equations ................................................................................................ 39

vii
CHAPTER 2
Energy Utilization in Holstein and Jersey Dairy Cows Consuming Corn Milling Co-
Products
ABSTRACT .................................................................................................................... 41
INTRODUCTION........................................................................................................... 43
MATERIALS AND METHODS ................................................................................... 45
Statistical Analysis ............................................................................................................ 49
RESULTS AND DISCUSSION ..................................................................................... 50
Diet Composition .............................................................................................................. 50
Body Weight, Intake, Milk Production and Composition ................................................ 51
Gas Consumption and Production .................................................................................... 54
Nitrogen Balance and Digestibility ................................................................................... 55
Energy Partitioning ........................................................................................................... 57
CONCLUSIONS ............................................................................................................. 62
REFERENCES ................................................................................................................ 64
TABLES AND FIGURES .............................................................................................. 68
APPENDIX I: Equations ................................................................................................ 89
CHAPTER 3
Mineral Digestion of lactating Holstein and Jersey cows: Estimating mineral
excretion of diet containing RFDDGS
ABSTRACT ..................................................................................................................... 91
INTRODUCTION........................................................................................................... 93

viii
MATERIALS AND METHODS ................................................................................... 96
Statistical Analysis ............................................................................................................ 97
RESULTS AND DISCUSSION ..................................................................................... 97
Body weight, Intake, and Fecal Output ............................................................................ 97
Nutrient and mineral composition of diets........................................................................ 98
Mineral intake ................................................................................................................... 99
Nutrient and Mineral Composition of Feces .................................................................. 101
Mineral Excretion .......................................................................................................... 102
Apparent Digestibility of Minerals ................................................................................ 104
CONCLUSIONS .......................................................................................................... 106
REFERENCES ............................................................................................................. 107
TABLES AND FIGURES ........................................................................................... 112
ix
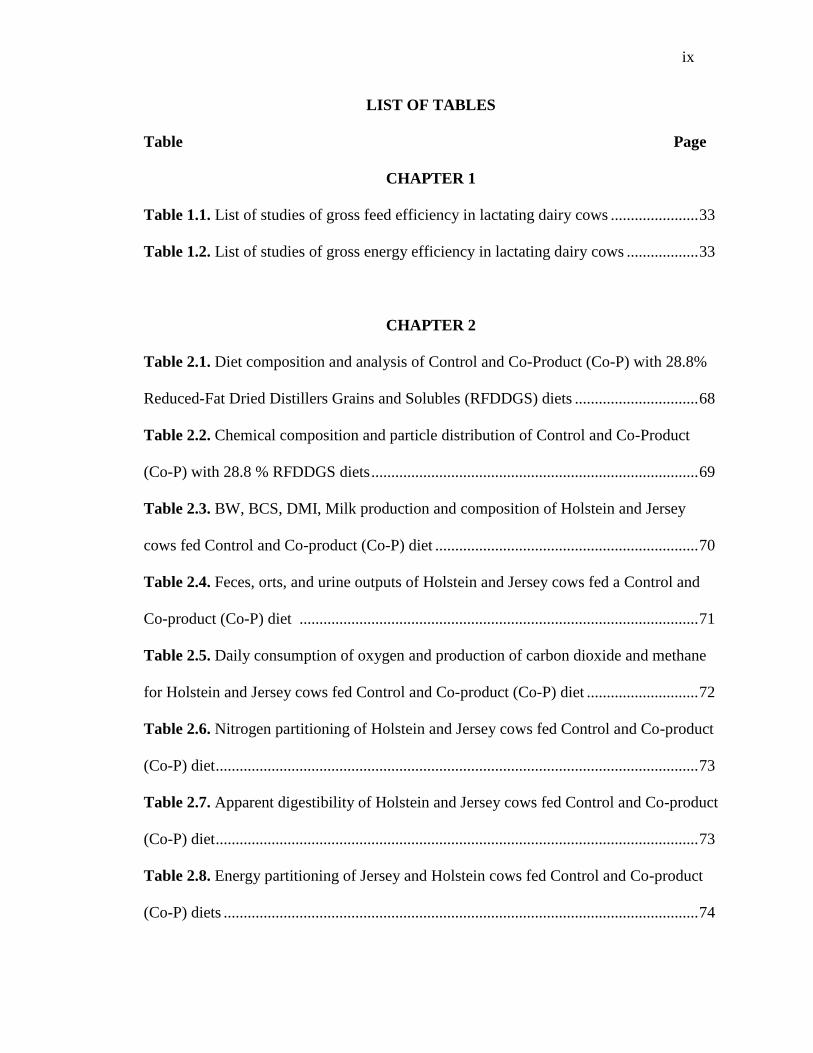
LIST OF TABLES
Table Page
CHAPTER 1
Table 1.1. List of studies of gross feed efficiency in lactating dairy cows ...................... 33
Table 1.2. List of studies of gross energy efficiency in lactating dairy cows .................. 33
CHAPTER 2
Table 2.1. Diet composition and analysis of Control and Co-Product (Co-P) with 28.8%
Reduced-Fat Dried Distillers Grains and Solubles (RFDDGS) diets ............................... 68
Table 2.2. Chemical composition and particle distribution of Control and Co-Product
(Co-P) with 28.8 % RFDDGS diets .................................................................................. 69
Table 2.3. BW, BCS, DMI, Milk production and composition of Holstein and Jersey
cows fed Control and Co-product (Co-P) diet .................................................................. 70
Table 2.4. Feces, orts, and urine outputs of Holstein and Jersey cows fed a Control and
Co-product (Co-P) diet .................................................................................................... 71
Table 2.5. Daily consumption of oxygen and production of carbon dioxide and methane
for Holstein and Jersey cows fed Control and Co-product (Co-P) diet ............................ 72
Table 2.6. Nitrogen partitioning of Holstein and Jersey cows fed Control and Co-product
(Co-P) diet ......................................................................................................................... 73
Table 2.7. Apparent digestibility of Holstein and Jersey cows fed Control and Co-product
(Co-P) diet ......................................................................................................................... 73
Table 2.8. Energy partitioning of Jersey and Holstein cows fed Control and Co-product
(Co-P) diets ....................................................................................................................... 74

x
Table 2.9. Energy partitioning as a percentage of GEI, DE, ME, and RE of Holstein an
Jersey cows fed Control and Co-product diets ................................................................. 75
Table 2.10. Energy variables with significant interaction ................................................ 76
CHAPTER 3
Table 3.1. Body weight, DMI, feces, and orts across breed (Control vs. Co-product) and
diets (Holstein vs. Jersey) .............................................................................................. 112
Table 3.2. Chemical composition of Control, and Co-product concentrates ................ 113
Table 3.3. Mineral analysis of diets across breed (Control vs. Co-product) and diets
(Holstein vs. Jersey) ....................................................................................................... 114
Table 3.4. Minerals intake across breed (Control vs. Co-product) and diets (Holstein vs.
Jersey) ............................................................................................................................ 115
Table 3.5. Minerals intake per a hundred kg of BW across breed (Control vs. Co-
product) and diets (Holstein vs. Jersey) ......................................................................... 116
Table 3.6. Minerals intake per a kg of DMI across breed (Control vs. Co-product) and
diets (Holstein vs. Jersey) .............................................................................................. 117
Table 3.7. Mineral analysis of feces across breed (Control vs. Co-product) and diets
(Holstein vs. Jersey) ....................................................................................................... 118
Table 3.8. Mineral excretion in feces across breed (Control vs. Co-product) and diets
(Holstein vs. Jersey) ....................................................................................................... 119
Table 3.9. Minerals excretion in feces per a hundred kg of BW across breed (Control vs.
Co-product) and diets (Holstein vs. Jersey) ................................................................... 120

xi
Table 3.10. Minerals excretion per a kg of DMI across breed (Control vs. Co-product)
and diets (Holstein vs. Jersey) ....................................................................................... 121
Table 3.11. Minerals apparent digestibility across breed (Control vs. Co-product) and
diets (Holstein vs. Jersey) .............................................................................................. 122
Table 3.12. Simple effects of variables with significant interactions ........................... 123

xii
LIST OF FIGURES
Figure Page
CHAPTER 1
Figure 1.1. The effect of breed on the relative proportion of energy used for maintenance
vs. lactation and efficiency to produce cheese .................................................................. 35
Figure 1.2. Dietary energy flow and energetic losses involved with digestive and
metabolic processes in the ruminant ................................................................................. 36
Figure 1.3. Photo of head-boxes collecting gas at University of Lincoln Nebraska ........ 37
Figure 1.4. Relationship between DMI and trial-adjusted manure excretion for lactating
cows. Manure excretion (kg/d) = DMI (kg/d) × 2.63 + 9.4 .............................................. 38
Figure 1.5. The relationship between excretion of P via manure and intake of P. The
phosphorus manure excretion (g/d) = −2.5 + 0.64 × P intake (g/d) .................................. 38
CHAPTER 2
Figure 2.1. Reduced-fat distillers grains and solubles ..................................................... 77
Figure 2.2. Timeline of each period, including 28 d of diet adaptation, followed by 7 d of
collection and sampling .................................................................................................... 78
Figure 2.3. Headbox for gas collection, fecal and urine collection system into an
aluminum pan and a Surge milk can, respectively ........................................................ .. 79
Figure 2.4. Aluminum bags for collection of gas from a live animal using the indirect
calorimeter headbox system ........................................................................................... .. 80
Figure 2.5. Partitioning of energy as percentage of GEI of Holstein and Jersey cows. .. 81

xiii
Figure 2.6. Regression of RE (milk + tissue energy) on ME (intake energy – fecal energy
– urinary energy – methane energy) in kcal/BW0.75 ;(y =0.8046x – 169.64; R2 = 0.86) in
Holstein cows. Recovered energy = 0 at 210.8 kcal/BW0.75 and efficiency of converting
metabolizable energy to lactation energy, kl = 80.5% ................................................... .. 82
Figure 2.7. Regression of RE (milk + tissue energy) on ME (intake energy – fecal energy
– urinary energy – methane energy) in kcal/ BW0.75 (y = 0.7423x – 157.45; R2 = 0.91) in
Jersey cows. Recovered energy = 0 at 212.1 kcal/MBW and efficiency of converting
metabolizable energy to lactation energy, kl = 74.2 % .................................................. .. 83
Figure 2.8. Gross energy intake (GEI), Mcal for Holstein and Jersey cows fed Control
and Co-product diet........................................................................................................ .. 84
Figure 2.9. Digestible energy (DE), Mcal for Holstein and Jersey cows fed Control and
Co-product diet .............................................................................................................. .. 84
Figure 2.10. Metabolizable energy (ME) Mcal for Holstein and Jersey cows fed Control
and Co-product diet........................................................................................................ .. 85
Figure 2.11. Heat production energy (HP), Mcal for Holstein and Jersey cows fed
Control and Co-product diet .......................................................................................... .. 85
Figure 2.12. Gross energy intake (GEI), Mcal per kg of DMI for Holstein and Jersey
cows fed Control and Co-product diet ........................................................................... .. 86
Figure 2.13. Gross energy intake (GEI), Mcal per kg of BW0.75 for Holstein and Jersey
cows fed Control and Co-product diet .......................................................................... .. 86
Figure 2.14. Digestible energy (DE), Mcal per kg of BW0.75 for Holstein and Jersey
cows fed Control and Co-product diet ........................................................................... .. 87

xiv
Figure 2.15. Metabolizable energy (ME), Mcal per kg of BW0.75 for Holstein and Jersey
cows fed Control and Co-product diet ........................................................................... .. 87
Figure 2.16. Heat production energy (HP), Mcal per kg of BW0.75 for Holstein and Jersey
cows fed Control and Co-product diet ........................................................................... .. 88
Figure 2.17. Urine energy, Mcal per kg of BW0.75 for Holstein and Jersey cows fed
Control and Co-product diet .......................................................................................... .. 88
CHAPTER 3
Figure 3.1. P excretion of Holstein and Jersey lactating cows fed Co-product and Control
diets in g per kg of DMI ................................................................................................. 122
Figure 3.2 P excretion of Holstein and Jersey lactating cows fed Co-product and
Control diet in g 100 kg of BW. .................................................................................... 123
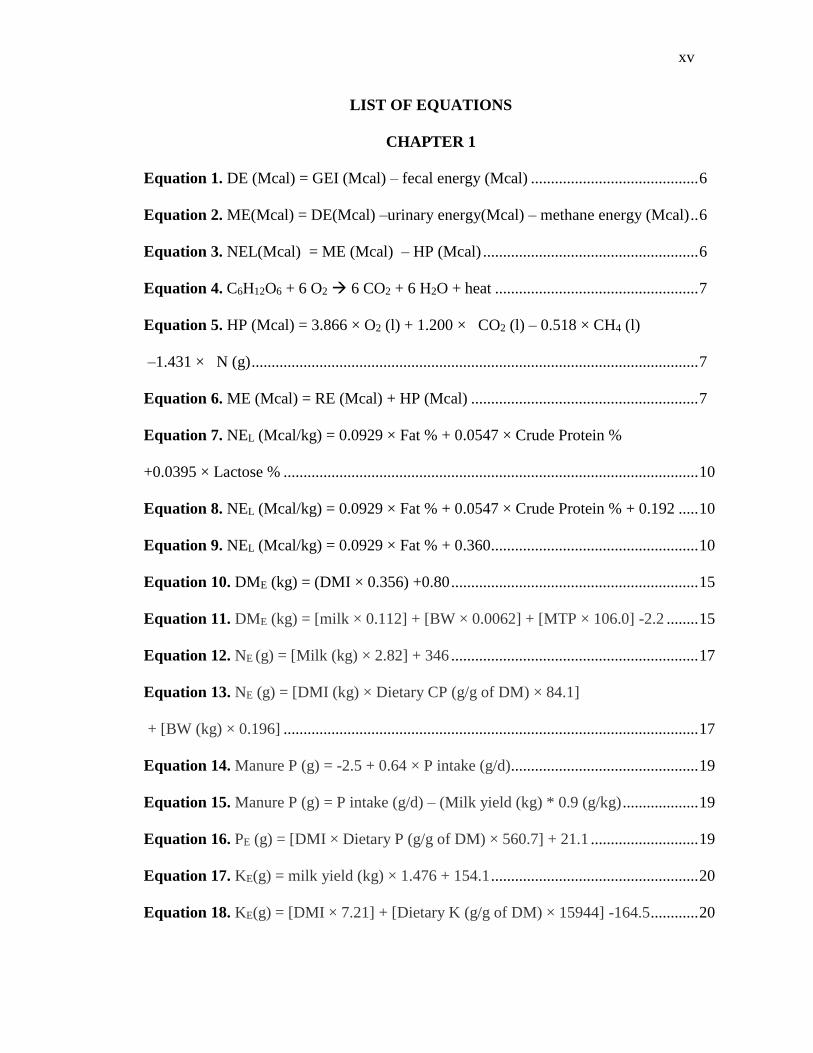
xv
LIST OF EQUATIONS
CHAPTER 1
Equation 1. DE (Mcal) = GEI (Mcal) – fecal energy (Mcal) .......................................... 6
Equation 2. ME(Mcal) = DE(Mcal) –urinary energy(Mcal) – methane energy (Mcal) .. 6
Equation 3. NEL(Mcal) = ME (Mcal) – HP (Mcal) ...................................................... 6
Equation 4. C6H12O6 + 6 O2 6 CO2 + 6 H2O + heat ................................................... 7
Equation 5. HP (Mcal) = 3.866 × O2 (l) + 1.200 × CO2 (l) – 0.518 × CH4 (l)
–1.431 × N (g) ................................................................................................................ 7
Equation 6. ME (Mcal) = RE (Mcal) + HP (Mcal) ......................................................... 7
Equation 7. NEL (Mcal/kg) = 0.0929 × Fat % + 0.0547 × Crude Protein %
+0.0395 × Lactose % ........................................................................................................ 10
Equation 8. NEL (Mcal/kg) = 0.0929 × Fat % + 0.0547 × Crude Protein % + 0.192 ..... 10
Equation 9. NEL (Mcal/kg) = 0.0929 × Fat % + 0.360 .................................................... 10
Equation 10. DME (kg) = (DMI × 0.356) +0.80 .............................................................. 15
Equation 11. DME (kg) = [milk × 0.112] + [BW × 0.0062] + [MTP × 106.0] -2.2 ........ 15
Equation 12. NE (g) = [Milk (kg) × 2.82] + 346 .............................................................. 17
Equation 13. NE (g) = [DMI (kg) × Dietary CP (g/g of DM) × 84.1]
+ [BW (kg) × 0.196] ........................................................................................................ 17
Equation 14. Manure P (g) = -2.5 + 0.64 × P intake (g/d)............................................... 19
Equation 15. Manure P (g) = P intake (g/d) – (Milk yield (kg) * 0.9 (g/kg) ................... 19
Equation 16. PE (g) = [DMI × Dietary P (g/g of DM) × 560.7] + 21.1 ........................... 19
Equation 17. KE(g) = milk yield (kg) × 1.476 + 154.1 .................................................... 20
Equation 18. KE(g) = [DMI × 7.21] + [Dietary K (g/g of DM) × 15944] -164.5 ............ 20

xvi
CHAPTER 2
Equation 1. DE (Mcal) = GEI (Mcal) – fecal energy (Mcal) .......................................... 49
Equation 2. ME (Mcal) = DE (Mcal) – urinary energy (Mcal) – CH4 energy (Mcal) .... 49
Equation 3. HP (Mcal)= 3.866 × O2 (l) + 1.200 × CO2 (l) – 0.518 × CH4 (l) – 1.431 × N
(g) .......................................................................................................................... 49
Equation 4. RE (Mcal) = ME (Mcal) – HP (Mcal) .......................................................... 49
Equation 5. TE (Mcal) = RE (Mcal) – milk energy (Mcal) ............................................. 49

1
CHAPTER I
INTRODUCTION
Efficient conversion of feed into milk is critical to improve the economic
performance of dairy farms (Predenville et al., 2009) since feed costs may account for up
to 80% of the variable costs of dairy production (Shalloo, 2007). Additionally,
improving feed efficiency of dairy cows reduces the excretion of nutrients fed in excess
which allows decreasing the manure management cost and the environmental impact
(Hoffmant et al. 2007).
Energy utilization is difficult to determine in lactating cows because of the
multiple complex biological pathways used to produce milk. Energy must be digested,
metabolized, and used to meet maintenance requirements before producing milk (NRC,
2001). Multiple factors may affect feed conversion and breed may be one of them.
Beecher et al. (2014) observed that production efficiency and energy partitioning
(Mcal/BW0.75) between breed can be different between Jersey, Jersey × Holstein, and
Holstein cows because Jersey and Jersey × Holstein had greater gastro intestinal tract
(GIT) as a proportion of body weight (BW) than Holstein cows.
In the period of 2009 to 2014, Jersey percentage of cow population increased
from 4.9% to 6.4% while population of Holstein decreased from 89.6% to 83.9% (CDCB,
2015), which shows that Jersey is increasing in popularity in dairy farms in the United
States. This increase may be related to Jerseys capacity to produce greater milk
components than Holstein (Capper and Caddy, 2012) since the price of milk is based on
milk fat, true protein and other solids (Bailer and Tozer, 2001). However, it is not clear if
adding Jersey cows to the herd would increase revenue to overall production, especially
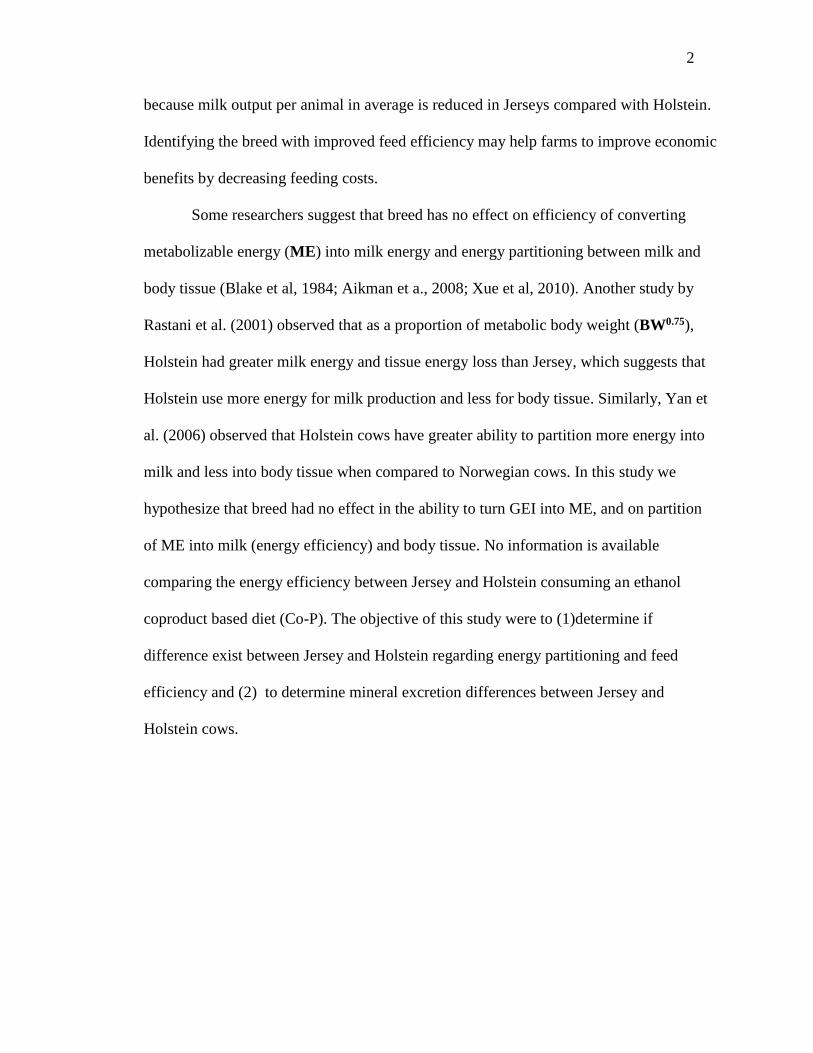
2
because milk output per animal in average is reduced in Jerseys compared with Holstein.
Identifying the breed with improved feed efficiency may help farms to improve economic
benefits by decreasing feeding costs.
Some researchers suggest that breed has no effect on efficiency of converting
metabolizable energy (ME) into milk energy and energy partitioning between milk and
body tissue (Blake et al, 1984; Aikman et a., 2008; Xue et al, 2010). Another study by
Rastani et al. (2001) observed that as a proportion of metabolic body weight (BW0.75),
Holstein had greater milk energy and tissue energy loss than Jersey, which suggests that
Holstein use more energy for milk production and less for body tissue. Similarly, Yan et
al. (2006) observed that Holstein cows have greater ability to partition more energy into
milk and less into body tissue when compared to Norwegian cows. In this study we
hypothesize that breed had no effect in the ability to turn GEI into ME, and on partition
of ME into milk (energy efficiency) and body tissue. No information is available
comparing the energy efficiency between Jersey and Holstein consuming an ethanol
coproduct based diet (Co-P). The objective of this study were to (1)determine if
difference exist between Jersey and Holstein regarding energy partitioning and feed
efficiency and (2) to determine mineral excretion differences between Jersey and
Holstein cows.
3
CHAPTER I
LITERATURE REVIEW
Dairy Breeds
Two of the most common dairy breeds in USA are Holstein and Jersey, which
together account for approximately 90% of the dairy cows (CDCB, 2015). For many
decades dairy cows in the U.S. have been selected intensively for milk production.
Holstein is the most popular breed used in the U. S. dairy farms. It represents 83.9% of
the dairy cow population (CDCB, 2015). This breed is well known for its high ability to
produce large volume of milk, fat, and protein. On average, a mature Holstein cows
weights about 680 kg and produce 11500 kg of milk, 420 kg of fat, and 340 kg of protein
in a 305 d period of lactation (USH, 2009). Holstein age at first calving averages 26.8
months and only 38% of cows remain alive at 5 years of age (Garcia-Peniche et al. 2006).
Productive life of Holstein cows average approximately 4 years (USH, 2009). Some
health issues present in Holstein cows may be a result of the intensive selection for milk
production. Other traits such as longevity, fertility, and resistance to diseases have been
marginalized during the selection process (Lucy, 2001; Price et al., 2004; Macket et al.,
2007; Xue et al., 2011). Moreover, inbreeding level in various Holstein populations
continue rising (Hansen, 2000). As a result, some dairy farms have been introducing
crossbred Jersey × Holstein not only to improve milk composition but also reproductive
performance and longevity (Xue et al., 2011).
The second breed most popular in the U. S. is Jersey. In 2014, this breed
accounted for about 6.4 % of the dairy herds (CDCB, 2015). Jersey cows have an average
milk production of 7455 kg, 347 kg of fat, and 268 kg of protein per 305 d production
4
(AJCA, 2009). The Jersey’s BW is between 400 to 450 kg. Jersey’s average age at first
calving is 25.8 months and the average productive life is 33.6 months (AJCA, 2009).
Auldist et al. (2007) observed that Jersey × Holstein had less calving problems, larger
estrus periods, fewer services per conception, and shorter calving intervals than Holstein,
which suggest improved reproductive performance in Jersey cattle. In addition, Smith et
al., (2013) observed that Jersey cows had less variability in milk components and smaller
declines in milk production than Holstein cows under heat stress condition. Heat stress
tolerance of Jersey may be related to a lesser requirement of energy for thermoregulation
in Jerseys compared with Holsteins (Espinoza et al, 2009).
Milk Components
The value of milk is determined by the milk component concentration, which
have become a very important factor in the recent years (Bailer and Tozer, 2001). In the
last ten years, the demand of milk for cheese increased because the per capita
consumption of cheese in the U. S. augmented from 26.9 kg in 1995 to 34.17 kg in 2014
(USDA, 2015). In the U.S. there are two breed with distinguished characteristics,
Holstein with high milk yield and Jersey with greater milk nutrient density and lesser BW
(Capper and Cady, 2012). The advantage of Jersey compared with Holstein in milk
components is clear, the average milk fat and protein in Holstein is 3.64 and 3.06 %,
respectively, while Jersey milk contains 4.6 % butterfat and 3.6 % protein (AJCA, 2009).
A study by Heinz et al. (2008) observed no effect of breed between Jersey × Holstein and
Holstein in fat and protein yield per kg of DMI which averaged 94 g/kg DMI. Milk
components are the major determinant of cheese yield (Capper and Cady et al., 2012).

5
Anderson et al. (2007) observed no difference between Jersey × Holsteins and Holstein
cows in cheese yield per kg of DMI and averaged 160 g per kg of DMI. However,
Auldist et al. (2004) observed that Jersey cattle yielded 10% more cheese per kg of milk
than Holstein. In the latter study breed had no effect on the quality and yield of cheddar
cheese when milk was standardized to equal fat and protein concentrations. Capper and
Caddy estimated that Jersey require less energy than Holstein to produce 1 kg of cheese
(65 MJ vs. 72 MJ /kg of cheese for Jersey and Holstein, respectively; Figure 1.1).
According to Cho et al. (2009), milk nutrient density (fat and protein) had a
substantial effect to determine the value of milk in 105 dairy farms in New York.
However, Bailey et al. (2005) observed that total yield of components resulted in the
highest income over feed cost (IOFC) for a representative Holstein and Jersey herd in
Pennsylvania. Bailey et al. (2005) advised that adding Jersey to a Holstein herd, with
lesser milk production lesser than the current herd average could cancel any gains of
greater milk components. According to Bailey, the most important factor affecting IOFC
was the total amount of milk, fat, and protein yield, and not the concentration of milk
components.
Energy balance
The relationship between dietary intake and energy utilization is known as energy
balance (Butler and Smith, 1987). Loss of body weight (BW) is associated with negative
energy balance while gain in BW with positive energy balance (Coffey et al., 2002).
Usually cows lose BW during due to negative energy balance in the early lactation but
return to positive energy balance between 40 to 80 d in lactation (Coffey et al., 2002).
Figure 1.2 illustrates the energy flow and losses through the digestive and metabolic

6
processes in the dairy cow. The energy content of feed that an animal consumes is known
as gross energy intake (GEI), which is estimated by the heat of combustion of the
ingredients, that is determined through a bomb calorimetry (Blaxter, 1962). A portion of
the GEI is digested and absorbed; the remainder fraction is excreted in the feces. The
energy that is not lost in the animal feces is known as the digestible energy (DE;
Equation 1). Part of the energy that is absorbed and digested is lost without being used
by the animal. These losses include the urinary energy and methane (CH4) energy. The
metabolizable energy (ME; Equation 2) is the energy available for metabolic process of
the animal such as maintenance, growth, and production. Equation 3 represents the net
energy for lactation (NEL), which is the ME minus the heat production energy (HP) and
is the energy available for productive purposes in the dairy cow. The expressions for the
partial efficiency of ME expended for maintenance, lactation, protein gain, fat gain, and
gain in total tissue energy are denoted by km, kl, kp, kf, and kg, respectively (Moe, 1981).
DE (Mcal) = GEI (Mcal) – fecal energy (Mcal) [1]
ME (Mcal) = DE (Mcal) – urinary energy (Mcal) – methane energy (Mcal) [2]
NEL(Mcal) = ME (Mcal) – HP (Mcal) [3]
Heat Production. Animals produce heat as a result of the physiological digestion
and oxidation of dietary compound (Blaxter, 1989; Equation 4), the energy loss as body
heat is defined as heat production (HP). Brouwer (1965) developed an equation to
indirectly estimate HP in ruminants, and has been recently used in energy balance trials
(Birkelo et al., 2004; Xue et al., 2011, Foth et al., 2015). This equation calculates the HP
as a function of the consumption of oxygen (O2), production of carbon dioxide (CO2),
and CH4, and N in urine (Equation 5). The theory behind this equation is that oxidation

7
heat from carbohydrates, protein, and fat, as well as heat from the urea production is
equal to the total heat produced by the animal. In addition, ME can be determined
through indirect calorimetry as a function of the HP and recovered energy (RE)
(Equation 6).
C6H12O6 + 6 O2 6 CO2 + 6 H2O + heat [4]
HP (Mcal) = 3.866 × O2 (l) + 1.200 × CO2 (l) – 0.518 × CH4 (l) – 1.431 × N (g) [5]
ME (Mcal) = RE (Mcal) + HP (Mcal) [6]
Reducing the amount of energy attributed to HP can leave more energy available
for milk synthesis, in other words, productive efficiency can be improved by reducing
energy used for HP. Tine et al. (2001) observed that HP was greater in animals that were
fed ad libitum compared with restricted diets; however in this study, HP expressed as a
proportion of GEI was not different between diet types. Observations from Belyea an
Adams (1990) showed that there was no difference in HP between low and high genetic
merit lactating Holstein cows; however, when HP was expressed per kg of BW 0.75, the
high merit cows had lesser HP compared with the low merit cows. These findings suggest
that it is possible to reduce the loss of energy in HP through genetic selection; reducing
HP would increase energy available for milk production.
The gas measurement, necessary to estimate the HP by indirect calorimetry, can
be estimated using the heat-box (Figure 1.3). The head-box is a simplification of the
whole animal chambers because it only encloses the head of the animal and it allows
estimating HP by indirect calorimetry (Foth et al., 2015). However, a disadvantage of the
head box is that it cannot measure gasses that result from hind gut fermentation which
can account for 2 to 12 % of total methane production (Johnson and Johnson, 1995). The

8
benefits of using the head box in dairy experiments include easy fecal and urine collect as
well as milking without disrupting gas collection. Additionally, head box reduces animals
stress compared with whole animal chamber, which also reduces variability in feed intake
(Johnson and Johnson, 1995).
Methane energy. Microorganisms in the rumen and hindgut, also known as
methanogens, can produce methane through the normal process of feed digestion (Sarah
et al., 2010). Typically ruminants lose 6% of the energy intake as eructed methane and it
can vary between 2 to 12 % (Johnson and Johnson, 1995). The CH4 energy is not
available for metabolic processes to the animal; decreasing the CH4 production is
beneficial because it improves energetic efficiency and decrease greenhouse gas emission
to the environment (Johnson and Johnson, 1995; Hegarty, 1999). Reduction of methane
production it is possible by depriving rumen methanogen of H2 (Hegarty, 1999). The H2
concentration in the rumen can be reduced by altering the feed fermentation in the rumen
to yield more propionate and butyrate instead of acetate. Altering the forage to
concentrate ratio in the diet can affect the ratio of acetate to propionate production and
therefore the H2 production (Stewart and Bryant, 1988).In addition, increasing non-
structural carbohydrates result in and increase in the concentration of propionate which in
consequence reduce the pH in the rumen (Blaxter and Clapperton, 1965). Lesser pH is
associated with reduction of methanogens activity and methane production (Reynolds et
al., 2014). Methane production can also be reduced by ionophore monensin which
reduces the availability of H2 due to a shift of acetate toward propionate production and
associated decrease in methanogenesis (Russell and Houlihan, 2003). Odongo et al.
(2006) observed that CH4 production (g/d) was reduced by 7% when monensin was
9
supplemented at 24 mg/kg. An alternative method to reduce methane production is the
use of unsaturated fatty acids as H2 sinks via biohydrogentation and as protozoa
inhibitors in the rumen (Johnson and Johnson, 1995). However, Johnson et al. 2002
observed that adding 1.7% of oilseed had no effect on the methane energy as a proportion
of GEI. Methane production in the rumen can also be affected by the digestibility of
forage, for example, Hegarty (1999) observed that shifting animals from a low to a high
digestible pasture resulted in a reduction of methane production per BW. Research
suggests that it is possible to reduce methane production and increase efficiency by
different nutritional strategies.
Energy Requirement for Maintenance
The energy required for normal metabolism of dairy cow is known as
maintenance energy, which includes energy expenditure in body thermoregulation,
energy necessary for digestive processes, as well as energy to replace dead cells. In
addition, energy requirements for maintenance can increase due to grazing activity,
environmental conditions, physiological state such as pregnancy or lactation (NRC,
2001). In a review of energy studies by Foth (2014), the energy requirements for
maintenance for dairy cows ranged between 90 and 170 kcal/kg BW0.75 Yan et al.
(1997) observed that the metabolizable energy requirement for maintenance (MEm) in
dairy cows fed a grass-silage based diet increased with greater milk yields. The greater
MEm in the latter study was associated to greater energy requirement of larger hepatic
mass, gastro intestinal tract, and renal organs that accompanied the greater intake of
energy. In the study of Yan et al. (1997), the MEm was estimated through linear

10
regression of milk energy output against ME intake and ranged between 0.61 and 0.5
MJ/kg BW0.75 or 146 to 179 Kcal/kg BW0.75. Tyrrell et al. (1991) observed that, even
though Holstein produced approximately 30% more milk than Jersey, milk energy output
in (Mcal) per kg BW0.75 was not affected by breed, which suggested that breed did not
affect MEm. Reynolds and Tyrrell (2000) compared the requirements of maintenance
energy between lactating Holstein and Hereford-Angus cows, this study observed no
difference between breeds, estimating the energy requirement of maintenance at 120 kcal
of ME/kg BW 0.75. Xue et al. (2011) determined the maintenance requirement for
Holstein and Jersey × Holstein at 170 and 160 kcal of ME/kg BW 0.75, respectively; even
though these values were numerically different, no effect of breed was observed on the
MEm. The NRC (2001) does not include any adjustment factor for breed to estimate the
energy requirement for maintenance and a reports a value of 80 kcal/kg BW0.75.
Energy Requirements for Lactation
The NRC (2001) defines the net energy for lactation (NEL) as the energy
contained in milk and is equal to the sum of heat of combustion of individual milk
components (fat, protein, and lactose). The NRC (2001) estimates the requirements for
NEL as a function of individual components (Equation 7), as a function of fat and protein
(Equation 8), and as a function of fat content only (Equation 9).
NEL (Mcal/kg) = 0.0929 × Fat % + 0.0547 × Crude Protein % + 0.0395 × Lactose % [7]
NEL (Mcal/kg) = 0.0929 × Fat % + 0.0547 × Crude Protein % + 0.192 [8]
NEL (Mcal/kg) = 0.0929 × Fat % + 0.360 [9]

11
The NEL can also be defined as the proportion of ME that is used to produce milk
and can be calculated as the difference between ME and HP (Equation 3). Belyea and
Adams (1990) observed that high and low producing cows did not differ in efficiency to
convert GEI to DE (90%) and DE to ME (70%). However, HP as a proportion of ME was
approximately 10% greater in low producing cows (52.9 vs 61.7 ± 1.54 % for high and
low producing cows, respectively), which allowed high producing cows to partition more
energy for milk production. According to Belyea and Adams (1990), partitioning of
energy is complex but genetic selection can result in improved energetic efficiency in
dairy cows. Increasing energy supply in diet has a substantial effect on NEL since more
ME is partitioned into milk (Andrew et al., 1991). In addition, feed processing can affect
NEL, as observed by Wilkerson et al. (1997) who reported that high moisture corn
yielded greater NEL values than ground corn. None of the NRC (2001) equations to
estimate NEL included and adjustment for breed.
Feed Efficiency
A broad definition of feed efficiency is the ratio of desired product (i.e. growth,
work, milk) to total feed intake (Brody, 1945). Blake and Custodio (1984) defined feed
efficiency as the rate of converting dietary nutrients to milk after adjustment for nutrients
supplied by catabolism (e.g., negative energy balance) or nutrients divert to replenish
tissue reserves. Table 1.1 and Table 1.2 show gross feed efficiency and energy efficiency
values observed in energy trials with dairy cows. The dairy feed efficiency is equal to the
ratio of milk yield or energy corrected milk (ECM) divided by the DMI (Maulfair et al.,
2011). Alternative measurements of feed efficiency are: milk energy/Mcal DE

12
(Dickinson et al.,1969), yield of fat corrected milk (FCM) per units of estimated energy
intake (Hooven et al., 1971), and yield of solid corrected milk (SCM) per kg of
DMI(Grieve et al., 1976). Efficiency can also be expressed as milk energy as a
proportion of ME, milk energy as a proportion of GEI, or milk energy divided by kg
BW0.75(Reynolds et al., 2014; Xue et al., 2011). Reduction of expenditure of energy for
HP, methane production, or energy balance (tissue energy) as a proportion of GEI and
ME may indicate improved energetic efficiency.
Various studies evaluated the effect of breed on energetic and feed efficiency
(Grainger and Goddard, 2004; Anderson et al., 2007; Heinz et al., 2008; Yan et al., 2006;
Xue et al., 2011). Xue et al. (2011) observed that breed (Holstein vs. Jersey × Holstein)
had no effect on the partition of ME between milk and body tissue. The results of the
latter study suggested that in average 32% of ME was used for milk production and this
proportion did not change with concentrate level (30 vs 70% concentrate). Additionally
Xue et al. (2011) observed that the efficiency to convert GEI into ME was 68% and it
was similar between breeds. Similarly, Heins et al. (2008) studied the effect of breed
(Holstein vs Jersey × Holstein) on feed efficiency measured as ECM/DMI and milk
solids (protein and fat)/DMI in the first 150 d of lactation. In this study, breed had no
effect on ECM/DMI and it averaged 1.43 kg of milk per kg of DMI; similarly the milk
solids yield per Kg of DMI averaged 94 g and was unaffected by breeds. Anderson et
al. (2007) evaluated the feed efficiency of a Holstein vs. Jersey and Jersey × Holstein in a
confinement dairy herd of about one thousand cows (80% Holstein and 20% Jersey and
Jersey × Holstein) in Wisconsin. In the latter study, feed efficiency was measured as fat
corrected milk (FCM) per kg of DMI, solid corrected milk (SCM) per kg of DMI, and

13
ECM per kg of DMI. Anderson et al. (2007) observed that Jersey and Jersey × Holstein
had numerically greater feed efficiency than Holstein; however when feed efficiency was
measured as cheese yield (kg) per kg of DMI, breed had no effect and it averaged 159 g
/kg of DMI.
The dairy efficiency can be also expressed in economics terms, a simple and
common concept is the income over feed cost (IOFC) which is calculated dividing the
gross milk income (milk price × milk yield) and total feed cost per cow per day. Other
cost associated with dairy production such as health cost, productive life, and
reproductive efficiency may not be constant between breed but IOFC can be adjusted for
these factors. Anderson et al. (2007) determined the IOFC for a group of Holstein and a
group of Jersey and Jersey × Holstein dairy cows. The IOFC using actual farm milk
prices in Holstein cows was 0.42 $ /cow per day greater than Jersey and Jersey × Holstein
cows. The advantage of Holstein over the Jersey group was reduced to 0.26 $/cow per
day after milk price was adjusted for premium prices due to milk components. The IOFC
was 0.21 $/cow per day greater on Jersey group cows after IOFC was adjusted for days
open and culling rates. The findings of Anderson et al. (2007) suggest that milk pricing
programs (i.e. component premiums) may have a substantial impact on the economic
performance of dairy farms. The energy and feed efficiency is an important estimator of
performance of dairy cow. The use of other such as IOFC may complement the
information necessary to evaluate the nutritional programs of dairy farms.
14
Nutrient Excretion
Dietary nutrients that are fed in excessive amounts are not utilized efficiently for
milk production (NRC, 2001). In consequence, large amount of nutrients can be excreted
in feces and urine, which results in increased milk production costs and greater emissions
of pollutants to the environment (Chandler, 1996; Castillo et al., 2013). An ideal feeding
regime consist of supplying nutrient amounts to maximize milk synthesis and milk
components, ruminal fermentation, growth of rumen microbes, while minimize losses of
nutrients to the environment (NRC, 2001).
Guidelines of nutrient management plans for concentrated animal feeding
operations have been issued by the U.S. Environmental Protection Agency (EPA, 2003),
and farms should be in compliance with all federal and state regulations (NRC, 2001).
Adequate nutrient supplementation is necessary to improve nutrient management and to
reduce environmental pollution. In addition, disposal and odor problems can result in
more strict regulation (NRC, 2001). Appropriate manure handling and storage is
necessary to maximize the use of waste nutrients in the crop land (NRC, 2001).
Manure excretion
The sum of fecal and urine production is equal to the manure excretion (NRC,
2001). The production of manure from data set of metabolic studies of lactating cows in a
wet basis averaged 66.3 ± 14.4 kg/d and ranged between 27.7 to 114.4 kg/d (Nennich et
al. 2005). Urine production averaged 23.1 ± 7.19 kg/d and accounted for one third of the
total manure excretion (Nennich et al. 2005). Manure excretion was observed to have a
linear relationship with DMI (Figure 1.4). Additionally, Knowlton et al. (2010)

15
determined that wet manure excretion for Holstein and Jersey was 74.3 and 49.8 ± 2.34
kg/d, respectively. Tomlinson et al. (1996) observed that the fecal DM ranged from 6.2 to
7.4 kg/d, similar values were observed by Nennich et al. (2005) and Weiss and Wyatt
(2004) for lactating cows averaging 7.3 ± 1.63 and 6.9 ± 1.5 kg/d, respectively. The fecal
DM excretion observed by Knowlton et al. (2010) was 8.11 and 5.67 ± 0.32 kg/d for
Holstein and Jersey, respectively. Knowlton et al (2010) indicated that difference in fecal
DM output between Holstein and Jersey were proportional to differences in DMI and BW
Several equations were developed to predict manure and nutrient excretion for
Holstein cows (Wilkerson et al., 1997; St-Pierre and Thraen, 1999; Knowlton et al. 2002;
Nennich et al., 2005). According to these studies, the variable that most accurately
predicts DM manure excretion (DME) is DMI. Van Horn et al. (1994) estimated that
DME could be determined by multiplying DMI by 0.33 and adding the urine DM.
Nennich et al. (2005) developed and equation to estimate DME (Equation 10). This
equation shows a direct relationship between DMI and DME. Other variables (BW, DIM,
Milk yield) were not significant to predict DME when included in the equation with DMI.
In the absence of DMI, Nennich et al. (2005) developed an equation based on milk yield,
BW, and milk true protein (MTP) (Equation 11).
DME (kg) = (DMI × 0.356) +0.80 [10]
DME (kg) = [milk × 0.112] + [BW × 0.0062] + [MTP × 106.0] -2.2 [11]

16
Mineral and Nitrogen Excretion
Overfeeding of minerals can result in greater excretion of minerals which could
have negative environmental effects (Castillo et al., 2013). Mineral overfeeding can also
inflate feed costs, decrease absorption of other minerals because of antagonism effects,
and have negative effects on ruminal microbes and the cow (NRC, 2001).
Several equations were developed to estimate mineral excretion by dairy cows
(Morse et al., 1992; Beede and Davidson, 1999; Weiss and Wyatt, 2004; Nennich et al.,
2005). Most of these equations calculate mineral excretion by subtracting mineral
secretion of milk to the mineral intake. Additionally, Castillo et al. (2013) included
mineral intake provided by drinking water and observed that ignoring minerals consumed
via water introduced significant errors when estimating manure excretion of minerals via
the mass balance technique. However, the degree of error associated with not including
the water mineral intake can vary greatly between farms (Castillo et al., 2013).
The main concerns from the environmental perspective is the excretion of
nitrogen (N) and phosphorus (P) (NRC, 2001). For example, the Water Quality Control
Board of California regulates the discharge of N, P, and K in the dairy farms (Castillo et
al., 2013). The excretion of other minerals such Cd, Cu, Fe, hg, P, K, Na, Se, S, and Zn
have shown potential negative effects on crop yields or the environment (Castillo et al.
2013). Therefore, it is likely that future environmental regulation will include more of
these mineral. Defining accurate nutrient requirements of dairy cows will minimize
nutrient excretion (NRC, 2001). Adequate mineral excretion estimates are needed in
dairy farms for proper nutrient management plans (Nennich et al., 2005).

17
Nitrogen excretion. Milk secretion accounts for 25 to 35 percent of the N that
dairy cows consume (Chase, 1994; Chandler et al., 1996). The remaining N is almost
entirely excreted in feces and urine (NRC, 2001). Consequently, Nitrogen excretion (NE)
can be determined by the difference of intake and milk secretion of N (Van Horn et al.,
1994). Nennich et al. (2005) developed and equation to estimate NE as a function of milk
yield (Equation 12). It was observed that increase in N intake resulted in greater N
excretion in several studies (Tomlinson et al., 1996; James et al., 1999; Krober et al.,
2000; Frank et al., 2002; Nennich et al., 2005). The best predictor of NE was N intake.
Equation 13 estimates the NE as a function of DMI, dietary CP (g/g of DM), and BW (kg)
(Nennich et al. 2005).
NE (g) = [Milk (kg) × 2.82] + 346 [12]
NE (g) = [DMI (kg) × Dietary CP (g/g of DM) × 84.1] + [BW (kg) × 0.196] [13]
Excretion of N in g/d was reported by Nennich et al. (2005) and Knowlton et al.
(2010). In the first study, the average N excretion averaged 439 ± 94 g/d and it ranged
from 180 to 741 g/d for a data set of lactating dairy cows (n= 529). It was also observed
that fecal and urinary N averaged 222 ± 59 and 216.5 ± 64 g/d, respectively (Nennich et
al. 2005). Knowlton et al. (2010) observed that fecal N was 243 and 162 ± 10 g/d for
Holstein and Jersey respectively, whereas urinary NE was 213 and 161 ± 6 g/d.
Additionally, milk N was 162 and 115 ± 8 g/d for Holstein and Jersey, respectively.
Interestingly, Knowlton et al. (2010) observed that breed had no effect on the NE and
milk N as a percentage of N intake averaging 73% and 25.4%, respectively. In general,
from the total N excretion, approximately 50 % of N is excreted in feces and 50% in
urine.

18
Phosphorus excretion. The amount of P fed in excess of cow’s requirement is
excreted in the feces and urine (NRC, 2001). The requirement of dietary P for a mature
lactating dairy cow ranges from 0.32 to 0.38 % DM or 44.2 to 80.3 g/d for Holsteins and
41 to 60 g/d in Jersey cows (NRC, 2001). Several experiments were conducted to
determine the P excretion of dairy cows (Morse et al.,1992; Wu and Satter, 2000;
Knowlton et al. 2001; Knowlton and Herbein, 2002). Those studies suggested that current
NRC (2001) requirements of dietary P are sufficient or somewhat overestimated. Morse
et al. (1992) fed diets with increasing levels of P (0.30, 0.41 and 0.56 %DM), which
supplied 60, 82, and 112 g/d of P. The amount of P that cows excreted was 42, 51, and 80
g/d respectively, which indicate a direct relationship between P intake and excretion
(Morse et al., 1992). In a later review by Weiss and Wyatt (2004), P excretion from
various digestion trials were evaluated (8 experiments, 39 dietary treatments, 162
observations). In this review, dietary concentration of P averaged 0.35 %DM and ranged
from 0.18 to 0.50 %DM producing P intakes of 45 to 133 g/d. Weiss and Wyatt et al.
(2004) observed that fecal P output averaged 47 g/d and ranged from 18 to 84 g/d,
whereas apparent digestibility averaged 40.4 % and ranged from 9.3 to 75.8%. Knowlton
and Herbein (2002) fed three levels of dietary P (0.34, 0.51, and 0.67 %DM) and
observed that total P excretion increased from 37 to 108 g/d. Knowlton and Herbein
(2002) observed that P apparent digestibility decreased from 53.3 to30.9 % with greater
level of dietary P. Knowlton and Herbein (2002) also reported that P secreted in milk did
not varied substantially and remained between 45.5 to 50.3 g/d. Nennich et al. (2005)
evaluated P utilization from a mineral data set (8 experiments, n=85) and observed that
dietary P averaged 0.44 %DM ranging from 025 to 0.60 %DM. Nennich et al. (2005)

19
observed that total P excretion for a lactating cow averaged 74 g/d and ranged from 27 to
114 g/d. Generally, cows that were fed greater amount of P excreted greater amounts of P
in manure (Weiss and Wyatt, 2004; Figure 1.5). Approximately 95 to 99 of P is excreted
in feces (Knowlton and Herbein, 2001; Weiss and Wyatt, 2004). The excretion of P in
urine is minimal in ruminants, but and can vary with P intake and secretion of
Parathyroid hormone (NRC, 2001).
Several equations were developed to predict P excretion (Beede and Davidson,
1999; Weiss and Wyatt, 2004, Nennich et al. 2005). It was determined that the best
single independent variable to predict P excretion was P intake (Weiss and Wyatt, 2004;
Nennich et al. 2005). Weis developed an equation to predict total manure P (g/d) as a
function of P intake (Equation 14). Van Horn et al. (1994) and Beede and Davidson
(1999) estimated manure excretion of P (g/d) by subtracting the amount of P secreted in
milk (g/d) from the total intake of P (Equation 15). Nennich et al. (2005) also developed
an equation to predict P excretion (g/d) as a function of dietary P (g/g of DM) and DMI
(kg) (Equation 16).
Manure P (g) = -2.5 + 0.64 × P intake (g/d) [14]
Manure P (g) = P intake (g/d) – (Milk yield (kg) * 0.9 (g/kg) [15]
P excretion (g) = [DMI × Dietary P (g/g of DM) × 560.7] + 21.1 [16]
Potassium excretion. The dietary requirement of Potassium (K) for a lactating
cow ranges between 1 and 1.07 %DM (NRC, 2001). Potassium is mainly excreted via
urine and some unabsorbed K is wasted in feces (NRC, 2001). Bannink et al. (1999)
determined that fecal K excretion was 43 ± 17 g/d and urinary K was 310± 136 when
cows were fed an average of 390 ± 150 g/d of K. In the latter study apparent K
20
digestibility averaged 87% and ranged between 71 and 97%. Nennich et al. (2005)
observed that K excretion averaged 200 ± 49 g/d and that approximately 75 % of the K
was excreted in urine when dietary K was fed at an average of 1.29 ± 0.19 %DM.
Excretion of K is directly associated with dietary K concentration and milk yield
(Nennich et al. 2005). As a result, K excretion can be predict as a function of milk yield
(Equation 17) or K dietary intake (Equation 18) (Nennich et al. 2005).
K excretion (g) = milk yield (kg) × 1.476 + 154.1 [17]
K excretion (g) = [DMI × 7.21] + [Dietary K (g/g of DM) × 15944] -164.5 [18]
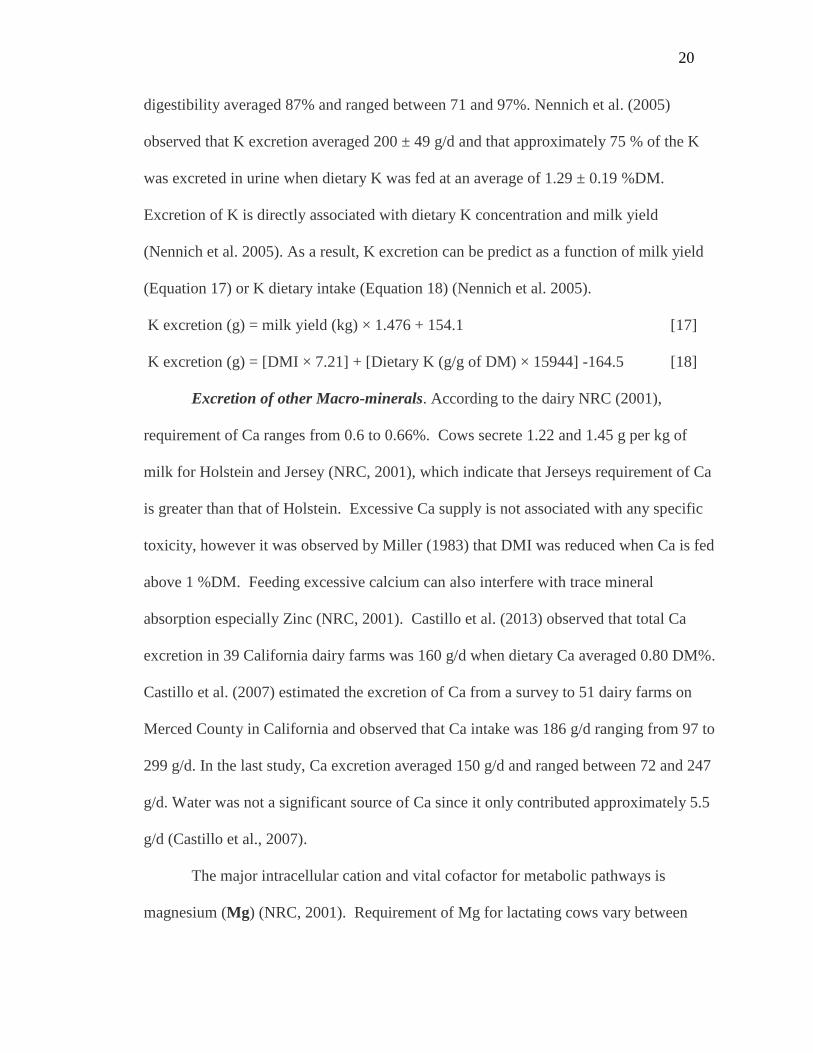
Excretion of other Macro-minerals. According to the dairy NRC (2001),
requirement of Ca ranges from 0.6 to 0.66%. Cows secrete 1.22 and 1.45 g per kg of
milk for Holstein and Jersey (NRC, 2001), which indicate that Jerseys requirement of Ca
is greater than that of Holstein. Excessive Ca supply is not associated with any specific
toxicity, however it was observed by Miller (1983) that DMI was reduced when Ca is fed
above 1 %DM. Feeding excessive calcium can also interfere with trace mineral
absorption especially Zinc (NRC, 2001). Castillo et al. (2013) observed that total Ca
excretion in 39 California dairy farms was 160 g/d when dietary Ca averaged 0.80 DM%.
Castillo et al. (2007) estimated the excretion of Ca from a survey to 51 dairy farms on
Merced County in California and observed that Ca intake was 186 g/d ranging from 97 to
299 g/d. In the last study, Ca excretion averaged 150 g/d and ranged between 72 and 247
g/d. Water was not a significant source of Ca since it only contributed approximately 5.5
g/d (Castillo et al., 2007).
The major intracellular cation and vital cofactor for metabolic pathways is
magnesium (Mg) (NRC, 2001). Requirement of Mg for lactating cows vary between

21
0.18 and 0.21 % DM. The amount of Mg secreted in milk is about 0.12 to 0.15 g/kg
(Agricultural Research Council, 1980; Henry and Benz, 1995).The average dietary Mg
concentration from 39 California dairy farms was 0.33 % DM and ranged between 0.30
and 0.40 %DM (Castillo et al. 2013). The excretion of Magnesium was estimated by
Castillo et al. (2013) by difference between Mg intake and milk Mg content. The latter
study estimated that excretion of Mg averaged 77 g/d and it ranged between 52 and 99
g/d. Similarly, Castillo et al. (2007) reported Mg intakes and excretion of 71 ± 14.7 g/d
and 67 ± 17.1 g/d, respectively.
The requirement of sodium (Na) according to the NRC (2001) is 0.22 %DM. The
amount of sodium secreted in milk is 0.63 g/kg (NRC, 2001). However Castillo et al.
(2013) measured minerals in the bulk tank of 39 dairy farms in California and reported a
value between 0.35 and 0.43 g of Na per kg of milk and that NRC (2001). Castillo et al.
(2013) observed that average dietary concentration of Na in 39 dairy farms in California
were 0.43 % DM and estimated excretion of Na averaged 97 g/d. Castillo et al. (2007)
observed that water can be a substantial source of Na and that its contribution to the total
excretion averaged approximately 17%.
Dietary sulfur (S) is required in dairy cow diet to improve microbial protein
synthesis of cysteine and methionine (NRC, 2001). The dietary requirement of S is set at
0.20 %DM. Feeding S in excess can decrease absorption of other minerals such as copper
and selenium (NRC, 2001). It was observed that beef cattle fed diets containing sulfur at
0.5 %DM can develop polioencephalomalacia-like syndrome (Beke and Hironaka, 1991;
McAllister et al., 1997). Castillo et al. (2013) observed that sulfur content in 39 dairy
farms in California averaged 28 %DM varying from 0.22 to 0.36 %DM, which resulted

22
in sulfur excretion of 58 g/d. Castillo et al. (2007) also observed that water was a
significant source of sulfur in 51 dairy farms in California and can supply approximately
15% of the total sulfur intake.
Trace Minerals Excretion. The requirement of copper (Cu) for lactating dairy
cows is set at 11 mg/kg, and absorption coefficient of Cu ranges from 2% to 5%
depending on S and Mo dietary content (NRC, 2001). Increases of S above 0.2%
decreases Cu absorption; increases in Mo above 0.5 mg/kg decreases absorption of Cu.
Castillo et al. (2007) reported that dietary Cu in 51 dairy farms in California averaged 15
mg/kg, which was 35% more than NRC’s recommendations. In the latter study, they
observed that Cu intake and excretion were not constant and ranged between 123 to 772
mg/d and 119 to 767 mg/d per cows, respectively. Additionally, Castillo et al. (2013)
observed that Cu dietary concentration in 39 California dairy farms was 18 mg/kg and it
varied between 10 to 30 mg/kg, whereas excretion of Cu averaged 417 mg and fluctuated
between 230 and 730 mg.
Lactating dairy cows require 20 mg/kg of iron (Fe) (NRC, 2001). Levels above
250 mg/kg of iron can have detrimental effects in the absorption of Cu and Zn (NRC,
2001). The mean level of Iron in 51 dairy farms in California averaged 200 mg/kg
(Castillo et al. 2007). In the previous study, iron excretion averaged 4200± 983 mg/d per
cow. The excretion of iron reported by Castillo et al. (2013) was 8200 mg/d and ranged
between 5000 and 14500 mg/d. In the latter study, dietary concentrations were above
NRC requirements and averaged 350 mg/kg which explain the high excretion of Fe.
The manganese (Mn) requirement for lactating cows was set at 15 mg/kg (NRC,
2001). Weiss and Socha (2005) observed that the dietary requirement for lactating cows

23
was 1.6 times greater than the NRC value. High dietary content of Ca, K, and P can
reduce the absorption of Mn and increase the concentration of Mn in feces (NRC, 2001).
Castillo et al. (2007) observed that dietary Mn averaged 67.1 ± 22.8 mg/kg DM and
ranged between 23 to 142 mg/kg DM. Castillo et al. (2013) observed concentration of
dietary Mn averaged 73 mg/kg DM and averaged 48 to 105 mg/kg DM. In the latter
study, Mn excretion was 1784 mg/d and ranged from 1133 to 2420 mg/d.
The most abundant trace mineral in milk is Zn (NRC, 2001). Castillo et al. (2013)
analyzed mineral content of milk of 39 dairy farms and the Zn content wad 3.3 mg/kg.
The lactating cow had a Zn requirement of 55 mg/kg DM (NRC, 2001). The dietary
content of Zn in the survey of Castillo et al. (2007) averaged 68.2 ± 25.8 mg/kg DM. The
Zn content of water was observed to be negligible (Castillo et al., 2007). Excretion of Zn
ranged from 480 to 2592 mg/d in the survey of the latter study. The Zn excretion in the
study of Castillo et al. (2013) averaged 1700 and ranged from 919 to 2300 mg/d.
CONCLUSIONS
The efficiency to which feed energy is utilized for milk production is of great
importance because it impacts the economic and environmental sustainability of dairy
farms. Various studies suggested that energy metabolism, partitioning of energy, and
energy efficiency to produce milk may be affected by breed. Therefore, the aim of this
study was to determine the effect of breed on energy partitioning, energy efficiency for
milk production, and mineral excretion.

24
REFERENCES
Agricultural Research Council. 1980. The Nutrient Requirements of Ruminant Livestock.
Slough, England: Commonwealth Agricultural Bureaux.
Andrew, S.M., H.F. Tyrrell, C.K. Reynolds, and R.A. Erdman. 1991. Net energy for
lactation of calcium salts of long-chain fatty acids for cows fed silage-based diets. J.
Dairy Sci. 74:2588–2600.
AJCA. (2009). American Jersey Cattle Association. AJCA performance programs.
Anderson, T., Shaver, R., Bosma, P., and De Boer, V. (2007). Case Study: Performance
of Lactating Jersey and Jersey-Holstein crossbred versus Holstein Cows in a
Wisconsin Confinement Dairy. Prof. Anim. Sci. 2007; 23: 541–545
Auldist, M. J., Johnston, K. A., White, N. J., and Fitzimons, W. P. (2004). A comparison
of the composition, coagulation characteristics, and cheese making capacity of milk
from Friesian and Jersey dairy cows. J. Dairy Sci, 71: 51–57.
Auldist M.J., Pyman M.F.S., Grainger C., Macmillan K.L. (2007). Comparative
reproductive performance and early lactation productivity of Jersey × Holstein
Cows in predominantly Holstein herds in a pasture-based dairying system. J Dairy
Sci, 90: 4856-4862.
Bailey, K. W., Jones, C. M., and Heinrich, A. J. (2005). Economic Returns to Holstein
and Jersey Herds Under Multiple Component Pricing. J. Dairy Sci, 88:2269-2280.
Beke, G. J., Hironaka, R.. 1991. Toxicity to beef cattle of sulfur in saline well water: A
case study. Sci. Total Env. 101:281– 290.
Bannink, A., H. Valk, A. M. Van Vuuren. 1999. Intake and excretion of sodium,
potassium, and nitrogen and the effects on urine production by lactating dairy
cows. J. Dairy Sci, 82: 1008-1018.
Beede, D.K., Davidson, J.A. 1999 . Phosphorus: Nutritional management for Y2K and
beyond. Tri-State Dairy Nutr. Conf., Ft. Wayne, IN. The Ohio State Univ.,
Columbus, OH; (Pages 51–97)
Beecher M., Buckley F., Waters S.M., Boland T.M., Enriquez-Hidalgo D., Deighton
M.H., O'Donovan M., Lewis E. 2014. Gastrointestinal tract size, total-tract
digestibility, and rumen microflora in different dairy cow genotypes. J. Dairy Sci.,
97 (6): 3906-3917.
Belyea, R.L., Adams, M.W.. 1990. Energy and nitrogen utilization of high versus low
producing dairy cows. J. Dairy Sci. 73:1023–1030.

25
Bines, J. A., Hart, J. C. 1978. Hormonal regulation of the partition of energy between
milk and body tissue in adult cattle. Proc. Nutr. Soc., 37(3):281-7.
Birkelo, C. P., Brouk, M. J., and J, S. D. (2004). The energy content of wet corn distillers
grains for lactating dairy cows. J. Dairy Sci., 87:1815-1819.
Blake, R. W. (1979). Research needs to supply milk protein in the human diet. J. Dairy
Sci, 62:1963.
Blake, R. W., and Custodio, A. A. 1984. Feed Efficiency: A composite trait of dairy
cattle. J Dairy Sci, 67:2075-2083.
Blake, R. W., and Custodio, A. A. 1986. Comparative Feed Efficiency of Holstein and
Jersey Cows. J. Dairy Sci, 69:1302-1308.
Blaxter, K.L. 1962. The Energy Metabolism of Ruminants. 2nd ed. Hutchinsom & Co.
Ltd., London, UK.
Blaxter, K. L., and Clapperton, J. L. 1965. Prediction of the amount of methane produced
by ruminants. British Journal of Nutrition, 19:511-522.
Brouwer, E. 1965. Report of Sub-committee on Constants and Factors. Pages 441-442 in
Energy Metabolism. K.L. Blaxter, editor. Academic Press Inc. Ltd., London, UK.
Capper J.L., Cady R.A. (2012). A comparison of the environmental impact of Jersey
compared with Holstein milk for cheese production. J. Dairy Sci. 95: 165-176.
Castillo, A. R., Santos, J. E., & Tabone, T. J. 2007. Mineral balances, including in
drinking water estimated for Merced County dairy herds. California Agriculture,
61:2.
Castillo, A. R., St-Pierre, N. R., del Rio, N. S. 2013. Mineral concentration in diets,
water, and milk and their value in estimatin on-farm excretion of manure minerals in
lactating dairy cows. J Dairy Sci. 96(5):3388-98.
Chandler, P. T. 1996. Enrionmental challenges as related to animal agriculture-dairy. Pp.
7-19 in Nutrient Manageent of Food Animals to Enhance and Protect the
Environment. E. T. Kornegay ed. CRC Press, Inc., Boca Raton, FL.
Chase, L. E. 1994. Environmental considerations in developing dairy rations. pp. 56-62 in
Proc. Cornell Nutri. Conf. feed Manuf., Rochester, NY. Cornell Univ., Ithaca, NY.
Cho, J., Nakane, M., and Tauer, L. W. 2009. Altering milk components produced by the
dairy cows: Estimation by Multiple Output Distance Function. Paper presented at
the Northeastern Agricultural and Resource Economics Meeting.

26
Coffey M.P., Simm G., Brotherstone, S. 2002. Energy balance profiles for the first three
lactations of dairy cows estimated using random regression. Journal of Dairy
Science, 85 (10) , pp. 2669-2678.
Council on Dairy Cattle Breeding (CDCB). 2015. DHI participation as of January 1,
2015, DHI report K-1. https://www.cdcb.us/publish/dhi/part.html. Accessed
September 25, 2015.
Dickinson, F. N., McDaniel, B. T., and McDowell, R. E. (1969). Comparative efficiency
of feed utilization during first lactation of Ayrshire, Brown Swiss and Holstein
cows. . J. Dairy Sci., 52:489-497.
Espinoza, J. C., Sanchez, J. R., Gracia, J. A., Ortega, R., Palacios, A. 2009.
Thermoregulation differs in Chinampo (Bos taurus) and locally born dairy cattle.
Turk. J. Vet. Anim. Sci. 33: 175-180.
Environmental Protection Agency (EPA). 2003. National pollution discrage elimination
system permit regulation and effluent limitation guidelines and standrads for
concentrated animal feeding operations (CAFOs). Final Rule. Fed. Regist. 68:7176-
7274.
Frank, B., Person, M., and Gustafsson, G. 2002. Feeding dairy cows for decreased
ammonia emission. Livest. Prod. Sci., 76: 171–179
Foth, A. J. 2014. Energy content of reduced-fat dried distillers grains and solubles for
lactating dairy cows and effects on energy and nitrogen balance. Master thesis of
Animal Science UNL.
Foth A.J., Brown-Brandl T., Hanford K.J., Miller P.S., Garcia Gomez, G., Kononoff, P.J.
2015. Energy content of reduced-fat dried distillers grains with solubles for lactating
dairy cows. J.Dairy Sci., 98: 7142-7152.
Garcia-Peniche T.B., Cassell B.G., Misztal I. (2006). Effects of breed and region on
longevity traits through five years of age in Brown Swiss, Holstein, and Jersey cows
in the United States. J. Dairy Sci., 89: 3672-3680.
Grainger, C., Goddard, M. E. 2004. A review of the effects of dairy breed on feed
conversion efficiency—An opportunity lost?. Animal Production in Australia, 25:
77–80.
Grieve, D. G., Macleado, G. K., Batra, T. R., Burnside, E. B., and Stone, J. B. (1976).
Relationship of feed intake and ration digestibility to estimated transmitting ability,
body weight, and efficiency in first lactation. J. Dairy Sci. , 59:1312.

27
James, T., Meyer, D., Esparza, E., DePeters, E.J., and Perez-Monti, H. 1999. Effects of
dietary nitrogen manipulation on ammonia volatilization from manure from Holstein
heifers. J. Dairy Sci., 82: 2430–2439
Johnson, K.A., and D.E. Johnson. 1995. Methane emissions from cattle. J. Anim. Sci.
73:2483–2492.
Johnson K.A., Kincaid R.L., Westberg H.H., Gaskins C.T., Lamb B.K., Cronrath J.D.
2002. The effect of oilseeds in diets of lactating cows on milk production and
methane emissions. J. Dairy Sci., 85: 1509-1515.
Johnson, D.E., C.L. Ferrell, and T.G. Jenkins. 2003. The history of energetic efficiency
research: Where have we been and where are we going? J. Anim. Sci. 81:E27–E38.
Knowlton, K. F., Herbein, J. H.. 2002. Phosphorus Partitioning During Early Lactation in
Dairy Cows Fed Diets Varying in Phosphorus Content. J. Dairy Sci. , 85:1227-1236.
Knowlton, K.F., Wilkerson, V.A., Casper, D.P., and Mertens, D.R. 2010. Manure
nutrient excretion by Jersey and Holstein cows. J. Dairy Sci. 93: 407–412
Krober, T.F., Kulling, D.R., Menzi, H., Sutter, F., and Kreuzer, M. 2000. Quantitative
effects of feed protein reduction and methionine on nitrogen use by cows and
nitrogen emission from slurry. J. Dairy Sci., 83: 2941–2951
Hegarty, R. S. (1999). Mechanisms for competitively reducing ruminal methanogenesis.
Aust.J.Agric.Res.50:1299– 1306.
Heins, B. J., Hansen, L., Seykora, A. R., Hazel, D. G., Johnson, D. G., and Linn, J. G.
(2008). Crossbreds of Jersey×Holstein Compared with Pure Holsteins for Body
Weight, Body Condition Score, Dry Matter Intake, and Feed Efficiency During the
First One Hundred Fifty Days of First Lactation. Journal of Dairy Science, 1094.
Hellwing, A., Lund, P., Weisbjerg, M. R., Brask, M., and Hvelplund, T. (2012).
Technical note: test of low-cost and animal-friendly system for measuring methane
emissions from dairy cows. J. Dairy Sci., 95:6077-6085.
Henry, P. R., and S. A. Benz. 1995. Magnesium Bioavailability. Pg. 201 in
Bioavailability of Nutrients for Animals, C. B. Ammerman, D. H. Baker, and A. J.
Lewis, eds. San Diego: Academic Press.
Hoffman P.C., Simson C.R., Wattiaux M. 2007. Limit feeding of gravid holstein heifers:
Effect on growth, manure nutrient excretion, and subsequent early lactation
performance. J. Dairy Sci., 90 (2): 946-954.
28
Hooven, N. W., Miller, R. H., and Smith, J. W. 1971. Part lactation feed efficiency of
Holsteins and Jerseys. Paper presented at 66th Annu. Mtg. Dairy Sci. Assoc.,
Michigan State Univ., East Lansing.
Hansen, L.B. Consequences of selection for milk yield from a geneticist's viewpoint. J.
Dairy Sci. 2000; 83: 1145–1150.
Lucy, M.C. Reproductive loss in high-producing dairy cattle: Where will it end?. J. Dairy
Sci. 2001; 84: 1277–1293.
Mackey, D.R., Gordon, A.W., McCoy, M.A., Verner, M., and Mayne, C.s. Associations
between genetic merit for milk production and animal parameters and the fertility
performance of dairy cows. Anim. 2007; 1: 29–43
Maulfair, D., Heinrich, J., and Ishler, V. (2011). Feed Efficiency for Lactating Dairy
Cows and Its Relationship to Income Over Feed Costs. Penn State Extension.
Department of Dairy and Animal Science.
McAllister, M. M., Gould, D. H., Raisbeck, M. F., Cummings, B. A., and Loneragan, G.
H. 1997. Evaluation of ruminal sulfide concentrations and seasonal outbreaks of
polioencephalomalacia in beef cattle in a feedlot. J. Am. Vet. Med. Assoc.
211:1275– 1279.
Miller, W. J. 1983. Using mineral requirement standards in cattle feeding programs and
feed formulations. Pp. 69– 74 Georgia Nutrition Conference for the Feed Industry.
Athens: University of Georgia.
Moe P.W. (1981). Energy metabolism of dairy cattle. J. Dairy Sci., 64: 1120-1139.
Morse, D. H., H. Head, c. J. wilcox, H. H. Van Horn, C. D. Hissem, and B. Harris, Jr.
1992. Effects of concentration of dietary phophorous on amount and rout of
excretion. J. Dairy Sci. 75:3039-3049.
National Dairy Herd Information Association (DHI). 2005. DHI Cow herds by Breed and
Category of testing plant.
Nennich, T. D., Harrison, J. H., VanWieringen, L. M., Meyer, D., Heinrichs, A. J., Weiss,
W. P., Block, E. (2005). Prediction of Manure and Nutrient Excretion from Dairy
Cattle. J. Dairy Sci., 88:3721-3733.
Nienaber, J.A., DeShazer, J.A., Zin, H., Hillman, P., Yen, J.T., and Ferrell, C.F. 2009.
Chapter 4: Measuring energetics of biological processes. Pages 73-112 in Livestock
Energetics and Thermal Environmental Management. St. Joseph, MI.
National Research Council (NRC). 2001. Nutrient Requirements of Dairy Cattle. 7th rev.
ed. Natl. Acad. Sci., Washington, DC.

29
Odongo N.E., Bagg R., Vessie G., Dick P., Or-Rashid M.M., Hook S.E., Gray J.T.,
McBride B.W. 2007. Long-term effects of feeding monensin on methane production
in lactating dairy cows. J. Dairy Sci., 90: 1781-1788.
Predenville, R., Pierce, K. M., and Buckley, F. 2009. An evaluation of production
efficiencies among lactating Holstein-Friesian, Jersey, and Jersey×Holstein-Friesian
cows at pasture. J. Dairy Sci, 92:6176-6185.
Pryce, J.E., Royal, M.D., Garnsworthy, P.C., and Mao, I.L. Fertility in the high-
producing dairy cow. Livest. Prod. Sci. 2004; 86: 125–135.
Reynolds, C.K., and H.F. Tyrrell. 2000. Energy metabolism in lactating beef heifers. J.
Anim. Sci. 78:2696–2705.
Reynolds, C.K., Humphries, D.J., Kirton, P., Kindermann, M., Duval, S., and Steinberg,
W.. 2014. Effects of 3-nitrooxypropanol on methane emission, digestion, and energy
and nitrogen balance of lactating dairy cows. J. Dairy Sci. 97:1–13.
Russell, J.B. and Houlihan, A.J. The ionophore resistance ruminal bacteria and its
potential impact on human health. FEMS Microbiol. Rev. 2003; 27: 65–74.
Saama, P.M., I.L. Mao, and J.B. Holter. 1993. Sources of variation in partitioning of
intake energy for lactating Holstein cows. J. Dairy Sci. 76:1334–1341.
Sarah E. Hook, André-Denis G. Wright, and Brian W. McBride. 2010. Methanogens:
Methane Producers of the Rumen and Mitigation Strategies. Archaea, vol. 2010,
Article ID 945785, 11 pages.
Wu, Z., Satter, L. D. 2000. Milk production and reproductive performance of dairy cows
fed two concentrations of phosphorus for two years. J. Dairy Sci. , 83:1052-63.
Shalloo, L. 2007. Increasing milk value. Taking costly water out of milk. Proc. Ir. Grassl.
Assoc. Dairy Conf., Co., 83-96.
Smith D.L., Smith T., Rude B.J., Ward S.H. 2013. Short communication: Comparison of
the effects of heat stress on milk and component yields and somatic cell score in
Holstein and Jersey cows. J. Dairy Sci. 96 (5): 3028-3033.
St-Pierre, N. R., and C. S. Thraen. 1999. Animal grouping strategies sources of variation,
and economic factors affecting nutrient balance on dairy farms. J. Dairy Sci. 82:72-
83.
Stewart, C. S., and Bryant, M. P. 1988. The rumen bacteria. In The Rumen Microbial
Ecosystem’. (Ed. P. N. Hobson.) pp. 2176.

30
Tine, M.A., Mcleod, K.R., Erdman, R.A., and. Baldwin, R.L. 2001. Effects of brown
midrib corn silage on the energy balance of dairy cattle. J. Dairy Sci. 84:885–895.
Tomlinson, A.P., Powers, W.J., Van Horn, H.H., Nordstedt, R.A., and Wilcox, C.J. 1996.
Dietary protein effects on nitrogen excretion and manure characteristics of lactating
cows. Trans. ASAE; 39: 1441–1448
Tyrrell, H.F.,andJ.T.Reid.1965.Prediction of the energy value of cow’s milk. J. Dairy
Sci.,48:1215– 1223.
Tyrrell, H.F.,C.K.Reynolds,andH.D.Baxter.1991.Utilizationof dietary energy by Jersey
compared to Holstein cows during the lactation cycle. Proc.12th Symp. Energy
Metab. On Farm Anim.EAAP Publ.58.
Tyrell, H.F., and P.W. Moe. 1972. Net energy value for lactation of high- and low-protein
diets containing corn silage. J. Dairy Sci. 55:318–324.
Reynolds, C.K., and H.F. Tyrrell. 2000. Energy metabolism in lactating beef heifers. J.
Anim. Sci. 78:2696–2705.
USDA. 2007. Part I: Reference of Dairy Cattle Health and Management Practices in the
United. Service. On line:
http://www.aphis.usda.gov/animal_health/nahms/dairy/downloads/dairy07/Dairy07_
dr_PartI.pdf. Accessed on August 2, 2015.
USDA. 2015. Cheese production measured in lb. National Agricultural Statistics Service.
On line: http://www.nass.usda.gov/Statistics_by_Subject. Accessed on August 2,
2015.
Holstein Association (USH). 2009. The Holstein breed characteristics.
http://www.holsteinusa.com/holstein_breed/breedhistory.html. On line: Accessed on
July 2, 2015.
Van Der Werf J.H., Jonker L.J., Oldenbroek J.K. (1998). Effect of Monensin on Milk
Production by Holstein and Jersey Cows. J. Dairy Sci. 81 (2): 427-433.
Wilkerson, V. A., Glenn, B.P., and McLeod, K.R. 1997. Energy and nitrogen balance in
lactating cows fed diets containing dry or high moisture corn in either rolled or
ground form. J. Dairy Sci. 80:2487–2496.
Xue, B., Yan, T., Ferris, C.F., and. Mayne, C.S. 2011. Milk production and energy
efficiency of Holstein and Jersey-Holstein crossbred dairy cows offered diets
containing grass silage. J. Dairy Sci. 94:1455–1464.
Yan, T., Gordon, F.J., Agnew, R.E., Porter, M.G., and Patterson, D.C.. 1997. The
metabolisable energy requirement for maintenance and the efficiency of utilization

31
of metabolisable energy for lactation by dairy cows offered grass silage-based diets.
Livest. Prod. Sci. 51:141-150.
Yan T., Mayne C.S., Keady T.W.J., Agnew R.E. 2006. Effects of dairy cow genotype
with two planes of nutrition on energy partitioning between milk and body tissue. J.
Dairy Sci., 89: 1031-1042.
Van Horn, H. H., Wilkie, A. C., Powers, W. J., & Nordstedt, R. A. (1994). Components
of dairy manure management systems. J. Dairy Sci., 77:2008-2030.
Weiss, W. P., Wyatt, D. J. 2004. Macromineral Digestion by Lactating Dairy cows:
Estimating Phosphorus Excretion via Manure. J. Dairy Sci., 87:2158-66.
Weiss W.P., Socha M.T. 2005. Dietary manganese for dry and lactating Holstein cows. J.
Dairy Sci., 88: 2517-2523.
Wilkerson, V.A., Mertens, D.R., and Casper, D.P. 1997. Prediction of excretion of
manure and nitrogen by Holstein dairy cattle. J. Dairy Sci; 80: 3193–3204

32
Table 1.1. List of studies of gross feed efficiency in lactating dairy cows
Author Units1 Value Diet Breed
Birkelo et al. (2004) Milk yield (kg)/DMI (kg) 1.39 Control Holstein and Jersey
Birkelo et al. (2004) Milk yield (kg)/DMI (kg) 1.56 WCDGS Holstein and Jersey
Heinz et al. (2008) ECM (KG)/ DMI (KG) 1.43 TMR Jersey × Holstein
Heinz et al. (2008) ECM (KG)/ DMI (KG) 1.43 TMR Holstein
Anderson et al. (2007) ECM (KG)/DMI (KG) 1.61 TMR Holstein
Anderson et al. (2007) ECM (KG)/DMI (KG) 1.65 TMR Jersey and Jersey × Holstein
Aikman et al. 2008 ECM (KG)/DMI (KG) 2.02 TMR Holstein
Aikman et al. 2008 ECM (KG)/DMI (KG) 2.10 TMR Jersey
Anderson et al. (2007) FCM (KG)/DMI (KG) 1.53 TMR Holstein
Anderson et al. (2007) FCM (KG)/DMI (KG) 1.58 TMR Jersey and Jersey × Holstein
Anderson et al. (2007) SCM (KG)/DMI (KG) 1.48 TMR Holstein
Anderson et al. (2007) SCM (KG)/DMI (KG) 1.53 TMR Jersey and Jersey × Holstein
Heinz et al. (2008) Fat and Protein (g)/DMI (kg) 94.00 TMR Jersey × Holstein
Heinz et al. (2008) Fat and Protein (g)/DMI (kg) 93.00 TMR Holstein
Anderson et al. (2007) Cheese yield (kg)/DMI (kg) 0.16 TMR Holstein
Anderson et al. (2007) Cheese yield (kg)/DMI (kg) 0.16 TMR Jersey and Jersey × Holstein 1 ECM = Energy corrected milk, FCM = Fat corrected milk, SCM = Solids corrected milk
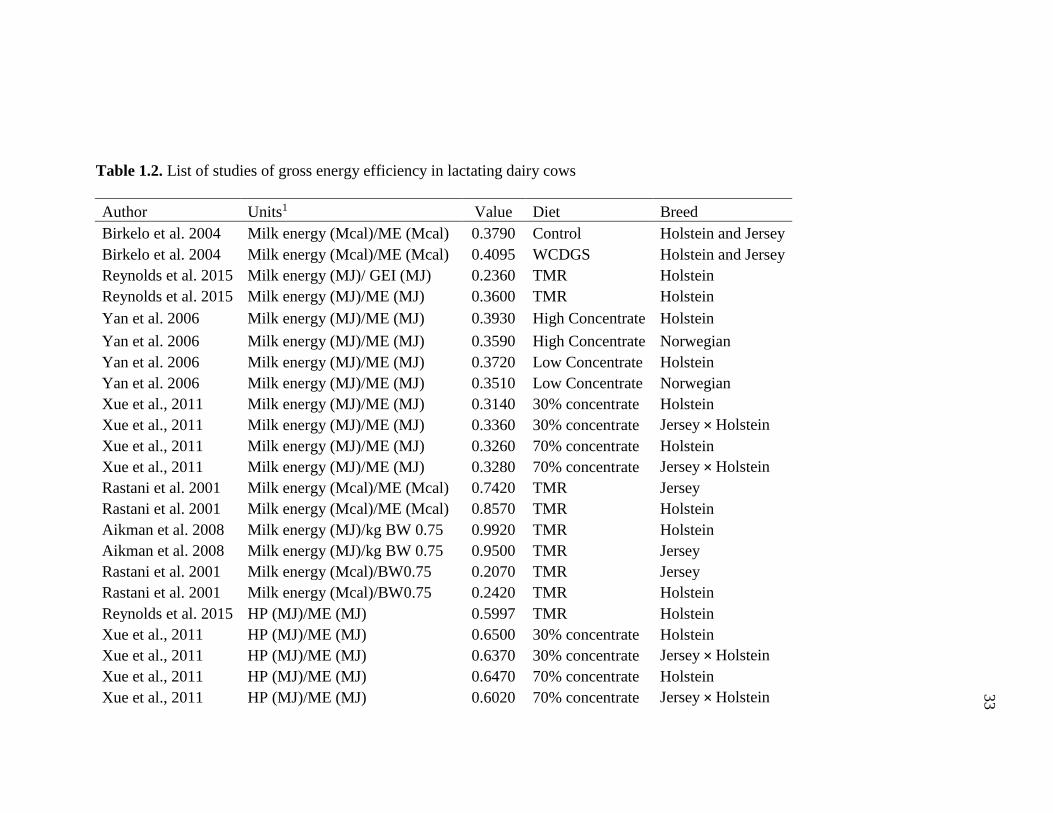
33
Table 1.2. List of studies of gross energy efficiency in lactating dairy cows
Author Units1 Value Diet Breed
Birkelo et al. 2004 Milk energy (Mcal)/ME (Mcal) 0.3790 Control Holstein and Jersey
Birkelo et al. 2004 Milk energy (Mcal)/ME (Mcal) 0.4095 WCDGS Holstein and Jersey
Reynolds et al. 2015 Milk energy (MJ)/ GEI (MJ) 0.2360 TMR Holstein
Reynolds et al. 2015 Milk energy (MJ)/ME (MJ) 0.3600 TMR Holstein
Yan et al. 2006 Milk energy (MJ)/ME (MJ) 0.3930 High Concentrate Holstein
Yan et al. 2006 Milk energy (MJ)/ME (MJ) 0.3590 High Concentrate Norwegian
Yan et al. 2006 Milk energy (MJ)/ME (MJ) 0.3720 Low Concentrate Holstein
Yan et al. 2006 Milk energy (MJ)/ME (MJ) 0.3510 Low Concentrate Norwegian
Xue et al., 2011 Milk energy (MJ)/ME (MJ) 0.3140 30% concentrate Holstein
Xue et al., 2011 Milk energy (MJ)/ME (MJ) 0.3360 30% concentrate Jersey × Holstein
Xue et al., 2011 Milk energy (MJ)/ME (MJ) 0.3260 70% concentrate Holstein
Xue et al., 2011 Milk energy (MJ)/ME (MJ) 0.3280 70% concentrate Jersey × Holstein
Rastani et al. 2001 Milk energy (Mcal)/ME (Mcal) 0.7420 TMR Jersey
Rastani et al. 2001 Milk energy (Mcal)/ME (Mcal) 0.8570 TMR Holstein
Aikman et al. 2008 Milk energy (MJ)/kg BW 0.75 0.9920 TMR Holstein
Aikman et al. 2008 Milk energy (MJ)/kg BW 0.75 0.9500 TMR Jersey
Rastani et al. 2001 Milk energy (Mcal)/BW0.75 0.2070 TMR Jersey
Rastani et al. 2001 Milk energy (Mcal)/BW0.75 0.2420 TMR Holstein
Reynolds et al. 2015 HP (MJ)/ME (MJ) 0.5997 TMR Holstein
Xue et al., 2011 HP (MJ)/ME (MJ) 0.6500 30% concentrate Holstein
Xue et al., 2011 HP (MJ)/ME (MJ) 0.6370 30% concentrate Jersey × Holstein
Xue et al., 2011 HP (MJ)/ME (MJ) 0.6470 70% concentrate Holstein
Xue et al., 2011 HP (MJ)/ME (MJ) 0.6020 70% concentrate Jersey × Holstein

34
Reynolds et al. 2015 ME(MJ)/GE(MJ) 0.6591 TMR Holstein
Xue et al., 2011 ME(MJ)/GE(MJ) 0.6670 30% concentrate Holstein
Xue et al., 2011 ME(MJ)/GE(MJ) 0.6700 30% concentrate Jersey × Holstein
Xue et al., 2011 ME(MJ)/GE(MJ) 0.6810 70% concentrate Holstein
Xue et al., 2011 ME(MJ)/GE(MJ) 0.6800 70% concentrate Jersey × Holstein
Rastani et al. 2001 ME (Mcal)/ BW0.75 0.2800 TMR Jersey
Rastani et al. 2001 ME (Mcal)/ BW0.75 0.2820 TMR Holstein
Reynolds et al. 2015 Energy balance (MJ)/ME (MJ) 0.0392 TMR Holstein
Xue et al., 2011 energy balance (MJ)/ME (MJ) 0.0370 30% concentrate Holstein
Xue et al., 2011 energy balance (MJ)/ME (MJ) 0.0270 30% concentrate Jersey × Holstein
Xue et al., 2011 energy balance (MJ)/ME (MJ) 0.0270 70% concentrate Holstein
Xue et al., 2011 energy balance (MJ)/ME (MJ) 0.0700 70% concentrate Jersey × Holstein
Yan et al. 2006 Energy balance (MJ)/ME (MJ) 0.0400 High Concentrate Holstein
Yan et al. 2006 Energy balance (MJ)/ME (MJ) 0.0510 High Concentrate Norwegian
Yan et al. 2006 Energy balance (MJ)/ME (MJ) -0.0080 Low Concentrate Holstein
Yan et al. 2006 Energy balance (MJ)/ME (MJ) 0.0010 Low Concentrate Norwegian
Aikman et al. 2008 Energy balance/ kg BW 0.75 -0.2230 TMR Holstein
Aikman et al. 2008 Energy balance/ kg BW 0.75 -0.2720 TMR Jersey
Rastani et al. 2001 Energy Balance (Mcal)/BW0.75 -0.0120 TMR Jersey
Rastani et al. 2001 Energy Balance (Mcal)/BW0.75 -0.0400 TMR Holstein
1 HP = Heat production, ME = metabolizable energy.

35
Figure 1.1. The effect of breed on the relative proportion of energy used for maintenance
vs. lactation and efficiency to produce cheese (Capper and Caddy, 2012).
116137
54
76
0
50
100
150
200
250
Jersey Holstein
En
ergy M
J/d
Maintenance
Lactation
2.6 kg cheese
65 MJ/kg cheese
2.6 kg cheese
65 MJ/kg cheese
20.9 kg milk, 4.8% fat,
3.7% protein
29.1 kg milk, 3.8% fat,
3.1% protein
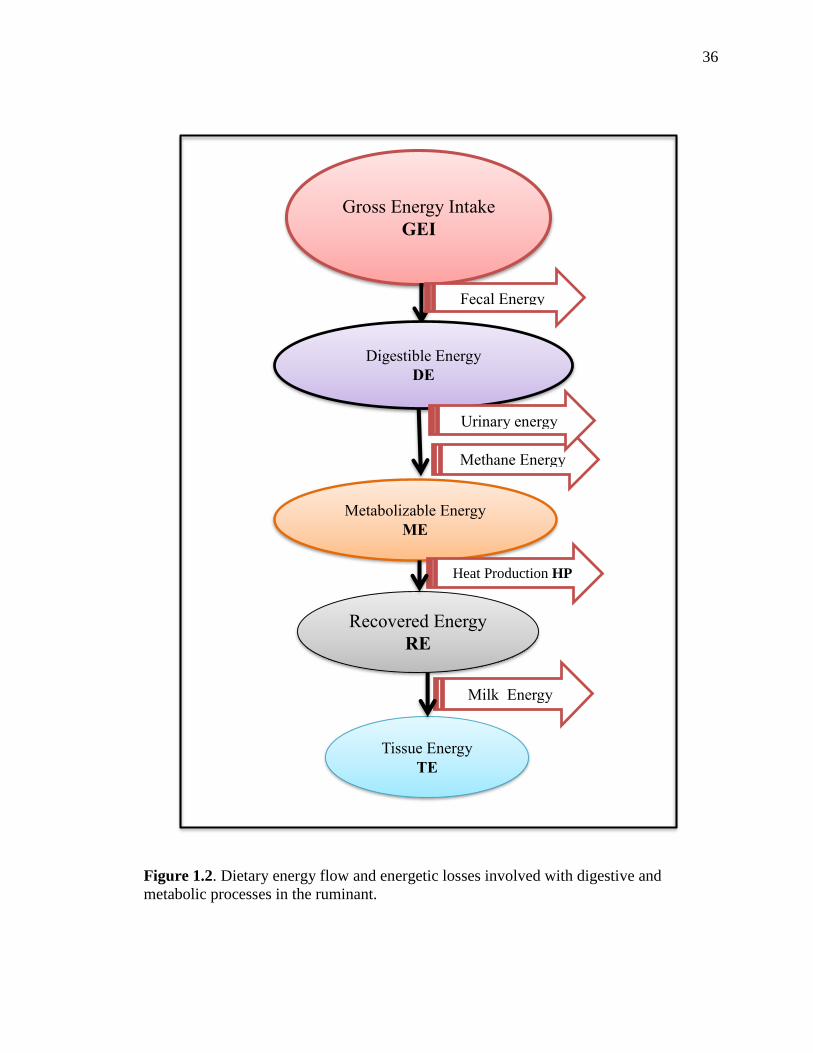
36
Figure 1.2. Dietary energy flow and energetic losses involved with digestive and
metabolic processes in the ruminant.
Gross Energy Intake
GEI
Fecal Energy
Digestible Energy
DE
Metabolizable Energy
ME
Heat Production HP
Methane Energy
Urinary energy
Recovered Energy
RE
Tissue Energy
TE
Milk Energy

37
Figure 1.3. Photo of head-boxes collecting gas at University of Lincoln Nebraska.

38
Figure 1.4. Relationship between DMI and trial-adjusted manure excretion for lactating
cows. Manure excretion (kg/d) = DMI (kg/d) × 2.63 + 9.4 (Nennich et al., 2005).
Figure 1.5. The relationship between excretion of P via manure and intake of P. The
phosphorus manure excretion (g/d) = −2.5 + 0.64 × P intake (g/d) (Weiss and Wyatt,
2004).

39
APPENDIX I: EQUATIONS
DE = GEI – fecal energy [1]
ME = DE – urinary energy – methane energy [2]
NEL = ME – heat production [3]
HP = 3.866 * O2 + 1.200 * CO2 – 0.518 * CH4 – 1.431 * N [4]
C6H12O6 + 6 O2 6 CO2 + 6 H2O + heat [5]
ME = RE + HE [6]
NEL (Mcal/kg) = 0.0929 × Fat % + 0.0547 × Crude Protein %
+ 0.0395 × Lactose % [7]
NEL (Mcal/kg) = 0.0929 × Fat % + 0.0547 × Crude Protein % + 0.192 [8]
NEL (Mcal/kg) = 0.0929 × Fat % + 0.360 [9]
DMe (kg) = (DMI × 0.356) +0.80 [10]
DMe (kg) = [milk × 0.112] + [BW × 0.0062] + [MTP × 106.0] -2.2 [11]
NE (g) = [Milk (kg) × 2.82] + 346 [12]
NE (g) = [DMI (kg) × Dietary CP (g/g of DM) × 84.1] + [BW (kg) × 0.196] [13]
Manure P (g) = -2.5 + 0.64 × P intake (g/d) [14]
Manure P (g) = P intake (g/d) – (Milk yield (kg) * 0.9 (g/kg) [15]
P excretion = [DMI × Dietary P (g/g of DM) × 560.7] + 21.1 [16]
K excretion (g) = milk yield (kg) × 1.476 + 154.1 [17]
K excretion (g) = [DMI × 7.21] + [Dietary K (g/g of DM) × 15944] -164.5 [18]

40
CHAPTER 2
Energy Utilization in Holstein and Jersey Dairy Cows Consuming Corn Milling Co-
Products
G. Garcia*, A. J. Foth*, T. Brown-Brandl†, H.C. Freetly†, P.S. Miller*, and P.J.
Kononoff*1
*Department of Animal Science, University of Nebraska-Lincoln, Lincoln, 68583.
†USDA, ARS, US Meat Animal Research Center, Clay Center, NE 68933.
1Corresponding Author: Paul J. Kononoff, Department of Animal Science C220, Fair
Street, Lincoln, NE, 68583, Phone number: 402-472 6442, Fax number: 402-472-6362,
E-mail: [email protected]

41
ABSTRACT
Eight Holstein and 8 Jersey dairy cows (multiparous) were used to complete energy
balance trials designed to determine the effect of breed on the production and energy
efficiency of milk, and energy partitioning. Two dietary treatments were applied in a
repeated switchback design to examine the effect of genotype. Diets consisted of 24.5%
corn silage, 18.4% alfalfa hay, 6.9% grass hay, with either 22.9% rolled corn and 14.8%
soybean meal or 8.95% rolled corn and 28.8% reduced fat distillers grains (RFDDGS)
DM-basis. Diets were offered ad libitum for a 28 d adaptation period and 95% ad libitum
for a 4 d collection period. During the collection days, nutrient digestibility and energy
use was measured; indirect calorimeter respiration head boxes were used to determine
heat production.
Across diets, Holstein had a lesser (P < 0.01) DMI as a percentage of BW than Jersey
cows (3.54 vs.4.22 ± 0.13 DMI % BW, respectively). Milk protein (3.76 vs. 3.21 ±
0.11% for Jersey and Holstein, respectively; P < 0.01), and fat (4.97 and 3.70 ± 0.11%
for Jersey and Holstein, respectively; P < 0.01) content increased with Jersey compared
with Holstein cows. Nevertheless, yield of ECM per unit of DMI consumed was similar
between breeds averaging 1.58 ± 0.05 kg ECM/ kg of DMI (P = 0.50). Similarly, breed
had no effect in the milk energy per kg of DMI and as a proportion of BW0.75 averaging
1.07 ± 0.04 Mcal/ kg of DMI and 0.20 ± 0.01Mcal/ kg BW0.75 (P = 0.47). However,
Jersey had a greater fecal energy output per kg of DMI, per kg BW0.75, and as a
percentage of GEI (P = 0.04). Consequently, ME as a proportion of GEI in Holstein was
greater than that of Jersey cows (69.1 vs. 55.4 ± 0.65 %, respectively; P = 0.01).
Nevertheless, breed had no effect in milk energy as a percentage of GEI and ME,

42
averaging 26.7 ± 1.09 % of GEI and 46.7 % of ME. Results from the current study
suggest that Jerseys and Holstein do not differ in terms of energetic efficiency for milk
production.
Key words: energy efficiency, Holstein, Jersey, reduced fat dried distillers grains and
solubles.

43
INTRODUCTION
The efficiency of conversion from feed to milk is the major determinant of farm
productivity (Prendeville, 2010). This is because approximately 80 % of the variable cost
is associated with feeding (Shalloo, 2007). The dairy production efficiency determines
the relative ability of cow to convert feed nutrients into milk and components (fat and
protein). The most basic definition of dairy production efficiency is defined as milk yield
per kg of DMI (Brody, 1945). Production efficiency of dairy can also be expressed in
terms of energetic efficiency as milk energy output divided by the total feed energy
intake. Comparing the energetic efficiency may be used as a method for comparing
animals for genetic selection (Veerkam and Emmans, 1995). During early lactation, cow
milk yield is high and feed intake is low which results in high productive and energetic
efficiency. This is the result of cows mobilizing fat (loss of BW) rather than an improved
capacity of animals to transform feed into milk. Similarly, in late lactating cow’s milk
yield is low and feed intake is high which results in low productive efficiency and gain of
BW. In addition, the efficiency of converting metabolizable energy intake (ME) into milk
energy (milk energy/ME) may also be used to measure dairy efficiency. According to
Grainger and Goddard (2007), dairy efficiency is improved when: intake per kg of BW
increases, energy losses in feces, urine, methane, and heat production (HP) decrease, and
greater proportion of ME is converted into milk.
The Jersey and Jersey × Holstein genotype are increasing in popularity in the
United States (CDCB, 2015) as means to improve milk composition, reproductive
performance and longevity (Xue et al., 2011). Jersey cattle have a greater intake capacity
per kg of BW (Prendiville et al., 2009) and greater yield of milk solids per Kg of DMI

44
(Tyrrell et al., 1991; West et al. 1990). Milk components (fat and protein) are the major
factors that determine cheese yield; as a result more processors are shifting towards a
cheese yield pricing (Anderson et al., 2007). Capper and Caddy estimated that Jersey
utilizes less ME to produce 1 kg of cheese than Holstein cows (65 MJ vs 72 MJ/ kg of
cheese, respectively). In addition, Brody (1945) observed that Jersey had a lesser HP per
kg of BW0.73 than Holstein cattle (70 vs. 84 cal/BW0.73, respectively), implying that
Jersey cows may have more energy available for milk production per kg of BW 0.73 than
Holstein cows. Xue et al. (2011) observed that Holstein loss a greater proportion of ME
as HP compared with Jersey × Holstein (65 vs. 62 % of ME, respectively). Nevertheless,
in the latter study, efficiency of converting ME to milk was not affected by breed and
averaged 32 %. The study of Rastani et al. (2001) observed that Holstein produced
greater milk energy per kg of metabolic weight (BW0.75 ) than Jersey cattle (0.24 vs. 0.21
Mcal/kg BW0.75, respectively). Literature on energetic efficiency of breeds presents
conflicting observations; therefore the objective of this study is to determine the effect of
breed on dairy production efficiency measured as the following ratios: milk yield (kg) /
DMI (kg), milk energy (Mcal) / gross energy intake (GEI) (Mcal), milk energy (Mcal) /
ME (Mcal), milk energy (Mcal) /kg BW0.75. Additionally, energetic losses (HP, methane,
feces, and urine) as a proportion GEI, ME, BW0.75, and DMI are evaluated as indirect
indicators of energetic efficiency.
MATERIALS AND METHODS
Sixteen multiparous (Holstein = 8, Jersey = 8) cows averaging 93 ± 20 DIM at the
beginning of the experiment with average BW of 694 and 429 ± 13.0 kg, respectively.

45
The experimental design and methodology was similar to that of Birkelo et al. (2004)
namely 2 treatment 4 period repeated switchback (Cochran and Cox, 1959) within a split-
plot design. Cows were randomly assigned 1 of the 2 dietary treatments (Control or Co-
P) which alternated over 4 periods; thus, measurements were collected on each animal
consuming each treatment during 2 nonconsecutive experimental periods. Animals were
blocked by date of calving and the subplot of this study was breed which was duplicated.
The objective of the current study is to examine and report breed effects on feed
efficiency, energy partitioning, and energy efficiency for lactation. Two diets were
formulated which differed in the proportion of reduced fat distillers grains (RFDDG)
(Poet Nutrition, Sioux Falls, SD) included in the formulation. A sample of the RFDDGS
is illustrated in Figure 2.1. Diets included the Control which did not contain any
RFDDG, and diet in which the RFDDG was included (Co-P diet) at 30 % of the diet DM
while partially replacing the corn and soybean meal in a similar fashion as Birkelo et al.
(2004). Specifically, the proportion of forage was held constant between treatments, but
they differed in concentrate formulation. In the Co-product diet, RFDDGS replaced all
the soybean meal and approximately half of the ground corn of the Control diet. Diets
were balanced to contain similar concentrations of CP and a high protein soybean meal
was utilized in the Control diet to accomplish this. The study was conducted over 16
month and forages varied only by year to reduce variability. Complete diet compositions
and nutrient analysis are presented in Table 2.1. Each experimental period was 35 d in
duration with 28 d for ad libitum diet adaptation, followed by 7 d of collection and 95 %
ad libitum feeding to minimize refusals, as illustrated in Figure 2.2. During the 28 d diet
adaptation, cows were fed for ad libitum consumption to allow for approximately 5 %
46
refusals. All cows were less than 90 d pregnant at the conclusion of the final
experimental period, so the effect of fetal on energy metabolism can be assumed to be
minimal (Bell et al. 1995). Cows were housed in a temperature-controlled barn at the
Dairy Metabolism Facility in the Animal Science Complex of University of Nebraska-
Lincoln (Lincoln, NE) in individual tie stalls equipped with rubber mats and milked at
0700 and 1800 h. All animal care and experimental procedures were approved by the
University of Nebraska-Lincoln Animal Care and Use Committee. Control and Co-
product diets contained corn silage, alfalfa hay, grass hay and concentrate mixed as a
total mixed ration (TMR) which was mixed in a Calan Data Ranger (American Calan,
Inc., Northwood, NH). Cows were fed once daily at 0900 h.
Individual feed ingredients were sampled (500 g) each day during the collection
period and frozen at -20°C. They were later composited by period and a subsample sent
to Cumberland Valley Analytical Services Inc. (Hagerstown, MD) for complete nutrient
analysis of DM (AOAC, 2000), N (Leco FP-528 N Combustion Analyzer; Leco Corp.,
St. Joseph, MI), NDF (Van Soest et al. 1991), ADF (method 973.18; AOAC 2000), sugar
(DuBois et al., 1956), ether extract (2003.05; 2006), ash (942.05; AOAC 2000), and
minerals (985.01; AOAC 2000). Total mixed rations were sampled on each day of
collection and used to determine particle size according to Kononoff et al. (2003) using
the Penn State Particle Separator. Total fecal and urine outputs were collected from each
individual cow during the collection period for 2 consecutive days (Figure 2.3). Feces
were collected using aluminum pans placed into the gutter behind the stall and urine was
collected using a noninvasive urine cup collector (Lascano et al., 2010) and accumulated
into a Surge bucket milker (Hinsdale, IL). Urine was deposited 4 times a day into 55-L

47
plastic containers and acidified with 50 mL of concentrated HCl, before subsampling and
freezing (20 °C). Subsamples of milk (100 mL), feces (4 % wet basis), urine (2 % wet
basis) and gas (10 to 15 L) were collected. Samples were later thawed and composited
for each cow during each period. Likewise, fecal samples were deposited into large
containers (Rubbermaid, Wooster, OH), subsampled, and frozen (-20 °C). Samples of
feces, orts and each feed ingredient were composited according to cow and period, dried
at 55 °C in a forced air oven and ground to pass through a 1-mm screen (Wiley mill,
Arthur H. Thomas Co., Philadelphia, PA). Ground samples were analyzed for DM
(100°C oven for 24 h). Milk production was measured daily and milk samples (40 mL)
were collected during the AM and PM milkings for the 2 d of collection for each animal
and preserved using 2-bromo-2-nitropropane-1,3 diol. Milk samples were analyzed for
fat, true protein, lactose, SCC and MUN (AOAC, 2000) using a B2000 Infrared Analyzer
(Bentley Instruments, Chaska, MN) by Heart of America DHIA (Manhattan, KS).
Feed samples, orts and fecal samples were analyzed at the University of
Nebraska-Lincoln for N (Leco FP-528, Leco Corp., St. Joseph, MI), NDF (Van Soest et
al., 1991), starch (Megazyme, AOAC method 996.11 and AACC method 76.13), and ash
(AOAC, 2000). Heat stable α-amylase (number A3306; Sigma Chemical Co., St. Louis,
MO) was included in the NDF procedure (0.5 mL per sample). Samples were analyzed
for ether extract (AOAC, 2000) by Cumberland Valley Analytical Services Inc.
(Hagerstown, MD). Urine and milk samples were analyzed for N as previously
described. All samples including feed, orts, feces, urine and milk were analyzed for gross
energy (Parr 1241 Adiabatic Calorimeter, Moline, IL). Prior to analysis, milk and urine
samples were lyophilized (VirTis Freezemobile 25ES, SP Scientific, Gardiner, NY).

48
Heat production (HP) was determined through the use of headbox type indirect
calorimeters (Foth, 2014) which were constructed at the University of Nebraska-Lincoln,
and based on indirect calorimetry (Figure 2.4). Prior to collections, headboxes were used
to test the rate of recovery of gas by burning 100% ethyl alcohol in the sealed headbox
and comparing this measure to calculated gas concentrations. These calculations were
based on weight of alcohol burned and a measured volume of gas sample. Three lamp
runs were conducted. Recovery rates of O2 and CO2 averaged 101.8 ± 3.21 and 100.8 ±
3.51 %, respectively.
Collection for each cow consisted of 2 consecutive 23-h intervals where gas
concentrations were averaged for each period. Feed was placed in the headbox and ad
libitum access to water was available from a water bowl inside the box. Doors were
closed and the motor turned on 15 min prior to the start of collecting to allow for air
equilibrium. Temperature and dew point within the box were recorded every min using a
probe (Model TRH-100, Pace Scientific Inc., Moorseville, NC, USA) connected to a data
logger (Model XR440, Pace Scientific Inc., Mooresville, NC, USA). Total volume of
gas was measured using a gas meter (Model AL425, American Meter, Horsham, PA,
USA) and continuous proportional samples of outgoing and incoming air were diverted to
collection bags (61 × 61 cm LAM-JAPCON-NSE; 44L) using glass tube rotameters
(Model 1350E Sho-Rate “50”, Brooks Instruments, Hatfield, PA). Gas samples were
analyzed (Emerson X-stream 3channel analyzer, Solon, OH) according to Nienaber and
Maddy (1985). Heat production was estimated by calculation from O2 consumption, and
CO2 and CH4 production with correction for urinary N loss according to Brouwer (1965)
with gases values reported in L and mass of urinary N reported in g (Equation 1).

49
Volume of CH4 formed was multiplied by a constant (9.45 kcal/L) to estimate the amount
of energy represented in the formation of gaseous products.
Digestible energy (DE) is the difference between GEI and the fecal energy
(Equation 1). Metabolizable energy (ME) is the energy that is available for maintenance,
growth, and production requirements of the animal and is the DE minus the urine energy
and CH4 energy (Equation 2). Heat production (HP) was adjusted for excess N intake
according to Moe et al. (1970) (Equation 3). Retained energy (RE) is the energy available
after HP is subtracted from the ME (Equation 4). Tissue energy (TE) is equal to the RE
minus the energy content of milk (Equation 5).
DE (Mcal) = GEI (Mcal) – fecal energy (Mcal) [1]
ME (Mcal) = DE (Mcal) – urinary energy (Mcal) – methane energy (Mcal) [2]
HP (Mcal)= 3.866 × O2 (l) + 1.200 × CO2 (l) – 0.518 × CH4 (l) – 1.431 × N (g) [3]
RE (Mcal) = ME (Mcal) – HP (Mcal) [4]
TE (Mcal) = RE (Mcal) – milk energy (Mcal) [5]
Statistical Analysis
Data were analyzed using the GLIMMIX procedure of SAS (SAS Institute Inc.,
Cary, NC). Treatment, breed, breed within block, and period within block and breed were
modeled as fixed effects, and cow within block, based on calving date, was modeled as a
random effect. The LSMEANS option was used to generate least squares means of
treatments listed in this study. Significance was declared at P ≤ 0.05.

50
RESULTS AND DISCUSSION
Twenty eight energy balances were completed for each breed. Gas meter
calibration was not completed in time and diet composition was altered after the first
collection period of the first block, so the data from those 4 Holstein cows were not used
for that period. One Jersey cow in block 4 died from a non-related source (intestinal
intussusception) after the first collection period of that block. During the third collection
of block 2, a Jersey cow became ill and was removed from collections for that period.
For a period in block 3 (Holstein), collection was reduced to a single day instead of 2
consecutive days to avoid switching corn silage sources during collections.
Diet Composition
The composition and chemical analysis of diets are presented in Table 2.1 and
2.2, respectively. Diets were formulated to have similar concentrations of CP which
averaged 18.8 ± 0.23 % CP (DM basis). Ether extract was 2.6 and 3.6 ± 0.1 % for the
Control and Co-product diet, respectively. Greater content was expected in Co-product
diet compared to Control because RFDDGS have more fat content than corn and soybean
meal. The NDF content of control and Co-product diet was 30.8 and 37.1 ± 0.24%
respectively (DM basis). NDF content was expected to be greater in Co-product diet
compared to the Control diet because of the greater NDF content of distillers grains
compared to corn. Ash content was 8.21 and 8.41 ± 0.16% for Control and Co-product
diet, respectively. Starch content was greater for Control compared to Co-product diet
(26.7 ± 1.0 % vs. 18.9 ± 0.78 %, respectively). Non-fiber carbohydrate (NFC) content
was greater for control compared to Co-product diet (42.3 vs. 35.5 ± 1.5 %, respectively).

51
There is a lesser content of starch and NFC in the Co-product diet since most of the
starch in RFDDGS is removed for the production of ethanol.
Diet particle size was similar between treatments with 2.85, 20.7, 45.3, and 31.1
% remaining on the > 19.0 mm, 19.0 – 8.0 mm, 8.0 – 1.18 mm, and < 1.18 mm pans,
respectively, for the control TMR and 2.87, 19.9, 41.4, and 36.1 % for the RFDDGS
TMR (Table 2.2). Kononoff et al. (2003) recommended that rations should include 30 to
50 % of particles between 8.0 and 19.0 mm and 10 to 20 % particles between 1.18 and
8.0 mm in diameter to maximize milk production and to avoid milk fat depression. The
proportion of particles in diets between 8.0 and 19.0 mm in the current study is lesser
than recommended, and the proportion of particles between 1.18 and 8.0 mm in diameter
is greater.
Body Weight, Intake, Milk Production and Composition
In the current study BW averaged 694 and 429 ± 13 kg for Holstein and Jersey,
respectively (Table 2.3). The BW of Jersey represented 62% of that of the Holstein, and
there was no difference in BCS (P = 0.06) between breeds which averaged 3.3 ± 0.08. As
expected, Holstein DMI intake was greater than Jerseys (24.5 vs. 18.1 ± 0.68 kg,
respectively; P < 0.01). Nevertheless, Jersey had a greater intake per 100 kg of BW than
Holstein cows (3.54 vs. 4.22 ± 0.13 kg / 100 kg of BW; P < 0.01). Previous studies also
observed the greater intake capacity of Jersey in relation to its BW. For example, West et
al. (1997) observed that Jersey DMI was between 0.07 and 0.68 kg / 100 kg of BW
greater than Holstein cattle. In the latter study, the authors noticed that difference in DMI
between breeds decreased with greater levels of forage in the diet. Similarly, Grainger

52
and Goddard (2007) reviewed the effect of breed on intake and reported that Jersey’s
DMI was 0.49 kg / 100 kg of BW greater than Holstein cows. Prendiville et al. (2010)
suggested that Jersey’s greater capacity may be associated to Jersey’s greater biting rate,
intake rate, and grazing time compared with Holstein. Others also reported that Jerseys
had a greater rate of passage than Holstein (Ingvarstsen and Weisber, 1993; Aikman et
al., 2008), which may explain Jersey’s greater intake capacity per kg of BW.
Additionally, the greater intake capacity of Jersey compared with Holstein cows may also
be explained by their greater rumen-reticulum mass in relation to their BW (Smith and
Baldwin, 1974; Beecher et al., 2014). The reticulorumen mass as proportion of BW of
Jersey was 22 % greater than that of Holstein (Beecher et al., 2014). These differences
between Jersey and Holstein cows are likely to contribute to the change in DMI as
proportion of BW observed in the current study. In addition, Aikman et al. (2008)
emphasized that comparisons of intake capacity must consider variations in milk energy
yield and diet components, which may affect appetite. In the study of Rastani et al.
(2001), there was no effect on breed on intake capacity when cows with similar
production levels were compared.
In this study , we observed that milk yield was lesser in Jersey compared to
Holstein cows which was expected due to the difference in BW and DMI. Milk yield of
Holstein and Jersery averaged 37.2 and 23.4 ± 2.0 kg, respectively. The milk yield
difference between breeds was 13.8 kg. However, after adjusting for energy corrected
milk (ECM), yield difference between breeds was reduced to 9.1 kg (38.2 vs. 29.1 ± 1.64
kg/d for Holstein and Jersey, respectively). In this study, the yield of milk per kg of DMI
was greater in Holstein compared with Jersey cattle (1.51 vs. 1.30 ± 0.07 kg / kg of DMI,

53
respectively; P = 0.03). However, yield of ECM kg / kg of DMI was numericall greater
in Jersey compared with Holstein cows (1.61 vs. 1.56 ± 0.05 kg / kg of DMI,
respectively; P = 0.50). Data from 1.8 million Holstein and 69 thousands Jersey
throughtout the United States showed that in average Holstein and Jersey yielded 29.1
and 20.9 kg of milk, respectively (Capper and Caddy, 2012), which signifies that
Holstein produce aproxiately 50 % more milk. Breed had no effect in gross feed
efficiency, when it was determined by Anderson et al. (2007) as: fat corrected milk
(FCM) / kg of DMI, solid corrected milk (SCM) / kg of DMI, and ECM / kg of DMI. The
result of the latter study are in agreement with our observation since no effect of breed
was observed on ECM / kg of DMI.
The milk of Jersey contained a greater concentration of fat (4.97 vs. 3.70 ±
0.19%) and protein (3.76 vs. 3.21 ± 0.11%) than that of Holstein cows (P < 0.01).
Consequently the energy concentration of milk was lesser (P < 0.01) in Holsteins
compared to Jersey (5.49 vs. 5.71 ± 0.06 Mcal/kg, respectively). The total milk fat yield
was 0.20 kg or 14% greater on Holstein compared with Jersey cows (1.36 vs. 1.16 ± 0.06
kg/d, P = 0.03). Similarly, Holstein cows produced 0.29 kg or 33% more protein than
Jersey cows (1.17 vs. 0.88 ± 0.05 kg/d, P < 0.01). In terms of feed efficiency, yield of
protein per kg of DMI was not affected by breed and averaged 48.5 ± 1.4g / kg of DMI
(P = 0.63). However, Jersey yielded 8.4 g/kg of DMI or 15 % more fat than Holstein
cows (63.9 vs. 55.5 ± 1.96 g/kg of DMI; P < 0.01). Scientific literature is consistent on
afirming that Jersey’s milk has greater content of fat and protein than Holstein cows.
Data reported by Capper and Cady (2012) estimated that fat content of Holstein and
Jersey averaged 3.8 % and 4.8 %, respectively. In the latter study, protein content

54
averaged 3.1 % and 3.7% for Holstein and Jersey, respectivley. In our study, Jersey had
aproximately 0.1 % greater content of fat and protein compared with composition
reported by Capper and Cady (2012). In addition, Holstein in our study had about 0.1 %
less fat content and 0.1% more protein content than estimates reported by Capper and
Cady (2012). However, the differences in milk content of protein and fat between our
study and Capper and Cady (2012) are not considerable. Prendiville et al (2009)
suggested that greater yields of milk solid in Jersey cattle may be a result of greater
mastication time per unit of BW of Jersey compared with Holsteins. However, other
studies that observed no difference in efficiency measurements expressed as milk solids
yield (g) / kg of DMI between Holstein and Jersey (Rastani et al., 2001; Beaulie and
Palmquist ,1995; Blake et al, 1986).
Gas Consumption and Production
Daily consumption and production of O2, CO2, and CH4 is presented in Table 2.5.
As expected, Holstein consumed more O2 and produced more CO2 and CH4 compared
with Jerseys (P < 0.01). Consequently, HP of Holstein was greater than Jersey (34.4 vs.
25.4 ± 0.74 Mcal / d, respectively; P < 0.01).
Based on unit per BW0.75, consumption of O2 did not differ and average 51.8 ± 1.4 l / kg
BW0.75 (P = 0.14). Jersey cattle produced more CO2 (57.0 vs. 53.4 ± 1.22 l / kg BW0.75,
respectively; P = 0.04) and CH4 (4.1 vs. 4.5 ± 0.14 l / kg BW0.75, respectively; P = 0.04)
than Holstein cows. However, HP did not differ based on unit per BW0.75, averaging
0.26 ± 0.01 Mcal / kg BW0.75 (P = 0.12).

55
In general, dairy production efficiency is improved when CH4 production per unit
of milk decreases (Boadi et al, 2004). Losses of energy as CH4 production are not
desirable, not only because CH4 is a greenhouse gas (Johnson and Johnson, 1995), but
also because it represents inefficiency from an energy standpoint (Johnson and Johnson,
1995; Hegarty, 1999). Therefore, we estimated the CH4 production per unit of milk yield
as an alternative measure of dairy production efficiency. We observed that CH4
production per kg of milk produced was not different between breeds and averaged 16.9
± 1.1 l/kg (P = 0.07). Similarly, breed did not differ in the CH4 production per kg of ECM
which averaged 15.7 ± 0.91 l/kg (P = 0.14), and the CH4 production per kg of DMI which
averaged 23.1 ± 0.74 l/kg of DMI (P = 0.40). Johnson et al. (1996) suggested that as
productivity increases, total emissions of CH4 go up, however emission per unit of milk
yield decreases. Results from this study suggest that there is no indication of improved
productivity between Holstein and Jersey in terms of milk yield per unit of CH4
production. The methane production most likely is affected by the interaction between
diets and rumen microbes rather than breed.
Nitrogen Balance and Digestibility
The nitrogen partitioning of Holstein and Jersey cattle is reported in Table 2.6.
No interactions between breed and diet were observed in the variables measured. As
expected, Holstein cows were observed to have a greater intake of N compared with
Jerseys (738 vs. 542 ± 21.5 g/d, respectively). Similarly, Holstein cows were observed to
have a greater N in feces (226 vs. 168 ± 7.68 g/d), urine (233 vs. 183 ± 7.21 g/d), milk
(194 vs. 158 ± 9.25 g/d), and retained (84.9 vs. 34.8 ± 11.7 g/d) compared with Jersey (P

56
= 0.01). Nevertheless, breed had no effect on fecal, urine, and milk N as percentage of N
intake (P = 0.10) averaging 30.9 ± 0.51 %, 32.7 ± 1.18 %, and 27.7 ± 1.15 %,
respectively. The N balance as percentage of N intake was greater in Holstein compared
with Jersey (11.1 vs. 6.3 ± 1.68 % N intake, respectively; P = 0.05). In the study of
Aikman et al. (2008), Jersey cows tended to have more negative energy balance as a
proportion of N intake than Holstein cows, this may be associated with the greater
demand of N for protein synthesis in the milk of Jerseys compared with Holstein cows.
Others observed no effect of breed in N apparent digestibility between Holstein and
Jersey, and Holstein and Jersey × Holstein cows ((Kauffman and St-Pierre, 2001; Xue et
al., 2001). Similar to observation in the current study, Knowlton et al. (2010) reported
that apparent N digestibility, N balance, and total N excretion as a proportion of N intake
did not differ between Holstein and Jersey. Our results agree with previous observations
and it seems that there is no effect of breed in N partitioning as a proportion of N intake.
The apparent digestibility measurements of Holstein and Jersey are reported in
table 2.7. There was no interaction between breed and diet among any digestibility
variable measured. It would be expected that Holstein had a greater digestibility of feed
nutrients since it had a lesser DMI per kg of BW than Jersey. In the current study, breed
had no effect (P = 0.17) in the apparent digestibility of DM (68.1 ± 0.46%), ash (42.5 ±
0.92%), CP (69.1 ± 0.54%), NDF (50.5 ± 0.76%), and non-fiber carbohydrates (NFC)
(95.6 ± 0.17%). In addition, Holstein had a greater digestibility of OM (71.0 vs. 69.8 ±
0.04%, respectively), EE (77.2 vs. 74.3 ± 0.67%, respectively), and starch (97.3 vs. 95.4
± 0.45%, respectively) than Jersey cattle (P = 0.04). Others observed no effect of breed
on DM, OM, N, starch, and ADF digestibility throughout lactation (Aikman et al., 2008;

57
Xue et al., 2011). However, Aikman et al. (2008) and Oldenbroek (1988) observed that
NDF digestibility of Jersey was greater than Holstein. The greater capacity of Jersey
cows to digest fiber may be associated with their greater biting rate per BW0.75
(Ingvartsen and Weisbjerg, 1993; Rodriguez et al., 1997) and with their greater
reticulorumen mass as a proportion of BW (Beecher et al., 2014) compared with
Holstein cows. However, in our study NDF digestibility was similar between breeds, this
may be due to the lesser content of grass hay in our diets which averaged 6.94% and the
high relatively NDF digestibility of other ingredients such as alfalfa hay, RFDDGS, and
soybean hulls. According to Van Soest (1994), relative large gastro intestinal tract (GIT)
as a proportion of the BW would indicate larger area available for nutrient absorption,
thus, increased digestibility would be expected on Jersey cattle. Despite Jersey having a
greater GIT as a proportion of BW (Beecher et al., 2014), Holstein had greater
digestibility of OM, EE, and starch which most likely is the result of Holstein consuming
less DMI per kg of BW.
Energy Partitioning
As expected, due to breed difference in BW and DMI, gross energy intake (GEI)
was greater in Holstein cows compared with Jersey cows (99.9 vs 72.5 ± 2.93 Mcal/d,
respectively). Similarly, digestible energy (DE) (67.9 vs 47.0 ± 1.85 Mcal/d,
respectively), metabolizable energy (ME) ( 59.0 vs 40.3 ± 1.75 Mcal/d, respectively), and
recovered energy (RE) (24.7 vs 15.1 ± 1.29 Mcal/d, respectively) were greater in
Holstein cows (P < 0.01). Both breeds ended up with negative tissue energy (TE);
58
however Jersey had a greater negative TE than Holstein cattle (-4.5 vs -1.43 ± 0.95
Mcal/d, respectively; P < 0.01).
Due to the size and feed intake difference between breeds, we expressed the
energy variables as a proportion of kg of DMI, and kg of metabolic BW (BW0.75) (Table
2.8). Additionally, energy of feces, urine, milk, methane (CH4), heat production (HP),
and tissue energy (TE) were measured as a percentage of GEI (Figure 2.5), DE, and ME,
respectively (Table 2.9).
There were interactions between diet and breed for GEI, DE, ME, HP, and urine
energy when expressed as proportion of kg of BW0.75. Table 2.10 reports the simple
effects of variables with significant interaction. In addition, figures 2.8 to 2.17 illustrate
the effects of breed and diet in the energy variables with interactions.
Energy loss in feces per kg of DMI was greater in Jersey cows compared with
Holstein cows (1.41 vs. 1.3 ± 0.03 Mcal/kg of DMI, respectively; P < 0.01). Similarly,
fecal energy loss per kg of BW 0.75 was greater in Jersey cows compared with Holstein
cows (0.27 vs. 0.25 ± 0.01 Mcal/kg BW 0.75, respectively; P < 0.01). This is most likely
the result of Jersey having greater DMI intake per unit of BW, which resulted in greater
excretion per kg of DMI and BW0.75. In addition, the energy loss in feces as a proportion
of GEI was greater in Jersey cows compared with Holstein (35.2 vs. 32.0 ± 0.65 % of
GEI, respectively; P < 0.01). The greater fecal energy output as a percentage of GEI may
be the result of Jersey’s greater rate of passage in the rumen than Holstein (Ingvarstsen
and Weisber, 1993) which may cause a faster excretion of feed fed in days previous to
collection days. There was no difference between breeds in the excretion of energy in
urine per kg of DMI (0.21 ± 0.01 Mcal/kg of DMI; P = 0.40) and in the excretion of

59
energy in urine pet kg of BW 0.75 (0.04 ± 0.001 Mcal/kg BW 0.75; P = 0.47). Similarly, the
urine energy as a percentage of GEI was not different between Jersey and Holstein (5.53
± 0.18% of GEI; P = 0.24). Likewise, Breed had no effect in the production of CH4
energy and averaged 0.15 ± 0.01 Mcal per kg of DMI and 0.03 ± 0.001 Mcal per kg of
BW0.75 (P = 0.12). In addition, CH4 energy as a percentage of GEI did not differ between
breeds averaging 3.7 ± 0.17 % of GEI (P = 0.35). The HP was not different between
breed as a proportion of DMI (1.41 ± 0.03 Mcal/kg of DMI; P = 0.89) and as a
percentage of GEI. Although, HP per kg of BW0.75 was not different between breeds,
there was an interaction between breed and diet (Figure 2.16). Despite the interaction, the
variations in HP as a proportion of kg of BW0.75 were not quantitatively high and it
averaged 0.26 ± 0.01 Mcal/kg BW0.75.
Tissue energy (TE) was negative in both breeds. Nevertheless, Jersey had a
greater negative TE compared to Holstein as a proportion of BW0.75 (-0.05 vs -0.01 ± 0.01
Mcal/kg BW 0.75, respectively; P < 0.01), per kg of DMI (-0.28 vs -0.02 ± 0.05 Mcal/kg
DMI, respectively; P < 0.01), and as a percentage of GEI (-6.63 vs -1.71 ± 1.17 % of
GEI, respectively; P < 0.01). Additionally, Jersey had a greater negative TE as a
percentage of ME than Holstein (-12.5 vs. -3.3 ± 2.11 %, respectively; P < 0.01). The
negative TE implies loss of BW and BCS. Nevertheless, BW and BCS did not change
substantially through periods, even though the statistical design was not developed to
estimate changes of BW and BCS. The negative TE observed in this study, is more likely
the result of either an overestimation of fecal energy output, a drop of GEI, or a
combination of both during the collection days.
60
In the present study, breed had no effect in energy milk per kg of BW0.75 (0.20 ±
0.01 Mcal/ kg BW0.75; P = 0.47) and per unit of DMI (1.07 ± 0.04 Mcal/kg of DMI; P =
0.76). In addition, no effect of breed was observed in milk energy as a percentage of GEI
(26.7 ± 1.09 % of GEI; P = 0.51). The milk energy as a percentage of ME was
numerically greater in Jersey compared to that of Holstein (49.4 vs. 44.5 ± 1.84 %,
respectively; P = 0.07). Nevertheless, similar milk energy efficiencies (per kg of DMI,
per unit of BW 0.75, and as a percentage of GEI) indicate that breed had no effect in the
ability of cows in converting energy intake into milk energy. Similarly to results in the
current study, Aikman et al. (2008) reported no effect of breed in milk energy per unit of
BW0.75 which averaged 0.23 ± 0.01 Mcal/kg of BW0.75. Another study by Rastani et al.
(2001) observed that Holstein had greater milk energy per kg of BW0.75 than Jersey cows
(0.21 vs. 0.24 Mcal/BW0.75 for Jersey and Holstein, respectively). Yan et al. (2006)
observed that milk energy as a percentage of ME was 38.3%. In the latter study, tissue
energy was 4% of ME. In contrast, in our study, the tissue energy was negative for both
Holstein and Jersey, which resulted in greater milk energy output as a proportion of ME
because some energy for milk production would come from body energy stores.
We observed that Holstein cows had a greater DE (68.0 vs. 64.8 ± 0.64 %), ME
(59.1 vs. 55.4 ± 0.65 %), and RE (24.5 vs. 20.6 ± 0.87 %) as a percentage of GEI than
Jersey (P < 0.01) (Table 2.9). As previously stated, other losses such as CH4 energy,
urine, and HP as a percentage of GEI were similar between breed. Consequently, the
main factor causing the lesser ME as a percentage of GEI in Jersey cows was the greater
fecal energy as a percentage of GEI in the Jersey cattle. A meta-analysis by Don et al.
(2015) reported energetic efficiency of Holstein and Non-Holstein (Norwegian, Jersey,
61
Norwegian × HF) dairy cows, and did not find difference in DE/GEI, ME/GEI, ME/DE,
milk energy/ME, RE/ME, and ME for maintenance between breeds. Similar results were
reported by Xue et al. (2011) with no differences between Holstein and Jersey × Holstein
in DE/GEI, ME/GEI, ME/DE, milk energy/ME, and TE/ME. As previously pointed out,
results of the current study indicate that Holstein were more efficient than Jersey in
converting GEI into DE and ME and RE. The energetic losses as a percentage of GEI
throughout the digestion were similar between breed, the only loss that was different was
the fecal energy (% of GEI), which was greater in Jerseys. This greater fecal energy loss
impacted on the calculation of the DE, ME, and RE as a percentage of GEI.
Metabolizable energy for maintenance (MEm) was estimated separately for
Holstein and Jersey through the regression of RE on ME and is the ME at zero RE
(Figure 2.6, Figure 2.7). The MEm estimated for Holstein and Jersey was 210.8 and
212.1 kcal/ kg BW0.75, respectively. The efficiency of ME for lactation (kl), which is
known as the slope of the regression line of RE and ME, was 0.8046 and 0.7423 for
Holstein and Jersey, respectively. Breed differences for MEm and kl were not tested
because our statistical model was not developed for regression analysis. However, figures
2.6 and 2.7 illustrate that both MEm and kl did not differ substantially between breeds.
Similar responses have been reported when comparing Holstein and non-Holstein dairy
cows (Dong et al., 2015), however estimates for MEm were lesser than our results at 164
kcal/ BW0.75. The study of Xue et al. (2011) reported that cow breed had no effect on
MEm (169.6 vs. 160.0 kcal/ kg BW0.75, for Holstein and Jersey ×Holstein, respectively)
and kl (0.604 and 0.575 for Holstein and Jersey ×Holstein, respectively). It was reported
that within the same breed, high genetic merit cows have similar MEm than low genetic

62
merit cows (Veerkamp and Emmans, 1995). Yan et al. (2006) meta-analysis reported a
range of MEm values between 146 and 179 kcal/ kg BW0.75 for studies that included
Holstein and Norwegian cows. These values are lesser than those reported in our study
(204.4 and 210.0 kca/ kg BW0.75 for Holstein and Jersey, respectively), suggesting that
animals in our study had greater maintenance energy requirements and efficiency at
converting ME to milk. It is been published in the literature that MEm are not constant but
increased with ME intake (Dong et al., 2015). Thus, the larger MEm observed in our
studies may be partially explained by greater levels of intake. In addition, greater MEm
may be associated to the high milk production of cows in the current study, which would
increase organ function to support milk synthesis, and consequently increased
maintenance.
CONCLUSIONS
In the current study we observed that breed had no effect in efficiency measured
as ECM per kg of DMI, milk energy per kg of DMI, milk energy per kg of BW0.75, milk
energy as a percentage of GEI and ME. The Jersey had a greater loss in feces as a
proportion of GEI, BW0.75, and DMI. It was also observed that Jersey had a greater
negative energy balance (TE) than Holstein when it was measured as a proportion of
GEI, ME, BW0.75, and DMI, which may be a result of greater drop of DMI in Jersey cows
during the collection periods. The loss of CH4 energy per kg of DMI, per kg of BW 0.75,
and as a percentage of GEI, was not affected by breed. Similarly, the energy losses as HP
per kg of DMI, per kg of BW0.75, and as a percentage of GEI were similar between
breeds. The latter results suggest that there are no differences in the metabolic rate and
heat production between breeds. In addition, MEm did not appear to be different between
63
breeds when it was estimated by a regression line between ME and RE. In conclusion, the
current study did not find differences in terms of energy efficiency for milk production
between breeds.

64
REFERENCES
Anderson, T., Shaver, R., Bosma, P., and De Boer, V. 2007. Case Study: Performance of
Lactating Jersey and Jersey-Holstein Crossbred Versus Holstein Cows in a
Wisconsin Confinement Dairy Herd. The Professional Animal Scientis, 23: 541-545.
AOAC International. 2000. Official Methods of Analysis. Vol. 1 and 2. 17th ed. AOAC
International, Gaithersburg, MD.
Beaulieu, A. D., and Palmquist, D. L. 1995. Comparison of Jersey and Holstein. J. Dairy
Sci., 78:1336-1344.
Beecher, M., Buckley, F., Waters, S. M., Boland, T. M., Enriquez-Hidalgo, D., and
Deighton, M. H. 2014. Gastrointestinal tract size, total-tract digestibility, and rumen.
J. Dairy Sci., 97 :3906–3917.
Bell, A. W., R. Slepetis, and R. A. Ehrhardt. 1995. Growth and accretion of energy and
protein in the gravid uterus during late pregnancy in Holstein cows. J. Dairy Sci.
78:1954– 1961.
Berry, D. P., and Crowley, J. J. 2013. Cell Biology Symposium: Genetics of feed
efficiency in dairy and beef cattle. J. Anim. Sci., 91: 1594-1613.
Birkelo, C.P., M.J. Brouk, and D.J. Schingoethe. 2004. The energy content of wet corn
distillers grains for lactating dairy cows. J. Dairy Sci. 87:1815–1819.
Blake, R. W., Custodio, A. A., and Howard, W. H. 1986. Comparative Feed Efficiency
of Holstein and Jersey Cows. J Dairy Sci. , 69:1302-1308.
Brody, S. 1945. Bioenergetics and Growth. New York, NY: Reinhold Publishing Corp.
Boadi, D., Benchaar, C., Chiquette, J., & Massé, D. 2004. Mitigation strategies to reduce
enteric methane emissions from dairy cows: update review. Canadian Journal of
Animal Science, 84(3), 319-335.
Capper, J. L., and Cady, R. A. 2012. A comparison of the environmental impact of
Jersey. J. Dairy Sci., 95 :165–176.
Cochran, W., and G.M. Cox. 1957. Experimental designs. 2nd ed. John Wiley and Sons,
Inc., New York, NY.
Connor, E. E., Hutchinson, J. L., Oson, K. M., and Norman, H. D. 2012. Opportunities
for improving production efficiency in dairy cattle. J. Anim. Sci., 90:1687-1694.
65
Dong L.F., Yan T., Ferris C.P., McDowell, D.A. 2015. Comparison of maintenance
energy requirement and energetic efficiency between lactating Holstein-Friesian and
other groups of dairy cows. J. Dairy Sci., 98:1136-1144.
DuBois, M., K.A. Gilles, J.K. Hamilton, P.A. Rebers, and F. Smith. 1956. Colorimetric
method for determination of sugars and related substances. Anal. Chem. 28:350-356.
Ferris, C. P., Gordon, F. J., Patterson, D. C., Porter, M. G., and Yan, T. 1999. The effect
of genetic merit and concetrate proportion in the diet on nutrient utilization by
lactating dairy cows. J. Agric. Sci., 132:483-490.
Freetly, H.C., J.A. Nienaber, and T. Brown-Brandl. 2006. Partitioning of energy during
lactation of primiparous beef cows. J. Anim. Sci. 84:2157–2162.
Foth, A. J. 2014. Energy content of reduced-fat dried distillers grains and solubles for
lactating dairy cows and effects on energy and nitrogen balance. Master thesis of
Animal Science UNL.
Grainger, C., and Goddard, M. E. 2007. A review of the effects of dairy breed on feed
conversion efficiency- An opportunity Lost? Animal Production in Australia, 23:
77-80.
Grainger, C., & Beauchemin, K. A. 2011. Can enteric methane emissions from ruminants
be lessered without lessering their production?. Animal feed science and technology,
166: 308-320.
Heinrichs, A.J., and P.J. Kononoff. 2002. Evaluating particle size of forages and TMRs
using the New Penn State Roage Particle Separator. Tech. Bul. DAS 02-42.
Pennsylvania State Univ., College Agric. Sci., Cooperative Ext., University Park,
PA.
Ingvartsen, K. L., and Weisbjerg, M. R. 1993. Jersey cows have a greater feed intake
capacity and greater rate of passage than Friesian cows. Arch. Tierz., 36:495-498.
Johnson, K.A., and D.E. Johnson. 1995. Methane emissions from cattle. J. Anim. Sci.
73:2483–2492.
Johnson, D. E., Ward, G. W. and Ramsey, J. J. 1996. Livestock methane: Current
emissions and mitigation Potential. Pages 219–234 in E. T. Kornegay, ed. Nutrient
management of food animalsto enhance and protect the environment. Lewis
Publishers,New York, NY.
Kauffman, A. J., and St-Pierre, N. R. (2001). The relationship of milk urea nitrogen to
urine nitrogen excretion in Holstein and Jersey cows. . J. Dairy Sci. , 84:2284-2294.

66
Knowlton, K. F., Wilkerson, V. A., Casper, D. P., and Mertens, D. R. 2010. Manure
nutrient excretion by Jersey and Holstein cows. J. Dairy Sci., 93:407-412.
Kononoff, P. J., Heinrich, A. J., and Buckmaster, D. R. 2003. Modification of the Penn
State forage and total mixed ration particle separator and the effects of moisture
content on its measurements. J. Dairy Sci., 86:1858-1863.
Lascano, G.J., G.I. Zanton, A.J. Heinrichs, and W.P. Weiss. 2010. Technical note: A
noninvasive urine collection device for female cattle: modification of the urine cup
collection method. J. Dairy Sci. 93:2691–2694.
Moe, P.W., H.F. Tyrell, and W.P. Flatt. 1970. Partial efficiency of energy use for
maintenance, lactation, body gain and gestation in the dairy cow. Pages 65-68 in
Energy metabolism of farm animals.
NRC. 2001. Nutrient Requiremens of Dairy Cattle. 7th rev. ed. . Washington, DC: Natl.
Acad. Sci.
Nienaber, J., and A. Maddy. 1985. Temperature controlled multiple chamber indirect
calorimeter-design and operation. Trans. ASAE 28:555–560.
Predenville, R., Lewis, E., Pierce, K. M., and Buckley, F. 2010. Comparative grazing
behavior of lactating Holstein-Friesian Jersey, and Jersey ×Holstein-Friesian dairy
cows and its association with intake capacity and production efficiency. J. Dairy Sci.
, 93: 764-774.
Prendiville, R., Pierce, K. M., and Buckley, F. 2009. An evaluation of production
efficiencies among lactating Holstein-Friesian, Jersey, and Jersey ×Holstein-Friesian
cows at pasture. J. Dairy Sci., 92:6176-6185.
Rastani, R. R., Andrew, S. M., Zinn, S. M., and Sniffen, C. J. 2001. Body Composition
and Estimated Tissue Energy Balance in Jersey and Holstein Cows During Ealy
Lactation. J. Dairy Sci., 84: 1201-1209.
Rodriguez, L. A., Stallings, C. C., and Herbein, J. H. 1997. Effect of Degradability of
Dietary Protein and Fat on Ruminal, Blood, and Milk components of Jersey and
Holstein Cows. J. Dairy Sci., 80:353-363.
Shalloo, L. 2007. Increasing milk value. Proc. Irish Grassland Assoc. Dairy Conf., 83-96.
Smith, N. E., and R. L. Baldwin. 1974. Effects of breed, pregnancy, and lactation on
weight of organs and tissues in dairy cattle. J. Dairy Sci. 57:1055-1060.
Tyrrell, H. F., Reynolds, C. K., and Baxter, H. D. 1991. Effect of dietary fat from whole
cottonseed on energy metabolism of lactating Holstein and Jersey cows. J. Dairy
Sci., 74(Suppl. 1):250.

67
Van Soest, P.J., J.B. Robertson, and B.A. Lewis. 1991. Methods for dietary fiber, neutral
detergent fiber, and nonstarch polysaccharides in relation to animal nutrition. J.
Dairy Sci. 74:3583-3597.
Van Soest, P. J. 1994. Nutritional Ecology of the Ruminant. Ithaca, NY: 2nd ed. Cornell
Univ. Press.
Veerkamp, R., and Emmans, G. 1995. Sources of genetic variation in energetic
efficiency of dairy cows. Livest. Prod. Sci, 44: 87–97.
West, J. S., Bondari, K., and Johnson, J. C. 1990. Effects of bovine somatotropin on milk
yield and composition, body weight, and condition score of Hostein and Jersey
cows. J. Dairy Sci. , 73:1062-1068.
Xue, B., Yan, T., Ferris, C. F., and Mayne, C. S. 2011. Milk production and energy
efficiency of Holstein and Jersey-Holstein crossbred dairy cows offered diets
containing grass silage. J. Dairy Sci. , 94:1455-1464.
Yan, T., Gordon, F. J., Ferris, C. P., Agnew, R. E., Porter, M. G., and Patterson, D. C.
1997. The fasting heat production and effect of lactation on energy utilisation by
dairy cows offered forage-based diets. Livest. Prod. Sci., 52:177-186.
Yan, T., Mayne, C. S., Keady, T. W., and Agnew, R. E. 2006. Effects of Dairy Cow
Genotype with Two Planes of Nutrition on Energy Partitioning Between Milk and
Body Tissue. J. Dairy Sci., 89:1031-1042.

68
Table 2.1. Diet composition and analysis of Control and Co-Product (Co-P) with 28.8%
Reduced-Fat Dried Distillers Grains and Solubles (RFDDGS) diets
Diet
Component, % of DM Control
Co-P
Corn Silage 24.5
24.5
Alfalfa hay 18.4
18.4
Brome Hay 6.94
6.94
Ground corn 22.9
8.95
RFDDGS --
28.8
Soybean meal 14.8
--
Ground soybean hulls 7.93
7.93
Soypass1 2.01
2.01
Calcium carbonate 0.89
0.89
Sodium bicarbonate 0.65
0.65
Calcium diphosphate 0.3
0.3
Salt 0.22
0.22
Magnesium oxide 0.18
0.18
Trace mineral premix2 0.12
0.12
Vitamin premix3 0.12
0.12 1LignoTech, Overland Park, KS. 2Contained 13.9% Ca, 0.03 %P, 0.42 %Mg, 0.20 % K, 4.20 % S, 0.08 % Na, 0.03 % Cl,
445 Fe, 60,021 Zn, 17.375 Cu, 43,470 Mn, 287 Se, 527 Co, and 870 I. 3Formulated to supply approximately 120,000 IU/d vitamin A, 24,000 IU/d of vitamin D,
and 800 IU/d Vitamin E in total ration.

69
Table 2.2. Chemical composition and particle distribution of Control and Co-Product
(Co-P) with 28.8 % RFDDGS diets1
Control Co-P
Chemical, % DM2 Mean SD Mean SD
DM
75.9 0.32
76.3 0.35
CP
18.8 0.23
18.8 0.21
Soluble protein
4.32 0.18
3.88 0.13
ADICP
1.2 0.12
1.6 0.14
NDICP
2.66 0.2
3.42 0.34
ADF
19.5 0.4
21.5 0.46
NDF
30.8 0.69
37.1 0.89
Lignin
3.14 0.15
3.81 0.18
NFC
42.3 0.54
35.5 0.65
Starch
26.7 0.43
18.9 0.38
Sugar
5.15 0.18
3.69 0.2
Ether extract
2.6 0.1
3.6 0.13
Ash
8.21 0.16
8.41 0.12
Ca,%
1.12 0.04
1.02 0.06
P, %
0.44 0.01
0.59 0.03
Mg, %
0.28 0
0.33 0.01
K, %
1.83 0.04
1.75 0.04
S, %
0.22 0
0.4 0.01
Na, %
0.31 0.01
0.4 0.01
Cl, %
0.39 0.02
0.41 0.01
Fe,
291.7 11.5
311 28
Mn,
113.3 4.32
119.9 3.8
Zn,
35.5 1.27
32.4 1.32
Cu,
83.2 3.18
96.4 3.74
Particle size, %3
> 19.0 mm
2.85 0.66
2.87 0.74
19.0 - 8.0 mm
20.7 2.88
19.9 3.06
8.0 - 1.18 mm
45.3 4.86
41.4 6.15
< 1.18 mm 31.1 5.58 36.1 4.91 1Values determined by Cumberland Valley Analytical Services, Hagerstown, MD. 2CP = Crude Protein; ADICP = Acid detergent insoluble crude protein; NDICP =
Neutral detergent insoluble crude protein; NFC = Non-fiber Carbohydrates. 3Determined using the Penn State Particle Separator on wet basis (Heinrichs and
Kononoff, 2002).

70
Table 2.3. BW, BCS1, DMI, Milk production and composition of Holstein and Jersey
cows fed Control and Co-product (Co-P) diet
P-value
Item Holstein Jersey SEM2 Breed Diet Interaction
BW, kg 693.8 429.2 12.97 < 0.01 0.13 0.94
Metabolic BW, kg BW0.75 135.2 94.2 1.97 < 0.01 0.14 0.86
BCS 3.40 3.18 0.08 0.06 0.81 0.50
DMI, kg/d 24.5 18.1 0.68 < 0.01 0.86 0.10
DMI, % of BW 3.54 4.22 0.13 < 0.01 0.75 0.15
DMI, % of BW0.75 18.2 19.2 0.60 0.22 0.78 0.13
Milk yield, kg 37.2 23.4 2.02 < 0.01 0.10 0.43
ECM3, kg 38.2 29.1 1.64 < 0.01 0.21 0.15
Milk yield, kg/kg of DMI 1.52 1.30 0.07 0.03 0.30 0.42
ECM, kg/kg of DMI 1.56 1.61 0.05 0.50 0.41 0.76
Milk energy, Mcal/kg 5.49 5.71 0.06 0.01 0.16 0.79
Fat, % 3.70 4.97 0.19 < 0.01 0.81 0.14
Protein, % 3.21 3.76 0.11 < 0.01 0.00 0.42
MUN4, mg/dl 16.6 16.9 0.52 0.69 0.58 0.95
Fat yield, kg/d 1.36 1.16 0.06 0.03 0.14 0.09
Protein yield, kg/d 1.17 0.88 0.05 < 0.01 0.51 0.48
Fat yield, g/ kg DMI 55.5 63.9 1.96 < 0.01 0.20 0.97
Protein yield, g/ kg DMI 48.0 49.0 1.39 0.63 0.39 0.70 1BCS = Body Condition Score 1-5 scale according to Wildman et al. (1982). 2Highest standard error of treatment means is shown. 3ECM = Energy corrected milk = 0.327 × milk yield [kg] + 12.95 × fat [kg] + 7.20 ×
protein [kg] adjusted for 3.5% fat and 3.2 % total protein (DHI Glossary, 2014). 4MUN = milk urea nitrogen.

71
Table 2.4. Feces, orts, and urine outputs of Holstein and Jersey cows fed a Control
and Co-product (Co-P) diet
P-value
Item Holstein Jersey SEM1 Breed Diet Interaction
Feces, kg 7.70 5.87 0.24 < 0.01 < 0.01 0.10
Feces, kg/kg of DMI 0.31 0.32 0.01 0.20 < 0.01 0.81
Feces, % of BW 1.11 1.36 0.05 < 0.01 0.01 0.39
Feces, % of BW 0.75 5.71 6.22 0.23 0.13 0.01 0.28
Urine, kg DM 1.14 0.99 0.07 0.13 0.77 0.93
Urine, % of BW 0.16 0.23 0.01 < 0.01 0.85 0.99
Urine, % of BW 0.75 0.84 1.05 0.06 0.01 0.83 1.00 1Highest standard error of treatment means is shown.
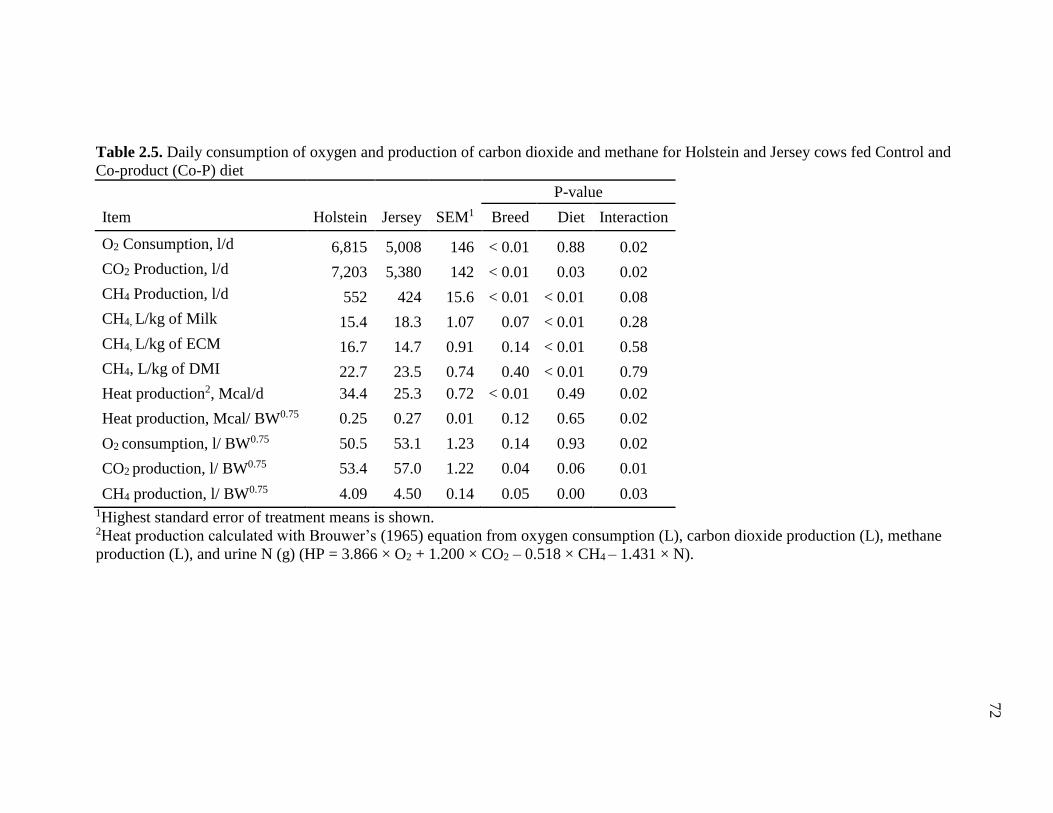
72
Table 2.5. Daily consumption of oxygen and production of carbon dioxide and methane for Holstein and Jersey cows fed Control and
Co-product (Co-P) diet
P-value
Item Holstein Jersey SEM1 Breed Diet Interaction
O2 Consumption, l/d 6,815 5,008 146 < 0.01 0.88 0.02
CO2 Production, l/d 7,203 5,380 142 < 0.01 0.03 0.02
CH4 Production, l/d 552 424 15.6 < 0.01 < 0.01 0.08
CH4, L/kg of Milk 15.4 18.3 1.07 0.07 < 0.01 0.28
CH4, L/kg of ECM 16.7 14.7 0.91 0.14 < 0.01 0.58
CH4, L/kg of DMI 22.7 23.5 0.74 0.40 < 0.01 0.79
Heat production2, Mcal/d 34.4 25.3 0.72 < 0.01 0.49 0.02
Heat production, Mcal/ BW0.75 0.25 0.27 0.01 0.12 0.65 0.02
O2 consumption, l/ BW0.75 50.5 53.1 1.23 0.14 0.93 0.02
CO2 production, l/ BW0.75 53.4 57.0 1.22 0.04 0.06 0.01
CH4 production, l/ BW0.75 4.09 4.50 0.14 0.05 0.00 0.03 1Highest standard error of treatment means is shown. 2Heat production calculated with Brouwer’s (1965) equation from oxygen consumption (L), carbon dioxide production (L), methane
production (L), and urine N (g) (HP = 3.866 × O2 + 1.200 × CO2 – 0.518 × CH4 – 1.431 × N).
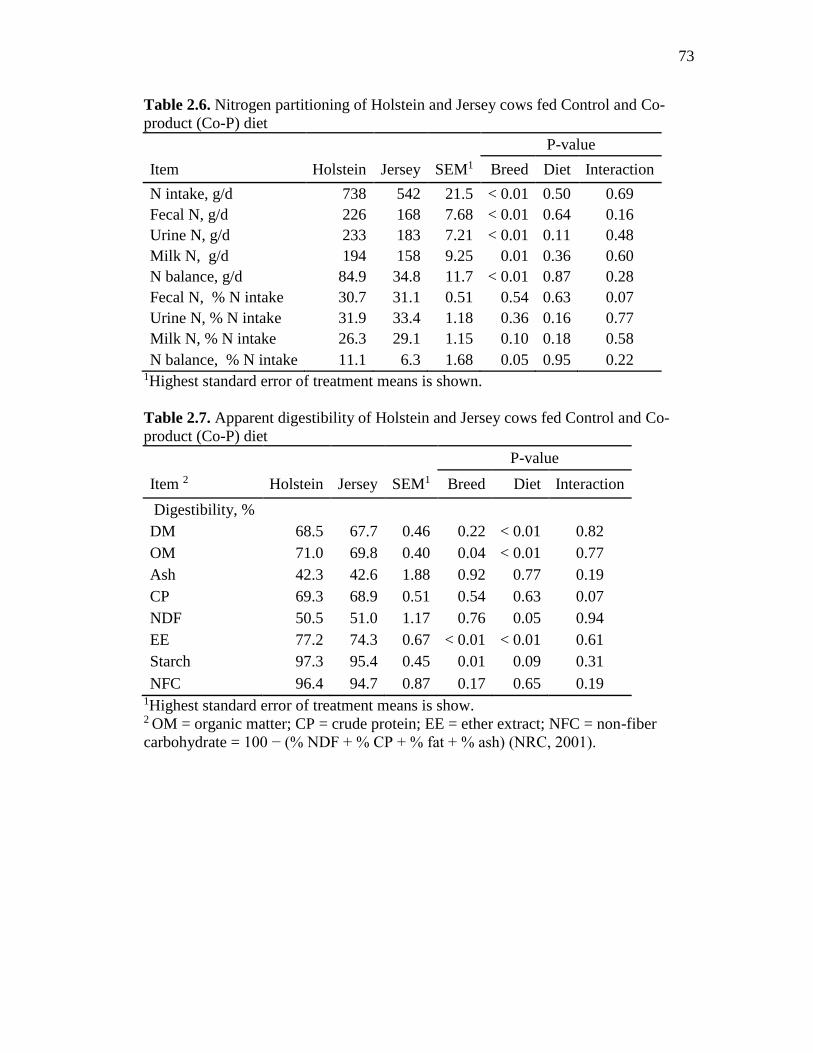
73
Table 2.6. Nitrogen partitioning of Holstein and Jersey cows fed Control and Co-
product (Co-P) diet
P-value
Item Holstein Jersey SEM1 Breed Diet Interaction
N intake, g/d 738 542 21.5 < 0.01 0.50 0.69
Fecal N, g/d 226 168 7.68 < 0.01 0.64 0.16
Urine N, g/d 233 183 7.21 < 0.01 0.11 0.48
Milk N, g/d 194 158 9.25 0.01 0.36 0.60
N balance, g/d 84.9 34.8 11.7 < 0.01 0.87 0.28
Fecal N, % N intake 30.7 31.1 0.51 0.54 0.63 0.07
Urine N, % N intake 31.9 33.4 1.18 0.36 0.16 0.77
Milk N, % N intake 26.3 29.1 1.15 0.10 0.18 0.58
N balance, % N intake 11.1 6.3 1.68 0.05 0.95 0.22 1Highest standard error of treatment means is shown.
Table 2.7. Apparent digestibility of Holstein and Jersey cows fed Control and Co-
product (Co-P) diet
P-value
Item 2 Holstein Jersey SEM1 Breed Diet Interaction
Digestibility, %
DM 68.5 67.7 0.46 0.22 < 0.01 0.82
OM 71.0 69.8 0.40 0.04 < 0.01 0.77
Ash 42.3 42.6 1.88 0.92 0.77 0.19
CP 69.3 68.9 0.51 0.54 0.63 0.07
NDF 50.5 51.0 1.17 0.76 0.05 0.94
EE 77.2 74.3 0.67 < 0.01 < 0.01 0.61
Starch 97.3 95.4 0.45 0.01 0.09 0.31
NFC 96.4 94.7 0.87 0.17 0.65 0.19 1Highest standard error of treatment means is show. 2 OM = organic matter; CP = crude protein; EE = ether extract; NFC = non-fiber
carbohydrate = 100 − (% NDF + % CP + % fat + % ash) (NRC, 2001).

74
Table 2.8. Energy partitioning of Jersey and Holstein cows fed Control and Co-
product (Co-P) diets
P-value
Energy item2 Holstein Jersey SEM1 Breed Diet Interaction3
GEI, Mcal 99.9 72.5 2.93 < 0.01 0.04 0.03
DE, Mcal 67.9 47.0 1.85 < 0.01 0.24 0.02
ME, Mcal 59.0 40.3 1.75 < 0.01 0.22 0.02
RE, Mcal 24.7 15.1 1.29 < 0.01 0.17 0.09
TE, Mcal -1.43 -4.55 0.95 0.03 0.73 0.33
Feces, Mcal 32.0 25.7 1.24 < 0.01 0.05 0.35
Methane, Mcal 3.62 2.79 0.13 < 0.01 0.09 0.52
Urine , Mcal 5.22 4.01 0.15 < 0.01 < 0.01 0.08
HP, Mcal 34.4 25.3 0.72 < 0.01 0.49 0.02
Milk, Mcal 26.1 19.5 1.30 < 0.01 0.01 0.17
GEI, Mcal/kg of DMI 4.07 4.00 0.01 < 0.01 < 0.01 0.03
DE, Mcal/kg of DMI 2.77 2.59 0.03 < 0.01 0.16 0.23
ME, Mcal/kg of DMI 2.41 2.22 0.03 < 0.01 0.14 0.22
RE, Mcal/kg of DMI 1.00 0.83 0.04 < 0.01 0.20 0.22
TE, Mcal/kg of DMI -0.07 -0.26 0.05 0.01 0.84 0.29
Feces, Mcal/kg of DMI 1.30 1.41 0.03 0.01 0.02 0.79
Methane, Mcal/kg of DMI 0.15 0.15 0.01 0.69 0.12 0.77
Urine, Mcal/kg of DMI 0.21 0.22 0.01 0.40 < 0.01 0.79
HP , Mcal/kg of DMI 1.41 1.40 0.03 0.89 0.71 0.81
Milk , Mcal/kg of DMI 1.07 1.08 0.04 0.76 0.07 0.75
NEL, Mcal/kg of DMI 1.51 1.39 0.02 < 0.01 0.10 0.19
GEI, Mcal/kg BW0.75 0.74 0.77 0.03 0.44 0.04 0.06
DE, Mcal/kg BW0.75 0.50 0.50 0.02 0.83 0.24 0.03
ME, Mcal/kg BW0.75 0.44 0.43 0.01 0.60 0.23 0.03
RE, Mcal/kg BW0.75 0.18 0.16 0.01 0.15 0.21 0.12
TE, Mcal/kg BW0.75 -0.01 -0.05 0.01 < 0.01 0.83 0.34
HP , Mcal/kg BW0.75 0.25 0.27 0.01 0.12 0.65 0.02
Feces, Mcal/kg BW0.75 0.24 0.27 0.01 0.03 0.05 0.57
Methane, Mcal/kg BW0.75 0.03 0.03 0.00 0.14 0.10 0.80
Urine, Mcal/kg BW0.75 0.04 0.04 0.00 0.05 < 0.01 0.03
Milk, Mcal/kg BW0.75 0.19 0.21 0.01 0.47 0.01 0.36 1 GEI = gross energy intake; DE = digestible energy; ME = metabolizable energy; RE
= retained energy; TE = tissue energy; HP = heat production estimated by indirect
calorimetry with Brouwer’s (1965) equation. 2Highest standard error of treatment means is shown. 3 Refer to table 2.10 for LSMEANS of interactions.

75
Table 2.9. Energy partitioning as a percentage of GEI, DE, ME, and RE of Holstein
an Jersey cows fed Control and Co-product diets
P-value
Item1 Holstein Jersey SEM2 Breed Diet Interaction
Energy, % of GE
DE 68.0 64.8 0.64 < 0.01 0.27 0.58
ME 59.1 55.4 0.65 < 0.01 0.51 0.49
RE 24.5 20.6 0.87 < 0.01 0.57 0.31
TE -1.71 -6.63 1.17 < 0.01 0.77 0.31
Feces 32.0 35.2 0.64 < 0.01 0.27 0.58
Methane 3.65 3.81 0.17 0.50 0.35 0.67
Urine 5.27 5.58 0.18 0.24 < 0.01 0.93
HP2 34.7 35.3 0.91 0.62 0.01 0.49
Milk 26.2 27.2 1.09 0.51 0.63 0.51
Energy, % of DE
ME 86.9 85.5 0.46 0.04 0.37 0.54
RE 35.9 31.3 1.40 0.03 0.22 0.35
TE -2.73 -10.53 1.77 < 0.01 0.77 0.36
Methane 5.37 5.88 0.24 0.14 0.25 0.55
Urine 7.77 8.63 0.27 0.03 < 0.01 0.78
HP 51.0 54.1 1.09 0.05 0.27 0.36
Milk energy 38.6 42.2 1.58 0.12 0.42 0.47
Energy, % of ME
RE 41.2 36.6 1.49 0.04 0.23 0.36
TE -3.31 -12.5 2.12 < 0.01 0.76 0.37
Milk 44.5 49.4 1.84 0.07 0.53 0.44
HP 58.8 63.4 1.49 0.04 0.23 0.36
Energy, % of RE
TE -12.2 -43.6 9.65 0.03 0.84 0.47
Milk energy 112 144 9.65 0.03 0.84 0.47 1 GEI = gross energy intake; DE = digestible energy; ME = metabolizable energy; RE
= retained energy; TE = tissue energy; HP = Heat production estimated by indirect
calorimetry with Brouwer’s (1965) equation. 2Highest standard error of treatment means is shown.

76
Table 2.10. Energy variables with significant interaction
Holstein Jersey P-value
Item1 Control Co-P
Control Co-P SEM2 Breed Diet Interaction
GEI, Mcal 96.0 103.8 72.6 72.3 2.93 < 0.01 0.04 0.03
DE, Mcal 65.5 70.3
47.9 46.2 1.85 < 0.01 0.24 0.02
ME, Mcal 56.8 61.3
41.0 39.5 1.75 < 0.01 0.22 0.02
HP, Mcal 34.0 34.7
25.9 24.8 0.72 < 0.01 0.49 0.02
GEI, Mcal/kg DMI 3.98 4.16
3.95 4.06 0.01 < 0.01 < 0.01 0.03
DE, Mcal/ kg BW 0.75 0.48 0.52
0.50 0.49 0.02 0.83 0.24 0.03
ME , Mcal/ kg BW 0.75 0.42 0.46
0.43 0.42 0.01 0.60 0.23 0.03
HP, Mcal/ kg BW 0.75 0.25 0.26
0.27 0.26 0.01 0.12 0.65 0.02
Urine energy, Mcal/ kg BW 0.75 0.04 0.04 0.04 0.04 0.001 0.05 < 0.01 0.03 1 Co-P = Co-product; GEI = gross energy intake; DE = digestible energy; ME = metabolizable energy; RE = retained energy; TE =
tissue energy; HP = Heat production estimated by indirect calorimetry with Brouwer’s (1965) equation. 2Highest standard error of treatment means is shown.

77
Figure 2.1. Reduced-fat dried distillers grains and solubles.
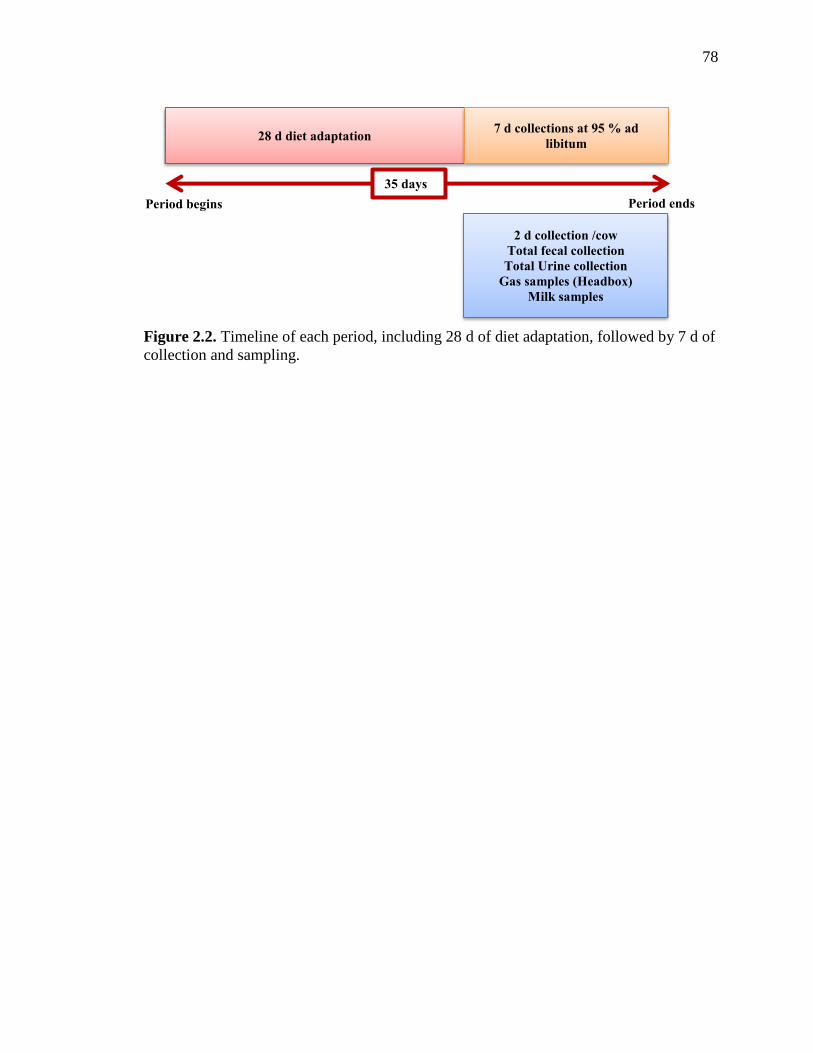
78
28 d diet adaptation 7 d collections at 95 % ad
libitum
2 d collection /cow
Total fecal collection
Total Urine collection
Gas samples (Headbox)
Milk samples
35 days
Period begins Period ends
Figure 2.2. Timeline of each period, including 28 d of diet adaptation, followed by 7 d of
collection and sampling.

79
Figure 2.3. Headbox for gas collection (a), fecal and urine collection system (b) into an
aluminum pan and a Surge milk can, respectively.
a
b

80
Figure 2.4. Aluminum bags for collection of gas from a live animal using the indirect
calorimeter headbox system

81
Figure 2.5. Partitioning of energy as percentage of GEI of Holstein and Jersey cows.
-1.7 -6.6
32.0 35.2
3.6 3.85.3 5.6
34.7 35.3
26.227.2
-20%
0%
20%
40%
60%
80%
100%
Holstein Jersey
En
ergy, %
of
GE
I
Breed
Milk
HP
Urine
Methane
Feces
TE

82
Figure 2.6. Regression of RE (milk + tissue energy) on ME (intake energy – fecal energy
– urinary energy – methane energy) in kcal/BW 0.75;(y =0.8046x – 169.64; R2 = 0.86) in
Holstein cows. Recovered energy = 0 at 210.8 kcal/BW0.75 and efficiency of converting
metabolizable energy to lactation energy, kl = 80.5%.
0
50
100
150
200
250
300
200 300 400 500 600
RE
kca
l/B
W0
.75
ME kcal/BW0.75

83
Figure 2.7. Regression of RE (milk + tissue energy) on ME (intake energy – fecal energy
– urinary energy – methane energy) in kcal/ BW 0.75 (y = 0.7423x – 157.45; R2 = 0.91) in
Jersey cows. Recovered energy = 0 at 212.1 kcal/ BW 0.75 and efficiency of converting
metabolizable energy to lactation energy, kl = 74.2 %.
0
50
100
150
200
250
300
200 300 400 500 600
RE
kca
l/B
W0
.75
ME kcal/BW0.75

84
Figure 2.8. Gross energy intake (GEI) Mcal for Holstein and Jersey cows fed Control
and Co-product diet. .
Figure 2.9. Digestible energy (DE) Mcal for Holstein and Jersey cows fed Control and
Co-product diet. .
Control, 96.0Co-P, 103.8
Control, 72.6Co-P, 72.3
0.0
20.0
40.0
60.0
80.0
100.0
120.0
0.5 1 1.5 2 2.5
GE
I (M
cal)
Diet
Holstein
Jersey
Co-PControl
Control, 65.5Co-P, 70.3
Control, 47.9Co-P, 46.2
0.0
10.0
20.0
30.0
40.0
50.0
60.0
70.0
80.0
0.5 1 1.5 2 2.5
DE
(M
cal)
Diet
Holstein
Jersey
Co-PControl

85
Figure 2.10. Metabolizable energy (ME) Mcal for Holstein and Jersey cows fed Control
and Co-product diet.
Figure 2.11. Heat production energy (HP), Mcal for Holstein and Jersey cows fed
Control and Co-product diet.
Control, 56.8Co-P, 61.3
Control, 41.0Co-P, 39.5
0.0
10.0
20.0
30.0
40.0
50.0
60.0
70.0
0.5 1 1.5 2 2.5
ME
(M
cal)
Diet
Holstein
Jersey
Co-PControl
Control, 34.0 Co-P, 34.7
Control, 25.9 Co-P, 24.8
0.0
5.0
10.0
15.0
20.0
25.0
30.0
35.0
40.0
0.5 1 1.5 2 2.5
HP
(M
cal)
Diet
Holstein
Jersey
Co-PControl

86
Figure 2.12. Gross energy intake (GEI), Mcal per kg of DMI for Holstein and Jersey
cows fed Control and Co-product diet.
Figure 2.13. Gross energy intake (GEI), Mcal per kg of BW0.75 for Holstein and Jersey
cows fed Control and Co-product diet.
Control, 3.98Co-P, 4.16
Control, 3.95
Co-P, 4.06
3.00
3.20
3.40
3.60
3.80
4.00
4.20
4.40
4.60
4.80
5.00
0.5 1 1.5 2 2.5
GE
I (M
cal
/ K
g o
f D
MI)
Diet
Holstein
Jersey
Co-PControl
Control,
0.708
Co-P, 0.772Control,
0.767Co-P, 0.770
0.600
0.650
0.700
0.750
0.800
0.850
0.900
0.5 1 1.5 2 2.5
GE
I (M
cal
/ k
g B
W0
.75)
Diet
Holstein
Jersey
Co-PControl

87
Figure 2.14. Digestible energy (DE), Mcal per kg of BW0.75 for Holstein and Jersey cows
fed Control and Co-product diet.
Figure 2.15. Metabolizable energy (ME), Mcal per kg of BW0.75 for Holstein and Jersey
cows fed Control and Co-product diet.
Control,
0.483
Co-P, 0.523Control,
0.504
Co-P, 0.492
0.400
0.450
0.500
0.550
0.600
0.5 1 1.5 2 2.5
DE
(M
cal
/ k
g B
W0
.75)
Diet
Holstein
Jersey
Co-PControl
Control,
0.419
Co-P, 0.456Control,
0.432
Co-P, 0.421
0.300
0.320
0.340
0.360
0.380
0.400
0.420
0.440
0.460
0.480
0.500
0.5 1 1.5 2 2.5
ME
(M
cal
/ k
g B
W0
.75)
Diet
Holstein
Jersey
Co-PControl

88
Figure 2.16. Heat production energy (HP), Mcal per kg of BW0.75 for Holstein and Jersey
cows fed Control and Co-product diet.
Figure 2.17. Urine energy, Mcal per kg of BW0.75for Holstein and Jersey cows fed
Control and Co-product diet.
Control,
0.251
Co-P, 0.258
Control,
0.274Co-P, 0.264
0.200
0.220
0.240
0.260
0.280
0.300
0.5 1 1.5 2 2.5
HP
(M
cal
/ k
g B
W0
.75)
Diet
Holstein
Jersey
Co-PControl
Control,
0.039Co-P, 0.038
Control,
0.045
Co-P, 0.040
0.030
0.035
0.040
0.045
0.050
0.055
0.060
0.5 1 1.5 2 2.5
Urr
ine
(Mca
l /
kg B
W0
.75)
Diet
Holstein
Jersey
Co-PControl

89
APPENDIX I: EQUATIONS
DE (Mcal) = GEI (Mcal) – fecal energy (Mcal) [1]
ME (Mcal) = DE (Mcal) – urinary energy (Mcal) – methane energy (Mcal) [2]
HP (Mcal)= 3.866 × O2 (l) + 1.200 × CO2 (l) – 0.518 × CH4 (l) – 1.431 × N (g) [3]
RE (Mcal) = ME (Mcal) – HP (Mcal) [4]
TE (Mcal) = RE (Mcal) – milk energy (Mcal) [5]

90
`CHAPTER 3
Mineral apparent digestion by lactating Holstein and Jersey cows: Estimating fecal
mineral excretion of diet containing RFDDGS
G. Garcia*, A. Foth*, P.S. Miller*, and P.J. Kononoff*1
*Department of Animal Science, University of Nebraska-Lincoln, Lincoln, 68583.
1Corresponding Author: Paul J. Kononoff, Department of Animal Science C220, Fair
Street, Lincoln, NE, 68583, Phone number: 402-472 6442, Fax number: 402-472-6362,
E-mail: [email protected]

91
ABSTRACT
Eight Holstein and 8 Jersey dairy cows (multiparous) were used to evaluate the effect of
breed and diet on mineral and N excretion, absorption, and digestibility. Treatments were
applied in a repeated switchback design (2 breeds times 2 diets) designed to examine the
effect of cow diet and breed. Diets consisted of 24.5% corn silage, 18.4% alfalfa hay,
6.9% grass hay, with either 22.9% rolled corn and 14.8% soybean meal (Control diet) or
8.95% rolled corn and 28.8% reduced fat distillers grains (RFDDGS) DM-basis (Co-
product diet). Diets were offered ad libitum for a 28 d adaptation period and 95% ad
libitum for a 4 d collection period. During the collection days, intake and orts were
measured, and total collection of feces was conducted. Subsamples of feeds, orts, and
feces were taken and analyzed for N, Ca, K, Na, Mg, P, Cu, Fe, Mn, and Zn. The Co-
product diet had a greater concentration of Mg, Na, P, and Zn than the Control diet. As a
result, cows fed Co-product diet had a greater excretion of Mg (2.74 vs. 2.36 ± 0.05
g/DMI), Na (1.10 vs. 0.69 ± 0.08 g/DMI), P (4.23 vs. 2.95 ± 0.20 g/DMI), and Zn
(0.12vs. 0.10 ± 0.001 g/DMI) than Control diet (P = 0.01). Diet had no effect on
excretion (g/DMI) for N, Cu, K, and Mn. No effect of breed was observed in fecal output
(g/DMI) for N, K, Mg, Mn, Na, P, and Zn. However, Cu excretion was greater in Jersey
compared with Holsteins (0.029 vs. 0.026 ± 0.001 g/DMI; P < 0.01). Diet had no effect
the apparent digestibility of Ca, Fe, Mg, P and Zn. . The Control diet had greater
digestibility of Cu, K, and Na than the Co-product diet. The Co-product diet produced a
greater digestibility of Mn (-12.4 vs. -35.6 ± 4.68; P < 0.01) than the Control diet. Partial
digestibility of minerals between breeds did not differ for Ca, K, Mg, Mn, Na, P, and Zn
between breeds. Nevertheless, Holstein had a greater (P = 0.03) digestibility on Cu (21.9
92
vs. 13.7 ± 3.29 %) and Fe (-17.4 vs. -30.4 ± 5.55 %) compared with Jersey cows.
Nutrient utilization can be optimized when minerals and N are not supplemented in
excess of animal’s requirements. Results of this study suggest that diets formulated
containing RFDDGS should avoid supplementation of P and Jersey cows should not be
supplemented Cu at the same concentration of Holstein.
Key Words: minerals, excretion, reduced fat distillers grains with solubles.

93
INTRODUCTION
The production of manure and manure nutrients and its environmental impact is
becoming increasingly important for society (Weiss and Wyatt, 2004). As dairy farms
continue to increase in size due to scale economics, the nutrients contained in manure are
becoming concentrated in local areas. Dairy farms have to comply with environmental
regulation at the federal, state, and local concentrations (Castillo et al., 2007). The US
environmental protection Agency (EPA) (2003) made new modifications to the Clean
Water Act demanding more efforts to reduce pollution through nutrient management on
concentrated animal operation. Feeding mineral in excess not only increases diet cost but
also results in a negative environmental impact (Hristov et al, 2006). Minerals such as
nitrogen (N), phosphorus (P), and potassium (K) receive special attention when
transferred into surface water, ground water, or cropping acres (Erickson and
Klopfenstein, 2010). Reducing nutrient loss in feces, improving waste management
programs, manure application according to crop and soil requirements are some of the
strategies to reduce the environmental impact of dairy production (NRC, 2001; Castillo et
al., 2007).
Distillers grains and solubles (DDGS), is a popular feed in replace of corn and
soybean for dairy diets. DDGS are fed as source of protein and energy; however the
chemical composition varies among ethanol plants. DDGS content of CP, NDF, ether
extract (EE), and P are greater than corn averaging approximately 30, 40, 10, and 0.9 %
DM, respectively (Kleinschmit et al., 2006). Generally, DDGS has three times the P
concentrations found in corn. As a result, P excretion by the herd may increase with
increased feeding concentration of DDGS. Recently, ethanol plants have sought to

94
partially remove the oil from DDGS and this oil may be used for biodiesel production
(Berger and Singh, 2010). Thus, reduced fat distillers grains and solubles (RFDDGS)
have become available to feed dairy cows. The RFDDGS has similar nutrient content to
that of DDGS with a lesser content of EE that average approximately 6 % DM (Foth et
al., 2015). The sulfur (S) content of ethanol byproduct feeds in some cases may exceed
1% of DM which is greater than expected based on its concentration in corn and it is
mainly due to sulfuric acid which is used in the ethanol production process (Kleinschmit
et al., 2006). Inclusion of DDGS in place of corn increases dietary P and S and generate
environmental challenges due to the potential increase of nutrient excretion.
Phosphorus is an important nutrient and its functions include structure and
strength of bones and cell walls, energy transfer, and buffering systems (Geisert et al.,
2010). However, ruminants are not efficient P utilizers and they excrete from 50 to 80%
of P consummed (Smith and Alexander, 2000). As a result, soil P concentration is high in
areas of intensive animal production where run off of P is most frequently observed.
According to Smith and Alexander (2000), P losses from animal feeding operation are
responsible for up to 47% of P discharges to surface water. Excreted P can be applied to
cropping lands and it is absorbed onto soil. As a result, P concentration in soil stockpile
and erodes into water (Pierzynski et al., 1994; NRC, 2001). Phosphorus is the limited
nutrient for most aquatic plants (Sharpey et al., 1994). Therefore, increasing the supply of
P promotes eutrophication of surface water, excessive oxygen consumption, and
reduction of oxygen in water and negatively affecting aquatic organisms. Excretion of P
is strongly correlated with P dietary intake (Morse et al., 1992b; Knowlton, 2001). In
dairy operations feeding P at concentrations greater than requirements may occur (Shaver
95
et al., 1995; Sink et al., 2000; Knowlton et al., 2001). Although a recent study suggested
that most dairy nutritionist had decreased the inclusion of dietary P (Harrison et al.,
2012), the inclusion of ethanol Co-products such as RFDDGS that contain greater
concentration of P presents new challenges when efforts are made to reduce P excretion.
Potassium excretion is important in terms of environmental impact. Although no
negative effect of K on water and soil has been reported, the EPA considers that K
excretion should be budgeted and that future regulations will include K as one nutrient
that has to be controlled and managed in dairy farms (Nennich, et al., 2005).
Trace minerals are also essential nutrients for dairy cattle. These elements are
associated with immune a reproductive function and the amount requirement for optimal
function may be at greater concentration that the amount to prevent deficiency. Elements
such as copper (Cu), selenium (Se), and iodine (I) may become toxic when fed at greater
concentrations. When manure is applied to croplands there is also a potential for trace
minerals to accumulate in the environment. Gustafson et al. (2007) estimated that about
90% or more of the output of Cu, manganese (Mn), and zinc (Zn) into the environment
in Sweden originates from dairy farms. Sheppard and Sanipelli (2012) indicated that Cu
and Zn could accumulate in soils that are managed to prevent P accumulation. There are
proposals to add trace minerals, including calcium (Ca), magnesium (Mg), K, S, sodium
(Na), iron (Fe), Mn, Zn, and Cu, to state regulated nutrient management plants (Castillo
et al., 2013). Consequently there is a growing need to further understand the relationship
between supply and excretion of trace minerals.
The aim of this study was to estimate nutrient excretion and apparent digestibility
of minerals on dairy cows fed a Co-product based diet (RFDDGS; Co-product diet).

96
Additionally, we compared the effect of breed across diets on nutrient excretion and
apparent digestibility to identify differences in mineral utilization between Jersey and
Holstein cows.
MATERIALS AND METHODS
Details of the experimental design, treatments, sample collection, and analysis are
presented in Foth et al. (2015). Briefly, multiparous Holstein (n=8) and Jersey (n=8)
cows averaging 93 ± 20 DIM at the beginning of the experiment with average BW of
690± 12.9 and 429 ± 13.0 kg, respectively, were fed 2 dietary treatments (Control or Co-
product) in a switchback experimental design. Diets included the Control which did not
contain any RFDDG, and Co-product in which the Co-product RFDDG was included at
30 % of the diet DM while partially replacing the corn and soybean meal (Foth et al.,
2015).
Individual feed ingredients were sampled (500 g) each day during the collection
period and frozen at -20°C. They were later composited by period and a subsample sent
to Cumberland Valley Analytical Services Inc. (Hagerstown, MD) for complete nutrient
analysis of DM (AOAC, 2000), ash (942.05; AOAC 2000), and minerals (985.01; AOAC
2000). Total fecal output was collected from each individual cow during the collection
period for 2 consecutive days. Feces were collected using aluminum pans placed in the
gutter behind the stall. Fecal samples were deposited into large containers (Rubbermaid,
Wooster, OH), subsampled, and frozen (-20 °C). Samples of feces, orts and feed
ingredient were composited according to cow and period, dried at 55 °C in a forced air
oven and ground to pass through a 1-mm screen (Wiley mill, Arthur H. Thomas Co.,

97
Philadelphia, PA) and were analyzed minerals (985.01; AOAC 2000) by Cumberland
Valley Analytical Services Inc. (Hagerstown, MD).
Net intake of each mineral was calculated by multiplying measured mineral
concentrations in feed by amount of feed offered (according to the proportion of each
ingredient in the diet) minus the amount of mineral in orts. The mineral fecal output was
calculated by multiplying the concentration of minerals by total DM fecal output.
Apparent digestibility of minerals was calculated as measured mineral intake minus
measured fecal output of each particular mineral divide by intake of each individual
mineral (Weiss and Wyatt, 2004).
Statistical Analysis
Data were analyzed using the GLIMMIX procedure of SAS (SAS Institute, 2008).
Treatment, breed, breed within block and period within block and breed, were modeled as
fixed effects while cow within block, based on calving date, was modeled as a random
effect. The LSMEANS option was used to generate least square means of treatments
listed in this study. Significance was declared at P ≤ 0.05.
RESULTS AND DISCUSSION
Body Weight, Intake, and Fecal Output
In this study the BW was 693.8 and 429.2 ± 12.9 for Holstein and Jersey
respectively (Table 3.1). In addition, BW was not affected by diet type and averaged
561.5 ± 9.2 kg (P = 0.13). As expected, the DMI intake of Holstein was greater than
Jersey cows (24.5 vs. 18.1 ± 0.68 kg, respectively; P < 0.01). However, DMI as a

98
percetntage of BW of Jersey was greater than that of Holstein cows by 19.2 % (4.22
vs.3.54 ± 0.13 DMI % of BW, respectively; P < 0.01). Diet had no effect (P = 0.86) on
DMI and averaged 21.3 ± 0.53 kg across breeds.
Fecal output was 21.4 % greater on Jersey compared to Holstein when it was
expressed as proportion of BW (1.36 vs. 1.12 ± 0.07 kg/100 kg BW, respectively; P <
0.01). The greater fecal output on Jersey is most likely the result of the greater DMI per
unit of BW observed on Jersey cows since the percent change was close to 20%. The
fecal DM output as a proportion of BW was greater on cows fed the Co-product
compared with the Control (1.30 vs. 1.18 ± 0.04 kg/100 kg BW, respectively; P = 0.01).
Since there was no difference in DMI per unit of BW between diets across breeds (P =
0.90), the greater fecal output per BW of Co-product diet is most likely the result of a
lesser digestibility of RFDDGS compared with corn and soybeans. Foth et al. (2015)
reported lesser apparent DM digestibility of Co-product diet compared to Control diet,
which is in line with the greater fecal output per BW of Co-product diet in our results.
This may also be related to greater NDF content of RFDDGS compared to corn which is
less digestible than corn carbohydrates.
Nutrient and Mineral Composition of Diets
The mineral concentration of ingredients and diets are reported in Table 3.2 and
3.3. Diets were formulated to comply with objectives of Foth et al. (2015) and the
mineral concentration of diets was the result of replacing corn and soybean by RFDDGS.
The Co-product concentrate containing RFDDGS had a greater content of P (0.9 vs.

99
0.6%), S (0.6 vs. 0.2%), Fe (413 vs. 375 mg/kg), Mn (162 vs. 136 mg/kg) and lesser
concentrate of Cu (56.1 vs. 62.3 mg/kg) than the Control concentrate (Table 3.2).
The Co-product diet had a greater content of Mg (0.33 vs. 0.28 ± 0.001 % DM), Na (0.40
vs. 0.31 ± 0.01 % DM), P (0.59 vs. 0.44 ± 0.01 % DM), Mn (96 vs. 83 ± 1.65 mg/kg),
and Zn (121 vs. 113 ± 2.5 mg/kg) than the Control diet (P = 0.01) (Table 3.3). The
Control diet had a greater content of Ca (1.11 vs. 1.02 ± 0.02 % DM), K (1.82 vs. 1.74 ±
0.001 % DM), and Cu (36 vs. 32 ± 0.62 mg/kg) than the Co-product diet (P < 0.01). The
P content of RFDDGS in the Co-product diet had a content of P of 1 % DM, resulting in
a greater content of P in the Co-product diet compared with the Control diet. The trace
minerals analyzed in this study included Fe, Cu, Mn, and Zn. The TM concentration in
the diets was expected since Co-product concentrate had a greater content of Mn, and Zn
and a lesser concentration of Cu than the Control concentrate.
Mineral intake
Net intake of nutrients was the total nutrient offered minus nutrients in orts both
estimated from feed and orts DM multiplied by nutrient concentration of feeds and orts,
respectively and it is reported in Table 3.4.
Cows fed the Control diet had greater net intake of Ca (239 vs. 221 ± 7.4 g/d), K
(387.7 vs. 371.1 ± 7.7 g/d), and Cu (0.76 vs. 0.70 ± 0.03 g/d) than Co-product treatment
(P = 0.04). This is an indication of the greater content of Ca, Cu, and K of Control diet
compared with Co-product diet as indicated in Table 3.3. Similarly, cows fed Co-product
diet had a greater intake of Mg (70.6 vs. 59.3 ± 1.45 g/d), Na (87.2 vs. 66.6 ± 3.35 g/d), P
(128.2 vs. 94.1 ± 4.36 g/d), Fe (6.68 vs. 6.07 ± 0.27 g/d), and Mn (2.1 vs. 1.7 ± 0.08 g/d)

100
than Control diet (P < 0.01). Previous studies reported that P intake was affected by the
P concentrations of feeds and it can fluctuate between 21 and 180 g/d with an average of
93 g/d (Weiss and Wyatt, 2004; Castillo, 2007). In our study the Control diet had a P
content of 0.44 % DM and P intake of 94 g which was similar to the averaged reported by
Weiss and Wyatt (2004). According Weiss (2012) diets with typical ingredients contain
between 0.3 to 0.4% P, the Co-product diet contained a greater P content of 0.59 %,
which resulted in 25 g greater than the average reported by Weiss and Wyatt (2004). The
Zn content was greater in the Co-product diet compared with the Control diet; as a result,
Zn net intake was numerically greater in the Co-product diet compared with the Control
diet (2.6 vs. 2.4 ± 0.09 g/d, respectively; P = 0.08).
To account for BW and DMI differences between breeds, intake of nutrients was
estimated as a proportion of BW (Table 3.5) and DMI (Table 3.6). As expected, Jersey
had a greater intake of Ca, K, Mg, Na, Cu, Mn, and Zn (P = 0.01). Nevertheless, intake of
P and Fe were similar between breeds. The greater mineral intake of Jersey was the result
of the greater DMI per unit of BW previously reported.
The largest difference observed between breeds in terms of nutrient intake per kg
of DMI was P. Holstein had a greater intake of P as a proportion of DMI compared with
Jersey cows (5.42 vs. 4.92 ± 0.14 g/ kg of DMI/d; P = 0.01). Even though there were
significant interactions (Ca, Mg, and Fe) of breed and diet when mineral intake was
estimated as a proportion of DMI, the effects were numerically small.

101
Nutrient and Mineral Composition of Feces
The chemical analysis of feces was reported in Table 3.7. There were interactions
of breed and diet for estimates of fecal Ca, Mn, and ash (P = 0.04), the cause for these
interactions are unknown.
Diet had no effect on the fecal concentration of K (1.0 ± 0.03 %DM), Fe (1129 ±
42 mg/kg), and Zn (347 ± 8.7 mg/kg) diet (P = 0.65). The Co-product diet produced
feces with greater concentrations of Mg (0.83 vs. 0.78 ± 0.02 % DM), Na (0.33 vs. 0.22 ±
0.03 % DM), and P (1.3 vs. 1.0 ± 0.06 % DM) than the Control (P < 0.01). The fecal
concentration of cows fed the Control had greater concentrations of Cu (92.5 vs. 83.2 ±
1.6 % DM) and Mn (360 vs. 323 ± 9.1 g/kg) than cows fed the Co-product diet.
The requirement of P is between 0.32 to 0.38 % DM (NRC, 2001) and the Co-
product diet had approximately 50% more than the requirement. It has been reported that
P excretion increases linearly with increases in P intake (Weiss and Wyatt, 2004; Wu et
al, 2000). Thus, the fecal P concentration for cows fed the Co-product diet was 30%
greater than cows fed the Control diet. This result was expected since the Co-product diet
had 34% more P compared to the Control diet.
Interestingly, the fecal Cu content of Jersey was greater than Holstein cows (91.1
vs 84.6 ± 1.83 g/kg, respectively; P = 0.01). Others have observed differences in Cu
requirement between Jerseys and Holsteins. Swecker (2014) found that Jersey was more
susceptible to Cu toxicosis, and that Jersey’s Cu requirements may be lesser to the
requirements of Holstein. However, the factors that cause a greater susceptibility of
Jersey to Cu toxicosis are unknown. The greater fecal Cu content of Jersey observed in
our study suggests a difference in Cu metabolism between breeds.

102
Minerals Excretion
The fecal output of minerals was estimated by multiplying the total fecal DM
output by the mineral concentration in feces (Table 3.6). Excretion was estimated in g per
day (Table 3.8), g per 100 kg of BW (Table 3.9), and g per kg of DMI (Table 3.10).
No effect of diet was observed on the excretion of Cu, and Mn and averaged
196.5 ± 6.17, 0.58 ± 0.02, and 2.3 ± 0.07 g/d, respectively (Table 3.8). The fecal output
of Zn was greater for cows fed the Co-product diet compared with Control diet (2.46 vs
2.23 ± 0.10 g/d, respectively; P = 0.02).
In this study we observed that Holstein P excretion was about 50 g/d greater on
the Co-product diet compared with the Control diet; while Jersey excretion of P was
about 19 g/d greater on the Co-product diet (Table 3.17). Evidently, Jersey fecal output in
g/d of N and minerals was lesser than Holstein cows, with variations generally
proportional to changes in DMI and BW. A study by Knowlton (2010) estimated an N
excretion of 243 and 162 g/d for Holstein and Jersey, respectively, which was attributed
to proportional differences in DMI and BW. In our study, similar estimates were
observed; although the difference between breeds was lesser, N excretion was 225 and
167 ± 7.71g/d for Holstein and Jersey, respectively.
Nutrient excretion per unit of BW was estimated to account for difference in
excretion due to BW. Diet had no effect (P = 0.12) on K, Cu, and Mn excretion (g/100 kg
BW), which was expected since there were not substantial differences in the content of
Cu, K, and Mn between diets. Cows fed the Co-product diet excreted more Mg (10.7 vs.
9.2 ± 0.32 g/100 kg BW), Na (4.3 vs. 2.7 ± 0.32 g/100 kg BW), P (16.3 vs. 11.4 ± 0.75
g/100 kg BW), and Zn (0.45 vs. 0.41 ± 0.02 g/100 kg BW) than the Control diet (P =

103
0.02). The greater fecal concentration of these minerals was expected since Co-product
diet had also greater content of Mg, Na, P, and Zn than the Control diet.
The Jersey cows had a greater excretion of K (13.4 vs. 10.4 ± 0.96 g/100 kg BW), Mg
(11.0 vs. 8.9 ± 0.47 g/100 kg BW), Cu (0.12 vs. 0.09 ± 0.01 g/100 kg BW), Mn (0.5 vs.
0.4 ± 0.02 g/100 kg BW), and Zn (0.48 vs. 0.38 ± 0.02 g/100 kg BW) compared to
Holstein cows (P = 0.01). The greater excretion of Jersey may be due to greater DMI per
unit of BW. However, breed had no effect on Na and P excretion, despite the DMI per
unit of BW difference, and averaged 3.6 ± 0.53 and 13.8 ± 1.13 g/100 kg of BW,
respectively (Figure 3.1). There were interactions for Ca and Fe excretion per 100 kg BW
(Table 3.17). For example, Holstein fecal output of Ca was not affected by diet and
averaged 30.8 ± 2.19 g/100 kg BW. However, Jersey cows fed the Control diet had a
greater fecal output than Jersey cows fed the Co-product diet (40.9 vs. 33.7 ± 2.2 g/100
kg BW). The cause for this difference is unclear; however, it may be due to a greater
content of Ca in the Control diet.
Additionally, excretion as a proportion of DMI was estimated to account for
differences in DMI. Cows fed the Co-product diet had a greater excretion of Mg (2.74 vs.
2.36 ± 0.05 g/DMI), Na (1.10 vs. 0.69 ± 0.08 g/DMI), P (4.23 vs. 2.95 ± 0.20 g/DMI),
and Zn (0.12vs. 0.10 ± 0.001 g/DMI) than Control diet (P = 0.01). The Co-product diet
had a greater concentration of Mg, Na, P, and Zn which most likely is the cause of the
greater excretion of these minerals in cows fed the Co-product diet. The P content of Co-
product diet was 34% greater than Control diet, the P excretion (g/DMI) was 43%
greater, suggesting a more than proportional increase with the Co-product diet (Figure
3.2). Similar results were reported by Knowlton and Herbein (2002) when P excretion
104
triplicated when P intake was doubled. In our study dietary P was 68% greater than the
NRC (2001) P requirement (0.35%DM), which is common when less expensive
byproduct are included in the diet (Stewart et al. 2012). Other studies reported linear
increases in P excretion when dietary P was greater than NRC (2001) P requirement
(Weiss and Wyatt, 2004; Morse et al, 1992).
Diet had no effect on excretion for N, Cu, K, and Mn when expressed as g per
unit of DMI . No effect of breed was observed in fecal output (g/DMI) for N, K, Mg, Mn,
Na, P, and Zn. Interestingly, breed had no effect on P excretion (g/DMI) despite Holstein
consumed 0.50 g more P per kg of DMI. The main difference found between breeds was
in terms of Cu excretion, which was greater in Jersey compared with Holsteins (0.029 vs.
0.026 ± 0.001 g/DMI; P < 0.01). A case of chronic Cu toxicosis was reported in a UK
herd by Bidewell et al. (2001), in which incidence of chronic Cu poisoning was 5% in
Jerseys and 0.4 % in Holsteins when cows were fed a high Cu ration (30-50 mg/kg Cu).
Swecker (2014) suggests that over supplementation of Cu should be avoided on Jersey. In
our study, greater Cu excretion possibly is related to a lesser Cu requirement of Jersey
which would agree with previous findings.
Apparent Digestibility of Minerals
The apparent digestibility of minerals was estimating as measured mineral intake
minus measured fecal output of mineral divided by intake of mineral multiplied by a
hundred (Weiss and Wyatt, 2004) (Table 3.16). Diet had no effect the apparent
digestibility of Ca, Fe, Mg, P and Zn. Apparent Ca digestibility was numerical greater
(19.7 vs. 16.6 ± 2.45 %; P = 0.21) for cows fed the Control diet compared with the Co-

105
product diet. The Control diet produced greater digestibility of Cu, K, and Na than the
Co-product diet. Interestingly, Cu and K were present in a greater concentration in the
Control diet, which implies that digestibility increased with greater dietary content. The
Cu digestibility can be reduced with S concentrations greater than 0.2% (NRC, 2001;
Swecker, 2014); in our study this could be the case since Co-product diet had a S content
of 0.40 % which is greater than the 0.22% in the Control diet and resulted in a lesser
digestibility of Cu in the Co-product diet. With respect to Na, its digestibility was lesser
in the Control diet, which implies that Na digestibility was reduced with greater Na
content. The Co-product diet produced a greater digestibility of Mn (-12.4 vs. -35.6 ±
4.68; P < 0.01) than the Control diet; meaning that greater digestibility was possible with
greater Mn content in the Co-product diet. The Mn digestibility was negative probably
because we did not take into account other sources of Mn such as Mn content of water
that can a significant source of this mineral (Castillo et al. 2007).
Breed had no effect on apparent digestibility of Ca, K, Mg, Mn, Na, P, and Zn
between breeds (P = 0.10). Nevertheless, Holstein had a greater (P = 0.03) digestibility of
Cu (21.9 vs. 13.7 ± 3.29 %) and Fe (-17.4 vs. -30.4 ± 5.55 %) compared with Jersey
cows. Du et al. (1996) reported that Jersey attained adequate Cu states when low
supplementation (11 mg/kg) was fed. Another study by Bidewell et al. (2012) observed
that Jersey were more susceptible to Cu toxicosis than Holstein when Cu was fed 30 to 50
mg/kg. Likewise, Swecker (2014) recommends that Cu supplementation should be
avoided in Jerseys. The lesser Cu digestibility of Jerseys observed in our study may be
associated with a lesser Cu requirement. Although data are limited, our findings suggest
that there may be difference in Cu metabolism between breeds.

106
Results on mineral excretion and digestibility are not necessarily representative
for the dairy population due to the limited number of cows in our study. Headboxes were
used as part of another experiment while measuring intake and excretion for the current
study; ignoring the effect of headboxes in the DMI is another potential source of error
that should be consider when estimating mineral apparent digestibility. There are other
sources of minerals that were not incorporated in this study such as mineral intake from
water, which should be included for future studies.
CONCLUSIONS
Manure excretion and apparent digestibility of minerals were estimated for
lactating dairy cows fed a corn based diet (Control) and a RFDDGS diet (Co-product).
Cows fed the Co-product diet had a greater intake of P, Mg, Mn, Na, Fe, and Zn than
cows fed the Control diet, which resulted from a greater concentration of these minerals
in the RFDDGS. As a result, excretion of P, Mg, and Na was increased in cows fed the
Co-product diet. Dairy farms that utilized RFDDGS can face environmental problems,
especially with excess output of P which is likely increase the environmental impact of
farms. The supplementation of minerals such as P is not necessary in diets utilizing Co-
products. No effect of breed was observed in mineral excretion as a proportion of BW
and DMI. The Jersey cows had a greater excretion and lesser digestibility of Cu
compared with Holstein. These observations indicate that Cu requirements for Jersey may
be lesser than the requirements for Jersey.

107
REFERENCES
AOAC International. 2000. Official Methods of Analysis. Vol. 1 and 2. 17th ed. AOAC
International, Gaithersburg, MD.
Berger, L., and V. Singh. 2010. Changes and evolution of corn coproducts for beef cattle.
J. Anim. Sci. 88:E143–150.
Bidewell C. A., Drew, J. R., Payne, J. H. 2012. Case study of copper poisoning in a
British dairy herd. Vet Rec., 170:464.
Birkelo, C.P., M.J. Brouk, and D.J. Schingoethe. 2004. The energy content of wet corn
distillers grains for lactating dairy cows. J. Dairy Sci. 87:1815–1819.
Capper, J. L., and Cady, R. A. 2012. A comparison of the environmental impact of
Jersey. J. Dairy Sci., 95 :165–176.
Council for Agricultural Science and Technology (CAST), 2002. Animal diet
modification to decrease the potential for nitrogen and phosphorus pollution. Issue
Paper No. 21. Ames, IA.
Castillo, A. R., Kebreab, E., Beever, D. E.,. Barbi, J. H, Sutton, J. D., Kirby, H. C,. and
France, J. 2001a. The effect of energy supplementation on nitrogen utilization in
lactating dairy cowws fed grass silgae diets. J. Anim. Sci. 79:240-246.
Castillo, A. R., Kebreab, E., Beever, D. E.,. Barbi, J. H, Sutton, J. D., Kirby, H. C,. and
France. 2001b. The effect of protein supplementation on nitrogen utilization in
lactating dairy cowws fed grass silgae diets. J. Anim. Sci. 79:247-253.
Castillo, A. R., St-Pierre, N. R., del Rio, N. S. 2013. Mineral concentration in diets,
water, and milk and their value in estimatin on-farm excretion of manure minerals in
lactating dairy cows. J Dairy Sci. 96(5):3388-98.
Castillo, A. R., Santos, J. E., Tabone, T. J. 2007. Mineral balances, including in drinking
water estimated for Merced County dairy herds. California Agriculture, 61:2.
Chandler, P. T. 1996. Enrionmental challenges as related to animal agriculture-dairy. Pp.
7-19 in Nutrient Manageent of Food Animals to Enhance and Protect the
Environment. E. T. Kornegay ed. CRC Press, Inc., Boca Raton, FL.
Chase, L. E. 1994. Environmental considerations in developing dairy rations. pp. 56-62 in
Proc. Cornell Nutri. Conf. feed Manuf., Rochester, NY. Cornell Univ., Ithaca, NY.

108
Clark, J. H., and Overton, T. R.. 1995. The dairy industry and dairy cattle nutrition in the
21st centur. pp. 4.59 in Proc. California Anim. Nutr. Conf., Fresno, CA. California
State Polytechnic University, Pomona, CA.
Clark, J. H., Klusmeyer, T. H., and Cameron, M. R.. 1992. Microbial protein synthesis
and flows of nitrogen fractions to the duodenum of dairy cows. J. Dairy Sci.
75:2304-2323.
Cochran, W., and Cox, G.M. 1957. Experimental designs. 2nd ed. John Wiley and Sons,
Inc., New York, NY.
Du Z., Hemken R.W., Harmon R.J. 1996. Copper Metabolism of Holstein and Jersey
Cows and Heifers Fed Diets High in Cupric Sulfate or Copper Proteinate. J. Dairy
Sci., 79 (10): 1873-1880.
Environmental Protection Agency (EPA). 2003. National pollution discrage elimination
system permit regulation and effluent limitation guidelines and standrads for
concentrated animal feeding operations (CAFOs). Final Rule. Fed. Regist. 68:7176-
7274.
Erickson, G., and Klopfenstein, T. 2010. Nutritional and management methods to
decrease nitrogen losses from beef feedlots. J. Animal Sci., 88(E. Suppl.): E172-
E180.
Foth A.J., Brown-Brandl T., Hanford K.J., Miller P.S., Gomez G.G., Kononoff P.J. 2015.
Energy content of reduced-fat dried distillers grains with solubles for lactating dairy
cows. J. Dairy Sci., 98 :7142-7152.
Geisert, B. G., T. J. Klopfenstein, C. N., Luebbe, M. K., and MacDonald, J. C. (2010).
Phosphorus requirement and excretion of finishing beef cattle fed different
concentrations of phosphorus. J. Anim. Sci. , 88:2393-2402.
Genther, O. N. 2015. The effect of trace mineral source and concentration on ruminal
digstion and mineral solubility. J. Dairy Sci., The effect of trace mineral source and
concentration on ruminal digestion and mineral solubility.
Gustafson, G. A., Salomon, E., Jonsson, S. 2007. Barn Balance calculations of Ca, Cu, K,
Mg, Mn, N, P, S, and Zn in a conventional and organic dairy farm in Sweden. Agr
Ecosyst Environ. 119(1-2):160-170.
Harrison, J. H., Knowlton, K. F., James, B., Hanigan, M. D., Stallings, C., and
Whitefield, E. 2012. Case study: National survey of barriers related to precision
phosphorus feeding. Prof. Anim. Sci. 28:564-568.

109
Hristove, A. N., Hanzen, W. and Ellworth, J. W. 2006. Efficiency of use of imported
nitrogen, phosphorus, and potassium and potential for reducing phosphorus imports
on Idaho dairy farms. J. Dairy Sci. 89:3702-3712.
Hubbert, F., E. Cheng, and W. Burroughs. 1958. Mineral requirements of rumen
microorganisms for cellulose digestion in vitro. J. Anim Sci. 17:559-568.
Kauffman, A. J., and St-Pierre, N. R. 2001. The relationship of milk urea nitrogen to
urine nitrogen excretion in Holstein and Jersey cows. . J. Dairy Sci. , 84:2284-2294.
Kebreab, E., A. R. Castillo, D. E. Beever, D. J. Humphries, and J. France. 2000. Effects
of management practices prior to and during ensiling and concentrate type on
nitrogen utilisation in dairy cows. J. Dairy Sci. 83: 1274-1285.
Kebreab, E., France, J., Mills, J. A., Allison, R., & Dijkstra, J. 2002. A dynamic model of
N metabolism in the lactating dairy cow and an assesment of impact of N excretion
on the environment. J. Anim. Sci, 80:248-259.
Kleinschmit, D. H., Schingoethe, D. J., Kalscheur, K. F., & Hippen, A. R. 2006.
Evaluation of various sources of corn dried distillers grains plus solubles for
lactating dairy cattle. . J. Dairy Sci., 89:4784-4794.
Knowlton, K. F., and Herbein, J. H. 2002. Phosphorus Partitioning During Early
Lactation in Dairy Cows Fed Diets Varying in Phosphorus Content. J. Dairy Sci. ,
85:1227-1236.
Knowlton, K. F., Wilkerson, V. A., Casper, D. P., & Mertens, D. R. (2010). Manure
nutrient excretion by Jersey and Holstein cows. J. Dairy Sci., 93:407-412.
Kohn, R. A., Z. Dou, J. D. Ferguson, and R. C. Boston. 1997. A sensitive analysis of
nitrogen losses from dairy farms. J. Environ. Manag. 50:417-428.
Lascano, G.J., G.I. Zanton, A.J. Heinrichs, and W.P. Weiss. 2010. Technical note: A
noninvasive urine collection device for female cattle: modification of the urine cup
collection method. J. Dairy Sci. 93:2691–2694.
Martinez, A., and D. C. Church. 1970. Effects of various mineral elements on in vivo
rumen cellulose digestion. J. Anim. Sci. 31:982-990.
Morse, D. H., H. Head, c. J. wilcox, H. H. Van Horn, C. D. Hissem, and B. Harris, Jr.
1992. Effects of concentration of dietary phophorous on amount and rout of
excretion. J. Dairy Sci. 75:3039-3049.
Nennich, T. D., Harrison, J. H., VanWieringen, L. M., Meyer, D., Heinrichs, A. J., Weiss,
W. P., Block, E. 2005. Prediction of Manure and Nutrient Excretion from Dairy
Cattle. J. Dairy Sci., 88:3721-3733.

110
NRC. 2001. Nutrient Requiremens of Dairy Cattle. 7th rev. ed. . Washington, DC: Natl.
Acad. Sci.
Oldham, J. D. 1984. Protein-energy interrelationship in dairy cows. J. Dairy Sci.
67:1090-1114.
Pell, A. N. 1992. Does ration balancing affect nutrient management? Pp. 23-31 in Proc.
Cornell Nutr. Conf. Feed Manuf., Rochester, NY. Cornell Univ., Ithaca, NY.
Pierzynski, G. M., J. T. Sims, and g. F. Vance. 1994. Soils and environmental Quality.
Boca Raton, FL. Lewis Publishers, CRC Press. 313 p.
Rodriguez, L. A., Stallings, C. C., & Herbein, J. H. 1997. Effect of Degradability of
Dietary Protein and Fat on Ruminal, Blood, and Milk components of Jersey and
Holstein Cows. J. Dairy Sci., 80:353-363.
Santos, F. A. P., Santos, J. E. P., Theurer, C. B., and Huber, J. T.. 1998. Effects of rumen-
undegrable protein on dairy cow performance: A 12-year literature review. J. Dairy
Sci. 81:3182-3213.
Sharpey, A. N., S. C. Chapra, R. Wederpohl, J. T. Sims, T. C. Daniel, and K. R. Reddy,
1994. Managing agricultural phosphorus for protection of surface waters: Issues and
options. J. Environ. Qual. 23:437-451.
Shaver, R., and W. T. Howard. 1995. Are we feeding too much phosphorus? Pages 280-
281 in Hoards Dairyman.
Sheppard, S. C., B. Sanipelli. 2012. Trace elments in feed, manure, and manured soils. J
Environ Qual. 41(6):1846-1856.
Sink, S. E., K. F. Knowlton, and J. H. Herbein. 2000. Economic and environmental
implications of overfeeding phosphorus on virginia dairy farms. J. Anim. Sci. 78
(Suppl. 2):4.(Abstr.)
Smith, R. A., & R. B., A. 2000. Sources of nutrients in the nations's watersheds. Ithaca,
NY: pp. 13-21 in Managing Nutrients and Pathogens from Animal Agriculture.
Natural Resource, Agriculture, and engineering Service (NRAES) .
St-Pierre, N. R., and C. S. Thraen. 1999. Animal grouping strategies sources of variation,
and economic factors affecting nutrient balance on dairy farms. J. Dairy Sci.
82(Suppl. 2):72-83.
Stewart, B. A., James, R. E. , Hanigan, M. D., and Knowlton, K. F.. 2012. Cost of
reducing protein and phosphorus content in dairy rations. Prof. Anim. Sci. 28: 115-
119.

111
Swecker, W. S. 2014. Trace Mineral Feeding and Assesment. Vet Clin Food Anim.
30:671-688.
Tamminga, S. 1992. Nutrition management of dairy cows as a contribution to pollution
Control. J. Dair Sci., 75:345-357.
Van Horn, H. H., Wilkie, A. C., Powers, W. J., & Nordstedt, R. A. 1994. Components of
dairy manure management systems. J. Dairy Sci., 77:2008-2030.
Weiss, W. P. 2004. Macromineral Digestion by Lactating Dairy cows: Factors affecting
digestibility of magnesium J. Dairy Sci., 87:2167-71.
Weiss, W. P., Wyatt, D. J. (2004). Macromineral Digestion by Lactating Dairy cows:
Estimating Phosphorus Excretion via Manure. J. Dairy Sci., 87:2158-66.
Wu, Z. 2000. Milk production and reproductive performance of dairy cows fed two
concentrations of phosphorus for two years. J. Dairy Sci. , 83:1052-63.

112
Table 3.1. Body weight, DMI, feces, and orts across breed (Control vs. Co-product) and diets (Holstein vs. Jersey)
Item
Diet1
Breed
P-value
Control Co-P SEM2
Holstein Jersey SEM
Diet Breed Interaction
BW, kg 562 558 9.15
693.8 429.2 12.9
0.13 < 0.01 0.94
DMI, kg 21.3 21.3 0.53
24.5 18.1 0.68
0.86 < 0.01 0.10
Orts, kg DM 1.59 1.35 0.29
1.86 1.08 0.37
0.32 0.14 0.05
Feces, kg DM 6.48 7.08 0.20
7.70 5.87 0.24
< 0.01 < 0.01 0.10
DMI, kg/100 kg BW 3.88 3.89 0.08
3.54 4.22 0.13
0.75 < 0.01 0.16
Orts, kg /100 kg BW 1.59 1.35 0.24
1.86 1.08 0.52
0.32 0.15 0.05
Feces, kg/ 100 kg BW 1.19 1.30 0.04 1.12 1.36 0.07 0.01 < 0.01 0.41
1Co-P = Co-product 2Highest standard error of treatment means is shown

113
Table 3.2. Chemical composition of Control, and Co-product concentrates1
Control Concentrate Co-P Concentrate2
Chemical, %DM Mean SD Mean SD
DM 88.8 0.50 89.6 0.76
Ca,% 1.5 0.21 1.4 0.33
P, % 0.6 0.05 0.9 0.23
Mg, % 0.4 0.01 0.5 0.03
K, % 1.4 0.06 1.2 0.04
S, % 0.2 0.01 0.6 0.05
Na, % 0.6 0.09 0.8 0.08
Cl, % 0.4 0.15 0.4 0.05
Fe, mg/kg 375.3 31.08 413.7 162.99
Mn, mg/kg 135.9 18.29 162.3 22.74
Zn, mg/kg 199.1 30.45 212.3 26.34
Cu, mg/kg 62.3 6.98 56.1 7.39 1Values determined by Cumberland Valley Analytical Services, Hagerstown, MD 2 Co-P = Co-product

114
Table 3.3. Mineral analysis of diets across breed (Control vs. Co-product) and diets (Holstein vs. Jersey)
Item Diet Breed P-value
Control Co-product SEM2
Holstein Jersey SEM2
Diet Breed Interaction
Ca, %DM 1.11 1.02 0.02
1.10 1.03 0.02
< 0.01 0.01 < 0.01
K, %DM 1.82 1.74 0.001
1.78 1.78 0.00
< 0.01 0.23 0.30
Mg, %DM 0.28 0.33 0.001
0.304 0.304 0.001
< 0.01 0.88 0.02
Na, %DM 0.31 0.40 0.01
0.35 0.37 0.01
< 0.01 0.20 0.10
P, %DM 0.44 0.59 0.01
0.54 0.49 0.01
< 0.01 0.01 0.17
Cu, mg/kg 36 32 0.62
34 34 0.61
< 0.01 0.82 0.05
Fe, mg/kg 292 313 9.10
334 271 9.71
0.07 < 0.01 0.03
Mn, mg/kg 83 96 1.65
89 90 1.62
< 0.01 0.78 0.09
Zn, mg/kg 113 121 2.59 116 118 3.06 0.01 0.76 0.04 1Highest standard error of treatment means is shown

115
Table 3.4. Minerals intake across breed (Control vs. Co-product) and diets (Holstein vs. Jersey).
Item Diet Breed P-value
Control Co-product SEM1 Holstein Jersey SEM1 Diet Breed Interaction
Intake, g/d
Ca 239 221 7.43
270 190 7.66
0.02 < 0.01 < 0.01
K 388 371 7.67
437 322 17.03
0.04 < 0.01 0.17
Mg 59.3 70.6 1.45
74.8 55.1 2.96
< 0.01 < 0.01 < 0.01
Na 66.6 87.2 3.35
86.9 66.9 3.79
< 0.01 < 0.01 0.01
P 94.1 128.2 4.36
132 90 4.36
< 0.01 < 0.01 < 0.01
Cu 0.76 0.70 0.03
0.84 0.63 0.03
0.04 < 0.01 0.05
Fe 6.07 6.68 0.27
7.90 4.85 0.27
0.03 < 0.01 < 0.01
Mn 1.74 2.06 0.08
2.16 1.64 0.08
< 0.01 < 0.01 0.01
Zn 2.42 2.60 0.09 2.86 2.16 0.10 0.08 < 0.01 0.02 1Highest standard error of treatment means is shown
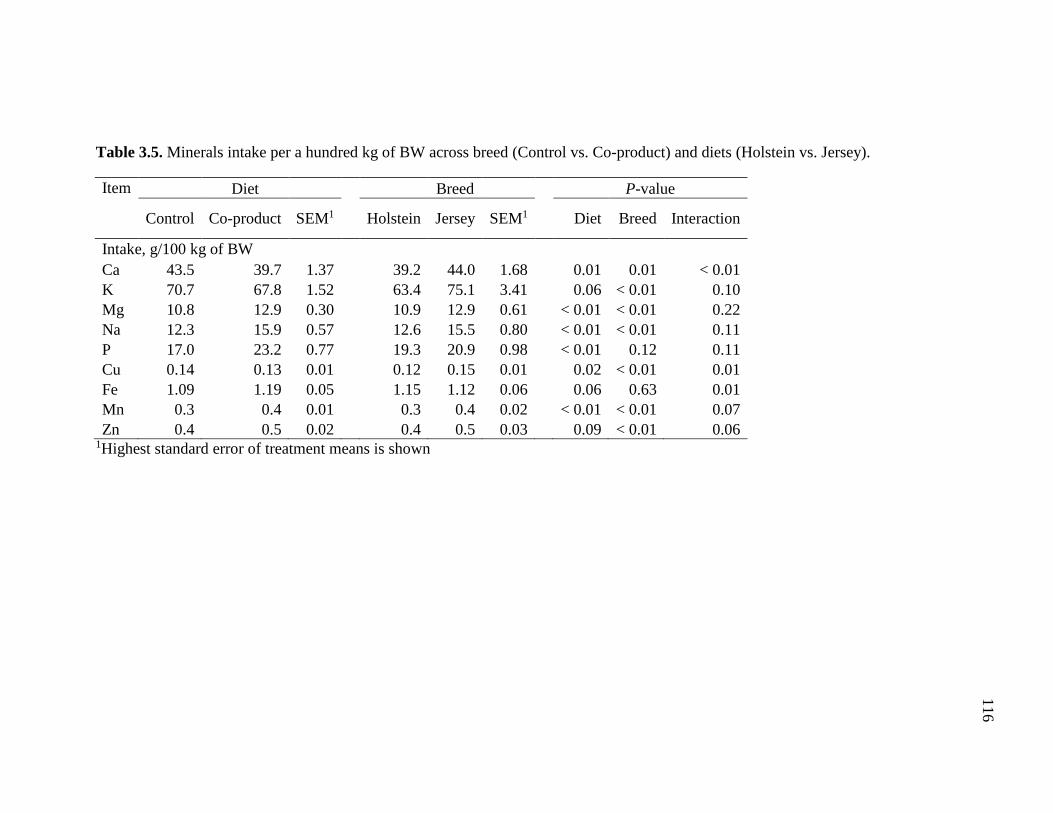
116
Table 3.5. Minerals intake per a hundred kg of BW across breed (Control vs. Co-product) and diets (Holstein vs. Jersey).
Item Diet Breed P-value
Control Co-product SEM1 Holstein Jersey SEM1 Diet Breed Interaction
Intake, g/100 kg of BW
Ca 43.5 39.7 1.37
39.2 44.0 1.68
0.01 0.01 < 0.01
K 70.7 67.8 1.52
63.4 75.1 3.41
0.06 < 0.01 0.10
Mg 10.8 12.9 0.30
10.9 12.9 0.61
< 0.01 < 0.01 0.22
Na 12.3 15.9 0.57
12.6 15.5 0.80
< 0.01 < 0.01 0.11
P 17.0 23.2 0.77
19.3 20.9 0.98
< 0.01 0.12 0.11
Cu 0.14 0.13 0.01
0.12 0.15 0.01
0.02 < 0.01 0.01
Fe 1.09 1.19 0.05
1.15 1.12 0.06
0.06 0.63 0.01
Mn 0.3 0.4 0.01
0.3 0.4 0.02
< 0.01 < 0.01 0.07
Zn 0.4 0.5 0.02 0.4 0.5 0.03 0.09 < 0.01 0.06 1Highest standard error of treatment means is shown

117
Table 3.6. Minerals intake per a kg of DMI across breed (Control vs. Co-product) and diets (Holstein vs. Jersey).
Item Diet Breed P-value
Control Co-product SEM1 Holstein Jersey SEM1 Diet Breed Interaction
Intake, g/kg of DMI
Ca 11.17 10.22 0.21
11.06 10.33 0.20
< 0.01 0.01 < 0.01
K 18.22 17.39 0.05
17.81 17.80 0.06
< 0.01 0.57 0.55
Mg 2.79 3.30 0.02
3.05 3.05 0.02
< 0.01 0.93 0.03
Na 3.14 4.06 0.08
3.53 3.66 0.07
< 0.01 0.24 0.10
P 4.37 5.96 0.14
5.42 4.92 0.14
< 0.01 0.01 0.18
Cu 0.04 0.03 0.001
0.03 0.03 0.001
< 0.01 0.84 0.05
Fe 0.28 0.31 0.01
0.32 0.26 0.01
0.04 < 0.01 0.03
Mn 0.08 0.10 0.002
0.09 0.09 0.002
< 0.01 0.73 0.08
Zn 0.11 0.12 0.003 0.12 0.12 0.003 0.02 0.86 0.08 1Highest standard error of treatment means is shown

118
Table 3.7. Mineral analysis of feces across breed (Control vs. Co-product) and diets (Holstein vs. Jersey) 1
Item Diet Breed P-value
Control Co-product SEM1 Holstein Jersey SEM1 Diet Breed
Breed x Diet
Ca, %DM 2.9 2.6 0.08
2.8 2.7 0.09
< 0.01 0.85 < 0.01
K, %DM 1.0 1.0 0.03
0.9 1.0 0.03
0.91 0.33 0.12
Mg, %DM 0.78 0.83 0.02
0.8 0.8 0.02
< 0.01 0.65 0.59
Na, %DM 0.22 0.33 0.03
0.3 0.3 0.03
< 0.01 0.97 0.08
P, %DM 0.97 1.27 0.06
1.2 1.1 0.07
< 0.01 0.35 0.30
Cu, mg/kg 92.5 83.2 1.65
84.6 91.1 1.83
< 0.01 0.01 0.47
Fe, mg/kg 1134 1124 42.0
1196 1063 46.9
0.84 0.05 0.03
Mn, mg/kg 360 323 9.12
349.0 334.2 11.25
< 0.01 0.36 0.55
Zn, mg/kg 345 350 8.65 341.0 353.6 8.74 0.65 0.29 0.93 1Values determined by Cumberland Valley Analytical Services, Hagerstown, MD 2Highest standard error of treatment means is shown

119
Table 3.8. Minerals excretion in feces across breed (Control vs. Co-product) and diets (Holstein vs. Jersey).
Item Diet Breed P-value
Control Co-product SEM1 Holstein Jersey SEM1 Diet Breed Interaction
Excretion, g/d
Ca 190 183 8.71
212 161 9.53
0.47 < 0.01 < 0.01
K 62.4 67.1 3.08
71.8 57.7 4.34
0.14 < 0.01 0.02
Mg 50.3 58.3 1.54
61.5 47.1 2.16
< 0.01 < 0.01 0.03
Na 14.3 23.6 1.68
21.6 16.3 2.99
< 0.01 0.09 0.01
P 62.3 89.7 4.61
89.4 62.6 5.89
< 0.01 0.00 0.02
Cu 0.59 0.58 0.02
0.65 0.53 0.03
0.62 < 0.01 0.15
Fe 7.4 8.1 0.43
9.2 6.3 0.43
0.12 < 0.01 0.01
Mn 2.3 2.3 0.07
2.7 1.9 0.11
0.66 < 0.01 0.06
Zn 2.23 2.46 0.10 2.61 2.08 0.10 0.02 < 0.01 0.17 1Highest standard error of treatment means is shown
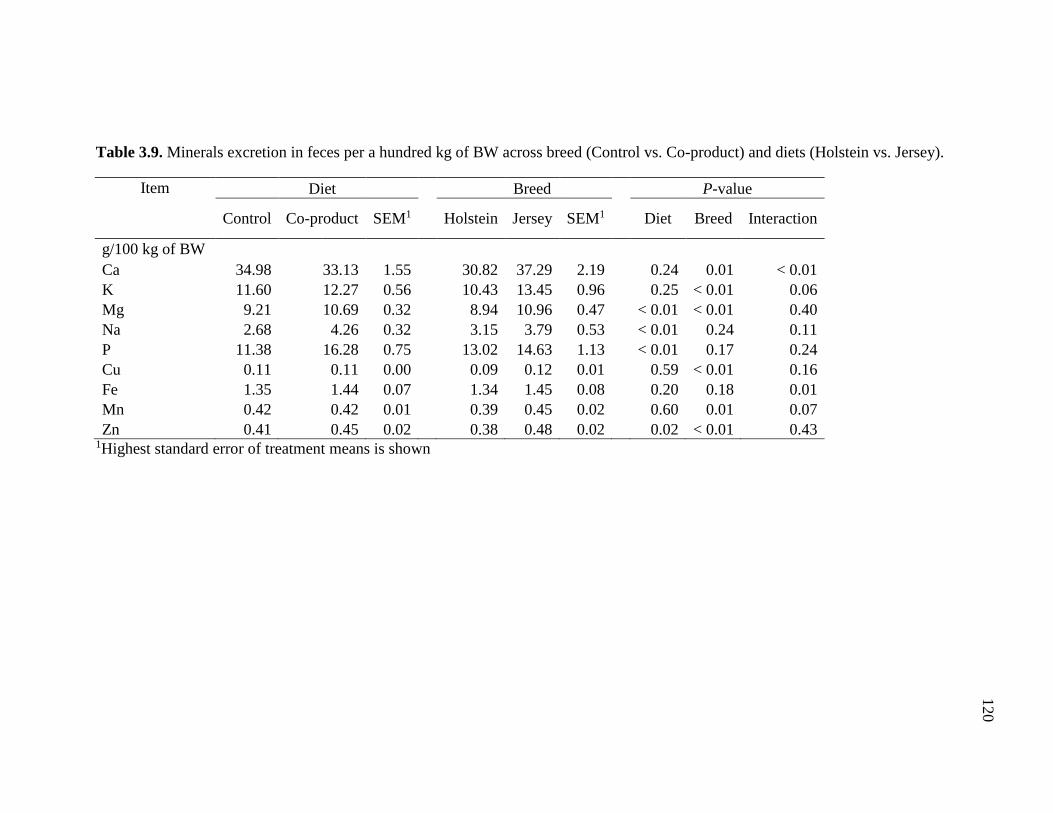
120
Table 3.9. Minerals excretion in feces per a hundred kg of BW across breed (Control vs. Co-product) and diets (Holstein vs. Jersey).
Item Diet Breed P-value
Control Co-product SEM1 Holstein Jersey SEM1 Diet Breed Interaction
g/100 kg of BW
Ca 34.98 33.13 1.55
30.82 37.29 2.19
0.24 0.01 < 0.01
K 11.60 12.27 0.56
10.43 13.45 0.96
0.25 < 0.01 0.06
Mg 9.21 10.69 0.32
8.94 10.96 0.47
< 0.01 < 0.01 0.40
Na 2.68 4.26 0.32
3.15 3.79 0.53
< 0.01 0.24 0.11
P 11.38 16.28 0.75
13.02 14.63 1.13
< 0.01 0.17 0.24
Cu 0.11 0.11 0.00
0.09 0.12 0.01
0.59 < 0.01 0.16
Fe 1.35 1.44 0.07
1.34 1.45 0.08
0.20 0.18 0.01
Mn 0.42 0.42 0.01
0.39 0.45 0.02
0.60 0.01 0.07
Zn 0.41 0.45 0.02 0.38 0.48 0.02 0.02 < 0.01 0.43 1Highest standard error of treatment means is shown

121
Table 3.10. Minerals excretion per a kg of DMI across breed (Control vs. Co-product) and diets (Holstein vs. Jersey).
Item Diet
Breed
P-value
Control Co-product SEM1 Holstein Jersey SEM1 Diet Breed Interaction
g/kg of DMI
N 9.19 9.29 0.15
9.21 9.27 0.16
0.60 0.82 0.55
Ca 8.93 8.54 0.31
8.70 8.77 0.35
0.27 0.91 0.01
K 2.94 3.18 0.11
2.95 3.17 0.12
0.10 0.19 0.17
Mg 2.36 2.74 0.05
2.52 2.58 0.04
< 0.01 0.34 0.93
Na 0.69 1.10 0.08
0.89 0.91 0.10
< 0.01 0.91 0.07
P 2.95 4.23 0.20
3.69 3.49 0.23
< 0.01 0.54 0.29
Cu 0.028 0.028 0.001
0.026 0.029 0.001
0.56 <0.01 0.57
Fe 0.35 0.38 0.016
0.38 0.34 0.017
0.14 0.13 0.04
Mn 0.11 0.11 0.003
0.11 0.11 0.004
0.52 0.75 0.34
Zn 0.10 0.12 0.003 0.11 0.11 0.003 0.01 0.15 0.91 1Highest standard error of treatment means is shown

122
Table 3.11. Minerals apparent digestibility across breed (Control vs. Co-product) and diets (Holstein vs. Jersey).
Item Diet Breed P-value
Control Co-product SEM1 Holstein Jersey SEM1 Diet Breed Interaction
Digestibility, %
Ca 19.7 16.6 2.45
21.4 14.9 3.75
0.21 0.10 0.55
K 83.8 81.6 0.82
83.2 82.1 1.05
0.01 0.30 0.22
Mg 15.5 16.9 2.08
17.2 15.3 2.08
0.50 0.36 0.68
Na 77.8 72.6 1.98
75.3 75.1 4.15
0.01 0.97 0.11
P 32.3 29.7 2.14
32.6 29.3 3.84
0.24 0.39 0.88
Cu 21.0 14.7 2.85
21.9 13.7 3.29
0.04 0.02 0.23
Fe -25.5 -22.2 5.55
-17.4 -30.4 5.55
0.56 0.03 0.58
Mn -35.6 -12.4 4.68
-26.8 -21.2 5.72
< 0.01 0.34 0.24
Zn 7.25 2.22 4.87 6.85 2.62 4.87 0.31 0.39 0.52 1Highest standard error of treatment means is shown

123
Table 3.12. Simple effects of variables with significant interactions.
Holstein Jersey P-value
Item Control Co-product Control Co-product SEM1 Diet Breed Interaction
Diet chemical analysis, %DM
Ca 1.10 1.10
1.12 0.95 0.02 < 0.01 0.01 < 0.01
Mg 0.28 0.33
0.28 0.33 0.00 < 0.01 0.88 0.02
Fe, mg/kg 310 358
273 269 9.10 0.07 < 0.01 0.03
Zn, mg/kg 110 123
117 118 3.06 0.01 0.76 0.04
Feces chemical analysis, %DM
Ash, %DM 14.21 15.28
14.44 13.63 0.42 0.74 0.25 0.02
Ca, %DM 2.81 2.72
3.09 2.40 0.09 0.00 0.85 < 0.01
Fe, mg/kg 1145 1247
1124 1001 46.92 0.84 0.05 0.03
Intake, g/d
Ca 266 273
212 168 7.66 0.02 < 0.01 < 0.01
Cu 0.84 0.84
0.69 0.57 0.03 0.04 < 0.01 0.05
Fe 7.13 8.67
5.01 4.69 0.27 0.03 < 0.01 < 0.01
Mg 66.8 82.8
51.9 58.4 2.96 < 0.01 < 0.01 < 0.01
Mn 1.89 2.44
1.59 1.69 0.08 < 0.01 < 0.01 0.01
Na 71.5 102.2
61.7 72.2 3.79 < 0.01 < 0.01 0.01
P 108 157
80 99 4.36 < 0.01 < 0.01 < 0.01
Zn 2.65 3.06
2.19 2.13 0.10 0.08 < 0.01 0.02
Intake, %BW
Ca 38.4 40.0
48.6 39.4 1.68 0.01 0.01 < 0.01
Cu 0.12 0.12
0.16 0.13 0.01 0.02 < 0.01 0.01
Fe 1.03 1.27
1.15 1.10 0.06 0.06 0.63 0.01
Intake, g/kg DMI
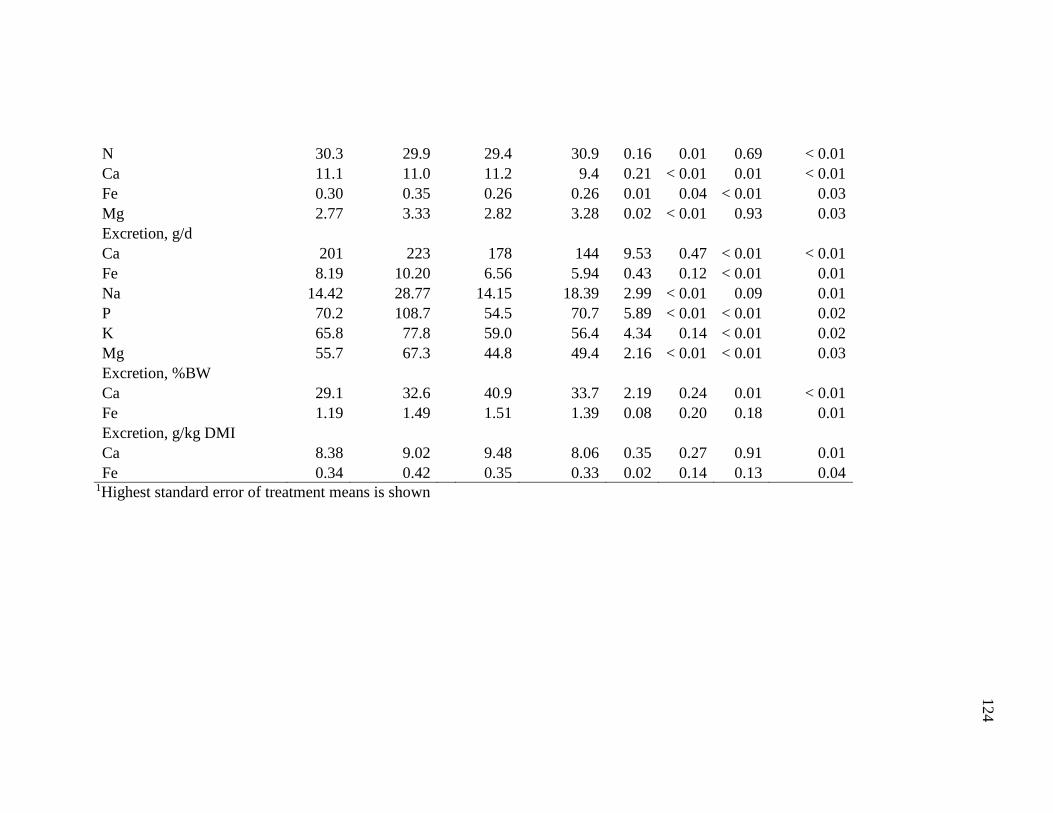
124
N 30.3 29.9
29.4 30.9 0.16 0.01 0.69 < 0.01
Ca 11.1 11.0
11.2 9.4 0.21 < 0.01 0.01 < 0.01
Fe 0.30 0.35
0.26 0.26 0.01 0.04 < 0.01 0.03
Mg 2.77 3.33
2.82 3.28 0.02 < 0.01 0.93 0.03
Excretion, g/d
Ca 201 223
178 144 9.53 0.47 < 0.01 < 0.01
Fe 8.19 10.20
6.56 5.94 0.43 0.12 < 0.01 0.01
Na 14.42 28.77
14.15 18.39 2.99 < 0.01 0.09 0.01
P 70.2 108.7
54.5 70.7 5.89 < 0.01 < 0.01 0.02
K 65.8 77.8
59.0 56.4 4.34 0.14 < 0.01 0.02
Mg 55.7 67.3
44.8 49.4 2.16 < 0.01 < 0.01 0.03
Excretion, %BW
Ca 29.1 32.6
40.9 33.7 2.19 0.24 0.01 < 0.01
Fe 1.19 1.49
1.51 1.39 0.08 0.20 0.18 0.01
Excretion, g/kg DMI
Ca 8.38 9.02
9.48 8.06 0.35 0.27 0.91 0.01
Fe 0.34 0.42 0.35 0.33 0.02 0.14 0.13 0.04 1Highest standard error of treatment means is shown

125
Figure 3.1. P excretion of Holstein and Jersey lactating cows fed Co-product and Control
diets in g per kg of DMI.
Figure 3.2. P excretion of Holstein and Jersey lactating cows fed Co-product and
Control diet in g 100 kg of BW.
0
0.5
1
1.5
2
2.5
3
3.5
4
4.5
5
Control Co-P Control Co-P
Holstein Holstein Jersey Jersey
P e
xcr
etio
n (
g/k
g D
MI)
Holstein Control
Holstein Co-P
Jersey Control
Jersey Co-P
0
2
4
6
8
10
12
14
16
18
20
Control Co-P Control Co-P
Holstein Holstein Jersey Jersey
P e
xcr
etio
n (
g/1
00k
gB
W)
Holstein Control
Holstein Co-P
Jersey Control
Jersey Co-P