effects of vertical wind shear on tropical cyclone ...people.duke.edu/~barros/for...
TRANSCRIPT
Effects of Vertical Wind Shear on Tropical Cyclone Precipitation
MATTHEW T. WINGO* AND DANIEL J. CECIL
University of Alabama in Huntsville, Huntsville, Alabama
(Manuscript received 19 December 2008, in final form 18 September 2009)
ABSTRACT
The response of the precipitation field for tropical cyclones in relation to the surrounding environmental
vertical wind shear has been investigated using ;20 000 snapshots of passive-microwave satellite rain rates.
Composites of mean rain rates, 95th percentile rain rates, and rain coverage were constructed to compare how
the spatial distribution of the precipitation was organized under varying environmental shear. Results
indicated that precipitation is displaced downshear and to the left (right for Southern Hemisphere) of the
shear vector. The amplitude of this displacement increases with stronger shear. The majority of the asym-
metry found in the mean rain rates is accounted for by the asymmetry in the occurrence of heavy rain.
Although rain is common in all quadrants of the sheared tropical cyclones, heavy rain ($8 mm h21 at the
;25-km scale) is comparatively rare in the upshear-right quadrant. It is shown that the effect that shear has on
the rain field is nearly instantaneous. Strong westerly shear formed slightly more asymmetric patterns than
strong easterly shear.
1. Introduction and background
Several studies have investigated the effects that ver-
tical wind shear has on tropical cyclones (TCs) and their
precipitation fields. The majority of these have been
numerical model simulations (e.g., Jones 1995; Frank
and Ritchie 1999, 2001; Rogers et al. 2003) or individual
case studies (e.g., Black et al. 2002). A few exceptions are
Lonfat et al. (2004), Chen et al. (2006), and Cecil (2007).
This study aims to complement the previous studies
by utilizing a robust sample set of satellite-derived rain
rates to investigate the spatial effects TC precipitation
encounters with respect to vertical wind shear.
a. Numerical studies
A series of modeling studies have shown mechanisms
by which the downshear and downshear-left regions are
favored for upward motion and precipitation. Dry,
adiabatic simulations (e.g., Jones 1995; Frank and Ritchie
1999) identify two mechanisms for asymmetric vertical
motion. First, the upper and lower portions of the vortex
experience differential advection and the vortex tilts in
response to the vertical wind shear. Mutual corotation of
the upper and lower vortices causes the direction of tilt to
rotate cyclonically from the shear vector. The direction of
tilt is generally aligned a bit to the left of the shear vector.
The potential vorticity advection induces a secondary
circulation with adiabatic uplift in the downtilt direction
(beneath the upper-level potential vorticity anomaly) in
order to maintain balance. This uplift distorts the poten-
tial temperature field, and vortex flow along these dis-
torted isentropes yields adiabatic uplift on the right side
of the tilt vector.
In moist simulations (e.g., Frank and Ritchie 1999),
latent heat release counteracts the adiabatic cooling and
limits the second lifting mechanism (adiabatic uplift on
the right side of the tilt vector). This leaves the sec-
ondary circulation associated with the potential vorticity
anomaly forcing upward motion in the downtilt di-
rection. Ueno (2008) noted that this vertical motion
asymmetry introduces an asymmetry in the water vapor
distribution, with the driest air to the upshear right as it
exits the subsident region. This dry air does not saturate
when initially lifted as it enters the downshear–downtilt
region, and precipitation is instead displaced cycloni-
cally (to the downshear-left region). This does not
account for precipitation being carried cyclonically as it
* Current affiliation: Wyle Information Systems, McLean, Virginia.
Corresponding author address: Daniel J. Cecil, University of
Alabama in Huntsville, 320 Sparkman Dr. NW, Huntsville, AL
35805.
E-mail: [email protected]
VOLUME 138 M O N T H L Y W E A T H E R R E V I E W MARCH 2010
DOI: 10.1175/2009MWR2921.1
� 2010 American Meteorological Society 645

falls, which would further contribute to a left-of-shear
precipitation enhancement.
Frank and Ritchie (2001) investigated how tropical cy-
clone intensity and structure are affected by environmental
vertical wind shear magnitude. The strong shear (15 m s21)
case began to weaken within 3 h while the weak shear case
(5 m s21) did not weaken until ;36 h. A clear wave-
number-1 asymmetry (with maxima of rainfall and convec-
tion on the downshear-left side) did develop within a few
hours for both the weak and strong shear cases, although
this asymmetry did occur more rapidly for the 15 m s21
simulation. A similar asymmetry was noted in Rogers
et al.’s (2003) simulation of Hurricane Bonnie (1998)
during strong environmental shear, but the precipitation
pattern quickly became symmetric when the shear relaxed.
Ueno (2007) developed a formula relating the magnitude
of the upward motion asymmetry to both the magnitude of
the vertical shear and the intensity of the vortex.
Ritchie and Frank (2007) examined how planetary
vorticity affects vertical wind shear in simulated tropical
cyclones in the absence of environmental shear. Vertical
wind shear was generally light and variable for the
constant f storm, but the variable f storm developed
significant vertical wind shear (850–200 hPa) ranging
between 7 and 12 m s21. For both, the wind field below
400 hPa varied little. The majority of the change in shear
was due to changes within the upper-level outflow
region. Shear for the variable f storm was consistently to
the south-southeast or southeast. Such directions sug-
gest that the shear developed from the advection of
planetary vorticity will reduce (increase) southeasterly
(northwesterly) environmental shear overall.
b. Observational composites
Corbosiero and Molinari (2002) used the National
Lightning Detection Network (NLDN) to gather flash
locations from 35 Atlantic tropical cyclones near the U.S
coast. Vertical wind shear (850–200 hPa) was computed
using the European Centre for Medium-Range Weather
Forecasts (ECMWF) analyses over a 500-km radius after
a vortex removal method was applied. Within a radius of
300 km more than 90% of the flashes occurred in the
downshear region of the storm. Within 100 km, there was
a slight downshear left preference; however, between 100
and 300 km, this preference shifted to the downshear
right. Observational constraints limited this study to
tropical cyclones at relatively high latitudes and near land
(i.e., near the United States).
Lonfat et al. (2004) was one of the first studies to
incorporate a large sample set of passive-microwave-
derived rain rates to investigate spatial distributions
of rain in tropical cyclones. Using Tropical Rainfall
Measuring Mission (TRMM) Microwave Imager (TMI)
data from 1998 to 2000, they were able to capture 260
individual storms resulting in 2121 instantaneous pre-
cipitation observations. The data was then put through a
first-order Fourier decomposition to determine the asym-
metry relative to the storm motion. Chen et al. (2006) used
the same TMI dataset and methodology, but examined
asymmetries relative to the 200–850-hPa environmental
shear vector. The maximum relative asymmetry was
found in the front quadrants relative to storm motion and
shifted from the left to the right [in the Northern Hemi-
sphere (NH); opposite in Southern Hemisphere (SH)] as
intensity was increased from tropical storms to major
hurricanes. The shape of the asymmetry did not alter for
faster-moving TCs (.5 m s21), but the overall amplitude
of the asymmetry did significantly increase. Relative to
vertical wind shear, the rainfall asymmetry maximum
occurs downshear left (right) in the NH (SH) and in-
creases (decreases) with shear strength (TC intensity).
The western North Pacific and South Pacific TCs were
found to have the smallest asymmetry, while the Indian
Ocean (both SH and NH) TCs had the largest.
Corbosiero and Molinari (2003) noted that the front-right
quadrant favored by storm motion and the downshear-left
quadrant favored by shear often overlap in their sample.
By examining subsets where motion and shear favor op-
posing regions, they found that the effects of storm mo-
tion tend to be secondary to the effects of vertical shear
when determining the relative asymmetry of the lightning
flash locations. Similarly, Chen et al. (2006) and Ueno
(2007) found that the downshear-left quadrant is favored
for greater rain rates even when storm motion is in the
opposite direction or right of shear. The magnitude of the
asymmetry was greatest, though, when the shear vector
and storm motion were oriented in the same direction or
when storm motion was 908 to the left (right for SH) of the
shear vector. Ueno (2007) pointed out that low-latitude
western North Pacific vertical wind profiles tend to favor
storm motion to the right of the shear vector, with motion
to the left of the shear vector favored in midlatitudes (as
in the Corbosiero and Molinari studies).
Cecil (2007) looked at how environmental vertical
wind shear interacted with tropical cyclone rain rates in
the Atlantic basin from 1988 to 2004. The rain-rate al-
gorithm (Wentz and Spencer 1998) used for Cecil (2007)
is the predecessor for the one used in this study. Vertical
wind shear (200–850 hPa) was obtained from the Sta-
tistical Hurricane Intensity Prediction Scheme (SHIPS;
DeMaria et al. 2005) developmental database. These
initial results agreed with the previous observational and
theoretical studies by showing that hurricane precip-
itation was enhanced in the downshear-left region of the
storms. Tropical storms had much lower rain rates and
646 M O N T H L Y W E A T H E R R E V I E W VOLUME 138

were displaced more downshear compared to downshear
left for their hurricane counterparts.
The work presented here expands upon past studies in
several ways: by extending the analysis to include other
characteristics of the rain rates and vertical shear, re-
fining the analysis techniques previously used, and
expanding the database of satellite-derived rain rates.
Specifically, the impact of vertical shear on different
portions of the distribution of tropical cyclone rain rates,
including both rain coverage and heavy rain coverage, is
included. Also, preliminary comparisons of the impact
of different layers of vertical shear are included here.
Several improvements to the techniques used in past
studies are performed here. Whereas Lonfat et al. (2004),
Chen et al. (2006), and Ueno (2007) discuss relative am-
plitudes of Fourier components; this study presents re-
trieved rain-rate values (mm h21) themselves. This study
improves upon Cecil (2007) by using the Remote Sensing
Systems (RSS) version 4 algorithm (Hilburn and Wentz
2008). The hurricane inner-core mean rain rates are over
50% lower for the new RSS algorithm than for the older
algorithm used by Cecil (2007), and are between the
mean values from TRMM standard products 2A12 and
2A25 (Cecil and Wingo 2009). Unlike in Cecil (2007), the
shear is calculated from the 40-yr ECMWF Re-Analysis
(ERA-40; Uppala et al. 2005) using a different approach
(described in section 2). The rain rates are composited
into octants instead of quadrants. More importantly,
the rain-rate grid is rotated with respect to the shear
vector before assigning the octants, providing greater
accuracy when assigning location relative to the shear
vector. Instead of just the Atlantic, this study branches
out to include all active tropical cyclone basins, signifi-
cantly expanding the sample size and allowing for com-
parisons of basins. SH shear-relative grids are flipped
before compositing them with NH cases.
2. Data and methods
a. Sample size
The 15 yr (1988–2002) of passive-microwave observa-
tions used for this study result in 20 028 instantaneous
tropical storm and hurricane rain-rate retrievals from
1131 individual storms across all active tropical cyclone
basins (Table 1). Of these, 6219 are hurricane co-
incidences comprising 620 individual hurricanes. The 1-
min maximum wind was extracted from best-track data
files obtained from the National Hurricane Center and
the Joint Typhoon Warning Center. For this paper,
hurricane is used to describe any tropical cyclone with
winds greater than or equal to 64 kt (32 m s21), re-
gardless of ocean basin. Tropical storms (maximum
sustained winds between 17.5 and 31 m s21) have more
than twice the sample size of hurricanes. The discrep-
ancy between the numbers of individual tropical storms
and overall storm totals arises when there were no rain-
rate retrievals while the tropical cyclone was at tropical
storm intensity, but there was a retrieval for the same
storm at hurricane intensity. Note that storms that
traversed through multiple basins are given a count of
one for each basin it traveled through for Table 1.
b. Rain rates
The precipitation dataset consists of a large sample
of satellite-derived rain rates from passive-microwave
radiometers [i.e., the Special Sensor Microwave Imager
(SSM/I), TMI, Advanced Microwave Scanning Radi-
ometer for Earth Observing System (EOS) (AMSR-E)]
from 1988 to 2002, using the latest (SSM/I version 6,
TMI version 4, AMSR-E version 5) RSS retrievals
(Hilburn and Wentz 2008). To unify these various sen-
sors, the microwave radiometer brightness temperatures
were intercalibrated by RSS. The differing footprint
sizes from these sensors are accounted for through
nonuniform beam-filling corrections in the RSS algo-
rithm. The sea surface temperature, surface wind speed,
columnar water vapor, columnar cloud water, and sur-
face rain rate are all simultaneously retrieved by the
RSS algorithm. The rain partition of the algorithm
retrieves liquid water attenuation at 19 and 37 GHz to
compute a total columnar liquid. This total columnar
liquid is then averaged over an assumed height to pro-
duce a mean column rain rate, which is assumed to be
TABLE 1. Number of tropical cyclones and satellite coincidences.
Atlantic
Central
Pacific
Indian
Ocean (NH)
Northeast
Pacific
Northwest
Pacific
Southern
Hemisphere
(IO and SP) All basins
Individual hurricanes 82 14 18 111 253 142 620
Individual tropical storms 151 39 59 205 390 264 1108
Individual storms 151 42 60 208 401 269 1131
Hurricane overpasses 1151 82 113 930 2692 1251 6219
Tropical storm overpasses 2399 260 425 2169 5408 3148 13 809
MARCH 2010 W I N G O A N D C E C I L 647

the surface rain rate. The brightness temperature mea-
surements used as inputs to the algorithm have footprint
sizes up to 69 3 43 km (for the SSM/I 19-GHz channel).
However, RSS releases the retrievals on a fixed 0.25 3
0.25 grid. It is important to note that the RSS algorithm
only retrieves rain rates over oceans beyond a 50 km
buffer away from coastlines.
Cecil and Wingo (2009) examined the differences
between four TRMM satellite-derived rain-rate prod-
ucts, including the ones used in Cecil (2007; RSS version 3)
and this study (RSS version 4). The other two were the
TMI 2A12 (version 6) and the Precipitation Radar (PR)
2A25 (version 6), which were scaled down to match the
0.258 grid of the RSS rain rates to enable a direct com-
parison between the algorithms. Only identical pixel
locations were used for the analysis. Results indicated
that the majority of the differences between the prod-
ucts had to do with their rain-rate magnitudes, although
the scaled-down 2A25 did reveal more storm structure.
Overall, RSS version 3 produced a factor of 2 more rain
than the other products. This was mainly because of the
frequent occurrence of high rain rates, although the
product limited them to 25 mm h21. This internal limit
is not present in the updated RSS version 4 product,
which instead produces the most rain around ;10
mm h21. The PR 2A25’s higher native resolution and
greater dynamic range allow for much greater rain-rate
values even on the scaled-down grid. The PR 2A25
produces the second most rain within 100 km of storm
center for hurricanes. Coming in last is the 2A12 with the
least production of rain, mainly because of the relative
lack of heavy rain. But, 2A12 does produce the most
moderate rain (;5 mm h21) for both tropical storms
and hurricanes. These findings are important because it
shows how using different products may result in dif-
ferences of precipitation magnitude, but the overall
spatial trends associated with the precipitation field re-
main close.
The RSS rain rates were averaged over a polar grid
consisting of 50-km radial bins out to 400 km, sliced by
458 azimuthally. The grid is aligned along the vertical
wind shear vector in this paper. The rain composites
have the polar grid contoured for simplicity. Using the
same polar grid as for the mean rain rates, composites of
rain coverage were constructed. This consists of the ratio
of raining 0.258 3 0.258 pixels versus the total number of
pixels in each bin. Composites of heavy rain coverage
were created similarly, using rain-rate values .8 mm h21.
This value was obtained by examining histograms
(Fig. 1; adapted from Cecil and Wingo 2009) of rain
rates. Over a quarter degree grid, 8 mm h21 is a rela-
tively ‘‘heavy’’ rain rate. Figure 1 indicates that rain
rates at 8 mm h21 and above give a sizeable contribu-
tion to tropical cyclone rainfall in the RSS algorithm. To
examine the high end of the rain-rate distribution, we
also compute the 95th percentile of the 0.258 rain rates.
c. Vertical wind shear
Environmental vertical wind shear (200–850 hPa) was
computed for each satellite overpass using ERA-40
(Uppala et al. 2005) model data at 1.1258 resolution
between 1 January 1988 and 31 August 2002. Often
times the ERA-40’s location for storm center did not
completely agree with the best-track fix. Since the
model’s representation of the storm center is more
important than the best track’s for the shear calculation,
an attempt to find the ERA-40 storm center was im-
plemented. The location of the ERA-40 925-hPa grid
box with the highest absolute vorticity within a 150-km
radius from the best-track fix takes precedence over the
best-track fix as the storm location. Prior to the shear
vector calculation, the TC vortex was removed following
a method suggested by M. DeMaria (2007, personal
communication), where the mean radial and tangential
winds are subtracted out as a function of range.
FIG. 1. Percentage of occurrence of rain rates for four TRMM retrievals, 0–100 km from the TC center for (a) category 3–5 hurricanes,
(b) category 1–2 hurricanes, and (c) tropical storms. Histograms are computed with 1 mm h21 bin size, with values plotted at the high end of
that bin (the plotted value at 1 mm h21 corresponds to the .0–1 mm h21 range). Only PR 2A25 has rain rates above 30 mm h21; those higher
rain rates are included in the 30 mm h21 bin for plotting purposes. RSS V04 is used in this study. (Figure courtesy of Cecil and Wingo 2009.)
648 M O N T H L Y W E A T H E R R E V I E W VOLUME 138

Next, the mean wind vector was computed over a 200–
800-km annulus. An annulus is used to reduce contam-
ination in the shear calculation for two main reasons:
1) attempts to correct for the disagreement between the
ERA-40 and best-track fix may have been unsuccessful
and 2) some remnants of the vortex may be present even
after the winds are filtered. To complete the shear cal-
culation, the 850-hPa mean wind vector is subtracted
from its 200-hPa counterpart. The shear vector values
are then linearly interpolated between the 6-h ERA-40
time periods to match the time of the satellite overpass.
Following earlier studies, shear has been broken down
into three categories: weak (,5 m s21), moderate (be-
tween 5 and 10 m s21), and strong (.10 m s21). Figure 2b
shows that the strong shear sample is the smallest with
1605 cases, while the moderate sample is the largest with
2505. The peak number of cases occurs for hurricanes
with 5 m s21 of shear, which is the minimum threshold
for the moderate category. This is perhaps a poor
place to split the ‘‘weak’’ and ‘‘moderate’’ samples; al-
though further investigation revealed little change
within the results when applying different bounds for the
shear categories (not shown in this paper). For the
hurricane sample set, the maximum and minimum shear
magnitudes are 36 and 0.1 m s21, respectively. The
majority of hurricanes experience southwesterly or
westerly shear, with a secondary peak of northeasterly
shear (Fig. 2a). Northeasterly shear is most common
within the northeastern Pacific Ocean basin.
As in most prior studies, we focus on deep-layer (200–
850 hPa) vertical shear. It is worthwhile to question
whether this is the most appropriate layer, since updrafts
and available moisture are rooted at low levels. A
preliminary examination using shallower layers yields
similar results—rain is favored in the downshear-left
quadrant whether the shear vector is defined over the
200–850-, 500–850-, or 700–925-hPa layer (Figs. 3a–c).
The shear vectors over these layers usually have similar
directions. For the small subset of cases where shear
vectors for these layers are out of phase with each other,
the rain tends to be maximized downshear left relative
to the deep-layer shear (not shown). Further analysis is
needed to investigate these relationships more thor-
oughly. This is left for future work.
FIG. 2. (a) 200–850-hPa shear direction and (b) magnitude for the entire hurricane sample set from all tropical cyclone basins.
FIG. 3. Composite mean hurricane rain rates relative to the (a) 200–850-, (b) 500–850-, and (c) 700–925-hPa shear vector.
MARCH 2010 W I N G O A N D C E C I L 649

3. Results
a. Hurricanes under varying shear
As the previous numerical, observational, and passive-
microwave studies have shown, hurricane precipita-
tion is favored downshear-left with the amplitude of
this displacement increasing with stronger shear (Figs.
4a–c). For hurricanes in weakly sheared environments
(,5 m s21; Fig. 4a) mean rain rates are fairly symmetric.
The weak asymmetry is most easily seen within 100 km
from storm center in Fig. 4a. However, a ‘‘left-of-shear’’
and downshear bias is present, contrary to the sym-
metric pattern one might expect from the mean. This
asymmetry can be explained by a few possibilities. First,
errors associated with the shear calculation and/or
model data may have underestimated the shear vector’s
magnitude. Second, stronger shear may have been
present prior to the satellite’s overpass, with the rain
field still exhibiting the effects (this topic will be dis-
cussed later in this paper). A histogram of shear mag-
nitude (Fig. 2b) indicates the majority of ‘‘weak shear’’
cases lie within the upper bounds of their category’s
magnitude (;4 m s21). Other possibilities are that even
weak shear truly is enough to induce this asymmetry, or
some other factor (e.g., storm motion) systematically
favors this asymmetry.
Moderately sheared (5–10 m s21) hurricanes (Fig. 4b)
display a stronger downshear asymmetry than weakly
sheared storms, with the left-of-shear bias increasing as
well. Again, Fig. 2a shows the peak occurrence of the
shear magnitude occurring at 5 m s21 and then de-
creasing as the shear magnitude increases. This implies
that the moderate cases are a modification of the weaker
cases with the addition of samples with only slightly
greater shear.
As previous observational studies utilizing passive-
microwave-derived rain rates have shown (Chen et al.
2006; Cecil 2007), hurricane rain patterns in a strongly
sheared environment (.;10 m s21; Fig. 4c) are very
asymmetric, with a pronounced downshear-left prefer-
ence. Cecil (2007) showed that differences around the
inner core were greatest for strongly sheared Atlantic
hurricanes with the mean rain rates ranging between
15.6 and 6.1 mm h21. Chen et al. (2006) also demon-
strated that the relative asymmetry of the precipitation
field was maximized under strong (.7.5 m s21) shear.
The main reason for the discrepancy between the rain-
rate magnitudes used in this study versus Cecil (2007)
arises from the overestimation of rain rates by the al-
gorithm used by Cecil (2007; RSS version 3). Figure 4c
illustrates for this study, within the inner core between
50- and 100-km radii, mean rain rates range from 10.2
(downshear left) to 2.7 mm h21 (upshear right). That is
nearly a factor of 4 difference from the favored region
(2708–3158 with respect to the shear vector) to the sup-
pressed region (908–1358). The moderate shear sample
has over a factor of 2 difference (9.5 versus 4.5 mm h21)
between these regions. The difference across the inner
core is much smaller for the weakly sheared sample (8.5
versus 6.0 mm h21).
Next we examine whether these differences in mean
rain rates result from differences in how often it rains
(or over how large an area), or from differences in the
magnitude of the smaller scale rain rates. When con-
sidering rain coverage and heavy rain coverage, note
that those are based on a 0.258 3 0.258 grid spacing with
contributions from larger radiometer fields of view. If
part of that grid box is raining (enough to be detected by
the RSS microwave algorithm), the entire grid box will
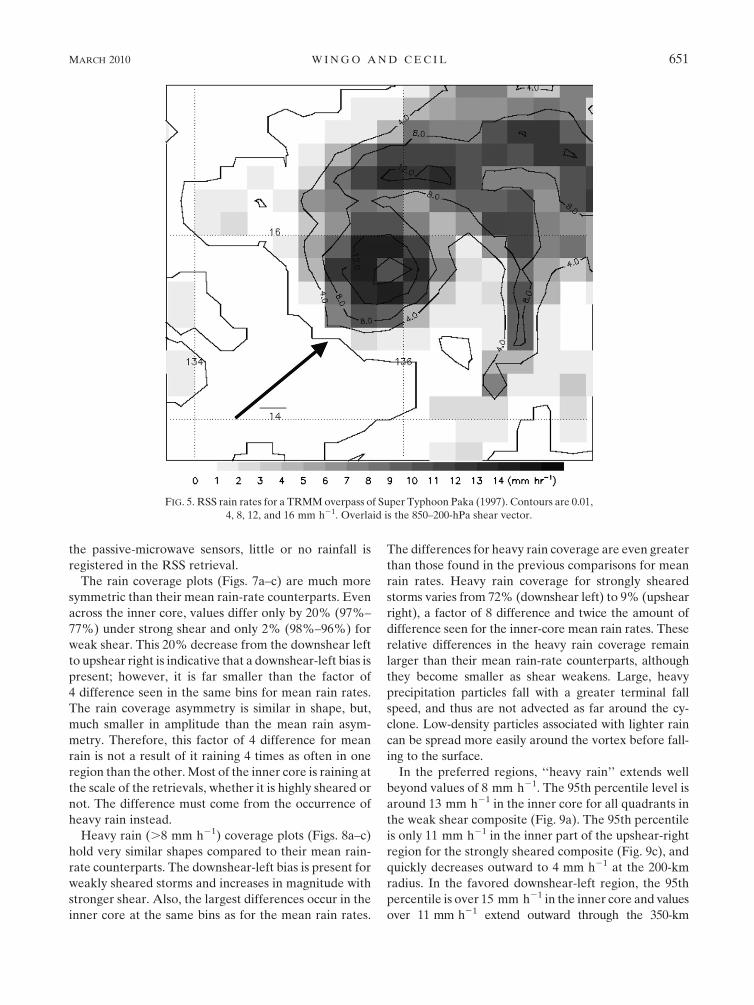
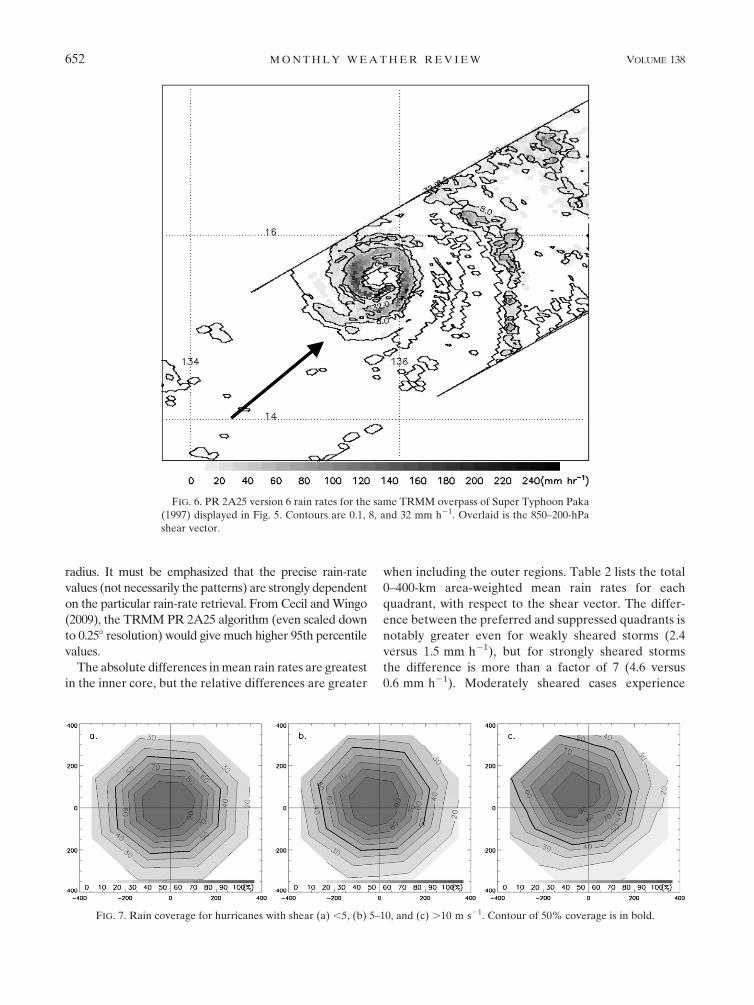
be assigned a nonzero rain rate. A good example of this
is found in Figs. 5 and 6. Although the eye of Paka (1997)
has a near rain-free region, the RSS rain-rate product
overestimates the rain by assigning values of around
8 mm h21. The higher-resolution PR shows it as being
rain free. In contrast, in regions where light precipitation
occurs in an area much smaller than the footprint size of
FIG. 4. Mean rain rates for hurricanes with shear (a) ,5, (b) 5–10, and (c) .10 m s21. Contours of 4 and 8 mm h21 are in bold.
650 M O N T H L Y W E A T H E R R E V I E W VOLUME 138
the passive-microwave sensors, little or no rainfall is
registered in the RSS retrieval.
The rain coverage plots (Figs. 7a–c) are much more
symmetric than their mean rain-rate counterparts. Even
across the inner core, values differ only by 20% (97%–
77%) under strong shear and only 2% (98%–96%) for
weak shear. This 20% decrease from the downshear left
to upshear right is indicative that a downshear-left bias is
present; however, it is far smaller than the factor of
4 difference seen in the same bins for mean rain rates.
The rain coverage asymmetry is similar in shape, but,
much smaller in amplitude than the mean rain asym-
metry. Therefore, this factor of 4 difference for mean
rain is not a result of it raining 4 times as often in one
region than the other. Most of the inner core is raining at
the scale of the retrievals, whether it is highly sheared or
not. The difference must come from the occurrence of
heavy rain instead.
Heavy rain (.8 mm h21) coverage plots (Figs. 8a–c)
hold very similar shapes compared to their mean rain-
rate counterparts. The downshear-left bias is present for
weakly sheared storms and increases in magnitude with
stronger shear. Also, the largest differences occur in the
inner core at the same bins as for the mean rain rates.
The differences for heavy rain coverage are even greater
than those found in the previous comparisons for mean
rain rates. Heavy rain coverage for strongly sheared
storms varies from 72% (downshear left) to 9% (upshear
right), a factor of 8 difference and twice the amount of
difference seen for the inner-core mean rain rates. These
relative differences in the heavy rain coverage remain
larger than their mean rain-rate counterparts, although
they become smaller as shear weakens. Large, heavy
precipitation particles fall with a greater terminal fall
speed, and thus are not advected as far around the cy-
clone. Low-density particles associated with lighter rain
can be spread more easily around the vortex before fall-
ing to the surface.
In the preferred regions, ‘‘heavy rain’’ extends well
beyond values of 8 mm h21. The 95th percentile level is
around 13 mm h21 in the inner core for all quadrants in
the weak shear composite (Fig. 9a). The 95th percentile
is only 11 mm h21 in the inner part of the upshear-right
region for the strongly sheared composite (Fig. 9c), and
quickly decreases outward to 4 mm h21 at the 200-km
radius. In the favored downshear-left region, the 95th
percentile is over 15 mm h21 in the inner core and values
over 11 mm h21 extend outward through the 350-km
FIG. 5. RSS rain rates for a TRMM overpass of Super Typhoon Paka (1997). Contours are 0.01,
4, 8, 12, and 16 mm h21. Overlaid is the 850–200-hPa shear vector.
MARCH 2010 W I N G O A N D C E C I L 651
radius. It must be emphasized that the precise rain-rate
values (not necessarily the patterns) are strongly dependent
on the particular rain-rate retrieval. From Cecil and Wingo
(2009), the TRMM PR 2A25 algorithm (even scaled down
to 0.258 resolution) would give much higher 95th percentile
values.
The absolute differences in mean rain rates are greatest
in the inner core, but the relative differences are greater
when including the outer regions. Table 2 lists the total
0–400-km area-weighted mean rain rates for each
quadrant, with respect to the shear vector. The differ-
ence between the preferred and suppressed quadrants is
notably greater even for weakly sheared storms (2.4
versus 1.5 mm h21), but for strongly sheared storms
the difference is more than a factor of 7 (4.6 versus
0.6 mm h21). Moderately sheared cases experience
FIG. 6. PR 2A25 version 6 rain rates for the same TRMM overpass of Super Typhoon Paka
(1997) displayed in Fig. 5. Contours are 0.1, 8, and 32 mm h21. Overlaid is the 850–200-hPa
shear vector.
FIG. 7. Rain coverage for hurricanes with shear (a) ,5, (b) 5–10, and (c) .10 m s21. Contour of 50% coverage is in bold.
652 M O N T H L Y W E A T H E R R E V I E W VOLUME 138

a factor of three difference (3.2 versus 1.1 mm h21),
a modest gain compared to their inner-core difference.
Significant differences also occur across regions other
than the ‘‘preferred’’ or downshear-left quadrants and
the ‘‘suppressed’’ or upshear-right quadrants. The down-
shear-right 0–400-km area-weighted mean rain rates are
only slightly greater than their upshear-left counterparts,
when shear is .5 m s21 (Table 2). They are equivalent
under weak shear. Comparing the 0–400-km area-
weighted mean rain rates for the downshear and upshear
semicircles, we find that the downshear half values are
basically a factor of 2 greater than those found in the
upshear half for moderate shear and a factor of 3 greater
for strong shear. When comparing the left and right of
shear semicircles, the difference between the two in-
creases in favor of the left as shear increases. The differ-
ence is small for weak shear (2.2 versus 1.7 mm h21), but
increases to over a factor of 2 for strong shear (3.1 versus
1.2 mm h21).
Although mean rain-rate values are compared for the
inner core and quadrants of the samples, it is important
to note that the rain rates are not ‘‘conserved’’ as
a function of radius while varying the shear. That is, the
rain is not simply ‘‘shifted’’ from right to left and from
upshear to downshear at the same radius as Fig. 10
shows. Instead, an overall reduction occurs within the
inner core as a function of increasing shear. This
reduction is accompanied by relatively higher mean rain
rates beyond approximately the 150-km radius, which is
indicative of the precipitation being displaced farther
away from the storm center with stronger shear.
b. Strong shear, varying TC intensity
Above, the effect of environmental shear on hurri-
canes was examined by breaking down the magnitude of
shear into three categories. Next, the relationships for
the precipitation field in a strongly sheared environment
are examined by dividing tropical cyclone intensity into
three categories. By doing so, it allows us to compare
how storms of varying intensity respond in a strong shear
environment.
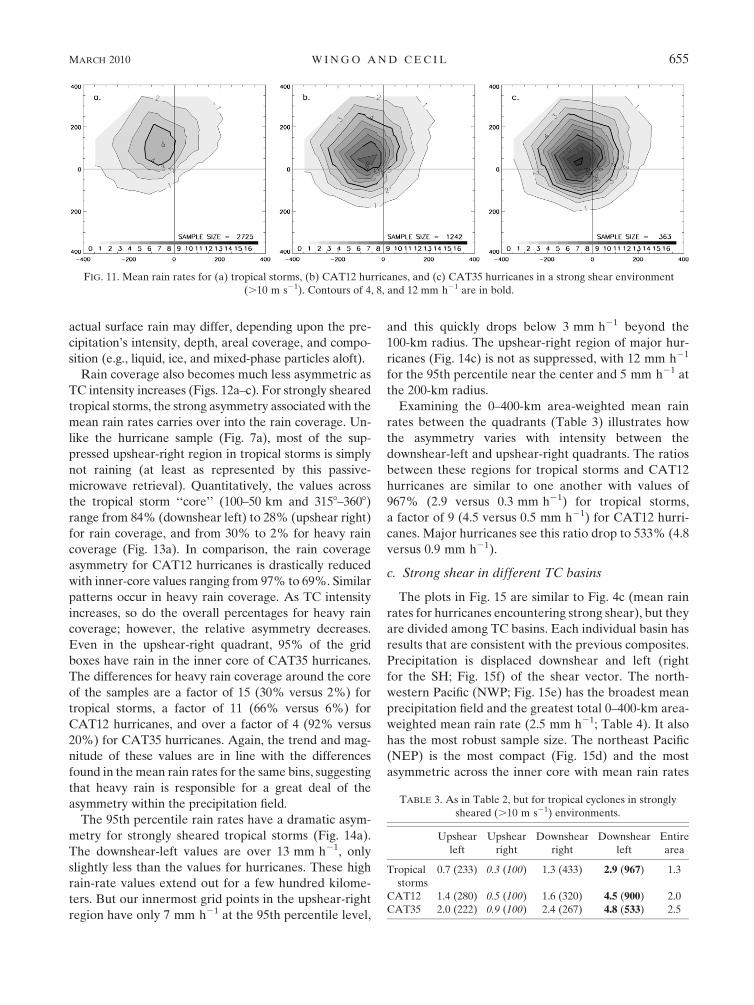
Mean rain rates for tropical storms under a strong
shear environment are biased toward the downshear-left
quadrant as seen in Fig. 11a. The peak mean rain-rate
FIG. 8. Heavy rain coverage for hurricanes with shear (a) ,5, (b) 5–10, and (c) .10 m s21. Contour of 50% coverage is in bold.
FIG. 9. The 95th percentile rain rates for hurricanes with shear (a) ,5, (b) 5–10, and (c) .10 m s21. Contours of 4, 8, and
12 mm h21 are in bold.
MARCH 2010 W I N G O A N D C E C I L 653

value (5.1 mm h21) is half that found in the hurricane
sample (10.2 mm h21) in Fig. 4c. The location of the
rain-rate maximum for tropical storms is farther down-
shear (100–150 versus 50–100 km for hurricanes), with
less of a left-of-shear bias (3158–3608) than for hurri-
canes (2708–3158). The area-weighted mean rain rate for
the downshear-left quadrant is 2.9 mm h21 (Table 3),
and over 80% of the rain is in the downshear semicircle.
The cyclonic advection of precipitation about the storm
center is less intense for tropical storms because of
a relatively weaker tangential wind field.
Figures 11b,c break down the hurricane sample
(Fig. 4c) into category 1–2 (CAT12; maximum sustained
winds between 32 and 48 m s21) hurricanes versus cate-
gory 3–5 (CAT35; maximum sustained winds .48 m s21)
hurricanes. For both, the mean rain-rate maxima are
found in the bin located with a 50–100-km radius, and
2708–3158 relative to the shear vector. Peak values of
mean rain rate increase from 9.5 mm h21 for CAT12 to
12.4 mm h21 for CAT35 hurricanes. Directly across the
inner core in the suppressed upshear-right region, the
mean values are 2.0 and 4.7 mm h21, respectively. The
results are a 475% and 264% ratio across the inner core
(1275% for tropical storms; 5.1 versus 0.4 mm h21), in-
dicating a decline in the asymmetry with increasing hur-
ricane intensity. This seems to contradict Ueno’s (2007)
conclusion that the amplitudes of vertical motion and
precipitation asymmetries increase with increasing shear
magnitude and increasing vortex strength. More gener-
ally, major hurricanes do tend to appear more symmetric
(e.g., Dvorak 1975; Willoughby et al. 1984). A preference
for the downshear left still exists in the strongest hurri-
canes, but significant precipitation occurs around the
entire storm. For weaker CAT12 storms, the structure
may not be as well organized, thus the majority of the
convection (and precipitation) would be displaced
downshear left. To some extent, this difference can be
explained by stronger tangential winds distributing the
precipitation particles into a more symmetric pattern.
Ueno’s model did not account for horizontal advection of
precipitation. The weaker asymmetry in stronger storms
may also be attributed to a more vertically coherent and
stiff vortex resisting the tilting influence of the shear.
Reasor et al. (2004) argued that a vortex Rossby wave
damping mechanism limits the tilt in stronger storms. But
on the other hand, strong shear and asymmetric organi-
zation tend to prevent a TC from attaining (or main-
taining) major hurricane intensity (e.g., Tuleya and
Kurihara 1981; DeMaria 1996). It is important to note
that passive-microwave rain retrievals are averaged over
a layer, and are most responsive to midlevels. Hydro-
meteors can travel tens of kilometers horizontally while
only falling a few kilometers in tropical cyclones. The
TABLE 2. Area-weighted (0–400 km) mean rain rates (mm h21)
for hurricanes in varying shear environments for all active ocean
basins. Maximum values for each category are set bold and mini-
mum values are italicized. A comparison of the percentage in each
quadrant relative to the upshear-right quadrant is in parentheses.
Upshear
left
Upshear
right
Downshear
right
Downshear
left
Entire
area
,5 m s21 1.9 (127) 1.5 (100) 1.9 (127) 2.4 (160) 1.9
5–10 m s21 1.7 (155) 1.1 (100) 2.1 (190) 3.2 (291) 2.0
.10 m s21 1.5 (250) 0.6 (100) 1.8 (300) 4.6 (767) 2.1
FIG. 10. Hurricane mean rain rates as a function of radius and shear magnitude.
654 M O N T H L Y W E A T H E R R E V I E W VOLUME 138
actual surface rain may differ, depending upon the pre-
cipitation’s intensity, depth, areal coverage, and compo-
sition (e.g., liquid, ice, and mixed-phase particles aloft).
Rain coverage also becomes much less asymmetric as
TC intensity increases (Figs. 12a–c). For strongly sheared
tropical storms, the strong asymmetry associated with the
mean rain rates carries over into the rain coverage. Un-
like the hurricane sample (Fig. 7a), most of the sup-
pressed upshear-right region in tropical storms is simply
not raining (at least as represented by this passive-
microwave retrieval). Quantitatively, the values across
the tropical storm ‘‘core’’ (100–50 km and 3158–3608)
range from 84% (downshear left) to 28% (upshear right)
for rain coverage, and from 30% to 2% for heavy rain
coverage (Fig. 13a). In comparison, the rain coverage
asymmetry for CAT12 hurricanes is drastically reduced
with inner-core values ranging from 97% to 69%. Similar
patterns occur in heavy rain coverage. As TC intensity
increases, so do the overall percentages for heavy rain
coverage; however, the relative asymmetry decreases.
Even in the upshear-right quadrant, 95% of the grid
boxes have rain in the inner core of CAT35 hurricanes.
The differences for heavy rain coverage around the core
of the samples are a factor of 15 (30% versus 2%) for
tropical storms, a factor of 11 (66% versus 6%) for
CAT12 hurricanes, and over a factor of 4 (92% versus
20%) for CAT35 hurricanes. Again, the trend and mag-
nitude of these values are in line with the differences
found in the mean rain rates for the same bins, suggesting
that heavy rain is responsible for a great deal of the
asymmetry within the precipitation field.
The 95th percentile rain rates have a dramatic asym-
metry for strongly sheared tropical storms (Fig. 14a).
The downshear-left values are over 13 mm h21, only
slightly less than the values for hurricanes. These high
rain-rate values extend out for a few hundred kilome-
ters. But our innermost grid points in the upshear-right
region have only 7 mm h21 at the 95th percentile level,
and this quickly drops below 3 mm h21 beyond the
100-km radius. The upshear-right region of major hur-
ricanes (Fig. 14c) is not as suppressed, with 12 mm h21
for the 95th percentile near the center and 5 mm h21 at
the 200-km radius.
Examining the 0–400-km area-weighted mean rain
rates between the quadrants (Table 3) illustrates how
the asymmetry varies with intensity between the
downshear-left and upshear-right quadrants. The ratios
between these regions for tropical storms and CAT12
hurricanes are similar to one another with values of
967% (2.9 versus 0.3 mm h21) for tropical storms,
a factor of 9 (4.5 versus 0.5 mm h21) for CAT12 hurri-
canes. Major hurricanes see this ratio drop to 533% (4.8
versus 0.9 mm h21).
c. Strong shear in different TC basins
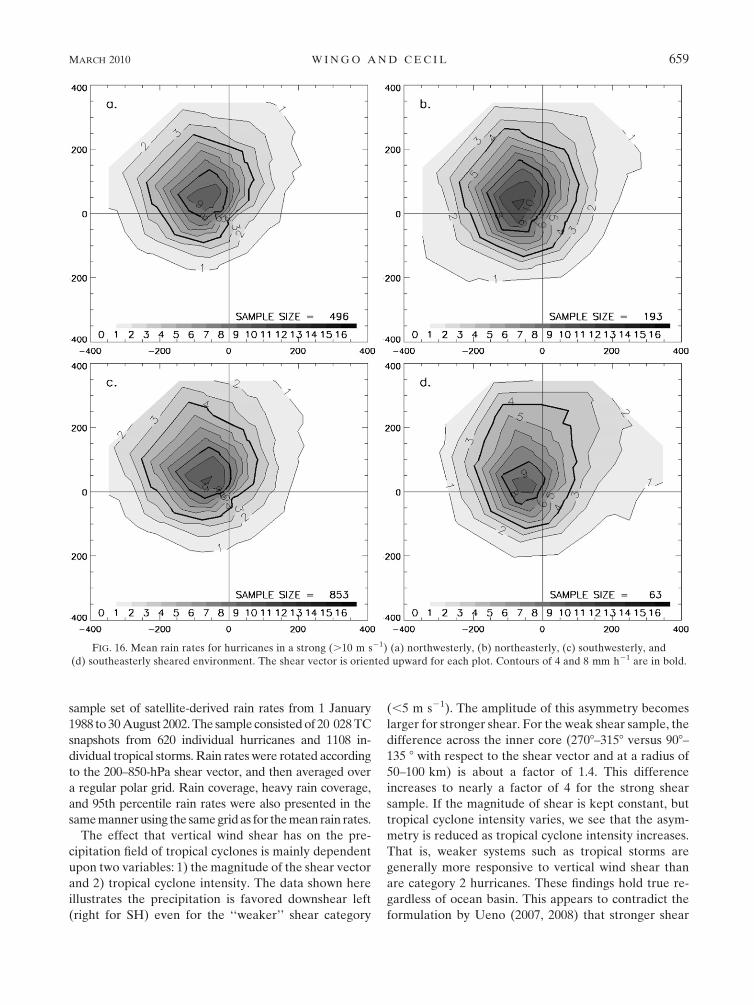
The plots in Fig. 15 are similar to Fig. 4c (mean rain
rates for hurricanes encountering strong shear), but they
are divided among TC basins. Each individual basin has
results that are consistent with the previous composites.
Precipitation is displaced downshear and left (right
for the SH; Fig. 15f) of the shear vector. The north-
western Pacific (NWP; Fig. 15e) has the broadest mean
precipitation field and the greatest total 0–400-km area-
weighted mean rain rate (2.5 mm h21; Table 4). It also
has the most robust sample size. The northeast Pacific
(NEP) is the most compact (Fig. 15d) and the most
asymmetric across the inner core with mean rain rates
FIG. 11. Mean rain rates for (a) tropical storms, (b) CAT12 hurricanes, and (c) CAT35 hurricanes in a strong shear environment
(.10 m s21). Contours of 4, 8, and 12 mm h21 are in bold.
TABLE 3. As in Table 2, but for tropical cyclones in strongly
sheared (.10 m s21) environments.
Upshear
left
Upshear
right
Downshear
right
Downshear
left
Entire
area
Tropical
storms
0.7 (233) 0.3 (100) 1.3 (433) 2.9 (967) 1.3
CAT12 1.4 (280) 0.5 (100) 1.6 (320) 4.5 (900) 2.0
CAT35 2.0 (222) 0.9 (100) 2.4 (267) 4.8 (533) 2.5
MARCH 2010 W I N G O A N D C E C I L 655

ranging from 10.8 to 2.0 mm h21, over a factor of 5 dif-
ference. The comparable numbers for all basins in
Fig. 4c were 10.2 versus 2.7 mm h21. However, note that
the NEP sample size is limited to 53 because of a relative
lack of strong shear in the heart its basin. Chen et al.
(2006) noted that the NEP had the most symmetric rain
distributions, but their composites for each basin
included the weaker shears that are especially common
in the NEP. The SH has the greatest orthogonal dis-
placement of precipitation relative to the shear vector.
The ratio between the left and right of shear semicircle
area-weighted mean rain rate for the SH is 290%
(1.0 versus 2.9 mm h21), which is 40% greater than that
found for the NWP. The small sample size for the central
Pacific (11 overpasses; Fig. 15b) does not produce results
robust enough for individual analysis.
d. Varying shear direction
Another question raised is whether the direction of
the environmental shear has any bearing on the pre-
cipitation field. Tuleya and Kurihara (1981) numerically
showed that for the Atlantic basin, easterly shear fa-
vored tropical cyclone development and westerly shear
inhibited it. Ritchie and Frank (2007) demonstrated that
this may be due in part to the advection of planetary
vorticity by the tropical cyclone with findings demon-
strating that such forcing would generate northwesterly
beta-gyre shear. This would suggest that environmental
shear from the east (especially southeasterly) would be
naturally weakened and the opposite would occur for
westerly (especially northwesterly) environmental
shear.
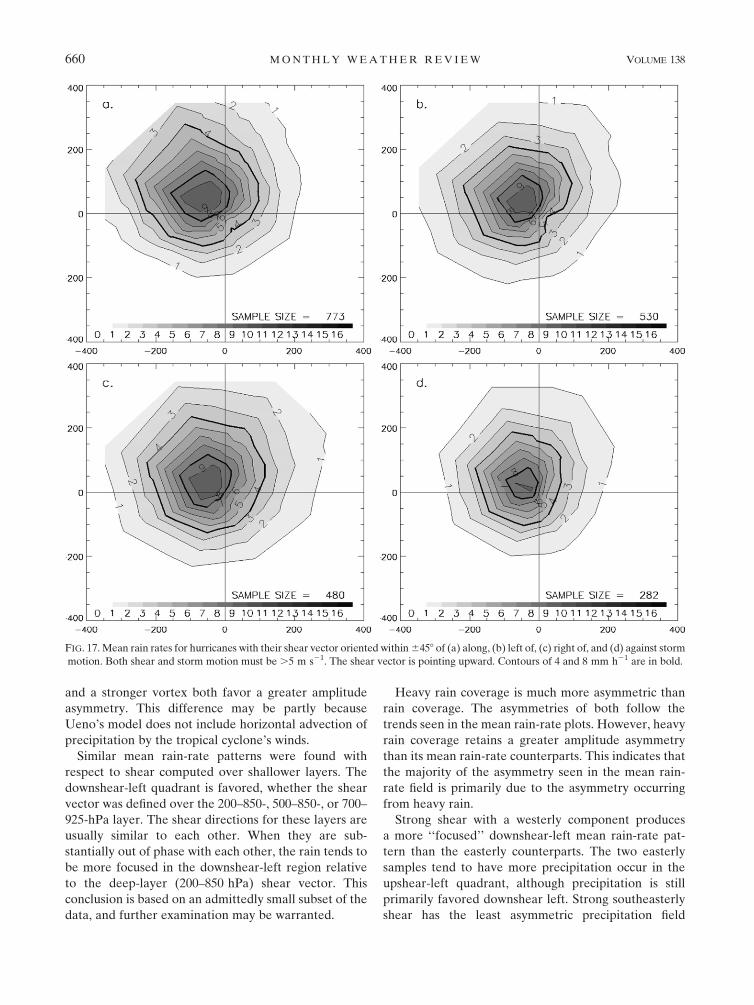
As Figs. 16a–d indicate, a strong preference for the
downshear-left quadrant exists regardless of shear di-
rection when shear is .10 m s21. The southeasterly
shear sample in Fig. 16d is the least asymmetric within
the inner core (100 km) with values ranging from 9.5 to
3.8 mm h21, which may perhaps be due to its small
sample size (63 overpasses). The magnitude of the inner-
core asymmetry for northwesterly shear (9.8 versus
1.8 mm h21; Fig. 16a) is more than double its south-
easterly counterpart and has substantially larger sample
FIG. 12. Rain coverage for (a) tropical storms, (b) CAT12 hurricanes, and (c) CAT35 hurricanes in a strong shear environment (.10 m s21).
Contour of 50% is in bold.
FIG. 13. Heavy rain coverage for (a) tropical storms, (b) CAT12 hurricanes, and (c) CAT35 and above hurricanes in a strong shear
environment (.10 m s21). Contour of 50% is in bold.
656 M O N T H L Y W E A T H E R R E V I E W VOLUME 138
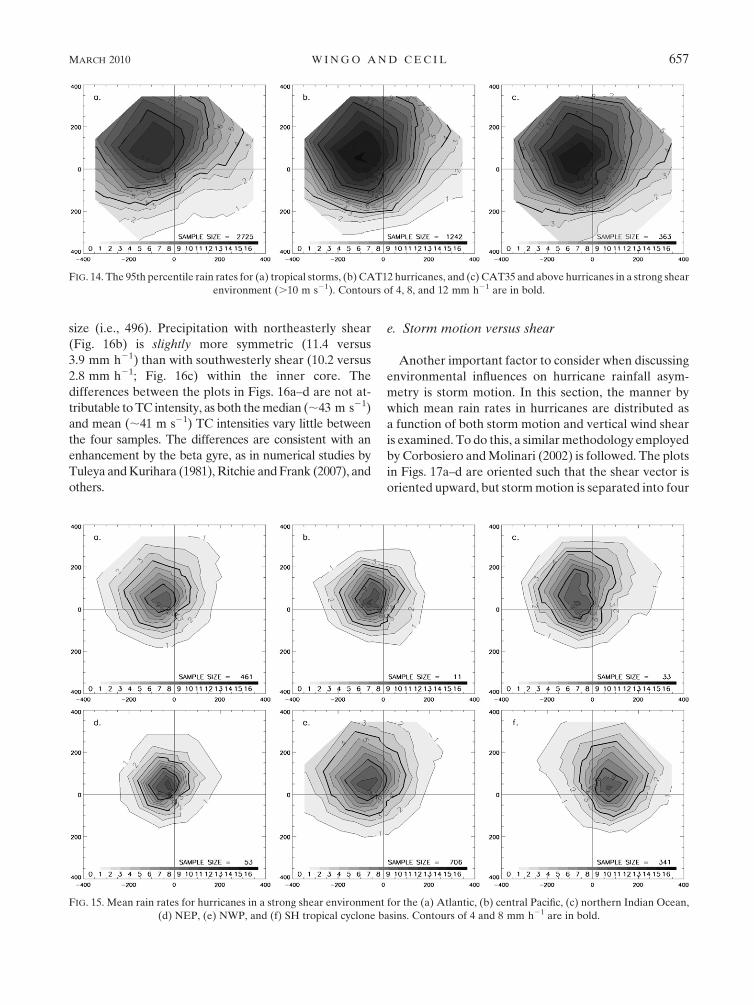
size (i.e., 496). Precipitation with northeasterly shear
(Fig. 16b) is slightly more symmetric (11.4 versus
3.9 mm h21) than with southwesterly shear (10.2 versus
2.8 mm h21; Fig. 16c) within the inner core. The
differences between the plots in Figs. 16a–d are not at-
tributable to TC intensity, as both the median (;43 m s21)
and mean (;41 m s21) TC intensities vary little between
the four samples. The differences are consistent with an
enhancement by the beta gyre, as in numerical studies by
Tuleya and Kurihara (1981), Ritchie and Frank (2007), and
others.
e. Storm motion versus shear
Another important factor to consider when discussing
environmental influences on hurricane rainfall asym-
metry is storm motion. In this section, the manner by
which mean rain rates in hurricanes are distributed as
a function of both storm motion and vertical wind shear
is examined. To do this, a similar methodology employed
by Corbosiero and Molinari (2002) is followed. The plots
in Figs. 17a–d are oriented such that the shear vector is
oriented upward, but storm motion is separated into four
FIG. 14. The 95th percentile rain rates for (a) tropical storms, (b) CAT12 hurricanes, and (c) CAT35 and above hurricanes in a strong shear
environment (.10 m s21). Contours of 4, 8, and 12 mm h21 are in bold.
FIG. 15. Mean rain rates for hurricanes in a strong shear environment for the (a) Atlantic, (b) central Pacific, (c) northern Indian Ocean,
(d) NEP, (e) NWP, and (f) SH tropical cyclone basins. Contours of 4 and 8 mm h21 are in bold.
MARCH 2010 W I N G O A N D C E C I L 657

groups according to their relative angle from the shear
vector. For these plots, there is a minimum threshold of
5 m s21 for both storm motion and shear magnitude.
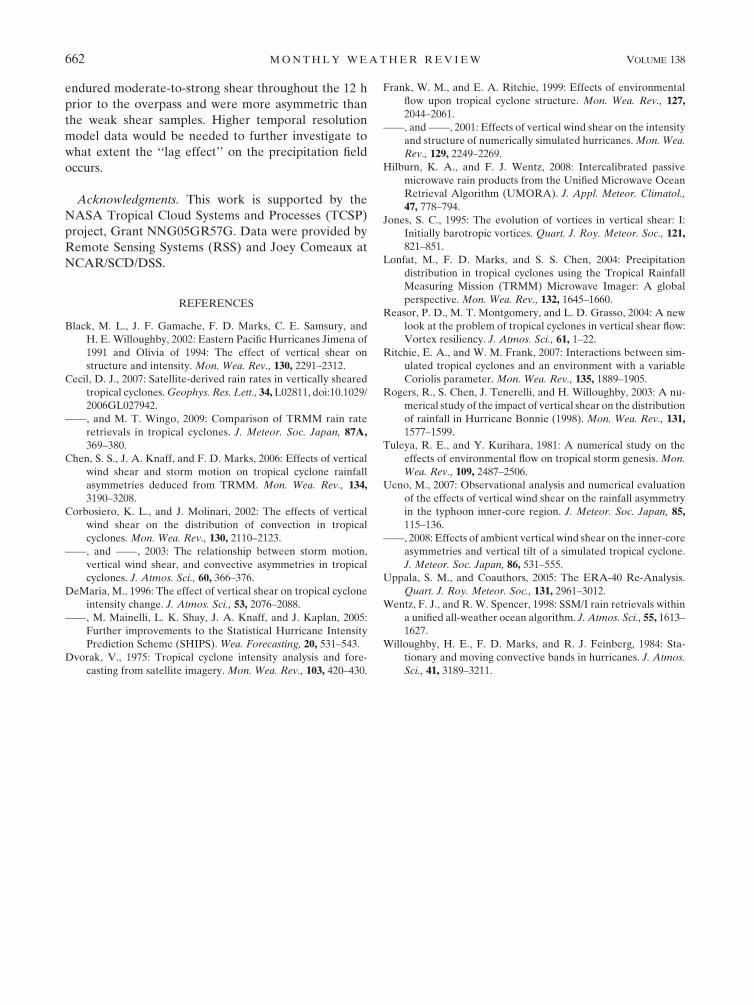
Regardless of the direction of storm motion, the
downshear-left quadrant is favored in all the plots. For
hurricanes that have their shear vector within 458 of
storm motion (‘‘along motion,’’ Fig. 17a), an asymmetric
distribution of rainfall to the front left of storm motion is
visible, which is the downshear-left region here as well.
When the shear vector is to the right of storm motion
(Fig. 17b), the front-right (motion) and downshear-left
quadrants coincide, creating by a small margin the most
asymmetric pattern (9.9 versus 2.9 mm h21). When the
shear vector is against storm motion (Fig. 17d), the pre-
ferred region is to the right rear of storm motion and
downshear left of the shear vector. Figure 17c exhibits the
least asymmetric pattern (10.0 versus 4.5 mm h21) between
the four, when shear is oriented to the left of storm motion.
This relative symmetry in Fig. 17c is not due to a lack of
strong shear cases, but rather a relatively large number of
strong hurricanes (192 CAT35 hurricanes). These find-
ings are consistent with previous studies (Corbosiero and
Molinari 2003; Chen et al. 2006; Ueno 2007).
f. Shear’s lag effect
As previously mentioned in section 3a, the pre-
cipitation field may exhibit residual effects from vertical
shear that occurred prior to the satellite’s overpass, or
a ‘‘lag effect.’’ Here, a straightforward analysis of the
precipitation field is performed by comparing samples
according to the magnitude of the shear vector at times
leading up to the overpass. For these comparisons, dif-
ferent shear categories than those used in the previous
sections are applied to increase the sample size. Here,
5 m s21 is still used for ‘‘weak shear,’’ but now 7.5 m s21
is the threshold for the ‘‘strong’’ shear sample.
One of the previously hypothesized possibilities for
the downshear left bias found in weaker shear cases
(Fig. 4a) was that stronger shear occurred prior to the
overpass. Figure 18a shows that this is likely not
the explanation. It retains the downshear-left bias found
in Fig. 4a, despite the fact that Fig. 18a is composed of
overpasses that had shear ,5 m s21 throughout the 12 h
prior to the satellite’s overpass. It is important again to
note that the accuracy of the shear magnitude is limited
to both the model data and the method used for the
shear calculation.
Hurricanes in a weakly sheared environment at the
time of the overpass, but moderate-to-strong shear
(.7.5 m s21; Fig. 18c) 12 h prior, somewhat resemble
other storms with weak shear (Figs. 4a and 18a).
However, Fig. 18c is noticeably more asymmetric than
Figs. 4a and 18a, especially when comparing the
downshear-left and upshear-right quadrants within a 100-
km radius. There, the ratio is 136% (8.3 versus 6.1
mm h21) for Fig. 18a and 171% (8.9 versus 5.2 mm h21)
for Fig. 18c. Recall that this ratio for the weak shear
sample (Fig. 4a) is 142% (8.5 versus 6.0 mm h21). This
evidence illustrates that while some effects from the
stronger shear still remain in Fig. 18c, the precipitation
field is able to regain characteristics closely resembling
the weaker shear samples over only 12 h.
Storms that have shear .7.5 m s21 at the time of the
overpass, but ,5 m s21 12 h prior (Fig. 18d), retain
similar characteristics (a factor of 2 difference across
the inner core; 8.8 versus 4.3 mm h21) held by the
moderate and strong shear composites for hurricanes
(Figs. 4b,c). But, the sample in Fig. 18d is more sym-
metric than the sample for hurricanes, which encoun-
tered shear .7.5 m s21 throughout the 12 h prior to the
overpass (Fig. 18b; a factor of 3.7 difference across the
inner core; 10.1 versus 2.7 mm h21). However, Fig. 18d
is more asymmetric than both Figs. 4a and 18a. Such
evidence suggests that the hurricane precipitation field
responds rather quickly to changes in the shear. Perhaps
a shorter temporal ‘‘lag’’ exists, but an investigation of
a 6-h ‘‘time lag’’ would not have provided a robust
enough sample with the current dataset.
Rogers et al. (2003) found similar results with their
simulation of Hurricane Bonnie (1998). During the early
stages of the model run, Bonnie (1998) attained a very
asymmetric profile under shear between 20 and 25 m s21
(900–400 hPa). Within a 6 h period, the shear weakened
to 5–10 m s21 (900–400 hPa) during which time the
storm became increasingly symmetric nearly simulta-
neously as shear decreased. It is important to note that
this was an individual case and that they calculated shear
over a thinner layer than was used in this study.
4. Summary and conclusions
The response of the precipitation field of TCs in relation
to vertical wind shear has been examined using a robust
TABLE 4. As in Table 3, but for each individual basin. Note that
the rain rates for the Southern Hemisphere are in their native state
and therefore its quadrant comparisons are relative to the upshear-
left quadrant.
Upshear
left
Upshear
right
Downshear
right
Downshear
left
Entire
area
ATL 1.4 (280) 0.5 (100) 1.6 (320) 3.8 (760) 1.8
CP 1.0 (200) 0.5 (100) 1.5 (300) 3.2 (640) 1.5
IO 1.6 (178) 0.9 (100) 2.3 (256) 4.5 (500) 2.3
NEP 1.1 (183) 0.6 (100) 1.3 (217) 2.5 (417) 1.3
NWP 1.7 (243) 0.7 (100) 2.1 (300) 5.3 (757) 2.5
SH 0.4 (100) 1.4 (350) 4.4 (1100) 1.6 (400) 2.0
658 M O N T H L Y W E A T H E R R E V I E W VOLUME 138
sample set of satellite-derived rain rates from 1 January
1988 to 30 August 2002. The sample consisted of 20 028 TC
snapshots from 620 individual hurricanes and 1108 in-
dividual tropical storms. Rain rates were rotated according
to the 200–850-hPa shear vector, and then averaged over
a regular polar grid. Rain coverage, heavy rain coverage,
and 95th percentile rain rates were also presented in the
same manner using the same grid as for the mean rain rates.
The effect that vertical wind shear has on the pre-
cipitation field of tropical cyclones is mainly dependent
upon two variables: 1) the magnitude of the shear vector
and 2) tropical cyclone intensity. The data shown here
illustrates the precipitation is favored downshear left
(right for SH) even for the ‘‘weaker’’ shear category
(,5 m s21). The amplitude of this asymmetry becomes
larger for stronger shear. For the weak shear sample, the
difference across the inner core (2708–3158 versus 908–
135 8 with respect to the shear vector and at a radius of
50–100 km) is about a factor of 1.4. This difference
increases to nearly a factor of 4 for the strong shear
sample. If the magnitude of shear is kept constant, but
tropical cyclone intensity varies, we see that the asym-
metry is reduced as tropical cyclone intensity increases.
That is, weaker systems such as tropical storms are
generally more responsive to vertical wind shear than
are category 2 hurricanes. These findings hold true re-
gardless of ocean basin. This appears to contradict the
formulation by Ueno (2007, 2008) that stronger shear
FIG. 16. Mean rain rates for hurricanes in a strong (.10 m s21) (a) northwesterly, (b) northeasterly, (c) southwesterly, and
(d) southeasterly sheared environment. The shear vector is oriented upward for each plot. Contours of 4 and 8 mm h21 are in bold.
MARCH 2010 W I N G O A N D C E C I L 659
and a stronger vortex both favor a greater amplitude
asymmetry. This difference may be partly because
Ueno’s model does not include horizontal advection of
precipitation by the tropical cyclone’s winds.
Similar mean rain-rate patterns were found with
respect to shear computed over shallower layers. The
downshear-left quadrant is favored, whether the shear
vector was defined over the 200–850-, 500–850-, or 700–
925-hPa layer. The shear directions for these layers are
usually similar to each other. When they are sub-
stantially out of phase with each other, the rain tends to
be more focused in the downshear-left region relative
to the deep-layer (200–850 hPa) shear vector. This
conclusion is based on an admittedly small subset of the
data, and further examination may be warranted.
Heavy rain coverage is much more asymmetric than
rain coverage. The asymmetries of both follow the
trends seen in the mean rain-rate plots. However, heavy
rain coverage retains a greater amplitude asymmetry
than its mean rain-rate counterparts. This indicates that
the majority of the asymmetry seen in the mean rain-
rate field is primarily due to the asymmetry occurring
from heavy rain.
Strong shear with a westerly component produces
a more ‘‘focused’’ downshear-left mean rain-rate pat-
tern than the easterly counterparts. The two easterly
samples tend to have more precipitation occur in the
upshear-left quadrant, although precipitation is still
primarily favored downshear left. Strong southeasterly
shear has the least asymmetric precipitation field
FIG. 17. Mean rain rates for hurricanes with their shear vector oriented within 6458 of (a) along, (b) left of, (c) right of, and (d) against storm
motion. Both shear and storm motion must be .5 m s21. The shear vector is pointing upward. Contours of 4 and 8 mm h21 are in bold.
660 M O N T H L Y W E A T H E R R E V I E W VOLUME 138

between the four, but suffers from a small sample size.
While these results are not very robust, they are in line
with what would be expected according to theory and
the numerical modeling studies (e.g., Tuleya and
Kurihara 1981; Ritchie and Frank 2007).
When hurricanes are moving faster than 5 m s21 and
are experiencing shear .5 m s21, regardless of the ori-
entation between storm motion and the shear vector,
precipitation is displaced downshear and to the left of
the shear vector. The amplitude of this displacement is
weakest for cases in which the shear vector is to the left
of storm motion; however, this is primarily due to a rel-
atively large number of strong hurricanes. When the
shear vector is oriented along storm motion, the sample
is dominated by weaker hurricanes which in turn pro-
duce the lowest mean rain rates compared to the other
three samples.
Results presented in this study indicate that shear’s
impact on hurricane rainfall is somewhat immediate.
Hurricanes that endure moderate-to-strong shear 12 h
prior, but weak shear at the time of the satellite overpass
were more symmetric than storms that encounter
moderate-to-strong shear at the time of the overpass and
more asymmetric than storms that encountered weak
shear throughout the 12 h prior to the overpass. Simi-
larly, hurricanes in a moderate-to-strong shear envi-
ronment at the time of the overpass, but weak shear 12 h
prior were more symmetric than the sample that
FIG. 18. Mean rain rates for hurricanes that had shear (a) ,5 m s21 at 0, 6, and 12 h prior to the overpass; (b) shear .7.5 m s21 at 0, 6,
and 12 h prior to the overpass; (c) shear ,5 m s21 at 0 but .7.5 m s21 12 h prior; and (d) shear .7.5 m s21 at 0 but ,5 m s21 12 h prior.
Contours of 4 and 8 mm h21 are in bold.
MARCH 2010 W I N G O A N D C E C I L 661
endured moderate-to-strong shear throughout the 12 h
prior to the overpass and were more asymmetric than
the weak shear samples. Higher temporal resolution
model data would be needed to further investigate to
what extent the ‘‘lag effect’’ on the precipitation field
occurs.
Acknowledgments. This work is supported by the
NASA Tropical Cloud Systems and Processes (TCSP)
project, Grant NNG05GR57G. Data were provided by
Remote Sensing Systems (RSS) and Joey Comeaux at
NCAR/SCD/DSS.
REFERENCES
Black, M. L., J. F. Gamache, F. D. Marks, C. E. Samsury, and
H. E. Willoughby, 2002: Eastern Pacific Hurricanes Jimena of
1991 and Olivia of 1994: The effect of vertical shear on
structure and intensity. Mon. Wea. Rev., 130, 2291–2312.
Cecil, D. J., 2007: Satellite-derived rain rates in vertically sheared
tropical cyclones. Geophys. Res. Lett., 34, L02811, doi:10.1029/
2006GL027942.
——, and M. T. Wingo, 2009: Comparison of TRMM rain rate
retrievals in tropical cyclones. J. Meteor. Soc. Japan, 87A,
369–380.
Chen, S. S., J. A. Knaff, and F. D. Marks, 2006: Effects of vertical
wind shear and storm motion on tropical cyclone rainfall
asymmetries deduced from TRMM. Mon. Wea. Rev., 134,3190–3208.
Corbosiero, K. L., and J. Molinari, 2002: The effects of vertical
wind shear on the distribution of convection in tropical
cyclones. Mon. Wea. Rev., 130, 2110–2123.
——, and ——, 2003: The relationship between storm motion,
vertical wind shear, and convective asymmetries in tropical
cyclones. J. Atmos. Sci., 60, 366–376.
DeMaria, M., 1996: The effect of vertical shear on tropical cyclone
intensity change. J. Atmos. Sci., 53, 2076–2088.
——, M. Mainelli, L. K. Shay, J. A. Knaff, and J. Kaplan, 2005:
Further improvements to the Statistical Hurricane Intensity
Prediction Scheme (SHIPS). Wea. Forecasting, 20, 531–543.
Dvorak, V., 1975: Tropical cyclone intensity analysis and fore-
casting from satellite imagery. Mon. Wea. Rev., 103, 420–430.
Frank, W. M., and E. A. Ritchie, 1999: Effects of environmental
flow upon tropical cyclone structure. Mon. Wea. Rev., 127,
2044–2061.
——, and ——, 2001: Effects of vertical wind shear on the intensity
and structure of numerically simulated hurricanes. Mon. Wea.
Rev., 129, 2249–2269.
Hilburn, K. A., and F. J. Wentz, 2008: Intercalibrated passive
microwave rain products from the Unified Microwave Ocean
Retrieval Algorithm (UMORA). J. Appl. Meteor. Climatol.,
47, 778–794.
Jones, S. C., 1995: The evolution of vortices in vertical shear: I:
Initially barotropic vortices. Quart. J. Roy. Meteor. Soc., 121,821–851.
Lonfat, M., F. D. Marks, and S. S. Chen, 2004: Precipitation
distribution in tropical cyclones using the Tropical Rainfall
Measuring Mission (TRMM) Microwave Imager: A global
perspective. Mon. Wea. Rev., 132, 1645–1660.
Reasor, P. D., M. T. Montgomery, and L. D. Grasso, 2004: A new
look at the problem of tropical cyclones in vertical shear flow:
Vortex resiliency. J. Atmos. Sci., 61, 1–22.
Ritchie, E. A., and W. M. Frank, 2007: Interactions between sim-
ulated tropical cyclones and an environment with a variable
Coriolis parameter. Mon. Wea. Rev., 135, 1889–1905.
Rogers, R., S. Chen, J. Tenerelli, and H. Willoughby, 2003: A nu-
merical study of the impact of vertical shear on the distribution
of rainfall in Hurricane Bonnie (1998). Mon. Wea. Rev., 131,1577–1599.
Tuleya, R. E., and Y. Kurihara, 1981: A numerical study on the
effects of environmental flow on tropical storm genesis. Mon.
Wea. Rev., 109, 2487–2506.
Ueno, M., 2007: Observational analysis and numerical evaluation
of the effects of vertical wind shear on the rainfall asymmetry
in the typhoon inner-core region. J. Meteor. Soc. Japan, 85,
115–136.
——, 2008: Effects of ambient vertical wind shear on the inner-core
asymmetries and vertical tilt of a simulated tropical cyclone.
J. Meteor. Soc. Japan, 86, 531–555.
Uppala, S. M., and Coauthors, 2005: The ERA-40 Re-Analysis.
Quart. J. Roy. Meteor. Soc., 131, 2961–3012.
Wentz, F. J., and R. W. Spencer, 1998: SSM/I rain retrievals within
a unified all-weather ocean algorithm. J. Atmos. Sci., 55, 1613–
1627.
Willoughby, H. E., F. D. Marks, and R. J. Feinberg, 1984: Sta-
tionary and moving convective bands in hurricanes. J. Atmos.
Sci., 41, 3189–3211.
662 M O N T H L Y W E A T H E R R E V I E W VOLUME 138