effects of transient recovery voltages on circuit breaker ratings
TRANSCRIPT

Effects of Transient Recovery Voltages on Circuit Breaker Ratings
Term Project: -
EE5220 - Power System Transients.
Spring 2008
Instructor: - Dr. Bruce Mork
Team: -
Himanshu Bahirat
Muhammad Ali
Praveen KK

Effects of Transient Recovery Voltages on Circuit Breaker Ratings
Table of Contents
1.Introduction.................................................................................................. 4 2.Transient Recovery Voltages on Systems ................................................... 4
2.1 What is Transient Recovery Voltage?
2.2 Factors affecting Transient Recovery Voltage
2.3 Types Transient Recovery Voltage waveshapes
3.Calcultation of Transient Recovery Voltages on Systems .......................... 5 3.1 System reduction
3.2 Calculation of different Types Transient Recovery Voltage waveshapes
4.Circuit Breaker Ratings Structure ............................................................... 8 4.1 General Rating Structure
4.2 Ratings important for TRV
5.Effects of Transient Recovery Voltages on Circuit Breaker ....................... 9 5.1 Insulation Failures
5.2 Re-ignition and Re-strikes
6.Calculation of Transient Recovery Voltages of Circuit Breaker ............... 10 6.1 Envelope Specification and Calculation
6.2 Factors affecting Transient Recovery Voltage 6.2.1 Fault Currents
6.2.2 Circuit Parameters
6.2.3 Out-of-phase Switching
6.2.4 First Pole to Clear Factors
6.2.5 Applications

7.Case Study for analysis of TRV and Circuit Breaker Ratings Selection .. 14 7.1 Modeling for ATP from single line diagram
7.2 Simulation in ATP 7.3.1 Study of TRV obtained at various locations
7.3 Interpretation of results of simulation 7.3.1 TRV values obtained by simulation
7.3.2 Ratings of circuit breakers as per standards
7.3.3 Comparison of ratings and values from simulation
8.Conclusions ............................................................................................... 18 9.Recommendations ..................................................................................... 19 10.References ............................................................................................... 19 11.Appendix.................................................................................................. 20
1. Introduction
Transient is associated with every change of state of a circuit. Transient recovery voltage thus is the transient across a circuit breaker. Transient recovery voltages are contingent upon the circuit conditions and parameters of the circuit. Thus making it extremely essential to study them for application of circuit breakers. [1][2][3]
Generally, circuit breakers in a system are applied based on available short circuit capability at that point in the circuit. But, when circuit is interrupted it results in a TRV, this has deleterious effects on the circuit breaker. TRV manifests in different way depending on circuit configuration, hence the object of this report is to study the various parameters causing and affecting the TRV.
2. Transient Recovery Voltages on Systems
2.1. What is Transient Recovery Voltage?[1][2]
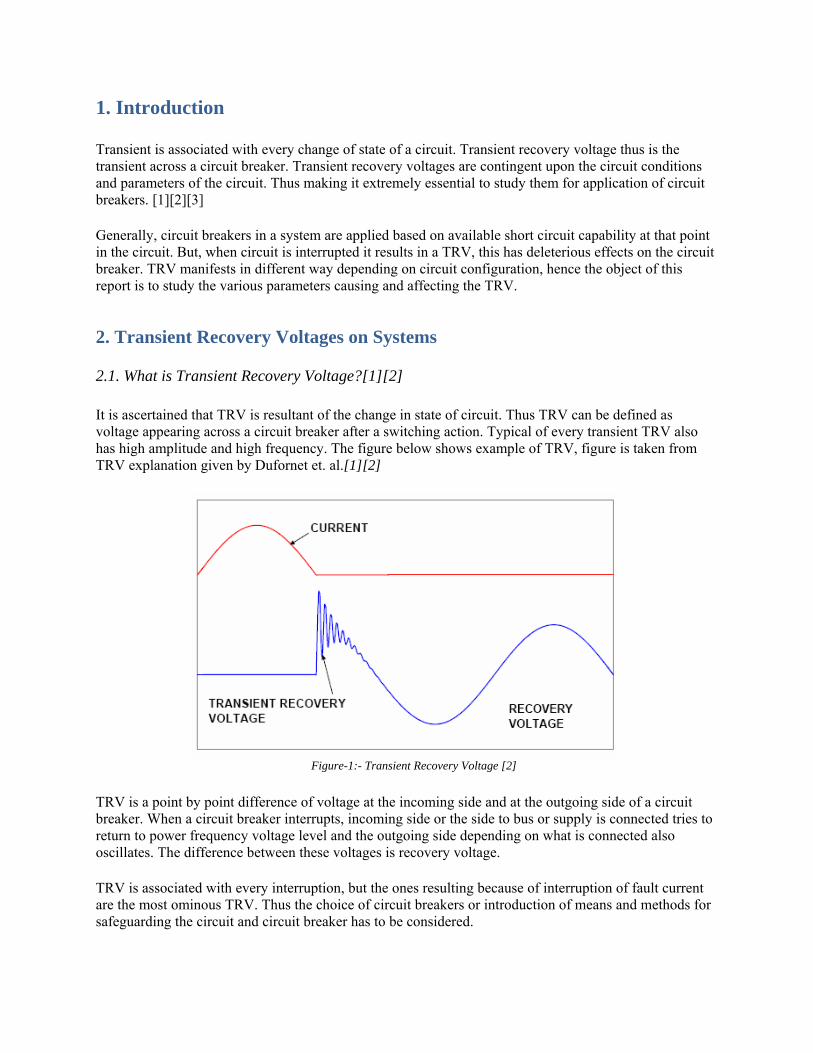
It is ascertained that TRV is resultant of the change in state of circuit. Thus TRV can be defined as voltage appearing across a circuit breaker after a switching action. Typical of every transient TRV also has high amplitude and high frequency. The figure below shows example of TRV, figure is taken from TRV explanation given by Dufornet et. al.[1][2]
Figure-1:- Transient Recovery Voltage [2]
TRV is a point by point difference of voltage at the incoming side and at the outgoing side of a circuit breaker. When a circuit breaker interrupts, incoming side or the side to bus or supply is connected tries to return to power frequency voltage level and the outgoing side depending on what is connected also oscillates. The difference between these voltages is recovery voltage.
TRV is associated with every interruption, but the ones resulting because of interruption of fault current are the most ominous TRV. Thus the choice of circuit breakers or introduction of means and methods for safeguarding the circuit and circuit breaker has to be considered.
2.2. Factors affecting TRV [1][2][5]
Transient recovery voltage is affected by various parameters of the system. Prominent among them are listed below:-
1. Inductance and capacitance in the system 2. Fault current level of the system at point of study of TRV. 3. Bushing capacitance of circuit breakers, voltage transformers etc 4. Number of transmission lines terminating at a bus and their characteristics impedance. 5. Internal factors of the circuit breaker like the first pole to clear a fault etc. 6. System grounding.
2.3. Types of TRV wave shapes [2][5]
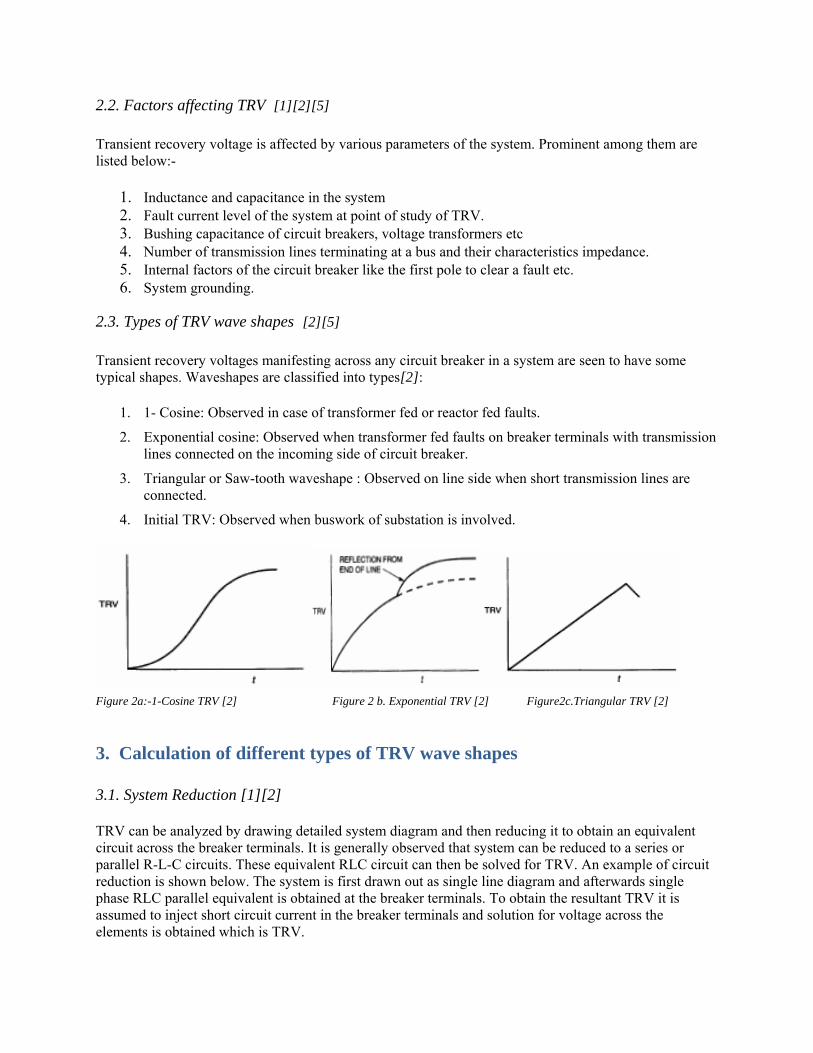
Transient recovery voltages manifesting across any circuit breaker in a system are seen to have some typical shapes. Waveshapes are classified into types[2]:
1. 1- Cosine: Observed in case of transformer fed or reactor fed faults.
2. Exponential cosine: Observed when transformer fed faults on breaker terminals with transmission lines connected on the incoming side of circuit breaker.
3. Triangular or Saw-tooth waveshape : Observed on line side when short transmission lines are connected.
4. Initial TRV: Observed when buswork of substation is involved.
Figure 2a:-1-Cosine TRV [2] Figure 2 b. Exponential TRV [2] Figure2c.Triangular TRV [2]
3. Calculation of different types of TRV wave shapes
3.1. System Reduction [1][2]
TRV can be analyzed by drawing detailed system diagram and then reducing it to obtain an equivalent circuit across the breaker terminals. It is generally observed that system can be reduced to a series or parallel R-L-C circuits. These equivalent RLC circuit can then be solved for TRV. An example of circuit reduction is shown below. The system is first drawn out as single line diagram and afterwards single phase RLC parallel equivalent is obtained at the breaker terminals. To obtain the resultant TRV it is assumed to inject short circuit current in the breaker terminals and solution for voltage across the elements is obtained which is TRV.

Figure 3a :-Single Line Diagram[2] Figure 3c :-Equivalent RLC Network[2]
Figure 3b :-Three phase Diagram[2]
3.2. Calculation of different types Transient Recovery Voltage waveshapes
3.2.1. 1-Cosine or Oscillatory or Underdamped TRV [2]
This waveshape is generally obtained in case of transformer or reactor fed faults. This kind of TRV waveshape can also be obtained with transformer fed fault on a bus with with small number of transmission lines connected to it. System to be used for analysis of this kind is shown figure- 3. The resultant equations after analysis are shown below.[2]
(3)-----5.0
isy oscillator be toTRVfor Condition
-(2)----- KV cos1
toreduces eq.1 neglected, is 3c figure of resistance lines, no are thereIf
-(1)--- KV sinhcosh1
1
1
eq
eqeq
eqeqCB
tCB
CL
Z
CLtEV
tteEV
≥
⎟⎟
⎠
⎞
⎜⎜
⎝
⎛
⎟⎟
⎠
⎞
⎜⎜
⎝
⎛−=
⎟⎟⎠
⎞⎜⎜⎝
⎛⎟⎟⎠
⎞⎜⎜⎝
⎛+−= − ββαβα
faradsin ecapacitanc equivalent
Henrysin inductance equivalent ohmsin impedance equivalent
1
21
frequency System
2 -
breakercircuit open across Voltage
2
1
eq
eq
eq
eqeq
eqeq
eq
CB
C
LZ
CL
CZ
LIE
Vwhere
−−
−
−
−
αβ
α
ω
ω

3.2.2. Exponential TRV [2]
This waveshape is obtained, when a circuit breaker at a bus with large number of transmission lines, interrupts a faults at its terminals. The waveshape obtained is seen on the bus side of the circuit breaker. . This is also referred to as overdamped TRV. The system used for analysis is the same as shown figure3a. [2]
(5)-----5.0
is lexponentia be toTRVfor Condition
-(4)--- KV 1
toreduces (1) eq. and neglected iscircuit of e capacitanc thehence line, theof impedance surge iscircuit equivalentin resistance systemsmany For
1
eq
eqeq
eq
eq
t
CB
CL
Z
sZL
eEV
≤
−
⎟⎟⎠
⎞⎜⎜⎝
⎛−=
−
τ
τ
3.2.3. Triangular or Sawtooth Waveshape [2]
When a fault at a short distance from the circuit breaker on the transmission line is interrupted it results in triangular TRV on line side of circuit breaker. Sawtooth TRV is characterized by high rate of rise of recovery voltage (RRRV). These are seen to damage circuit breakers because of high RRRV even thought the peak of TRV is less. The analysis of this TRV is based on the traveling wave on transmission lines.[2]
(KV) voltagemaximum rated currentcircuit short rated current tofault of ratio
line of impedance Surge CurrentFault
2
peak to time----
side sourceon TRV ofdelay time
)8()(2
)7(32)1(
-(6)---by given isbreaker circuit across TRV
max
max
EMZI
ZIR
RVT
twhere
tTMV
EMdV
VVV
L
LL
L
LL
d
dLS
L
SLCB
ω=
=
−
−−−−−=
−−−−−=
+=

4. Circuit Breaker Ratings Structure IEEE C37.04-1999 defines a general rating structure for high voltage circuit breakers 1000 V AC and above. The rating structure comprises of indoor and outdoor circuit breakers. ANSI/IEEE C37.06 states preferred rating for the circuit breakers. Ratings structure establishes the basis for rating s to be assigned to circuit breakers including electrical and mechanical characteristics.
4.1 General Rating Structure
IEEE C37.04-1999 is based on symmetrical currents and specifies ratings for three and single phase, indoor and outdoor circuit breakers to be used above 1000V AC. Rating structure used for the circuit breakers is based on usual service conditions that prevail. The rating structure of the circuit breaker includes the following:[9]
Figure 4:- Circuit Nameplate Catalogue GE Co. USA [9]

4.2 Ratings important for TRV[5][6]
The above is general rating structure and is provided on nameplate of every circuit breaker. Rating that are important from the point of view of Transient recovery voltages depend on the voltage level it is used at and application. IEEE C37.011 is a application guide for transient recovery voltage for AC high voltage circuit breakers. In addition the to the peak of the recovery voltage the following ratings are referred to
1. Peak TRV in KV
2. Time to Peak of TRV In μs.
3. Rate of Rise of Recovery Voltage (RRRV)
These ratings of the circuit breaker are contingent upon application. To cater to various possible applications the standard specifies three different TRV characteristics envelopes
1. 1-Cosine waveform
2. Exponential Cosine TRV waveform
3. Triangular TRV waveform.
These waveforms are obtained for different applications and depend on the rated maximum operating voltage. TRV capability of the circuit breaker is required to increase as the short circuit current reduces as the TRV depends on the short circuit level of the system. System conditions and grounding of the system are important for TRV ratings to be evaluated.
5. Effects of Transient Recovery Voltages on Circuit Breaker[1][2][3][6] Transient recovery voltages appear on the system for a very short duration of time and assume very high values. These rapid changes have deleterious effects on the devices in the system.
5.1 Insulation Failures
TRV is voltage which appears across the circuit breaker on the system when it interrupts current, and are especially dangerous when short circuits are interrupted. [2] . TRV causes the insulation of the circuit breaker to be stressed and can result in breakdown. The classical examples of the breakdown of insulation are external flashover between phase and ground, or between a phase and another. TRV causes the air around to be stressed to higher levels thus resulting in breakdown.
5.2 Re-ignition and Re-strikes[2][3]
When the circuit breaker is interrupting a fault, it results in arcing in the interrupting medium. During the process of interruption the arcing medium is trying to regain its insulation property. For the interruption to be successful the interrupting medium should withstand this fast rising recovery voltage.
Thus, there is a race in the interrupting medium to go from conducting state to insulating state, with the TRV, if the rate of rise of TRV is more than speed with which the medium returns to insulating state the arcing medium breakdown causing current to continue to flow in the circuit breaker, if speed of medium

is higher the interruption is successful. This process of establishment of current is called re-ignition and refers to re-ignition of arc in the circuit breaker.
Re-ignition generally occurs almost immediately after the current zero, is generally because the arc plasma containing conducting ions reestablishes current.
TRV, if it very high will result in the arcing medium which has returned to insulating state to stressed. If this field created across the contacts is very high a dielectric breakdown may take place causing the interrupting medium to become conducting and carry current. This process of establishing current is called restrike. This generally occurs about a half cycle later to the current interruption. This phenomenon occurring internally to the circuit breaker is akin to insulation failure external to the circuit breaker [3]
6. Calculation of Transient Recovery Voltages of Circuit Breaker At the rated voltage circuit breakers are expected to interrupt rated short circuit current in a system where the TRV doesn’t exceed the rated TRV envelope. System may be grounded or ungrounded. [5]
6.1 Envelope Specification and Calculation [5][6]
TRV rating of circuit breaker is defined by an envelope of rated withstand capability [5] Parameters that define the envelope are based on the characteristics of actual system. According to the standard various waveshapes are observed for circuit breakers on the system, illustrated in section 3. Applicable envelope of TRV depends on the application and voltage rating of the circuit breaker.
Two envelopes are defined, one for circuit breakers rated 100KV and below and other for above 100KV. Circuit breaker is generally used in conjunction with transformers and transmission lines. As noted earlier the transformer fed faults are known to produce 1-cosine wave, which is also characteristics of underdamped system. Transmission lines, depending upon number of lines in parallel, are known to add damping to the system and hence produce exponential waveform. Thus the two envelopes are :-
1. Two parameter envelope used for circuit breakers rated 100KV and below and for above 100KV, if fault current is less than 30% of rated short circuit current.
2. Four parameter envelope for circuit breakers used above 100KV.
Voltage (E2) can also be calculated using formulae specified in standard [5] and stated as under
voltagerated System:
factorclear topolefirst : factor amplitude transient:
32
32
1
2
V
kk
VkE
VkkE
pp
a
pp
ppa
××=
×××=

Rated parameters as specified in ANSI/IEEE standard C37.06-2000 are used to define the envelope. Parameters are specified in Tables-1 through Table-3. [5] [6]
1. Two parameter envelope [2][5] [6]:- This envelope definition approximates the 1-cosine waveform. Rated values as given in Table-1 and Table-2, are used to construct the envelope. Envelope gives the withstand capability a circuit breaker should have in order to successfully interrupt rated short circuit current at rated values. The initial portion of the curve gives the voltage rise upto the peak value, thus this plotted as line joining the origin with the point (E2,T2),the second portion of the envelope is horizontal line through point(E2,T2). In case of circuit breakers rated above 100KV there is small delay time involved, hence the first sloping curve starts at (0, Td). Curves as obtained for 145KV circuit breakers are shown below.[2]
Figure 5: Two Parameter TRV Envelope [2]
2. Four parameter envelope [2][5] [6]: - Four parameter envelope is used t approximate the exponential-cosine waveform obtained on 100KV and above values. Rated values specified in ANSI/IEEE C37.06-2000 are used define the envelope. Rated values defined in Table-3 are used. To construct the capability envelope the curve takes off after a delay of (Td) and increases with a slope of Rate of Rise of Recovery Voltage to value E1=1.3*√2/3, beyond this there is another straight line approximation from the point where first lines ends to the point (E2,T2). , beyond this point is horizontal line passing through (E2,T2). Curves constructed for 550KV circuit breakers are shown above.
Figure 6: Four Parameter TRV Envelope [2]

6.2 Factors affecting Transient Recovery Voltage [2] [5] [6]
Transient recovery voltage appearing across a circuit breaker is affected by various factors like fault current, first pole to clear factor, out of phase switching, system inductance and capacitance etc…TRV may also be affected by the applications a breaker is used for.
6.2.1 Faults Current
Calculation of transient recovery voltage Eq.1,2,4 &6 [2] indicates that all forms of TRV are greatly dependent on the fault current. Short circuit at a point in system depends on the devices paralleled like the transmission lines, transformers etc. It is observed that TRV peak increases and time to peak reduces as short circuit reduces. This also causes the RRRV to increase [5]. Figure below shows the TRV envelopes. [5]
Figure 7: Parameter Envelopes varying as per fault current 1)100KV and below b) 100KV and above.[5]
6.2.2 Circuit Parameter [2]
Circuit inductance and capacitance plays a vital role in the TRV peak and time to peak. Eq.1, 2, 4&6Thus the TRV values can be controlled and reduced using the inductance and circuit capacitance. Generally system capacitance is considerably less, hence TRV is controlled by addition of additional surge capacitance.
6.2.3 Out-of-phase Switching
Out of phase switching results in higher values of TRV and are analyzed in a similar way as the generator circuit breaker analysis. [9] Rated values for out of phase switching are specified for 900 phase shift.

6.2.4 First Pole to Clear Factors [2][5]
First pole to clear factors are a function of the system grounding arrangements. It is defined as ratio,Eq.9.[2]
oninterruptiafter poles all across appearing Voltage -:edinterrruptnot have polesother when pole, nginterrupti across appearing Voltage -:
)9(
603
60
603
60
HzP
HzIP
HzP
HzIPpp
VV
VV
K
−
−
−
− −−−=
KPP is 1.5 for ungrounded systems and 1.3 for effectively grounded system. First pole to clear factor is seen to be dependent on the zero sequence and positive sequence impedance of the system and is given by [2]
5.1 hence system ungroundedFor
3.1 hence 3 system groundedy effectivelFor
)10(2
3
10
10
01
0
=>>
==
−−−+
=
pp
pp
pp
KXX
KXX
XXX
K
6.2.5 Applications [2][7]
TRV depends on the application of circuit breaker. Some important applications are
1. Transformer fed faults [2][7]: - Standard capability curve is specified as two parameter curve. Severe TRV conditions may result if the fault is immediately after transformer, without appreciable capacitance in between transformer and circuit breaker. In such cases the TRV peak and RRRV may exceed the values specified in C37.06-2000, in such circumstances values specified in C37.06.1-2000 are used. These values correspond to fast time to peak values.
2. Series Reactor limited faults [2][7]: - Series reactors are used to limit short circuit current in a line. Use of series reactors on line side can cause high Rate of rise TRV values.
3. Shunt reactor switching [2][7]: When a shunt reactor is switched circuit breaker interrupts very small currents. This kind of circuit results in load side oscillating with frequency of 1/√LC, L being shunt reactor and C being capacitance associated with it. This can result in very high frequencies sometimes in the range of 1 to 5 KHz.[2]
4. Generator Circuit breakers [2][7]: - These circuit breakers are required to have special characteristics as these are installed between the transformer and generators. Faults associated with this can result in TRV values higher than the values ones given inC37.04 and C37.06. For system-source faults these can be 3-5 times higher.[2]
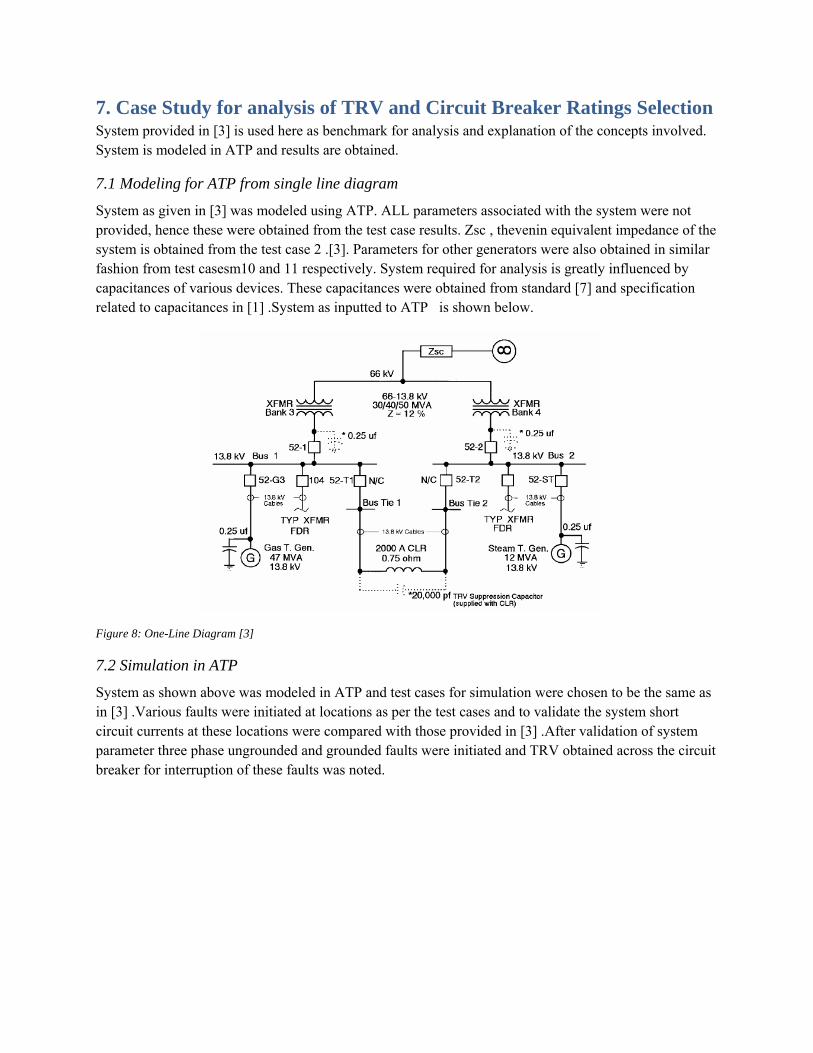
7. Case Study for analysis of TRV and Circuit Breaker Ratings Selection System provided in [3] is used here as benchmark for analysis and explanation of the concepts involved. System is modeled in ATP and results are obtained.
7.1 Modeling for ATP from single line diagram
System as given in [3] was modeled using ATP. ALL parameters associated with the system were not provided, hence these were obtained from the test case results. Zsc , thevenin equivalent impedance of the system is obtained from the test case 2 .[3]. Parameters for other generators were also obtained in similar fashion from test casesm10 and 11 respectively. System required for analysis is greatly influenced by capacitances of various devices. These capacitances were obtained from standard [7] and specification related to capacitances in [1] .System as inputted to ATP is shown below.
Figure 8: One-Line Diagram [3]
7.2 Simulation in ATP
System as shown above was modeled in ATP and test cases for simulation were chosen to be the same as in [3] .Various faults were initiated at locations as per the test cases and to validate the system short circuit currents at these locations were compared with those provided in [3] .After validation of system parameter three phase ungrounded and grounded faults were initiated and TRV obtained across the circuit breaker for interruption of these faults was noted.

Figure 9: System Model in ATP
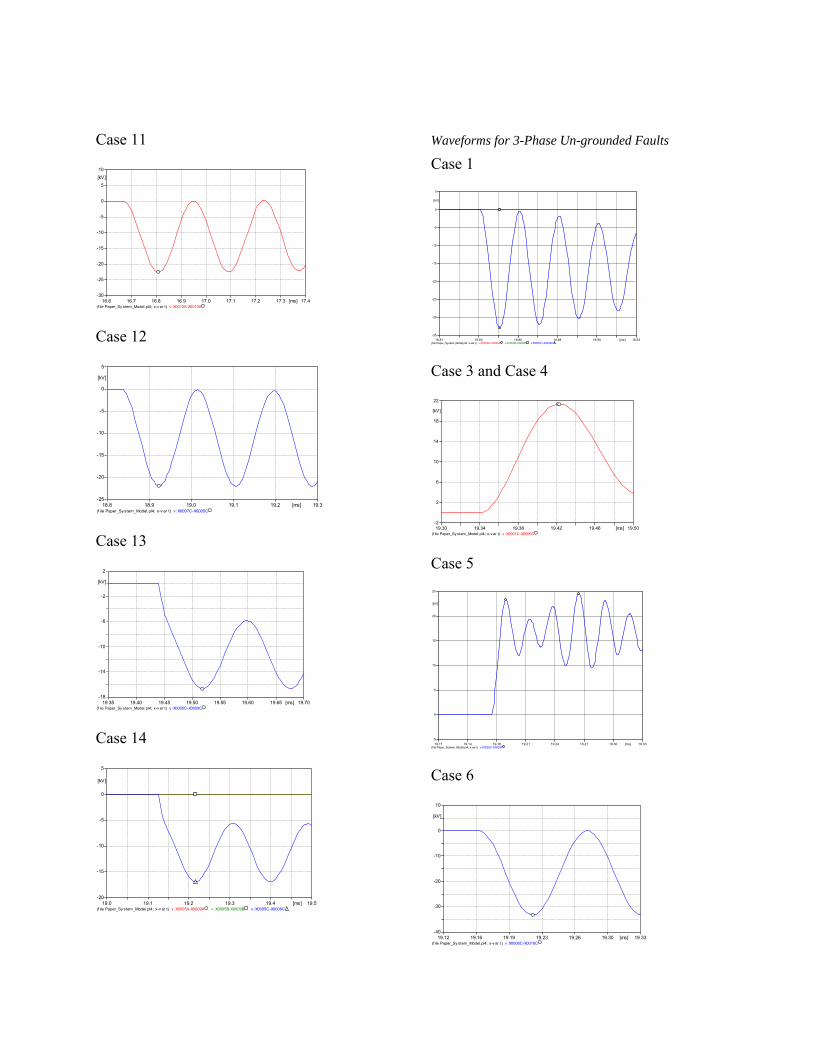
Waveshapes obtained are mostly 1-cosine type (Appendix). Values of peak voltage and time to peak are noted. Refer Table-1 for values of TRV.
7.3 Interpretation of results of simulation
7.3.1 TRV values obtained by simulation
Table 1 and Table 2 are respectively the TRV values and short circuit currents obtained on the system from simulation and as given in [3] .Grounded and Ungrounded faults were studied. It can be seen that ungrounded faults result in higher TRV values.
Table-1[Grounded and Ungrounded Faults]
Ungrounded FaultsFault TRV Peak Time to Peak TRV Peak Time to
KA KV μS KV μSCase 1 Bus‐1 9.9 22.188 12 33 12Case 2 66KV Bus ‐‐ ‐‐ ‐‐ ‐‐ ‐‐Case 3 Bank‐3 23.3 18.4 90 21.2 90Case 4 Bank‐3 23.3 18.4 90 21 80Case 5 Bus Tie‐2 5.2 15.9/16.86 14/38 23.3/24.55 16/40Case 6 Bus Tie‐1 21.2 22.8 58 33.17 58Case 7 Bus tie‐2 7.1 14.9 60 22.4 60Case 8 Bus‐2 5.2 15.1/16.9 14/46 22.9/24.5 15/48Case 9 Bus‐2 7.1 14.9 57 22.41 58Case 10 Bus‐1 11.4 22.5 79 33.8 79Case 11 Bus‐2 3.5 22.5 142 33.8 143Case 12 Bus‐1 9.99 21.975 91 32.94 94Case 13 Bus tie‐2 5.5 16.7 79 25 78Case 14 Bus tie‐2 5.2 16.9 92 25.36 93
Grounded FaultsFault Current

Table-2 [3]
Waveshapes obtained in most of the cases is 1-cosine and in some cases a double frequency. The TRV values obtained in few cases exceed the capabilities of the circuit breakers used at those locations. These cases were handled with addition of surge capacitance across the incoming side of circuit breakers, these helped to reduce the TRV obtained at those locations.
7.3.2 Ratings of circuit breakers as per standards
Standards C37.04 and C37.06 specify the values of TRV envelope and parameters required to establish the capability of the circuit breaker. Ratings are given tables 1 through table 3 of C37.06-2000.
Only the values pertaining to TRV are listed and presented below.
Table 3:- TRV C37.06-2000 [6]
Ratings for circuit breaker 72.5KV and below Rated Values for 123KV and above
Rated Maximum Voltage KV, rms
Rated Peak Voltage E2 KV peak
Rated Time to peak T2 μS
Rated Maximum Voltage KV, rms
Rated Time to peak T2 μS
Rated Rate R KV/ μS
Rated Delay Time T1 μS
4.76 8.9 50 123 260 2 28.25 15.5 60 145 310 2 215 28 75 170 360 2 227 51 105 245 520 2 238 71 125 362 775 2 2
15.5 29 36 550 1325 2 225.8 48.5 52 800 1530 2 238 71 63
48.3 91 8072.5 136 106

Fast recovery Transients are specified in ANSI C37.06-1. This standard specifies TRV ratings for circuit breakers as per the variation of short circuit current.
7.3.3 Comparison of ratings and values from simulation
When the waveforms obtained from simulation and circuit breaker TRV ratings in Table-3 [6] are compared , we find that the in most of the cases the TRV capability of circuit breakers are exceeded in this application. The simulation case 12 and 14 were rerun with surge capacitor of 0.4μF capacitor on incoming side of breaker # 52-1.Resultant TRV are within the ratings of the circuit breaker capability as specified in C37.06-2000.[6]
(file Paper_System_Model.pl4; x-var t) v:XX0007 v:X0005B-X0006B 21.56 21.60 21.64 21.69 21.73 21.77 21.81[ms]
-5
0
5
10
15
20
25
30
[kV]
(f ile Paper_Sy stem_Model.pl4; x-v ar t) v :X0005B-X0006B v :XX0007 21.57 21.63 21.69 21.76 21.82 21.88 21.94[ms]
-10
-5
0
5
10
15
20
25
30[kV]
Figure 10:- Comparison Capability of Circuit Breaker TRV with System TRV a)Before addition of surge capacitor b) after addition of surge capacitor. Fault at Bus 1 Case 1 and Case 12.
Consideration of VT capacitance is extremely important; this is demonstrated through additional simulation run where resultant TRVs with and without addition of VT capacitance at 66KV bus is shown. It can be seen from the figure below that addition of capacitance has important bearing on the frequency, hence T2 time to peak and peak of TRV.
(f ile Paper_Sy stem_Model.pl4; x-v ar t) v :X0005B-X0006B v :X0012B-X0013B v :XX0007 21.57 21.60 21.62 21.65 21.68 21.70 21.73[ms]
-10
-5
0
5
10
15
20
25
30[kV]
Figure 11:- Effect of VT capacitance on TRV of System.

8. Conclusions 1. Frequency and Peak values are greatly dependent on circuit inductance and capacitance.
2. Ungrounded faults result is in high TRV across circuit breakers.
3. Surge Capacitors reduce TRV across circuit breakers.
4. Capacitance of the voltage transformers has effect on TRV values and times to peak.
5. Capacitance across the current limiting reactors has effect on TRV.
6. Results obtained from simulation and results provided in [3], don’t match because of missing detailed parameters of cables and resistance in the circuit.
9. Recommendations 1. Capacitances of various devices have to be considered.
2. Ungrounded faults should be used for analysis as they result in higher TRV values.
3. Transient Analysis should be performed on a installation to prevent failure due to TRV issues.
4. To eliminate TRV surge capacitors should be employed on the incoming side of circuit breakers.
5. Modeling of all associated inductance and capacitance, with correct values is extremely essential for proper analysis.

10. References [1] Greenwood, A., Electrical Transients in Power Systems, New York: Wiley, 1991. [2] Dufournet, D.; Alexander, R.W., "Transient Recovery Voltage (TRV) for High Voltage Circuit
Breakers" [3] Swindler, D.L.; Schwartz, P.; Hamer, P.S.; Lambert, S.R., "Transient recovery voltage
considerations in the application of medium-voltage circuit breakers," Industry Applications, IEEE Transactions on , vol.33, no.2, pp.383-388, Mar/Apr 1997
[4] Colclaser, R.G., "The Transient Recovery Voltage Application of Power Circuit Breakers," IEEE Transactions on Power Apparatus and Systems , vol.PAS-91, no.5, pp.1941-1947, Sept. 1972
[5] "IEEE standard rating structure for AC high-voltage circuit breakers," IEEE Std C37.04-1999 , vol., no., pp.i-, 1999
[6] "American National Standard AC High-Voltage Circuit Breakers Rated on a Symmetrical Current Basis- Preferred Ratings and Related Required Capabilities," ANSI C37.06-2000 , vol., no., pp. 0_1-A_6, 2000
[7] "IEEE Application Guide for Transient Recovery Voltage for AC High-Voltage Circuit Breakers," IEEE Std C37.011-2005 (Revision of IEEE Std C37.011-1994) , vol., no., pp. 0_1-62, 2006
[8] Braun, D.; Koeppl, G., “Transient Recovery Voltages During the Switching Under Out-of-Phase Conditions,” International Conference on Power Systems Transients – IPST 2003 in New Orleans, USA
[9] GE. Co. USA, GE Power/Vac® Vacuum Distribution Recloser http://www.geindustrial.com/publibrary/checkout/Brochures|DEA-191|PDF

Appendix
Waveforms for 3-Phase grounded Faults
Case 1
(file Paper_System_Model.pl4; x-var t) v:X0010A-X0012A 24.47 24.47 24.48 24.48 24.49 24.49 24.50 24.50 24.51[ms]
-25
-20
-15
-10
-5
0
5
[kV]
Case 3 and Case 4
(file Paper_System_Model.pl4; x-var t) v:X0007A-X0005A 24.87 24.90 24.94 24.98 25.02 25.06 25.10[ms]
-10
-5
0
5
10
15
20
[kV]
Case 5
(f ile Paper_Sy stem_Model.pl4; x-v ar t) v :X0024A-X0023A v :X0024B-X0023B v :X0024C-X0023C 19.169 19.184 19.199 19.214 19.229 19.244 19.259[ms]-2
2
6
10
14
18
[kV]
Case 6
(f ile Paper_Sy stem_Model.pl4; x-v ar t) v :X0005C-X0009C 19.10 19.14 19.18 19.22 19.26 19.30[ms]
-25
-20
-15
-10
-5
0
5
[kV]
Case 7
(f ile Paper_Sy stem_Model.pl4; x-v ar t) v :X0005C-X0009C 19.27 19.33 19.40 19.46 19.52 19.59 19.65[ms]
-16
-13
-10
-7
-4
-1
2
[kV]
Case 8
(f ile Paper_Sy stem_Model.pl4; x-v ar t) v :X0012C-X0010C 19.11 19.13 19.14 19.15 19.17 19.18 19.19[ms]
-10
-5
0
5
10
15
20
[kV]
Case 9
(f ile Paper_Sy stem_Model.pl4; x-v ar t) v :X0012A-X0010A 24.8 24.9 25.0 25.1 25.2 25.3[ms]
-2
1
4
7
10
13
16
[kV]
Case 10
(f ile Paper_Sy stem_Model.pl4; x-v ar t) v :X0005A-X0006A 16.5 16.6 16.7 16.8 16.9 17.0 17.1[ms]
-25
-20
-15
-10
-5
0
5
[kV]
Case 11
(f ile Paper_Sy stem_Model.pl4; x-v ar t) v :X0012A-X0013A 16.6 16.7 16.8 16.9 17.0 17.1 17.2 17.3 17.4[ms]
-30
-25
-20
-15
-10
-5
0
5
10[kV]
Case 12
(f ile Paper_Sy stem_Model.pl4; x-v ar t) v :X0007C-X0005C 18.8 18.9 19.0 19.1 19.2 19.3[ms]
-25
-20
-15
-10
-5
0
5
[kV]
Case 13
(f ile Paper_Sy stem_Model.pl4; x-v ar t) v :X0005C-X0009C 19.35 19.40 19.45 19.50 19.55 19.60 19.65 19.70[ms]
-18
-14
-10
-6
-2
2
[kV]
Case 14
(f ile Paper_Sy stem_Model.pl4; x-v ar t) v :X0005A-X0009A v :X0005B-X0009B v :X0005C-X0009C 19.0 19.1 19.2 19.3 19.4 19.5[ms]
-20
-15
-10
-5
0
5
[kV]
Waveforms for 3-Phase Un-grounded Faults
Case 1
(file Paper_System_Model.pl4; x-var t) v:X0005A-X0006A v:X0005B-X0006B v:X0005C-X0006C 18.81 18.83 18.86 18.88 18.90 18.93[ms]
-35
-30
-25
-20
-15
-10
-5
0
5
[kV]
Case 3 and Case 4
(f ile Paper_Sy stem_Model.pl4; x-v ar t) v :X0001C-X0006C 19.30 19.34 19.38 19.42 19.46 19.50[ms]-2
2
6
10
14
18
22
[kV]
Case 5
(file Paper_System_Model.pl4; x-var t) v:X0025C-X0024C 19.11 19.14 19.18 19.21 19.24 19.27 19.30 19.33[ms]
-5
0
5
10
15
20
25
[kV]
Case 6
(f ile Paper_Sy stem_Model.pl4; x-v ar t) v :X0006C-X0010C 19.12 19.16 19.19 19.23 19.26 19.30 19.33[ms]
-40
-30
-20
-10
0
10
[kV]

Case 7
(f ile Paper_Sy stem_Model.pl4; x-v ar t) v :X0005C-X0009C 19.29 19.32 19.35 19.38 19.41 19.44 19.47[ms]
-25
-20
-15
-10
-5
0
5
[kV]
Case 8
(f ile Paper_Sy stem_Model.pl4; x-v ar t) v :X0012C-X0010C 19.09 19.12 19.15 19.17 19.20 19.22 19.25[ms]
-5
0
5
10
15
20
25
[kV]
Case 9
(f ile Paper_Sy stem_Model.pl4; x-v ar t) v :X0012C-X0010C 19.20 19.25 19.30 19.35 19.40 19.45 19.50 19.55 19.60[ms]
-5
0
5
10
15
20
25
[kV]
Case 10
(f ile Paper_Sy stem_Model.pl4; x-v ar t) v :X0005A-X0006A 16.6 16.7 16.8 16.9 17.0 17.1[ms]
-40
-30
-20
-10
0
10
[kV]
Case 11
(f ile Paper_Sy stem_Model.pl4; x-v ar t) v :X0012A-X0013A 16.4 16.6 16.8 17.0 17.2 17.4 17.6[ms]
-40
-30
-20
-10
0
10
[kV]
Case 12
(f ile Paper_Sy stem_Model.pl4; x-v ar t) v :X0007C-X0005C 18.7 18.8 18.9 19.0 19.1 19.2 19.3[ms]
-40
-30
-20
-10
0
10
[kV]
Case 13
(f ile Paper_Sy stem_Model.pl4; x-v ar t) v :X0005C-X0009C 19.3 19.4 19.5 19.6 19.7 19.8[ms]
-30
-25
-20
-15
-10
-5
0
5
[kV]
Case 14
(f ile Paper_Sy stem_Model.pl4; x-v ar t) v :X0005C-X0009C 19.1 19.2 19.3 19.4 19.5 19.6[ms]
-30
-25
-20
-15
-10
-5
0
5
[kV]