comparative high voltage impulse measurement · the accurate measurement of fast transient voltages...
TRANSCRIPT

Volume 101, Number 5, September–October 1996Journal of Research of the National Institute of Standards and Technology
[J. Res. Natl. Inst. Stand. Technol.101, 639 (1996)]
Comparative High Voltage ImpulseMeasurement
Volume 101 Number 5 September–October 1996
Gerald J. FitzPatrick andEdward F. Kelley
National Institute of Standards andTechnology,Gaithersburg, MD 20899-0001
A facility has been developed for the deter-mination of the ratio of pulse high voltagedividers over the range from 10 kV to300 kV using comparative techniques withKerr electro-optic voltage measurement sys-tems and reference resistive voltage di-viders. Pulse voltage ratios of test dividerscan be determined with relative expandeduncertainties of 0.4 % (coverage factork = 2 and thus a two standard deviationestimate) or less using the complementaryresistive divider/Kerr cell reference systems.This paper describes the facility and spe-cialized procedures used at NIST for the
determination of test voltage divider ratiosthrough comparative techniques. The errorsources and special considerations in theconstruction and use of reference voltagedividers to minimize errors are discussed,and estimates of the measurement uncer-tainties are presented.
Key words: high-voltage impulse; high-voltage reference measurement systems;impulse measurements; standard lightningimpulse; transient measurements.
Accepted: April 30, 1996
1. Introduction
Accurate high voltage measurements are required bythe electric power industry for instrumentation, meter-ing, and testing applications [1, 2]. Similarly, there is aneed for accurate measurements of high voltages inpulsed power machines to monitor and optimize ma-chine operation [3]. The accurate measurement of fasttransient voltages is also important in the assessment oftheir effects on electrical power equipment and insula-tion in order to improve system reliability. Additionally,for the correct evaluation of transient voltage effects onapparatus or dielectrics, the peak voltage and waveshapemust be accurately known.
Steady-state high voltages can be measured withmuch smaller uncertainties than high-voltage transientscan be. For example, calibrations of dc high-voltagedividers for divider ratio have been routinely performedin the range of 10 kV to 100 kV with relative uncertain-ties of less than 0.01 % [4]. AC divider ratios have beencalibrated over the same voltage range [4] with 0.05 %
relative uncertainties. High-voltage impulses, on theother hand, are much more difficult to measure accu-rately because of the wide-bandwidth devices andinstrumentation necessary to faithfully capture the high-frequency components of these transient signals. Typi-cally, the measurement devices used for scaling thevoltages to measurable levels must be physically large tobe capable of withstanding the high voltages imposed onthem and their large size makes them susceptible towave propagation effects, pickup of extraneous signals,stray capacitance, and residual inductance effects thatdistort the measurements of fast transients. Recently,international standards on high-voltage test techniqueshave been introduced that require voltage dividers usedin high-voltage impulse measurements to be traceable tonational standards [1, 5]. A facility for the testing ofpulse voltage dividers has been developed in response tothe needs of the electric power and the pulsed powercommunities. The facility consists of a set of Kerr
639
Volume 101, Number 5, September–October 1996Journal of Research of the National Institute of Standards and Technology
electro-optic measurement systems having overlappingvoltage ranges and a reference voltage divider. The Kerrsystems are well-suited for impulse voltage measure-ments because of their excellent high-frequencyresponse characteristics and relative immunity fromelectromagnetic interference. The reference voltagedividers developed at NIST are physically small, oil-immersed devices with response times of the order of10–9 s. The measurement systems described in this paperare designed for testing compact resistive high-voltagedividers of the type used in pulse power machines, butthe techniques are applicable to the testing of free-stand-ing impulse voltage dividers used by the electric powerindustry.
This paper describes techniques developed at NIST toreduce the measurement uncertainties in high-voltageimpulse measurements made with two types of high-voltage devices: resistive high-voltage dividers and elec-tro-optic Kerr cells. These two types of systems arebased on very different measurement principles. Thevoltage divider samples a fraction of the input voltagethat can be easily measured with an analog oscilloscopeor digitizer. The divider itself must have adequate insu-lation and physical dimensions large enough to with-stand the full applied voltage, but must also have thewide bandwidth necessary to scale microsecond orsubmicrosecond high-voltage transients with minimaldistortion. Additionally, the voltage recorder must havesufficient resolution to measure the fast waveforms. Kerrcells, on the other hand, are electro-optic transducerswhose optical transmission properties depend upon theapplied voltage. They are inherently fast because theirresponse is limited primarily by molecular reorientationtimes of the Kerr liquid, which are subnanosecond [6].Additional restrictions on the temporal response of theKerr cell measurement system are imposed by the band-width limitations of the photodetector used to measurethe transmitted light. The improvements in measure-ment techniques using both dividers and Kerr cells en-able the determination of divider ratios of test dividerswith less than 0.4 % expanded relative uncertainties.The uncertainty is established using a coverage factor ofk = 2 and is thus a 2 standard deviation estimate [7, 8].The definition of expanded measurement uncertaintiesis found in Refs. [7] and [8], and will be discussed insubsequent sections of this paper. The level of uncer-tainty of 0.4 % is less than the requirements of thestandards applicable to high-voltage impulse measure-ments by nearly an order of magnitude for ordinarylaboratory dividers, and by over a factor of two forreference measurement systems [1, 5]. The next sectionof this paper presents a description of the referencevoltage divider system developed at NIST followed by a
discussion of the design and operation of Kerr electro-optic measurement systems. The paper concludes with adiscussion of the comparative measurement techniquesused for determination of the ratios of pulse voltagedividers.
2. NIST Impulse Voltage Divider Mea-surement System
2.1 Resistive Divider Measurement Uncertainties
The purpose of an impulse voltage divider measuringsystem is to provide a means of reducing the high-voltage signal to levels which are compatible with datarecording equipment. In the ideal case, the voltagedivider linearly scales the high voltageU with a fixedratio DR:
U = DRV , (1)
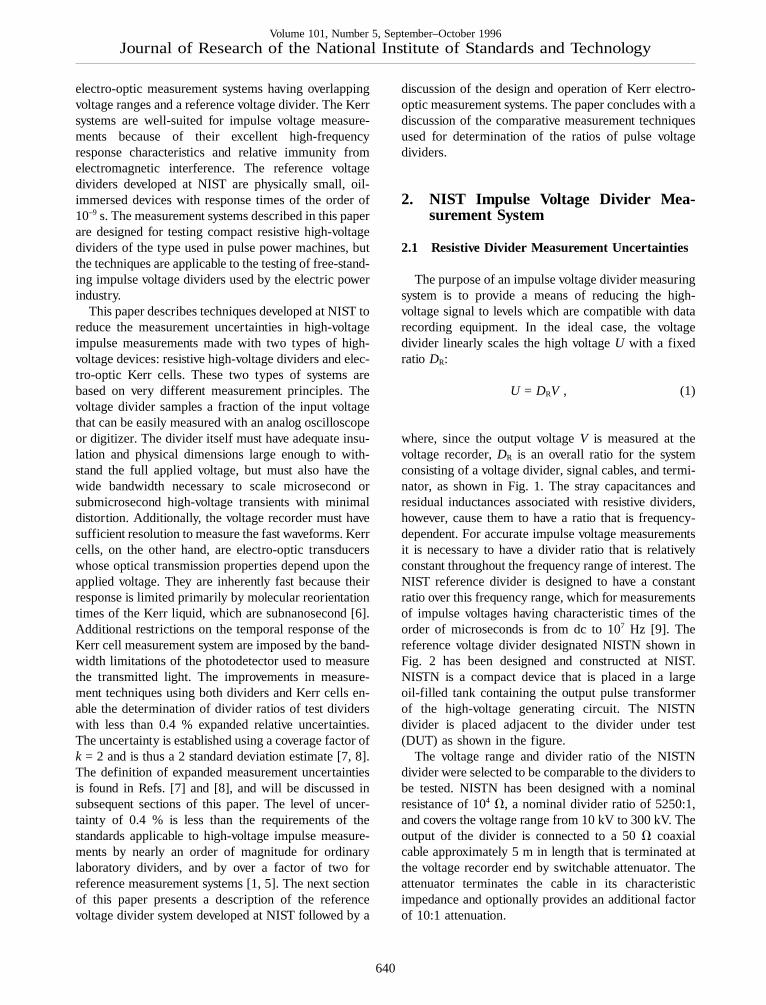
where, since the output voltageV is measured at thevoltage recorder,DR is an overall ratio for the systemconsisting of a voltage divider, signal cables, and termi-nator, as shown in Fig. 1. The stray capacitances andresidual inductances associated with resistive dividers,however, cause them to have a ratio that is frequency-dependent. For accurate impulse voltage measurementsit is necessary to have a divider ratio that is relativelyconstant throughout the frequency range of interest. TheNIST reference divider is designed to have a constantratio over this frequency range, which for measurementsof impulse voltages having characteristic times of theorder of microseconds is from dc to 107 Hz [9]. Thereference voltage divider designated NISTN shown inFig. 2 has been designed and constructed at NIST.NISTN is a compact device that is placed in a largeoil-filled tank containing the output pulse transformerof the high-voltage generating circuit. The NISTNdivider is placed adjacent to the divider under test(DUT) as shown in the figure.
The voltage range and divider ratio of the NISTNdivider were selected to be comparable to the dividers tobe tested. NISTN has been designed with a nominalresistance of 104 V, a nominal divider ratio of 5250:1,and covers the voltage range from 10 kV to 300 kV. Theoutput of the divider is connected to a 50V coaxialcable approximately 5 m in length that is terminated atthe voltage recorder end by switchable attenuator. Theattenuator terminates the cable in its characteristicimpedance and optionally provides an additional factorof 10:1 attenuation.
640
Volume 101, Number 5, September–October 1996Journal of Research of the National Institute of Standards and Technology
Fig. 1. Resistive divider and Kerr electro-optic high-voltage impulse measurement systems. The basic system consists of a light source, crossedpolarizers, Kerr cell, photodetector, amplifier, and oscilloscope. (DUT is the divider under test.)
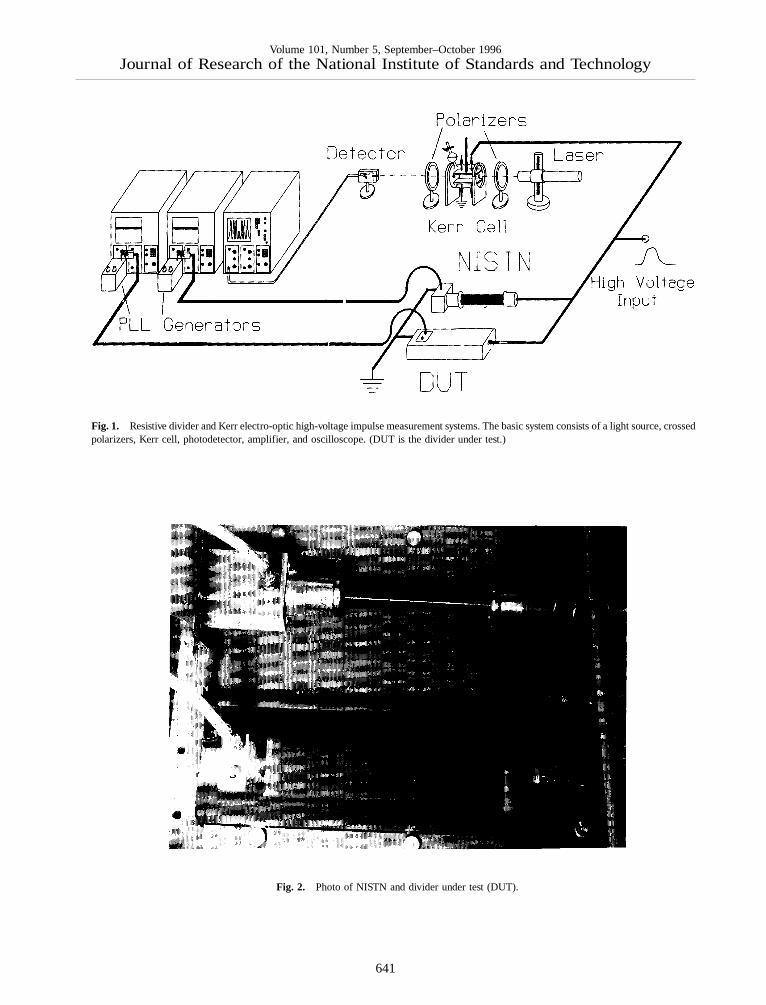
Fig. 2. Photo of NISTN and divider under test (DUT).
641
Volume 101, Number 5, September–October 1996Journal of Research of the National Institute of Standards and Technology
The standard uncertainty, (i.e., a 1 standard deviationestimate) of the high voltage measured by the referencedivider NISTN, d(U ), is found by applying the law ofpropagation of uncertainty to Eq. (1):
d2(U ) = V2d2(DR) + DR2 d2(V), (2)
whered(DR) andd(V) are the standard uncertainties ofthe ratio DR and output voltageV, respectively. Therelative standard uncertainty in the high voltage,dr(U ) is
dr(U ) = [d r2(DR) + d r
2(V)]1/2, (3)
where d r2(U ) ≡ d2(U)/(U)2, dr
2(DR) ≡ d2(DR)/DR2, and
d r2(V) ≡ d2(V)/V2. The law of propagation of uncertain-
ties can be found in the Appendix A of this paper and inRef. [8]. To minimize the uncertainty in the measuredhigh voltage, the uncertainties in both the referencedivider ratio and the measured divider output voltage,dr(DR) anddr(V), respectively, must be minimized; themajor sources of these uncertainties are given in Table 1.The overall ratioDR is determined by the impedances ofthe signal cables, signal and divider grounds, and atten-uator, in addition to those of the divider itself. Theuncertainty inDR is primarily associated with uncer-tainties in the measurement system impedances whilethe uncertainty in the output voltage is primarily associ-ated with uncertainties in the scale factors of the voltagerecorder. The other factors listed in Table 1 are mini-mized through careful design and shielding of the mea-surement system.
Table 1. Possible sources of voltage divider measurement uncertain-ties
Effect Parameter affected
Nonconstant scale factor over DR
frequency range of interest
Heating of windings (divider ratio DR
dependent on temperature)
Voltage coefficient (divider ratio DR
dependent on voltage)
Poor circuit grounding DR
Pickup of radiated and coupled signals V
Voltage recorder signal distortion V
The NIST reference voltage divider is of the resistivetype, i.e., the device’s impedance is primarily resistive.
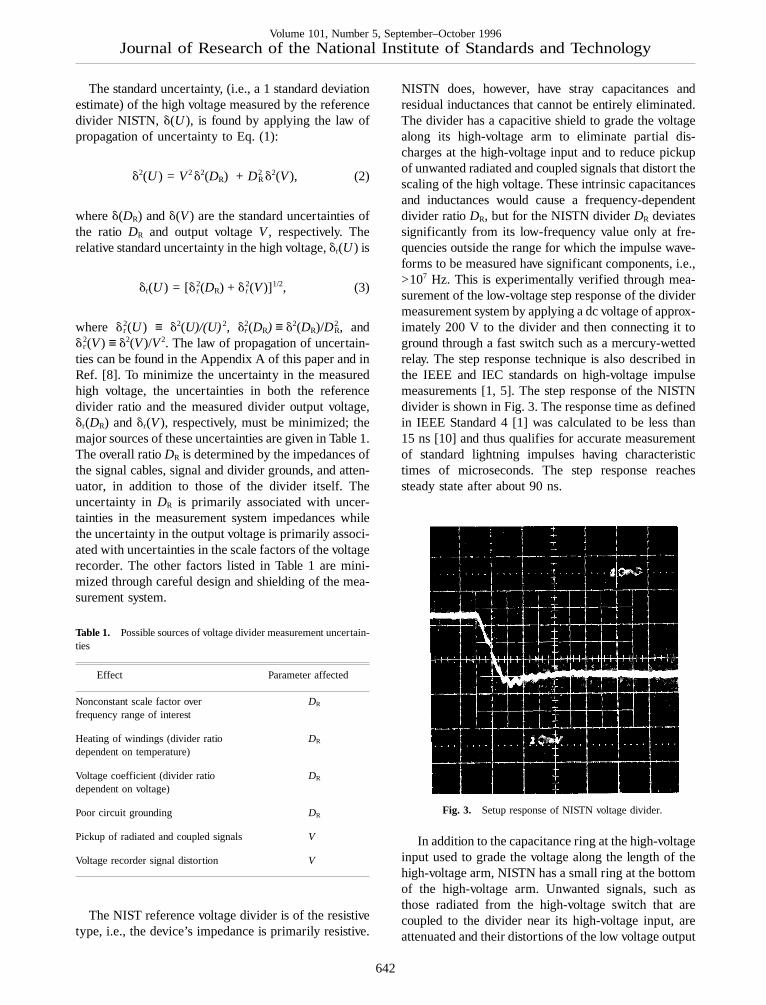
NISTN does, however, have stray capacitances andresidual inductances that cannot be entirely eliminated.The divider has a capacitive shield to grade the voltagealong its high-voltage arm to eliminate partial dis-charges at the high-voltage input and to reduce pickupof unwanted radiated and coupled signals that distort thescaling of the high voltage. These intrinsic capacitancesand inductances would cause a frequency-dependentdivider ratioDR, but for the NISTN dividerDR deviatessignificantly from its low-frequency value only at fre-quencies outside the range for which the impulse wave-forms to be measured have significant components, i.e.,>107 Hz. This is experimentally verified through mea-surement of the low-voltage step response of the dividermeasurement system by applying a dc voltage of approx-imately 200 V to the divider and then connecting it toground through a fast switch such as a mercury-wettedrelay. The step response technique is also described inthe IEEE and IEC standards on high-voltage impulsemeasurements [1, 5]. The step response of the NISTNdivider is shown in Fig. 3. The response time as definedin IEEE Standard 4 [1] was calculated to be less than15 ns [10] and thus qualifies for accurate measurementof standard lightning impulses having characteristictimes of microseconds. The step response reachessteady state after about 90 ns.
Fig. 3. Setup response of NISTN voltage divider.
In addition to the capacitance ring at the high-voltageinput used to grade the voltage along the length of thehigh-voltage arm, NISTN has a small ring at the bottomof the high-voltage arm. Unwanted signals, such asthose radiated from the high-voltage switch that arecoupled to the divider near its high-voltage input, areattenuated and their distortions of the low voltage output
642

Volume 101, Number 5, September–October 1996Journal of Research of the National Institute of Standards and Technology
signal from the divider are small. If they are coupleddirectly to the bottom of the high-voltage arm they areattenuated less and their distorting effects are greater,but by placing a small capacitive ring at the bottom, thisarea of the high-voltage arm is shielded from undesir-able radiated signals. The same is true of unwantedsignals coupled directly from the high-voltage input tothe lower windings of the high-voltage arm; pickup fromexternal sources is thereby minimized. A test is per-formed to ensure that this pickup is negligible. Thehigh-voltage input to the voltage divider is disconnectedfrom the impulse generator and connected to ground, thegenerator is energized at a test voltage level, and theoutput of the voltage divider is measured. The pickup isfound to be substantially less than 0.1 % of what thenormal output of the divider would be at that voltagelevel. The penalty paid for including a capacitance ringat the bottom of the high-voltage arm is an increase inthe response time and a frequency-dependent dividerratio. This is not a significant problem since the capaci-tance added by the ring is not excessive and the mea-sured response time of less than 15 ns is still smallenough for the divider to measure microsecondimpulses accurately.
Another source of uncertainty in impulse measure-ments is poor ground connections between the voltagedivider, which is located near the high-voltage genera-tor, and the voltage recorder, which is located in ashielded room at a distance of some five meters from thegenerator. To avoid problems of pickup and voltagedrops across the signal cable ground, the cable is runthrough a braided sheath placed on a copper sheet15.2 cm wide connected to the signal ground at both thedivider and oscilloscope ends. The effective dc groundimpedance is measured to be less than 30 mV, makingthis source of uncertainty in the divider ratio negligible.
2.2 Pulse Level Line (PLL) Method
The second term in Eq. (3),dr2(V), is associated with
the voltage measurement. Through the use of a specialtechnique known as the pulse level line (PLL) method,conventional analog storage oscilloscopes which gener-ally have specified relative uncertainties of the order of1 % can have relative standard uncertainties in the mea-sured output voltage peak reduced to less than 0.1 %[11]. Variations of a basic method called the “slideback”measurement technique, which uses a voltage referenceor references, are used to ensure or improve the accu-racy of a peak impulse voltage measurement. In theslideback technique, an offset voltage is applied to astorage oscilloscope input and the peak of the impulse ismeasured relative to a known dc voltage level that isapplied to the oscilloscope input after the impulse
voltage is measured. Because the dc level provides anindependent voltage reference, it is possible to use amore sensitive vertical scale on the oscilloscope thanwould otherwise be required if the ground line was usedas reference. Similarly, in another commonly-usedmethod called the “level line” measurement technique,the peak measurement is based upon two dc level lineswhich are selected to be slightly greater and slightlysmaller in amplitude than the peak of the impulse.
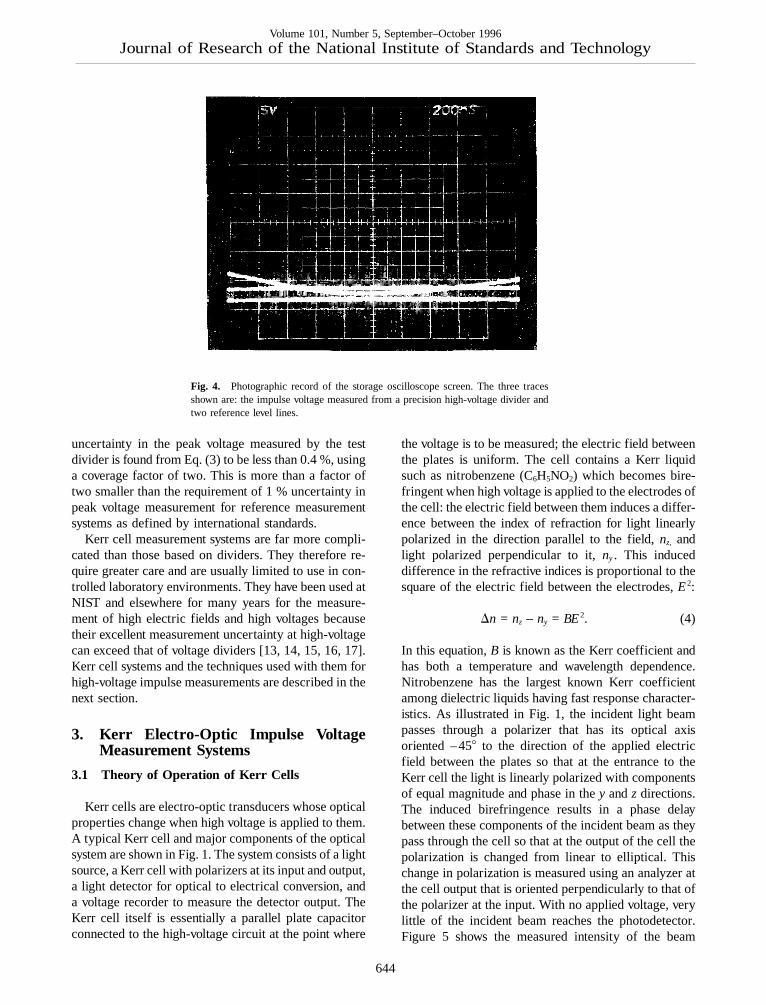
The accuracy of these methods relies upon the as-sumption that the oscilloscope amplifier circuits havethe same response to the voltage impulse as they do tothe dc stimulus. If there are slight differences in how theoscilloscope amplifier responds to an impulse versus dc,then the dc level line and slideback methods do notprovide the best accuracy for the peak voltage measure-ment. We have therefore devised a method to provide theapplication of reference voltage levels to the oscillo-scope in the form of fast-rising voltage steps. Thismethod more closely simulates the conditions underwhich impulse voltages are measured and avoids possi-ble problems associated with differences between the dcand the impulse measurement amplifier responses. Thusthe amplifier is stimulated by the calibration level linesin a manner similar to the impulse to be measured. Thevoltage at the oscilloscope input does not instanta-neously rise to the level line voltage when it is applied,but rather rises as (1–e–t/t), wheret is the charging timeconstant of the oscilloscope and is less than 100 ns. Thepulse level line comparisons are made only at timeslonger than 8t when the level line is within 0.034 % ofthe final level. A photographic record of the storageoscilloscope screen with the PLL traces is shown inFig. 4.
The relative standard uncertainty in the output voltagepeakdr(Vp) using the PLL method is estimated to beapproximately 0.06 %, as shown in Appendix A. ThePLL technique has been verified by measuring a stan-dard voltage step maintained by the Electricity Divisionat NIST [12]. The average of four measurements of the5 V step using the PLL technique was within 0.02 % ofits calibrated value.
Components of the standard uncertainty in theNISTN divider ratio due to the effects listed in Table 1are minimized through the design and shielding consid-erations described above. The relative expanded uncer-tainty (coverage factor ofk = 2 and thus a 2 standarddeviation estimate) in the test divider ratio is less than0.4 %, which is based upon a relative standard uncer-tainty in the reference divider ratiodr(DR) that is esti-mated to be less than 0.2 % through comparison withKerr cell measurement systems, as described inAppendix A. Using the estimate fordr(Vp) of 0.06 % andthe estimate fordr(DR), the relative expanded relative
643
Volume 101, Number 5, September–October 1996Journal of Research of the National Institute of Standards and Technology
Fig. 4. Photographic record of the storage oscilloscope screen. The three tracesshown are: the impulse voltage measured from a precision high-voltage divider andtwo reference level lines.
uncertainty in the peak voltage measured by the testdivider is found from Eq. (3) to be less than 0.4 %, usinga coverage factor of two. This is more than a factor oftwo smaller than the requirement of 1 % uncertainty inpeak voltage measurement for reference measurementsystems as defined by international standards.
Kerr cell measurement systems are far more compli-cated than those based on dividers. They therefore re-quire greater care and are usually limited to use in con-trolled laboratory environments. They have been used atNIST and elsewhere for many years for the measure-ment of high electric fields and high voltages becausetheir excellent measurement uncertainty at high-voltagecan exceed that of voltage dividers [13, 14, 15, 16, 17].Kerr cell systems and the techniques used with them forhigh-voltage impulse measurements are described in thenext section.
3. Kerr Electro-Optic Impulse VoltageMeasurement Systems
3.1 Theory of Operation of Kerr Cells
Kerr cells are electro-optic transducers whose opticalproperties change when high voltage is applied to them.A typical Kerr cell and major components of the opticalsystem are shown in Fig. 1. The system consists of a lightsource, a Kerr cell with polarizers at its input and output,a light detector for optical to electrical conversion, anda voltage recorder to measure the detector output. TheKerr cell itself is essentially a parallel plate capacitorconnected to the high-voltage circuit at the point where
the voltage is to be measured; the electric field betweenthe plates is uniform. The cell contains a Kerr liquidsuch as nitrobenzene (C6H5NO2) which becomes bire-fringent when high voltage is applied to the electrodes ofthe cell: the electric field between them induces a differ-ence between the index of refraction for light linearlypolarized in the direction parallel to the field,nz, andlight polarized perpendicular to it,ny. This induceddifference in the refractive indices is proportional to thesquare of the electric field between the electrodes,E2:
Dn = nz – ny = BE2. (4)
In this equation,B is known as the Kerr coefficient andhas both a temperature and wavelength dependence.Nitrobenzene has the largest known Kerr coefficientamong dielectric liquids having fast response character-istics. As illustrated in Fig. 1, the incident light beampasses through a polarizer that has its optical axisoriented –458 to the direction of the applied electricfield between the plates so that at the entrance to theKerr cell the light is linearly polarized with componentsof equal magnitude and phase in they andz directions.The induced birefringence results in a phase delaybetween these components of the incident beam as theypass through the cell so that at the output of the cell thepolarization is changed from linear to elliptical. Thischange in polarization is measured using an analyzer atthe cell output that is oriented perpendicularly to that ofthe polarizer at the input. With no applied voltage, verylittle of the incident beam reaches the photodetector.Figure 5 shows the measured intensity of the beam
644
Volume 101, Number 5, September–October 1996Journal of Research of the National Institute of Standards and Technology
at the Kerr cell output that is oriented perpendicularly tothat of the polarizer at the input. With no appliedvoltage, very little of the incident beam reaches thephotodetector. Figure 5 shows the measured intensity ofthe beam at the Kerr cell output as a high-voltage im-pulse is applied, with the applied voltage shown forcomparison. As the voltage increases, the inducedchange in the polarization of the beam causes more andmore of the beam to be passed by the analyzer until thetransmission is maximized. Further increases in the ap-plied voltage causes less light to be transmitted untilminimum transmission is reached again. As the voltageis increased even further, the light transmission in-creases again and the cycle is repeated.
The number of oscillations in light intensity is deter-mined by the amplitude of the applied voltage and thecell constant, a parameter that at constant temperatureis fixed by the cell geometry and Kerr electro-opticcoefficientB of the liquid. The relation of the measuredoutput light intensityI to the applied voltageU for anideal Kerr measurement system is given by [18]
I /Im = sin2[(p/2)(U /Um)2]. (5)
Im is the light intensity at maximum transmission. Thecell constantUm is defined as
Um = d/(2Bl )1/2, (6)
(a)
(b)Fig. 5. Kerr Measurement system output signal. a) the sinusoidal variation in lightintensity produced by the Kerr cell and polarizers as measured by the photodetector;b) the applied voltage as measured by a precision high-voltage divider.
645

Volume 101, Number 5, September–October 1996Journal of Research of the National Institute of Standards and Technology
whered is the electrode spacing andl is the electrodelength. The term “cell constant” has an historical basisand in fact is not strictly constant because it is a functionof the Kerr coefficientB, which changes with tempera-ture and wavelength. The high-voltage impulse measure-ments are made with monochromatic light and tempera-ture corrections toUm are made using the measuredtemperature dependence ofB for nitrobenzene [19]. Thedependence ofB on temperatureT is given by
B(T) = a0 + a1 T–1 + a2T–2, (7)
where the parametersa0, a1, and a2 that produce thebest fit to measured data are given in Ref. [19] and alsothe Appendix to this paper. The relationship between thecell constant at temperatureT2 and the cell constant attemperatureT1 is from Eq. (6)
Um2 = Um1[B(T1)/B(T2)]1/2. (8)
whereUm1 ≡ Um(T1) andUm2 ≡ Um(T2). In general, theKerr cell constant is calibrated at temperatureT1 andcorrected using Eqs. (7) and (8) to the temperatureT2 ,which is the cell temperature at the time of test dividercalibration.
Equation (6) is derived by assuming that the appliedelectric field encountered by the light beam is uniformand contained entirely between the plate electrodes.Since there are always nonuniform fringing fields at theedges of the electrodes, the Kerr cell constantUm willdiffer from that calculated using Eq. (6). However, theedge effects can be accounted for by replacing the elec-trode lengthl with an effective electrode lengthl ' inEq. (6).
Each half-cycle of the Kerr output waveform is his-torically called a “fringe” because it is the result ofeither constructive or destructive interference of theorthogonal components of the output light beam, as inan interference fringe pattern. The fringe numbern isdefined as the square of the ratio of the voltage appliedto the cell to the cell constant:
n ≡ (U /Um)2. (9)
The applied voltage at any timet can then be recon-structed from the Kerr waveform by substituting Eq. (9)into Eq. (5) and solving forn to get
N +2p
sin–1 ÎI (t )Im
, N even,n(t ) =
N +1 –2p
sin–1 ÎI (t )Im
, N odd,
(10)
which can be summarized as
n(t ) = N + 2 SN2
– intSN2DD
+ S–1DN 2p
sin–1ÎI (t )Im
. (11)
Here,N = int(n) is the integer part ofn and int(N/2) isthe integer part ofN/2. The voltage is found fromEq. (9) to be
U = n1/2Um. (12)
The high voltage input can be calculated from the Kerrcell output waveform using Eq. (12).
3.2 Sources of Uncertainty in Kerr Cell Measure-ments
The accuracy of the Kerr measurement depends uponseveral system characteristics listed in Table 2. Addition-ally, the measurements are sensitive to other effects,particularly the presence of electric charges within theliquid which distort the normally uniform electric fieldbetween the electrodes. In general, the Kerr cell re-sponse time is in the 10 ns range or less and is more thanadequate for the measurement of microsecond tran-sients. The same is true of the bandwidths of voltagerecorders such as analog oscilloscopes and digitizers,which can exceed 108 Hz.
The peak voltageU of an impulse may be found fromEq. (12) by counting the number of fringes (cycles)n ofthe waveform of the type shown in Fig. 5, and using theKerr cell constantUm2, which is the Kerr cell constantcalculated fromUm1 by applying the correction for tem-perature. The relative standard uncertainty in the peakvoltage measurement,dr
2(U ), is found from Eq. (12) tobe (see Appendix A)
dr(U ) = [dr2(n)/4 + dr
2(Um)]1/2 , (13)
where as beforedr(U ) ≡ d(U )/U , and wheredr(n) ≡d(n)/n, anddr(Um) ≡ d(Um)/Um are the relative standarduncertainties in the fringe number and Kerr cell con-stant, respectively. Equation (13) illustrates a usefulproperty of Kerr cells for the measurement of high-voltage impulses: If the standard uncertainty in thefringe numberd(n) is only a fraction of a fringe and isindependent of fringe number, the relative standard un-certaintydr(n) decreases with increasingn (i.e., as theapplied voltage increases). In the limit of very largefringe number the relative standard uncertaintydr(U )depends solely upon the cell constant uncertainty. Thus,
5646

Volume 101, Number 5, September–October 1996Journal of Research of the National Institute of Standards and Technology
the uncertainty at higher voltages may be less thanat lower voltages. This upper bound in the standarduncertainty in the fringe number can be understood byexamining Eq. (10), which shows thatn comprises twocomponents, an integer fringe numberN, and a frac-tional component. The uncertainty in the fringe numberthen has two components, namely the uncertainties inthe integer and fractional parts. The uncertainty in theinteger partN is negligible because the large differencein the measured peak voltage determined with the Kerrcell system and either the reference or test divider wouldbe immediately apparent ifN was miscounted, even if byonly one integer fringe. The uncertainty in the fractionalpart is less than 0.006, as estimated in the Appendix A,and therefored(n) is bounded.
Table 2. Possible sources of uncertainty in high-voltage impulsemeasurements with Kerr cells
Type of Description Parameters affectedeffect
Optical Light source intensity stability I , Im
Spectral purity of light Um
Beam width Um
Alignment of beam with centralaxis of cell Um
Alignment of polarizers I , Im
Beam bending due to polarizers I , Im
Internal reflections within the cell Um
Presence of additional birefringent I , Im
elements
Electro- Purity of Kerr liquid Um
optical Presence of significant electric charge Um
(space charge)Temperature variations in the Kerr Um
liquidElectric field uniformity between cell Um
electrodesPhotodetector dynamic response and I , Im
linearityDimensional changes in the cell due Um
to temperature changes
Electrical Voltage recorder signal distortion I , Im
Dynamic response of Kerr cell Um
The uncertainty in the measured fringe number arisesfrom those sources listed in Table 2 that affectI andIm.Even if these sources produce a standard uncertainty inthe fringe number as large as 0.01, the relative standarduncertainty is reduced to the order of 0.1 % for voltagelevels producing more than ten fringes.
The Kerr voltage measurement system used at NISTfor testing of compact voltage dividers uses an intensity-stabilized helium-neon laser as a light source which hasnegligible variation in the intensityIm over the measure-ment time window of less than 15ms. The effects of
positioning the optical elements in the measurement sys-tem are two-fold: first, misalignment of the polarizersintroduces a constant phase shift between the beamcomponents in they andz directions in addition to thatproduced by the induced birefringence; and second,misalignment of the beam results in a change in effec-tive path lengthl ' which changes the cell constant ac-cording to Eq. (6). The dependence of effective lengthon position of the beam has been derived by Thacher[20]:
l ' = l {1+(d/lp )
[1 + 0.5 ln(2pz/d)/sin(2pz/d)]}. (14)
In this equation, the electrode spacing isd, the physicalelectrode length isl , and the vertical displacement fromthe center of the parallel, horizontally-mounted elec-trodes isz. If the error in positionz is 10 % (z/d = 0.01),then the resultant change inl ' is less than 0.05 % ford = 0.635 cm andl =15.24 cm. With proper care inalignment, significant errors in the effective cell con-stant are avoided.
The dynamic response of the Kerr cell is a potentialsource of error in the effective cell constant, but this islimited by the dipolar relaxation timet , which charac-terizes the dependence of dielectric constant on thefrequency of the applied electric field, known as thedielectric dispersion. Measurements of the dielectricconstant of nitrobenzene, however, show it to befrequency-independent from dc to 108 Hz [21]. Theerrors for the pulses used in divider tests, which haveminimal frequency components above a few megahertz,are also believed to be negligible.
To minimize the uncertainties and errors of Kerr cellmeasurements, the linearity of the opto-electricalphotodetector must be calibrated and maintained towithin 1 % or less. The absence of significant nonlinear-ity in the Kerr measurement is seen in Fig. 6, whichshows the measured output of the Kerr cell system. Thecurve superimposed upon the measured curve is thatcalculated from the applied voltage measured simulta-neously by the reference voltage divider and calculatedusing Eq. (9). The curves are normalized to emphasizethe difference in their temporal responses. Although thefitted waveform does not match the measured waveformat the points corresponding to the peak voltage in Fig. 6,the relative difference in the fringe numbers calculatedfrom the two waveforms is less than 0.02 %. The oper-ating conditions of the photodetectors have been opti-mized to have nonlinearities of less than 0.1 % [11].
The oscilloscopes and digital recorders used in thecalibrations have 3 dB bandwidths between 100 MHzand 400 MHz, which are adequate for the measurement
647

Volume 101, Number 5, September–October 1996Journal of Research of the National Institute of Standards and Technology
Fig. 6. Ideal and actual Kerr measurement system output waveforms. The actual mea-sured Kerr system waveform with the ideal waveform calculated from Eq. (1) superim-posed.
of approximately 100 fringes with the pulses used forthe testing of dividers. There are practical upper limitsto the number of fringes that are usable when analogstorage oscilloscopes are used to record the Kerr traces.The practical limit with analog storage devices is theresolution of the measured Kerr fringes as determinedby the width of the trace and the “bloom” of the storagescreen. This limit has been found to be approximately100 fringes.
In addition to the uncertainties in the measuredfringes, the major source of the uncertainties in Kerrmeasurements is the value of the Kerr cell constantUm1,calibrated at temperatureT1, used to calculate the peakvoltage from the Kerr trace. This value is calibratedthrough comparison of pulse voltage measurementswith a second reference voltage divider. Uncertainties inthe cell constant correction are introduced through theuncertainty in the measurement of the cell temperature,which is less than 0.18C. This uncertainty in cell con-
stant could be reduced if the Kerr cell calibration couldbe performed using ac or dc voltages since the ratios ofsteady-state voltage dividers such as those used for dc orac voltages are known with much lower uncertainty thanimpulse dividers. The difficulty in performing the Kerrcell calibrations with ac or dc is that significant electriccharge appears in the liquid when the voltage is appliedfor times greater than 10–4 s that appreciably distorts theelectric field in the electrode gap. The field distortionmodifies the relationship between the field in the centerof the cell and the voltage on the electrodes so thatEq. (5) is no longer valid. The cell must therefore becalibrated using impulse voltages, where the effects ofcharges in the liquid are insignificant for times typicallyless than 100ms [18].
NIST maintains a pair of Kerr cells with overlappingranges. Cell B has a characteristic Kerr cell constant of6.4 kV at 21.28C and Cell C has one of 46.8 kV at24.28C. When pulses having peak voltages of 50 kV to
648

Volume 101, Number 5, September–October 1996Journal of Research of the National Institute of Standards and Technology
60 kV are applied, the output of Cell C has only one ortwo fringes while that of Cell B has nearly 100 fringes.The large fringe number from Cell B provides muchlower uncertainty in the peak voltages measured in thisrange than Cell C. At higher voltages, the Kerr measure-ments with Cell C have smaller uncertainties than at thelower voltages levels.
The NISTN divider together with the Kerr cellsystems have been used in complementary fashion tocalibrate other compact impulse dividers using compar-ative measurements. These techniques are described inthe next section.
4. Comparative Measurement Techniques
Impulse voltage measurement systems invariably in-troduce some distortion due to inadequate bandwidth,voltage coefficient, and other factors. This distortionmay be either negligible or totally unacceptable, depend-ing on the allowable uncertainties associated with theparticular measurement requirement. According toIEEE and IEC standards [1, 5], a system which is usedto measure standard lightning impulses should have anuncertainty of less than 3 % in peak voltage measure-ments. For reference measurement systems the stan-dards require an uncertainty of 1 % in peak voltagemeasurement. The standards also recommend that thedynamic behavior of the measurement system can beevaluated by using parameters obtained from the stepresponse, but a more reliable and simplified method
prescribed by the standard is based on simultaneousmeasurements of a high-voltage impulse by an indepen-dent reference system and the system under test. As afirst step, international comparative measurements weremade in four national laboratories and the relative differ-ences among them were reported [22]. Investigationshave also been made of the interactions between twosystems configured for simultaneous measurements andof methods for minimizing these interactions [9].
Determinations of the voltage divider ratio of a testdivider are performed at NIST by making simultaneousmeasurements with a well-characterized measurementsystem—either the reference voltage divider, Kerr cell,or both. The peak voltage measured by the referencesystem is used with the output voltage of the test dividerto determine the unknown divider ratioDR according toEq. (1). For compact dividers the comparison is madebetween the test divider and the reference divider,NISTN, in which the test and reference dividers areplaced side-by-side under oil, close to the output of theimpulse voltage generator, and connected to the genera-tor with a very low-impedance conductor. The Kerrsystem is also placed close to both dividers and con-nected to the impulse generator via a low-impedanceconductor. The Kerr cell system, seen in Fig. 7, is im-mersed in a mineral oil bath located on top of the im-pulse generator. The oil bath prevents flashover aroundthe cell and partial discharges on the surface of the cellwhen high-voltage pulses are applied, and also providestemperature stability. Temperature measurements areperiodically taken for correction of the cell constant.
Fig. 7. Kerr cell and high-voltage impulse generator. The Kerr cell is immersed in an oil bath toprovide temperature stability. The oil-filled tank beneath the Kerr cell contains the high-voltage pulsetransformer and both the reference divider and divider under test.
649
Volume 101, Number 5, September–October 1996Journal of Research of the National Institute of Standards and Technology
The high-voltage pulse generator consists of a pulse-forming network (PFN) charged to a high dc voltagethat is switched into a pulse transformer. The pulseshape can be modified somewhat by simply removing oradding inductors in the PFN circuit. The waveform thatis typically used in the testing of impulse dividers isGaussian-shaped, having a full width at half maximumof approximately 8ms and a total duration of less than15 ms.
Preliminary measurements of the test divider aremade before placing the divider into the test system. Theresistive components measured include the resistancesof the high-voltage arm, low voltage arm, cable centerconductor, sheath, and terminator. The overall voltageratio is then calculated from the equivalent circuit andthe measured resistance values. After the divider is in-stalled in the test system, the dc voltage ratio is found byapplying a range of dc voltages between 25 V and 250 Vto the test divider and simultaneously measuring theinput and output with precision digital multimeters. Thepickup test described in Sec. 2.1 is performed bygrounding the input to the test divider in situ and ener-gizing the impulse generator. The final low voltage teston the divider that is made is the step response measure-ment where a dc voltage is applied to the divider andthen rapidly switched to ground via a mercury-wettedrelay. The output of the divider is measured to ensurethat the response time of the divider is not excessivelylong. The test divider step response is similar to theNISTN step response shown in Fig. 3.
To evaluate the impulse voltage ratio of a resistivedivider under test the following procedure is used: Whenthe high-voltage impulse is applied, the oscilloscopesare simultaneously triggered to capture the output wave-forms of the NIST reference divider, the divider undertest, and the Kerr cell, or some combination of the three.Two dual-channel analog storage oscilloscopes havingbandwidths of 100 MHz are used to capture the threewaveforms. Photographs of the stored waveforms aretaken within a few seconds and position measurementsof the level lines, peak voltages, and Kerr waveformparameters are made with a caliper mounted on a platenwhich secures the photographs. A computer programhas been written to perform the calculations for the peakoutput voltage from the measurements from the Kerrcell and from the dividers. The heights of the pulse levellines and of the divider output voltage peak are enteredwith the level line voltages for each divider and thereference divider ratio. The peak output voltages arethen calculated according to the pulse level line tech-nique. The heights of the baseline intensityI0, intensitymaximum Im, and intensity I corresponding to thevoltage peak are measured from the Kerr waveform andentered along with the Kerr cell temperature and Kerr
cell constantUm at the calibration temperatureT1. Theprogram calculates the peak input voltages applied tothe NIST divider and Kerr cell system and provides ahardcopy output. The ratio of the test divider is deter-mined using both NISTN and the Kerr cell as referenceand displays the difference of the two to ensure theconsistency of the results. The unknown divider ratio isfound in this way over the desired voltage range, typi-cally 10 kV to 300 kV.
The expanded uncertainty in the test divider ratioover this voltage range determined by the comparison isestimated to be less than 0.4 % using a coverage factorof k = 2. The test pulse voltage dividers are used asreference dividers by other laboratories such as SandiaNational Laboratories, which has developed an auto-mated calibration system for reference/test divider com-parisons [23]. The divider ratio of the reference dividermeasurement system NISTN determined by calculationfrom the measurements of its component resistances andfrom low voltage measurements at dc agree to within0.1 %. The expanded relative uncertainty of the refer-ence divider ratio estimated through comparisons withreference Kerr cell systems using high-voltage impulsesis less than 0.2 %. Efforts continue at NIST to furtherreduce this uncertainty. Techniques are being developedfor the characterization of the Kerr cell constantUm
through comparison with a reference divider using digi-tal rather than analog recorders. The digitized data per-mit the comparison to be made over the entire impulsevoltage waveform, instead of only at the voltage peak asdone with the analog oscilloscopes. Curve fitting tech-niques have been used with Eq. (6) to find the cellconstant that minimizes the error between the fitted andcalculated curves using the voltage waveform deter-mined by the reference divider [24].
NIST also has the capability of testing the ratio offree-standing voltage dividers. The accuracy in impulsemeasurements at high voltages that is possible withcompact dividers immersed directly in the tank housingthe output pulse transformer of the high-voltage genera-tor is greater than that achievable with free-standingdividers, but uncertainties in the ratio determination ofless than 1 % may be achievable. The free-standingreference divider NIST4 is similar in design to theNISTN divider: The high-voltage arms are similar, con-sisting of resistive wire counterwound on a glass ceramicsubstrate and surrounded by insulating oil; the low-voltage side is an array of parallel discrete resistors [10].NIST has a 500 kV Marx-type impulse generator usedto produce standard lightning impulses, which have rise-times of approximately 1.5ms and fall to half the peakvalue in 50ms. The Marx impulse voltage generatorproduces more radiated noise than the pulse-formingnetwork (PFN)-type and therefore unwanted signals of
650

Volume 101, Number 5, September–October 1996Journal of Research of the National Institute of Standards and Technology
significant amplitude may be coupled to the free-standing dividers. A 600 kV PFN-type generator ispresently being installed and tested. Its use shouldreduce the uncertainties due to pickup of extraneoussignals in impulse measurements using free-standingvoltage dividers.
5. Conclusion
The NIST test facility enables the determination ofthe ratio of compact pulse voltage dividers withexpanded relative uncertainties of less than 0.4 % usinga coverage factor ofk = 2. The ratio determinations aremade through comparative measurements with both areference voltage divider and Kerr electro-optic mea-surement system. NIST continues efforts to improvehigh impulse voltage measurements with free-standingvoltage dividers to reduce uncertainties even furtherbelow the 1 % level to support the international stan-dards governing high-voltage test techniques used byindustrial laboratories, which require the verificationthat uncertainties in impulse voltage measurements notexceed 1 % asdetermined through direct intercompari-son with reference measurement systems traceable tonational standards laboratories [1, 5].
6. Appendix A. Uncertainty Consider-ations
The uncertainties of the voltage ratio of the dividerunder test (DUT) are dependent upon the uncertaintiesassociated with the measurement of the output voltagesof the DUT, a reference measurement system which iseither a reference voltage divider or a photodetector thatis used with a Kerr cell, and the uncertainties associatedwith the relationships of these reference output voltagesto their input voltages. The input voltages to the DUTand the reference measurement system are the samesince they are connected in parallel. The expandeduncertainty in the voltage ratio of the test divider isestimated beginning with the simple relationshipbetween the input and output voltages for a resistivevoltage divider:
DT = Up/VT. (15)
Here DT is the ratio of the DUT,Up is the peak inputvoltage, andVT is the measured peak output voltage ofthe DUT. The input voltage is an impulse waveform thatmonotonically increases to the peak voltageUp and thenmonotonically decreases, as shown in Fig. 5b.Up isfound either from simultaneous measurement with areference divider having ratioDR or a Kerr cell measure-
ment system having temperature-corrected cell constantUm2 as
DR VR ≡ UR (16a)Up =
n1/2 Um2 ≡ UK , (16b)
which gives forDT
(DRVR)/VT = f (DR, VR, VT) (17a)DT =
n1/2 Um2/VT = f (n, Um2, VT) (17b)
where the peak output voltage of the reference divider isVR and the fringe number at the voltage peak isn. Thestandard uncertainty in the unknown divider ratioDT isestimated by applying to Eq. (15) the law of propagationof uncertainty, which in general form is [8]
dc2(y) = ON
i=1
(f /xi )2 d2(xi )
+ 2 ON–1
i=1ONj=i+1
(f /xi ) (f /xj ) d(xi , xj ). (18)
It defines the relationship between the combined stan-dard uncertainty in the output quantityy, uc(y), and thequantitiesd(xi ), which are the standard uncertainties ofthe input quantitiesxi. The second term in the aboveequation sums to zero over many measurements if theinput quantities are uncorrelated, which is true in thetwo cases described by Eqs. (17a) and (17b).
6.1 Uncertainties for Divider-Divider Comparisons
Applying the law of propagation of uncertainty toEq. (17a), the uncertainty in the DUT ratio is found fromcomparison with the reference divider output to be
d2(DT) = (VR/VT)2 ? d2(DR) + (DR/VT)2 ? d2(VR)
+ (DRVR/VT2)2 ? d2(VT), (19a)
or when written in relative form
d2r (DT) = d2
r (DR) + d2r (VR) + d2
r (VT), (19b)
whered2r (DT) ≡ d2(DT)/D2
T, d2r (DR) ≡ d2(DR)/D2
R, d2r (VR) ≡
d2(VR)/V2
R, andd2r (VT) ≡ d2(VT)/V2
T. These equations show
5
5
651

Volume 101, Number 5, September–October 1996Journal of Research of the National Institute of Standards and Technology
that the uncertainty in the unknown divider ratio de-pends on the uncertainties in the reference divider ratio,the reference divider output voltage, and the test divideroutput voltage.
The relative uncertainties in output voltagesdr(VR)and dr(VT) in Eqs. (19a) and (19b) are the same inmagnitude since the same technique and equipment areused in both measurements. If the divider ratios of thetest and reference dividers are close, then their outputvoltages are approximately the same. The outputvoltages are measured using the pulse level line (PLL)technique described in Sec. 2.2 and their associateduncertainties are estimated by applying the law of prop-agation of uncertainty to the defining equation for thePLL method, as shown in Sec. 6.1.1.
One approach that has been used to estimated(DR) isto determine the ratio at a low dc voltage, where both theinput and output voltages can be measured with a preci-sion digital multimeter, and then perform a voltage lin-earity check by measuring the peak output of the divideras a function of the charging voltage of the high-voltagegenerator [1]. Alternatively, the divider ratio can be cal-culated from the measured component resistances to-gether with the high-voltage linearity check [1]. Be-cause of the instabilities and large uncertainties in the dchigh-voltage supply and the charging voltage meter,nonlinearities in the high-voltage generator, corona,switching energy dissipation, and other effects, theseapproaches cannot be used to reliably estimate the refer-ence divider uncertainty. In general, the divider ratiouncertainties are much smaller than those of the genera-tor and meter that are used to check voltage linearity, sothe overall uncertainties are dominated by componentsother than that of the divider ratio. However,d(DR) canbe indirectly estimated by taking the difference betweenthe amplitudes of the voltage peaks that are measuredsimultaneously using a Kerr cell (UK) and the referencevoltage divider (UR), as will be shown in Sec. 6.1.2.
6.1.1 Divider Output Voltage MeasurementUncertainties The uncertainties in the peak outputvoltages for the test and reference dividers,d(VT) andd(VR), have the same magnitude for the reasons citedabove. To estimate these uncertainties the general rela-tionship between the measured peak output voltageVp
and the reference voltage levels for the PLL techniqueare used [11]:
Vp = V1 + (V2 – V1) (hp – h1)/(h2 – h1), (20)
wherehp is the measured height ofVp, h1 is the measuredheight of pulse level line 1,h2 is the measured height ofpulse level line 2,V1 is reference voltage 1, andV2 isreference voltage 2. The standard uncertaintyd(Vp) isfound by applying the law of propagation of uncertainty
to Eq. (20):
d2(Vp) = {[( h2 – hp)2 + (hp – h1)2]/(h2 – h1)2} d2(V)
+ {[( V2 – V1)2/(h2 – h1)4][(h2 – h1)2
+ (h2 – hp)2 + (hp – h1)2]} d2(h). (21)
Terms containingd(V1) andd(V2) have been combinedsince these uncertainties have the same magnitude,which is designatedd(V) = ud(V1)u = ud(V2)u. Similarly,terms containingd(h1), d(hp), andd(h2) have also beencombined in Eq. (21) usingd(h) ≡ ud(h1)u = ud(hP)u =ud(h2)u.
The standard uncertainty in the height measurementsd(h) is estimated to be 0.0025 cm. The standard uncer-tainties in the voltage measurementsd(V) is taken fromthe manufacturer’s specifications to be 0.01 % ofV.Using the values given in Table 3 for the heights andreference voltages, the uncertainty inVp is estimatedfrom Eq. (22) to be between 0.001 V and 0.033 V overthe 10 kV to 300 kV range for input voltages. Therelative uncertainty inVp , dr(Vp) ≡ d(Vp)/Vp, is less than0.06 %. Typical heights areh1 = 7.369 cm,h2 = 7.569cm, andhp = 7.656 cm, and the reference voltagesV1 andV2 usually differ by less than 4 % of their mean.
6.1.2 Reference Divider Ratio Uncertainty Theuncertainty of the reference voltage divider ratiod(DR)is evaluated indirectly through a series of simultaneousmeasurements made with the divider and a Kerr cell.The difference in the peak voltage simultaneously mea-sured by the Kerr cell and reference divider is
DUKR ≡ UK – UR = n1/2 Um2 – DRVR, (22)
where Um2 is the temperature-corrected Kerr cellconstant andn is the fringe number described in Sec. 3.Solving Eq. (22) for the divider ratioDR one obtains
DR = [n1/2 Um2 – (UK – UR )]/VR . (23)
The standard uncertainty for the reference divider ratiois
d(DR) = {[ Um22 /(4nVR
2)] d2(n) + (n/VR2)d2(Um2)
+ d2(UK – UR)/VR2 + (UR
2/VR4)d2(VR)} 1/2, (24a)
and the relative standard uncertainty for this divider ratiois
dr(DR) = (UK/UR ) {[( dr2(n)/4) + dr
2(Um2)]
+ dr2(UK – UR) + dr
2(VR)} 1/2, (24b)
652

Volume 101, Number 5, September–October 1996Journal of Research of the National Institute of Standards and Technology
Table. 3. Typical values of divider measurement parameters
Parameter Value Equation number
Peak input voltage UP, UK, UR 10 kV to 300 kV 1, 15, 16a, 16b, 22, 23, 24a, 24b, 38
DR 5250 1, 2, 16a, 19a, 22, 23, 40Voltage divider ratio
DT 5100 to 5300 15, 17a, 17b
VR, VR, VT 1.9 V to 58.8 V 1, 2, 15, 16, 17a, 17b, 19a, 20, 22, 23,Peak output voltage
24a, 39, 42
h1 7.369 cm 20, 21Height measurements
(from photographs) hP 7.569 cm 20, 21h2 7.656 cm 20, 21
Reference dc voltage V1, V2 1.86 V to 61.8 V 20, 21measurements
with dr2(UK – UR) ≡ d2(UK – UR)/UR
2, dr2(n) ≡ d2(n)/n2,
and dr2(Um2) ≡ dr
2(Um2)/U2m2. Note that the relative stan-
dard uncertaintydr(UK – UR) in the difference of the twopeak voltage measurements is not defined as the uncer-tainty of the difference divided by the difference, butrather as the uncertainty of the difference divided by thepeak input voltageUR determined by the divider.
Equation (24b) shows that the relative standard uncer-tainty of the reference divider ratio can be estimatedfrom estimates of the relative uncertainties of the Kerrmeasurement parametersdr(n) and dr(Um2), the differ-ence of the peak voltagesdr(UK – UR) , and the referencedivider output voltagedr(VR). The uncertainty in theoutput voltage was estimated in the previous section andthe Kerr measurement parameter uncertainties are esti-mated in the following section. The uncertainty of thedifference of peak input voltages is estimated from mea-surement data. The expanded uncertainty for the testdivider is estimated in Sec. 6.1.4.
6.1.3 Kerr Cell Measurement Uncertain-ties The determination of the test divider ratio is per-formed with the Kerr cell at temperatureT2 which ingeneral is different from the temperatureT1 at which thecalibration was performed, but can be calculated using[19]:
Um2 = Um1(B1/B2)1/2 , (25)
whereB1 andB2 are the Kerr electro-optic coefficientsat temperaturesT1 andT2 , respectively, as discussed inSec. 3.1. The temperature dependence of the Kerr coef-ficient of nitrobenzene was measured by Hebner andMisakian, who fit the resultant data to a curve described
by [19]
B(T) = a0 + a1 T–1 + a2 T–2. (26)
From Eq. (26) the standard uncertainty ofUm2 is
d2(Um2) = ((B2/B1) ? U2m1/4) d2(B1/B2) , (27a)
which can be rewritten in relative terms as
dr2(Um2) = dr
2(B1/B2)/4 , (27b)
usingdr2(Um2) ≡ d2(Um2)/Um2
2 anddr2(B1/B2) ≡ d2(B1/B2)/
(B1/B2)2. Because in the series of measurements used forthe statistical evaluation ofdr(UK – UR), the calculationof UK is made with either one of the two constantsUm1
given in Table 4, there is no component of uncertainty inUm1 due to random effects in this evaluation, i.e.,Um1 isconstant and has no statistical variations in these tests.The uncertainties inUm1 due to systematic effects aretaken into account in the estimation of the combinedmeasurement uncertainty ofUK, but these are believedto be small, as discussed in the next section.
The expression for fringe numbern in terms of theintensity In corresponding ton and the maximum andbaseline intensitiesIm and I0 is
N +2p
sin–1 ÎDIm
DIm, N even,
n =
N +1 –2p
sin–1 ÎDIn
DIm, N odd,
(28)
5653

Volume 101, Number 5, September–October 1996Journal of Research of the National Institute of Standards and Technology
Table 4. Typical values of Kerr cell measurement parameters
Parameter Value Equation number
N 2 to 80 10, 11, 28n 2.40 to 80.25 10, 11, 16b, 17b, 22, 23, 24a, 28, 39, 42Um1 6386 V, 46770 V 8, 25, 27a, 40Um2 6449 V, 46390 V 8, 16b, 17b, 22, 23, 24a, 25, 42, 43B1 3.273 10–12 m/V2, 8, 25, 27a, 34, 39
Kerr cell B2 3.223 10–12 m/V2, 8, 25, 27a, 34, 39mesurement a0 6.1283 10–12 m/V2 26, 34, 35, 36, 37parameters a1 –5.2873 10–9 K2 26, 34, 35, 36, 37
a2 1.3103 10–6 K2 m/V2 26, 34, 35, 36, 37T1 294.9 K to 297.4 K 34, 35, 36, 37T2 296.1 K to 296.5 K 34, 35, 36, 37
DIn/DIm 0.03 to 1.00 28, 29, 30
Height h0 0.216 cm 30, 31, 32, 33measurements hn 2.289 cm to 6.472 cm 30, 31, 32, 33
(from photographs) hm 6.48 cm 30, 31, 32, 33
whereDIn = In – I0 andDIm = Im – I0. The uncertainty inn is found from Eq. (28) to be
d2(n) = {(1/p2) [1/(DIn/DIm) – (DIn/DIm)2]} d2(DInDIm).
(29)
The intensitiesIn, Im, andI0 are determined from a pho-tograph of the output of the photodetector displayed onthe storage oscilloscope. They are measured in terms ofthe heights on the photograph just as the output voltagesVR are measured. The ratio is found as
DIn ≡ In – I0 = k(hn – h0),
DIm ≡ Im – I0 = k(hm – h0),
and
DIn/DIm = (In – I0)/( Im – I0) = (hn – h0)/(hm – h0),
(30)
wherehn, h0, and hm are the measured heights of theintensity traces corresponding to fringe numbern, thebaseline intensity level, and the maximum intensitylevel, respectively. The constantk includes the electro-optic efficiency of the photodetector, the trans-impedance of the amplifier circuit, and the oscilloscopescale factors, but because a ratio is used in Eq. (30), thefactor k cancels since it is reasonable to assume that it
is the same forIn, Im, andI0. Thus the uncertainty in theratio DIn/DIm depends only on the uncertainty in theheight measurements
d2(DIn/DIm) = (hm – h0)–2 d2(hn)
+ [(hn – hm)/(hm – h0)2]2d2(h0)
+ [– (hn – h0)/(hm – h0)2]2 d2(hm). (31)
As for the PLL technique, the standard uncertainties forall of the height measurements have the same magni-tude, designatedd(h), so that the terms in Eq. (31) canbe combined to give
d2(DIn/DIm) = {[( hm – h0)2 + (hn – hm)2
+ (h0 – hn)2]/(hm – h0)4} d2(h), (32)
Substituting Eq. (32) into Eq. (29) yields
d2(n) = {[( hm – h0)2 + (hn – hm)2
+ (h0 – hn)2]/ [p2 3 (1 – [(hn – h0)/(hm – h0)])
3 [(hn – h0)/(hm – h0)] 3 (hm – h0)4)]} d2(h). (33)
654

Volume 101, Number 5, September–October 1996Journal of Research of the National Institute of Standards and Technology
The above equation does not contain an uncertaintyterm for the integer fringe numberN shown in Eq. (28)becaused(N) is zero; an error in counting the integernumber of fringes in a Kerr trace would be immediatelydetected in the large differenceUK – UR that would re-sult. The uncertainty inn then depends upon the heightsof the intensity traces measured from the oscilloscopephotograph which determine the fractional componentof n and on the uncertainty of the height measurementsd(h), but not upon the integer componentN. For thetypical height values given in Table 3 and for the stan-dard uncertaintyd(h) of 0.025 cm as used previously inthe PLL output voltage calculation in Sec. 2.2, the stan-dard uncertainty inn ranges from 0.05 to 0.25, whichcorresponds to a relative standard uncertainty inn,dr(n), of less than 0.02 % over the voltage range used.
The standard uncertainty in the Kerr cell constant atthe divider calibration temperatureT2 in Eq. (27b)depends on the relative standard uncertainty in the ratioof the Kerr coefficientsdr(B1/B2). To determine the rela-tive standard uncertaintydr(Um2), Eq. (26) is used toobtain the ratio:
B1/B2 = (a0 + a1T1–1 + a2 T1
–2)/(a0 + a1T2–1 + a2T2
–2).
(34)
The standard uncertainty is then
d2(B1/B2) = [(a1T1–2 + 2a2T1
–3)/B2]2 d2(T1)
+ [(B1/B22)(a1T2
–2 + 2a2T2–3)]2 d2(T2). (35)
The same values ofa0, a1, anda2 are used for measure-ments at all Kerr cell temperatures and therefore there isno random component of uncertainty. The systematiccomponent of uncertainty is believed to be negligiblebecause of the excellent agreement between the simulta-neous Kerr cell and reference voltage divider measure-ments made for cell temperatures between 293.6 K to297.3 K. Any error in the values ofa0, a1, anda2 usedwould result in either a monotonic increase or decreasein the difference between the peak voltage determinedwith the two measurement systems as the Kerr cell tem-perature changed, but only random changes in this dif-ference were seen; no systematic trends in the data wereobserved. The uncertainties of the temperature coeffi-cients are therefore negligible.
The magnitudes of the standard uncertainty of themeasured temperaturesT1 andT2 are the same and des-ignatedd(T), so Eq. (35) reduces to
d2(B1/B2) = {[( a1T1–2 + 2a2T1
–3)/B2]2
+ [(B1/B22)(a1T2
–2 + 2a2T2–3)]2} d2(T) (36)
or in relative form
dr2(B1/B2) = {[( a1T1
–2 + 2a2T1–3)/B1]2
+ [(a1T2–2 + 2a2T2
–3)/B2]2} d2(T), (37)
with dr(B1/B2) ≡ d(B1/B2)/(B1/B2).
6.1.4 Test Divider Ratio Uncertainty The rela-tive standard uncertainty for the reference divider foundby substituting Eq. (27b) into Eq. (24b) is
dr(DR) = (UK/UR) {[ dr2(n) + dr
2(B1/B2)]/4
+ dr2(UK – UR) + dr
2(VR)} 1/2 . (38)
An estimate for the relative standard uncertainty of thedifference of the peak voltages measured by the Kerrcell and reference divider,dr(UK – UR)/UR, of 0.15 %has been obtained from the sample standard deviation ofa series of measurements covering the voltage rangefrom 10 kV to 300 kV. Using this estimate and thevalues for the other parameters and their uncertaintieslisted in Tables 3 through 6,dr(DR) is calculated to be atmost 0.17 %.
The estimate fordr(DR) is made using componentsof uncertainty due to random effects and does notinclude components due to systematic effects, whichare believed to be negligible. This conclusion is based onthe evaluation of the difference of the peak voltages(UK – UR)/UR, which for this series of measurements hasa mean of less than 0.1 %. The difference in peakvoltage measurements given in Eq. (22) can be recastusing Eq. (25) as
DUKR ≡ [n(B1/B2)]1/2 DUm1 – DDRVR, (39)
whereDUm1 and DDR are the systematic errors of thecell constant and reference divider ratio, respectively,andUR = DRVR = [n(B1/B2)]1/2 Um1. Usingn1/2 = Up/Um2
= Up/[Um1(B1/B2)1/2], Eq. (39) becomes
DUKR,r = DUm1/Um1 – DDR/DR, (40)
with DUKR,r ≡ DUKR/UP. It is possible that the relativeerrors in the cell constant and divider ratio are both largeand that only their difference in Eq. (40) is small, butthis is unlikely; it would mean that there would be asignificant difference between the low voltage dividerratio calculated from the component resistances, or thelow voltage dc ratio, and the ratio at the high voltages
655

Volume 101, Number 5, September–October 1996Journal of Research of the National Institute of Standards and Technology
used in this comparison. Such a difference may arisefrom heating and voltage effects, but it is unlikely thatthese effects would result in a constant divider ratio overthe high voltage range covered here. A constant differ-ence in Eq. (40) for a divider ratio that changes withvoltage would mean that the cell constant would have tochange equally, but this would indicate either a changein the physical dimensions of the cell or a change in theKerr liquid temperature. No temperature changes havebeen measured during the comparison testing thatwould indicate such a phenomenon is actually occur-ring. Additionally, a large change in the divider ratiofrom low voltage to high voltage would be seen in theKerr waveform fit to the measured output voltage,
shown in Fig. 6, for which the constant low-voltagedivider ratio was used. If the divider ratio were voltagedependent, the fit at the start of the trace (the lowervoltage values) would be good, but the fit near the peak(the highest voltage values) would be poor, which is notthe case as is clearly seen from the figure. Although thefitted waveform does not match the measured waveformat the points corresponding to the peak voltage in Fig. 6,the relative difference in the fringe numbers calculatedfrom the two waveforms is less than 0.02 %. Simulta-neous measurements with other pulse voltage dividersshow similar excellent agreement. It is therefore con-cluded that the relative errors in both the divider ratioand the cell constant are insignificant.
Table 5. Standard uncertainties of comparison parameters
Standard uncertainty Values Type of uncertainty Equation number
d(h) 2.53 10–5 m A 21, 31, 32, 33
d(V) 0.0002 V to 0.0059 V B 21
d(VP), d(VR), d(VT) 0.001 V to 0.035 V B 19a, 24a, 42
d(DR) 8.9 B 2, 19a, 24a
d(DT) 9.7 to 10.1 B 19a, 42
d(n) 0.003 to 0.05 B 24a, 29, 33, 42
d(Um2) 5.77 V to 41.40 V B 24a, 27a, 42
d(UK – UR) 17 V to 510 V B 24a
d(B1/B2) 0.00179 to 0.00185 B 27a, 35, 36
d(DIn/DIm) 0.0007 to 0.0008 B 29, 31, 32
d(T) 0.05 K B 36, 37
Table 6. Relative standard uncertainties of comparison parameters
Relative standard uncertainty Maximum value Type of uncertainty Equation number(%)
dr(V) 0.01 B 22
d(VP), d(VR), d(VT) 0.06 B 19b, 24b, 38, 41, 43
dr(DR) 0.17 B 19b, 24b, 38, 41
dr(DT) 0.19 B 19b, 41, 43
dr(n) 0.02 B 13, 24b, 38, 43
dr(Um2) 0.05 B 24b, 27b, 43
dr(UK – UR) 0.15 A 24b, 38
dr(B1/B2) 0.09 B 27b, 37, 38
656
Volume 101, Number 5, September–October 1996Journal of Research of the National Institute of Standards and Technology
The estimate of the combined standard uncertaintyfor the unknown divider ratio from Eq. (19b) is found tobe
dr(DT) = [dr2(DR) + 2 d r
2(Vp)]1/2, (41)
where the magnitude ofdr(VT) anddr(VR) are the sameand designateddr(Vp). With the parameter and uncer-tainty values from Tables 3 through 6,dr(DT) is calcu-lated to be 0.19 %. Using a coverage factor ofk = 2 theexpanded relative uncertainty in the test divider ratio is0.38 %.
6.2 Uncertainties for Divider—Kerr Cell Com-parison
Applying the law of propagation of uncertainties toEq. (17b), the uncertainty in the test divider ratio foundthrough comparison with a Kerr cell is
d2(DT) = [Um2/(4n ? VT)] d2(n) + (n/VT) d2(Um2)
+ (n ? Um22 /VT
4)d2(VT), (42)
or in relative form
d r2(DT ) = d r
2(n)/4 + d r2(Um2) + d r
2(VT). (43)
The uncertainty in the temperature-corrected cell con-stant Um2 calculated in the previous sections onlyaccounts for components arising from random effects.Systematic effects are also considered to be negligiblefor the reasons given in the previous sections. Using thevalues fordr(n) and dr(Um2) in Table 6 based on thederivations given in the previous sections and theparameter values in Table 3, the relative standard uncer-tainty dr(DT) in the test divider ratio is 0.11 %. Thisgives a total relative expanded uncertainty of less than0.22 % using a coverage factor ofk = 2.
Acknowledgments
The authors thank Robert Hebner, Jr., Deputy Direc-tor of NIST’s Electronics and Electrical EngineeringLaboratory, for his significant insights and develop-ments in high-voltage pulse measurement technologyusing Kerr cells and impulse-voltage dividers uponwhich much of this work is based. Much appreciation isalso due to Charles Fenimore, of the NIST ElectricityDivision, for his constructively critical suggestions, and
we also thank Yi Xin Zhang, formerly a NIST guestresearcher and presently with Hipotronics, Inc., inBrewster, NY, for his many helpful comments and sug-gestions on improving divider measurements.
7. References
[1] IEEE Standard 4-1995, IEEE Standard Techniques for HighVoltage Testing (1995).
[2] American National Standards Institute, IEEE Standard Require-ments for Instrument Transformers, ANSI/IEEE c57.13-1993(1993).
[3] S. Eckhouse, M. Markovits, and M. Coleman, Pulse qualityoptimization on a linear induction accelerator test stand, Digestof the 7th IEEE Pulse Power Conference, June 11–14, 1989,Monterey, CA, IEEE[89CH2678-2, 190–192 (1989)
[4] J. D. Simmons, NIST Calibration Services Users Guide 1989,NIST Special Publication 250 (1989).
[5] IEC International Standard 60-2:1994, High Voltage TestTechniques, Part 2: Measuring Systems (1994).
[6] G. L. Clark, Dielectric properties of nitrobenzene in the regionof anomalous dispersion, J. Chem. Phys.25, 215–219 (1956).
[7] ISO, Guide to the Expression of Uncertainty in Measurement,International Organization for Standardization, Geneva,Switzerland (1993).
[8] B. N. Taylor and C. E. Kuyatt, Guidelines for Evaluating andExpressing the Uncertainty of NIST Measurement Results,NIST Technical Note 1297, 1994 Edition (1994).
[9] Y. X. Zhang R. H. McKnight and R. E. Hebner, Jr., Interactionsbetween two dividers used in simultaneous comparison mea-surements, IEEE Trans. Pow. Del.4 (3), 1586–1594 (1989).
[10] W. E. Anderson, ed., Research for Electric Energy Systems—An Annual Report, NIST Interagency Report, NISTIR 4691,June 1991, pp. 73–88.
[11] Research for Electric Energy Systems—An Annual Report,NIST Interagency Report, NISTIR 4339, R. J. Van Brunt, ed.,June 1990, pp. 71–75.
[12] H. K. Shoenwetter, D. R. Flach, T. M. Souders, and B. A. Bell,A Precision Programmable Step Generator for Use inAutomated Test Systems, NBS Technical Note 1230, December1986.
[13] E. F. Kelley and R. E. Hebner, Jr., Measurement of prebreak-down electric fields in liquid insulants, 1978 Annual Report,Conference on Electrical Insulation and Dielectric Phenomena,October 30–November 2, 1978, Pocono Manor, PA (1978) pp.206–212.
[14] R. E. Hebner, Jr., E. C. Cassidy, and J. E Jones, Improvedtechniques for the measurement of high-voltage impulses usingthe electro-optic Kerr effect, IEEE Trans. Instrum. Meas.IM-24 (4), 361–366 (1975).
[15] M. Zahn, and T. Takada, High voltage electric field and space-charge distributions in highly purified water, J. Appl. Phys.54(9), 4762–4775 (1983).
[16] J. D. Cross and R. Tobazeon, Electric field distortions producedby solid dielectric spacers separating uniform field electrodesin nitrobenzene, Annual Report, Conference on ElectricalInsulation and Dielectric Phenomena, Buck Hill Falls, PA,October 1972.
[17] D. C. Wunsch and A. Erteza, Kerr cell measuring system forhigh voltage pulses, Rev. Sci. Instrum.35, 816–820 (1964).
[18] R. E. Hebner, Jr., R. A. Malewski, R.A., and E. C. Cassidy,Optical methods of electrical measurement at high voltagelevels, Proc. IEEE65 (11), 1524–1548 (1977).
657

Volume 101, Number 5, September–October 1996Journal of Research of the National Institute of Standards and Technology
[19] R. E. Hebner, Jr., and M. Misakian, Temperature dependence ofthe electro-optic Kerr coefficient of nitrobenzene, J. Appl.Phys.50 (9), 6016–6017, (1979).
[20] P. D. Thacher, Optical effects of fringing fields in Kerr cells,IEEE Trans. Elec. Insul.EI-11(2), 40–50 (1976).
[21] R. E. Hebner, Jr., and M. Misakian, Calibration of High-Voltage Pulse Measurement Systems Based on the Kerr Effect,NBS Interagency Report, NBSIR 77-1317, September 1977.
[22] T. R. McComb, et. al., International comparison of hv impulsemeasuring systems, IEEE Trans. Pow. Del.4(2), 906–915(1989).
[23] S. L. Kupferman, S. R. Booker, and H. Meissner, A computer-controlled 300-kV pulse generator, IEEE Trans. Instrum. Meas.39(1), 134–139 (1990).
[24] G. J. FitzPatrick and J. E. Lagnese, Determination of Kerr cellparameters with comparative digitized measurements, Proceed-ings of the International Symposium on Digital Techniques inHigh-Voltage Measurements, 33–37, Toronto, Canada, October1991.
About the authors: Gerald J. FitzPatrick is an elec-tronics engineer and Edward F. Kelley is a physicistin the Electricity Division of the NIST Electrical andElectronics Engineering Laboratory. The National Insti-tute of Standards and Technology is an agency of theTechnology Administration, U.S. Department ofCommerce.
658