effects of the embryonic thermal environment on haddock (melanogrammus aeglefinus) developmental...
TRANSCRIPT
RESEARCH ARTICLE
D. J. Martell Æ J. D. Kieffer Æ E. A. Trippel
Effects of the embryonic thermal environment on haddock(Melanogrammus aeglefinus) developmental trajectoriesthrough exogenous feeding stages
Received: 1 September 2004 / Accepted: 17 October 2005 / Published online: 7 December 2005� Springer-Verlag 2005
Abstract Detailed development of haddock (Melano-grammus aeglefinus) embryos and larvae was studied inseveral embryonic thermal rearing environments. Usingdefined reference points (landmarks), development ofvarious tissues including muscle was mapped through-out early ontogeny. The onset of most landmarks wasunaffected by temperature as a proportion of time tothe initiation of exogenous feeding (standardizeddevelopmental time). However, blastopore closure,notochord vacuolation, retinal pigmentation, theappearance of blood cells, and hatching occurred laterin development at lower temperatures. Appearance ofthe optic lumen, neural tube cavitation, and increasedmyofibril density per deep cell occurred earlier at lowertemperatures. Changes in relative order and temporalsequence of developmental events were observedamong temperature groups. Notochord (from 30 to 7%of developmental time) and eye development (from 45to 33% developmental time) was accelerated with in-creased embryonic temperature, while myofibrillargen-esis (from 60 to 88% developmental time) and neuraltube development was similarly slowed (71–85%developmental time). The rate of gut developmentcontinued to be greater in larvae from higher incuba-tion temperature groups beyond hatch in spite of theabsence of temperature variation. Incubation tempera-ture was found to have had a differential but significanteffect on the development of various tissues and
structures that affected the form and, possibly, functionof exogenous feeding haddock.
Introduction
Whether the product of climate change (Jobling 1997;Kennedy and Walsh 1997; Rombough 1997) or of cul-ture conditions designed to maximize growth and sur-vival (Trippel 1998; Aiken 2003; Rideout et al. 2004),temperature is a key environmental factor that influ-ences all aspects of fish biology (Kamler 1992). Tocompensate for any potential effects of changes inenvironmental temperature, fish are able to modify bodysystems metabolically, physiologically, and morpholog-ically (Hazel and Prosser 1974; Jobling 1994; Hochachkaand Somero 2002). These adjustments often involvebiochemical and structural modifications (Blaxter 1992;Kamler 1992; Johnston 1993; Johnston et al. 2001),depending upon the period and magnitude of the envi-ronmental change and the ontogenetic stage of exposure.
Temperature variation during early development hasbeen shown to affect cellular differentiation and growth(Johnston et al. 1996; Hall and Olsen 2003), resulting inchanges in growth, morphology, and function acrosstemperature gradients (Fuiman et al. 1998; Balon 1999;Koumoundouros et al. 1999; Kovac 2002; Ojangurenand Brana 2003). Although general developmental rateshave been found to be proportional to temperature(Kamler 1992; Hall and Johnston 2003; Martell et al.2005), development of individual tissues may be differ-entially affected (Johnston 1993; Hunt von Herbing et al.1996; Johnston et al. 1997; Hall and Johnston 2003). Forexample, Johnston (1993) found in herring (Clupeaharengus L.) that spinal cord, pronephros, pectoral finbud, and myotomal muscle development was delayed atlow incubation temperatures and Johnston et al. (2001)showed that there was a delay in myofibril synthesis andacetylcholinesterase activity with respect to develop-mental stage at lower temperatures. Hall and Johnston
Communicated by R.J. Thompson, St. John’s
D. J. Martell Æ E. A. TrippelFisheries and Oceans Canada, St. Andrews Biological Station,531 Brandy Cove Rd., St., E5B 2L9 Andrews, NB, Canada
D. J. Martell (&) Æ J. D. KiefferDepartment of Biology, University of New Brunswick,P.O. Box 5050, E2L 4L5 Saint John, NB, CanadaE-mail: [email protected].: +1-506-5295889Fax: +1-506-5295862
Marine Biology (2006) 149: 177–187DOI 10.1007/s00227-005-0190-3

(2003) recently observed that blastopore closure oc-curred at greater somite numbers at higher temperaturesin cod (Gadus morhua). Other studies (Johnston 1993;Gibson and Johnston 1995; Hunt von Herbing et al.1996; Johnston et al. 1997) have also shown that dif-ferent embryonic rearing temperatures can producephenotypic variation in larval fish that included persis-tent changes in deep white muscle cellularity (Gallowayet al. 1998; Hall and Johnston 2003) and growth(Johnston et al. 1997; Galloway et al. 1999). Martellet al. (2005) found that different incubation tempera-tures produced haddock larvae and juveniles that hadsignificant and persistent changes in larval growth ratesfollowing variation in incubation temperatures. Addi-tionally, Martell et al. (2005) found that general devel-opmental rates during organogenesis, based on generalmorphological stages, varied among temperature groupsperhaps indicative of an underlying developmentalplasticity for various tissues. This variation in the time toand sequence of ontogenetic events may result in chan-ges in function and/or exploitive capability at crucial lifehistory stages (Johnston 1993; Fuiman et al. 1998; Spicerand Burggren 2003).
However, questions remain. How persistent are theseobserved changes in subsequent ontogeny? What chan-ges may be observed in other functional or key systems?How does the integration of these various phenotypicchanges impact the post-hatch phenotype and affectsurvival and performance? Although answers may besought in existing literature, they must be collated orinferred from often disparate studies of many species thatalso cover a limited ontogenetic scope. A novel integra-tive approach was therefore designed to address theseissues. A single species investigation was initiated tostudy a hierarchy of temperature-mediated phenotypicchanges, from the whole organism level through meta-bolic biochemistry, initiated in the embryonic thermalenvironment and followed through subsequent ontoge-netic phases in the absence of such thermal variation.
To accomplish these goals, development of specifictissues in fish exposed to different embryonic rearingtemperatures will be referenced and observed throughontogeny using a series of standardized developmentallandmarks. It was hypothesized that developmentalprogression for individual haddock tissues would bevariously and significantly affected by different incuba-tion temperatures resulting in developmental and phe-notypic plasticity. This study would contribute newknowledge to the understanding of the nature, scope,and consequences of developmental and phenotypicplasticity (Hall and Johnston 2003).
The species chosen for this investigation was haddock(Melanogrammus aeglefinus L.), a gadid found in theNorth Atlantic. This species can experience broad lati-tudinal and annual variations in temperature over itsdistribution (2–8�C; Scott and Scott 1988) and among itsvaried habitats (1–13�C; Scott and Scott 1988). It is ofinterest, therefore, to study how phenotype is modifiedthrough ontogeny over the range of temperatures that
this species would naturally encounter, especially duringits early life history. Haddock has also been considered acandidate species for aquaculture. As a standard com-mercial rearing protocol has been established to producejuvenile fish (Aiken 2003), it is also valuable to thisenterprise to discover how thermal changes to thatprotocol may affect the quantity and quality (e.g., flesh)of fish produced (Johnston 1999).
Materials and methods
Fertilized eggs from a single batch were collected fol-lowing the procedures as detailed in Martell et al. (2005)from wild Bay of Fundy broodstock held at the St.Andrews Biological Station. Microscopic examinationshowed that the zygotes from the batch were c. 95%four-cell and c. 5% eight-cell stages. Embryos and larvaewere produced from both embryonic rearing and larvalgrow-out systems that employed static and flow-throughculture techniques, respectively (detailed in Martell et al.2005). Samples were collected according to the protocolsdescribed in Martell et al. (2005). For the present study,samples of 15 larvae were taken every 2 days from oneof five replicates in each of the five temperature groups(2, 4, 6, 8, 10±0.1�C) in the embryonic rearing system.Sampling continued until 26 days post-fertilization (dpf)for all temperature groups except 10�C, which wassampled for only 13 dpf. Sampling was completed oncerearing chambers were depleted due to cumulative ef-fects of mortality and sampling attrition. In the larvalgrow-out system, beginning at 1 day post-hatch (dph),samples of 10–15 free embryos or larvae were collectedfrom each of the 4 replicate tanks per temperature (4, 6,8±0.5�C). Sampling continued daily until 14 dph andthereafter once every 7 days. Collections were completedwhen cumulative sampling attrition and mortality de-pleted larvae from all grow-out tanks.
Sampled free embryos and larvae were anaesthetized0.1 mg l�1 tricaine methanesulfonate (Sigma-AldrichCanada Ltd, Oakville, ON, Canada) for 1 min prior tomicroscopic examination. All sampled individuals wereimaged digitally using a dissecting microscope and thenfixed in seawater-buffered 4% formaldehyde. Imageswere subsequently evaluated as to percent epiboly,growth around the yolk and development of the eye,gastrointestinal system, neural tube, digestive and cir-culatory system, and trunk musculature.
For the histological evaluation of developmentalpatterns, random samples of five fixed specimens werechosen. Specimens were taken consistently from onereplicate in each of the five embryonic rearing systemtemperature groups at 2, 4, 6, 8, 10, 12, 16, 20, 24 dpf, oruntil 50% hatch. An additional five specimens were se-lected randomly from one of the four larval grow-outsystem replicate samples in each of the three larval grow-out temperature groups at 2, 7, 14, 21, and 28 dph.Specimens were embedded in glycomethacrylateresin—either JB4+ (Polysciences Inc, Warrington, PA,
178
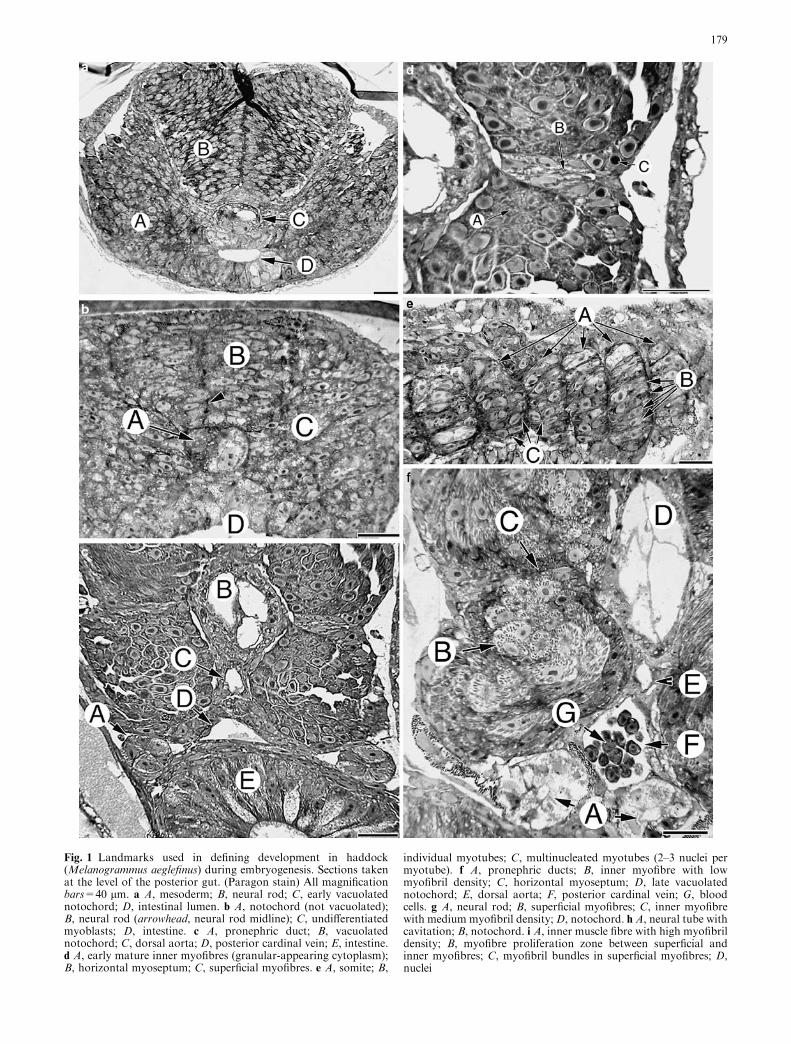
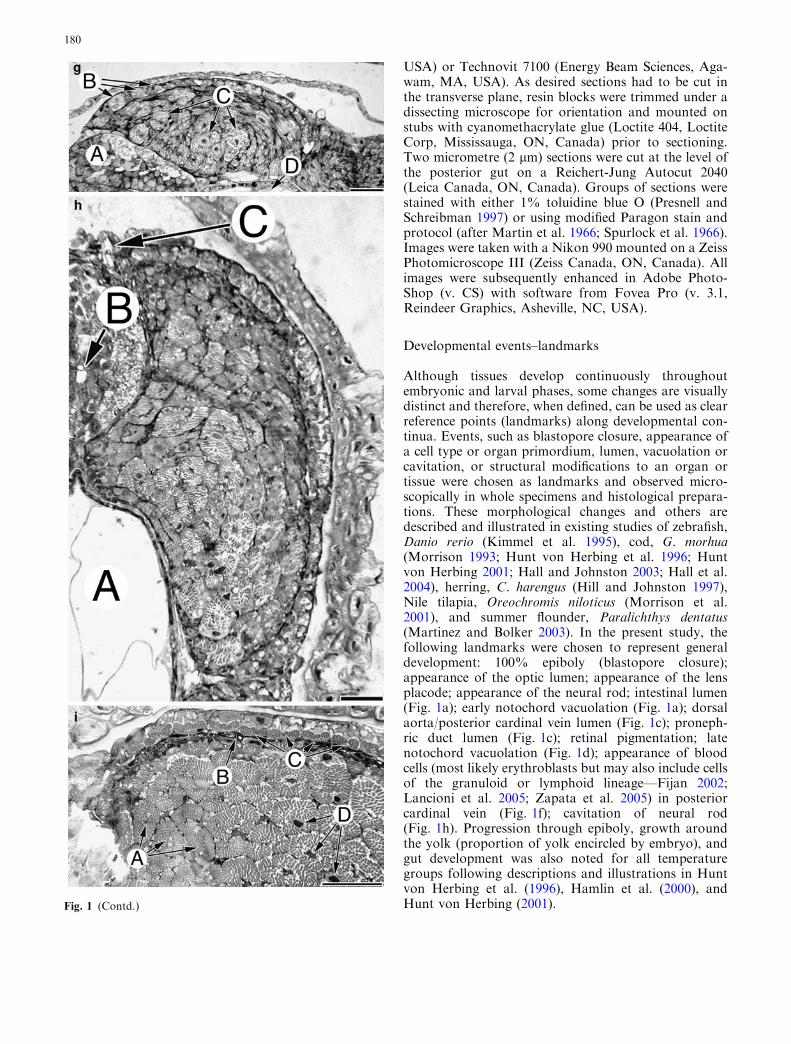
Fig. 1 Landmarks used in defining development in haddock(Melanogrammus aeglefinus) during embryogenesis. Sections takenat the level of the posterior gut. (Paragon stain) All magnificationbars=40 lm. a A, mesoderm; B, neural rod; C, early vacuolatednotochord; D, intestinal lumen. b A, notochord (not vacuolated);B, neural rod (arrowhead, neural rod midline); C, undifferentiatedmyoblasts; D, intestine. c A, pronephric duct; B, vacuolatednotochord; C, dorsal aorta; D, posterior cardinal vein; E, intestine.d A, early mature inner myofibres (granular-appearing cytoplasm);B, horizontal myoseptum; C, superficial myofibres. e A, somite; B,
individual myotubes; C, multinucleated myotubes (2–3 nuclei permyotube). f A, pronephric ducts; B, inner myofibre with lowmyofibril density; C, horizontal myoseptum; D, late vacuolatednotochord; E, dorsal aorta; F, posterior cardinal vein; G, bloodcells. g A, neural rod; B, superficial myofibres; C, inner myofibrewith medium myofibril density;D, notochord. h A, neural tube withcavitation; B, notochord. i A, inner muscle fibre with high myofibrildensity; B, myofibre proliferation zone between superficial andinner myofibres; C, myofibril bundles in superficial myofibres; D,nuclei
179
USA) or Technovit 7100 (Energy Beam Sciences, Aga-wam, MA, USA). As desired sections had to be cut inthe transverse plane, resin blocks were trimmed under adissecting microscope for orientation and mounted onstubs with cyanomethacrylate glue (Loctite 404, LoctiteCorp, Mississauga, ON, Canada) prior to sectioning.Two micrometre (2 lm) sections were cut at the level ofthe posterior gut on a Reichert-Jung Autocut 2040(Leica Canada, ON, Canada). Groups of sections werestained with either 1% toluidine blue O (Presnell andSchreibman 1997) or using modified Paragon stain andprotocol (after Martin et al. 1966; Spurlock et al. 1966).Images were taken with a Nikon 990 mounted on a ZeissPhotomicroscope III (Zeiss Canada, ON, Canada). Allimages were subsequently enhanced in Adobe Photo-Shop (v. CS) with software from Fovea Pro (v. 3.1,Reindeer Graphics, Asheville, NC, USA).
Developmental events–landmarks
Although tissues develop continuously throughoutembryonic and larval phases, some changes are visuallydistinct and therefore, when defined, can be used as clearreference points (landmarks) along developmental con-tinua. Events, such as blastopore closure, appearance ofa cell type or organ primordium, lumen, vacuolation orcavitation, or structural modifications to an organ ortissue were chosen as landmarks and observed micro-scopically in whole specimens and histological prepara-tions. These morphological changes and others aredescribed and illustrated in existing studies of zebrafish,Danio rerio (Kimmel et al. 1995), cod, G. morhua(Morrison 1993; Hunt von Herbing et al. 1996; Huntvon Herbing 2001; Hall and Johnston 2003; Hall et al.2004), herring, C. harengus (Hill and Johnston 1997),Nile tilapia, Oreochromis niloticus (Morrison et al.2001), and summer flounder, Paralichthys dentatus(Martinez and Bolker 2003). In the present study, thefollowing landmarks were chosen to represent generaldevelopment: 100% epiboly (blastopore closure);appearance of the optic lumen; appearance of the lensplacode; appearance of the neural rod; intestinal lumen(Fig. 1a); early notochord vacuolation (Fig. 1a); dorsalaorta/posterior cardinal vein lumen (Fig. 1c); proneph-ric duct lumen (Fig. 1c); retinal pigmentation; latenotochord vacuolation (Fig. 1d); appearance of bloodcells (most likely erythroblasts but may also include cellsof the granuloid or lymphoid lineage—Fijan 2002;Lancioni et al. 2005; Zapata et al. 2005) in posteriorcardinal vein (Fig. 1f); cavitation of neural rod(Fig. 1h). Progression through epiboly, growth aroundthe yolk (proportion of yolk encircled by embryo), andgut development was also noted for all temperaturegroups following descriptions and illustrations in Huntvon Herbing et al. (1996), Hamlin et al. (2000), andHunt von Herbing (2001).Fig. 1 (Contd.)
180

Progressive development of muscle tissue was char-acterized across all temperature groups. This processused histological preparations and descriptions asprovided in Johnston (1993), Veggetti et al. (1999),Sanger and Stoiber (2001), and Hall and Johnston(2003). The following landmarks were chosen to ‘map’
the development of this tissue: appearance of irregularmyoblasts (Fig. 1a, b); early mature inner muscle fibre(Fig. 1d, e); epaxial/hypaxial muscle demarcation(horizontal myoseptum) (Fig. 1d); low myofibril den-sity (Fig. 1f); medium myofibril density (Fig. 1g); highmyofibril density (Fig. 1i). Further, note was made of
Fig. 2 Patterns of change in progressive developmental landmarks.Points denote modal developmental stage. a Blastula stage, percentepiboly, and embryonic growth around yolk in egg. Embryonicgrowth measured as proportion of yolk encircled by embryo.Plotted against days post-fertilization. b Blastula stage, percent
epiboly, and embryonic growth around yolk in egg. Plotted againstproportion of developmental time. c Gastrointestinal development(stages after Hamlin et al. 2000). Plotted against days post-hatch. dGastrointestinal development (stages after Hamlin et al. 2000).Plotted against proportional developmental time
181
when the dorsal epaxial proliferation zone ‘met’ andthen over-grew the ‘height’ of the spinal cord (de-scribed in Fig. 10 of Devoto et al. 1996), the time when
the horizontal myoseptum was first observed (Fig. 1d),and when a distinct superficial muscle cell layer becamevisible (Fig. 1d).
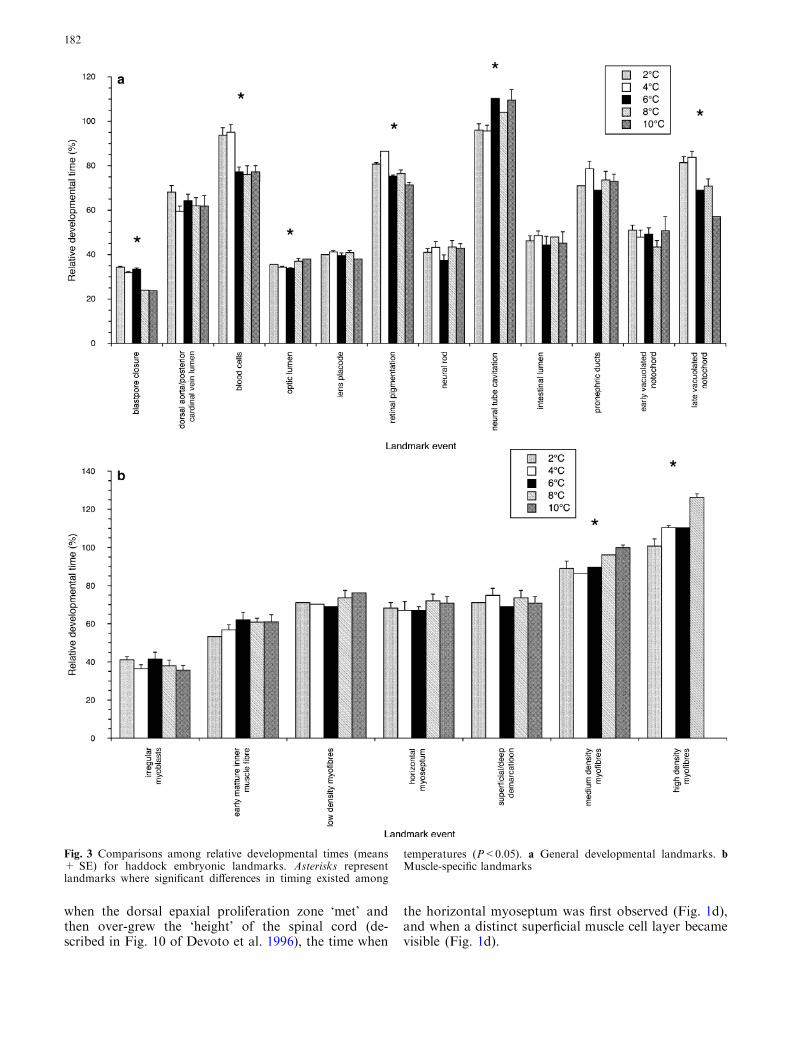
Fig. 3 Comparisons among relative developmental times (means+ SE) for haddock embryonic landmarks. Asterisks representlandmarks where significant differences in timing existed among
temperatures (P<0.05). a General developmental landmarks. bMuscle-specific landmarks
182

Data analysis
As suggested by Hall and Johnston (2003), times to theappearance of landmarks were transformed to stan-dardized proportions of the time to exogenous feeding,
termed developmental time (after Hall and Johnston2003). Times to initiation of exogenous feeding wereextracted from other study data which dealt with thesame experimental haddock used herein (Martell et al.2005). Mean standardized developmental times were
Fig. 4 Instantaneous phenotype as represented by landmarksequence among temperature treatments. Mean time to theappearance of landmarks scaled as a proportion of developmentaltime (time to initiation of exogenous feeding). Asterisk behindlandmark label indicates where timing differed significantly among
treatments (P<0.05) (� beside temperature group indicates wheretime to initiation of exogenous feeding was extrapolated from datain Martell et al. (2005) (graphic style after Hall and Johnston 2003).a General developmental landmarks. b Muscle-specific landmarks
183
calculated by dividing mean time to the appearance of alandmark by the extracted time to initiation of exoge-nous feeding. It was unnecessary to transform the dataprior to analysis by general linear model procedures (Zar1999; p. 276). Data were initially analysed using a two-way ANOVA (temperature · landmark) but due to asignificant effect interaction, data were subsequentlyanalysed by a series of one-way ANOVAs for eachlandmark over temperature (JMP software, v5.0.1.2,SAS Institute: Cary, NC, USA). Analysis of distributiontrends for those landmarks that varied significantlyamong temperature treatments was undertaken withPearson (product moment) correlations (r) (JMP soft-ware).
Results
Time to 50% hatch was inversely proportional to incu-bation temperature and was observed at 20.3 dpf at 2�C,16.3 dpf at 4�C, 13.0 dpf at 6�C, 10.6 dpf at 8�C, and9.1 dpf at 10�C. Time to the initiation of exogenousfeeding was also inversely proportional to incubationtemperature and occurred at 22.5 dpf at 2�C, 18.5 dpf at4�C, 14.5 dpf at 6�C, 12.5 dpf at 8�C, and 10.5 dpf at10�C. As 2 and 10�C groups were grown only in theembryonic rearing units and were never fed, values forthe time to initiation of exogenous feeding wereextrapolated from Fig. 2 in Martell et al. (2005).
When examined over time, progressive or continuousembryonic development through epiboly and growth inlength about the yolk following blastopore closure (i.e.,proportion of yolk encircled by embryo), revealed apattern of increased rate proportional to incubationtemperature (Fig. 2a). However, when examined overthe standardized developmental time, differences indevelopmental rates among all temperature groups werenot apparent (Fig. 2b). Progressive gut development wasalso examined following hatch. Free embryos from alltemperature groups hatched with a similar gut structure(Fig. 2c). In the common post-hatch 6�C environment,rates of change in gut development were proportional toembryonic rearing temperature. Thus the 8�C groupattained day 34 stage (Hamlin et al. 2000) at 22 dph,while the 6�C group took 29 dph. The 4�C group,however, was not observed to demonstrate this gutmorphology during the time frame of the experiment.Unlike epiboly and subsequent growth in earlyembryogenesis, post-hatch gut development (measuredby morphological development of the intestine) overdevelopmental time continued to show differences pro-portional to incubation temperature (Fig. 2d). A similarpattern was evident with the growth of the dorsal epaxialdeep muscle proliferation zone over the spinal cord. Thisoccurred at 42 and 32 dph in the 6 and 8�C groups,respectively, but was not observed by 34 dph in the 4�Cgroup.
Two-way ANOVA showed a significant interactionbetween temperature and landmark (F71=6.12,
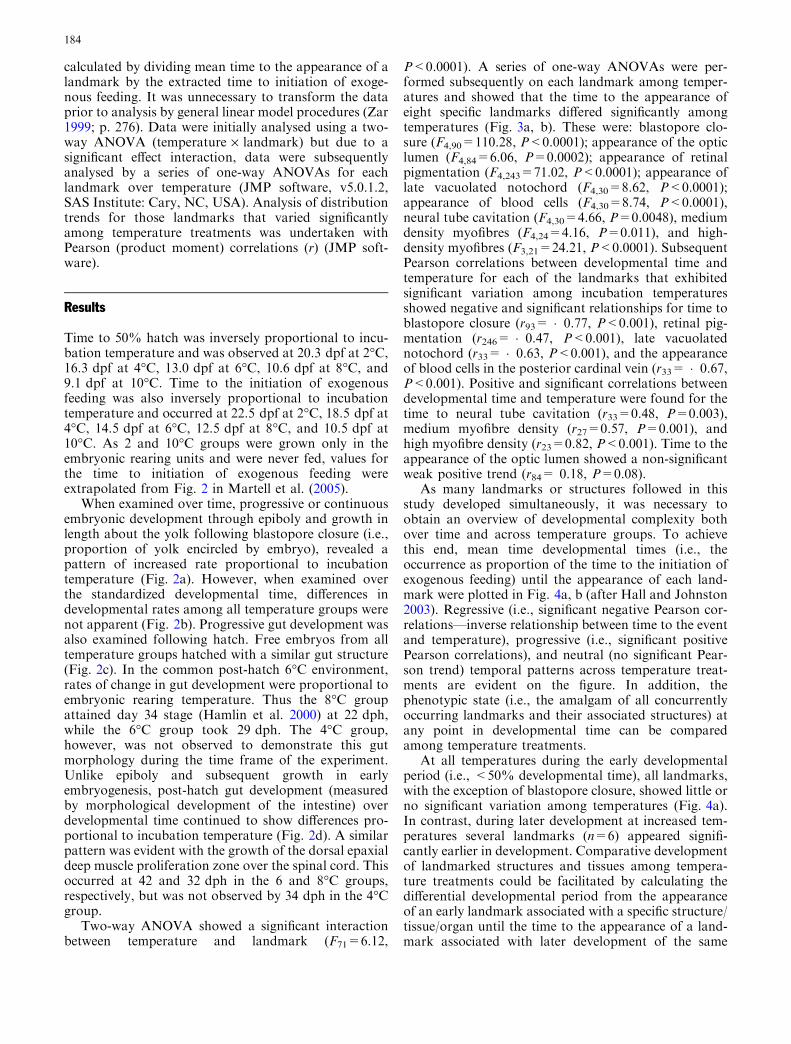
P<0.0001). A series of one-way ANOVAs were per-formed subsequently on each landmark among temper-atures and showed that the time to the appearance ofeight specific landmarks differed significantly amongtemperatures (Fig. 3a, b). These were: blastopore clo-sure (F4,90=110.28, P<0.0001); appearance of the opticlumen (F4,84=6.06, P=0.0002); appearance of retinalpigmentation (F4,243=71.02, P<0.0001); appearance oflate vacuolated notochord (F4,30=8.62, P<0.0001);appearance of blood cells (F4,30=8.74, P<0.0001),neural tube cavitation (F4,30=4.66, P=0.0048), mediumdensity myofibres (F4,24=4.16, P=0.011), and high-density myofibres (F3,21=24.21, P<0.0001). SubsequentPearson correlations between developmental time andtemperature for each of the landmarks that exhibitedsignificant variation among incubation temperaturesshowed negative and significant relationships for time toblastopore closure (r93= �0.77, P<0.001), retinal pig-mentation (r246= �0.47, P<0.001), late vacuolatednotochord (r33= �0.63, P<0.001), and the appearanceof blood cells in the posterior cardinal vein (r33= �0.67,P<0.001). Positive and significant correlations betweendevelopmental time and temperature were found for thetime to neural tube cavitation (r33=0.48, P=0.003),medium myofibre density (r27=0.57, P=0.001), andhigh myofibre density (r23=0.82, P<0.001). Time to theappearance of the optic lumen showed a non-significantweak positive trend (r84= 0.18, P=0.08).
As many landmarks or structures followed in thisstudy developed simultaneously, it was necessary toobtain an overview of developmental complexity bothover time and across temperature groups. To achievethis end, mean time developmental times (i.e., theoccurrence as proportion of the time to the initiation ofexogenous feeding) until the appearance of each land-mark were plotted in Fig. 4a, b (after Hall and Johnston2003). Regressive (i.e., significant negative Pearson cor-relations—inverse relationship between time to the eventand temperature), progressive (i.e., significant positivePearson correlations), and neutral (no significant Pear-son trend) temporal patterns across temperature treat-ments are evident on the figure. In addition, thephenotypic state (i.e., the amalgam of all concurrentlyoccurring landmarks and their associated structures) atany point in developmental time can be comparedamong temperature treatments.
At all temperatures during the early developmentalperiod (i.e., <50% developmental time), all landmarks,with the exception of blastopore closure, showed little orno significant variation among temperatures (Fig. 4a).In contrast, during later development at increased tem-peratures several landmarks (n=6) appeared signifi-cantly earlier in development. Comparative developmentof landmarked structures and tissues among tempera-ture treatments could be facilitated by calculating thedifferential developmental period from the appearanceof an early landmark associated with a specific structure/tissue/organ until the time to the appearance of a land-mark associated with later development of the same
184

structure. These comparisons were obviously valid onlyfor structures for which there were landmarks where thePearson trend was significant among temperaturegroups. For example, the period from the first appear-ance of the optic lumen early in development until reti-nal pigmentation (i.e., the period for the formation ofthe eye) was reduced from 45% of total developmentaltime at 2�C to 33% at 10�C. Although the notochorddevelopment differential period was similarly affectedwith increased incubation temperature (30% at 2�Ccompared to 7% at 10�C), the differential period forneural tube development was greater at increased tem-peratures (71% at 2�C compared to 85% at 10�C).
For muscle-specific landmarks, a similar translationof Fig. 4b illustrated a trend of a greater differentialperiod with increased temperatures for myofibril devel-opment in myofibres. The differential period from thefirst appearance of irregular myoblasts to the firstappearance of myofibres with medium- (last musclelandmark that was observed in all thermal regimes) andhigh-density myofibrils increased from 40% at 2�C to63% at 10�C and 60% at 2�C to 88% at 8�C, respec-tively.
Discussion and conclusions
Increased incubation temperature resulted in acceleratedembryonic development to hatch and initiation ofexogenous feeding as found in other studies (Kamler1992; Hall and Johnston 2003; Ojanguren and Brana2003; Martell et al. 2005). However, hatching occurredat the same relative developmental time at all tempera-tures when standardized against a fixed developmentalevent (Johnston 1993; Hall and Johnston 2003)(Fig. 2a). Continuous development as measured by theincrease in embryonic length from epiboly to hatch wasaccelerated proportional to incubation temperature(Fig. 2a) with no discernable difference in gross devel-opmental rate among temperature groups (Fig. 2b).However, continued acceleration in gut developmentproportional to temperature remained apparent follow-ing hatch, indicative of a persistent change in develop-ment that extended beyond the period of differentialincubation temperature (Fig. 2c, d). Such changes havebeen described previously but have been restricted toinvestigations on muscle development (Johnston 2001).Hunt von Herbing et al. (1996) reported that, in cod,greater larval growth [developmental] rates were ob-served to co-vary with increased intestinal developmentand suggested that this may have been a function of animproved ability to digest and absorb nutrients.
With the exception of the closure of the blastopore,no early developmental landmarks showed any signifi-cant shift in the time of appearance among temperaturegroups (Fig. 4a, b). Hall and Johnston (2003) observedthat blastopore closure in developing cod also was af-fected by temperature, although it was reported to occurlater with respect to somitogenesis at higher tempera-
tures. Furthermore, studies of herring (Johnston 1993)and cod development (Hall and Johnston 2003) have notreported any changes during early development associ-ated with different incubation temperatures. However, inthe present study significant changes in the timing andsequence of developmental events were found later indevelopment during organogenesis (Kimmel et al. 1995;Martell et al. 2005) (Figs. 3a, b, 4a, b). Similar temporalshifts in organ development during late embryogenesishave also been reported for herring by Johnston (1993).Also, changes in the development of some of the sametissues have been observed for cod (Galloway et al.1999), brown trout (Salmo trutta L.) (Killeen et al.1999), and salmon (S. salar L.) (Pavlov 1984).
Although haddock reared at different temperaturesappeared to be superficially similar at hatch and initia-tion of exogenous feeding, several significant develop-mental differences were present. Greater incubationtemperatures produced larvae with more advanced ormature eye, notochord, and blood cell development,while development of the neural tube and myofibrill-arogenesis were delayed (Fig. 4a, b). Although the slo-wed development was also seen in herring (Johnston1993), it was found associated with lower incubationtemperatures. Johnston (1993) also reported that herringdisplayed an increase in myofibril density at increasedtemperatures while Hall and Johnston (2003) observedno significant difference in either myofibrillargenesis orsomitogenesis in cod grown at greater incubation tem-peratures. For haddock, increased embryonic rearingtemperatures produced greater numbers of smaller deepmuscle cells in larvae than from those incubated at lowertemperatures (Martell 2005). This increase in myofibrenumber coincided with the earlier overgrowth of theneural tube by muscle in the dorsal epaxial proliferationzone as observed herein in larvae from higher incubationtemperatures. Fauconneau and Paboeuf (2001), John-ston (2001), and Hall and Johnston (2003) also reportedthat temperature was positively associated with in-creased muscle cell recruitment, although Gallowayet al. (1998) found a result opposite from that of Halland Johnston (2003) for cod. Radmilovich et al. (2003)also noted, in juvenile turtles, (Chrysemys d’orbigny L.)that the increased environmental temperature resulted inincreased proliferation of cells in the central nervoussystem and increased myoblast migration. Sanger andStoiber (2001) reported that less mature muscle fibrespossessed a lower myofibril density. Therefore, increasednumbers of less mature muscle cells at higher incubationtemperatures may explain the lower density of myofibrilsobserved in haddock larvae herein.
Development is a complex multidimensional process,one that is readily affected by many genetic and epige-netic factors that operate simultaneously at multiplehierarchical levels through early ontogeny (Adriaens andVerraes 2002; Hall and Olsen 2003). Further, epigeneticfactors, such as temperature, can differentially andindependently affect development and metabolism suchthat development and growth progress independently
185
and often unequally (Kamler 1992). Variation in suchrates changes the proportion of total energy available toeach process during development which results in phe-notypic differences. Adriaens and Verraes (2002) andHall and Olson (2003) point out that size, an epigeneticfactor, influences development. Both the effect of envi-ronment and spatial interactions within the organism arefunctions of size (Adriaens and Verraes 2002). Kamler(1992) proposed that temperature positively affecteddevelopmental rates more than metabolic rates duringembryogenesis with the result that less energy would beexpended over a set developmental time. The remainingenergy could be directed towards growth. In the‘atroposic’ model of development as proposed byLindsey and Arnason (1981), phenotype is the productof both differentiation and growth. Although these twoprocesses are similarly affected by epigenetic factors,they proceed independently of each other and when ei-ther process achieves some crucial threshold, the other isdown-regulated. Different genetic and physiologicalsystems are at work during early and late development(Atchley et al. 1997, 2000). Based on the observed sig-nificant changes in developmental trajectories, haddockincubated at increased temperatures hatched out andinitiated exogenous feeding in a more advanced/maturedevelopmental state such as described for mouse devel-opment by Atchley et al. (1997, 2000). Additionally,Johnston et al. (2001) reported that herring larvae rearedat higher incubation temperatures had greater fast-startswimming performance and a more advanced and stablesub-carangiform swimming style.
Regulatory systems are highly integrated and there-fore develop systematically from a collection of com-ponents, each with its own developmental trajectory(Spicer and Burggren 2003). Accordingly, for a systemto become functional, all elements must be fully assem-bled. However, each may develop and become func-tional at a different time. Epigenetic influences maydisrupt the temporal sequencing for each component,resulting in a change in or loss of capability or change intime to full function (Mabee et al. 2000; Hall andJohnston 2003; Spicer and Burggren 2003). It may alsotrigger a modification in the development of that regu-latory system such that new components would be re-quired for full function. This could result in changes tomortality, growth, or exploitive capability throughontogeny. Spicer and Burggren (2003) proposed physi-ological heterokairy to explain alterations in the rates,sequence, or developmental period of a physiologicalregulatory system during the development of an indi-vidual. We propose that a similar process may functionfor morphological development, wherein the timing ofcellular, tissue, or organ development may be shifted dueto the influence of environmental factors duringembryogenesis. It remains to be determined how all ofthe observed phenotypic changes work in concert toinfluence swimming performance, growth, predatoravoidance, and, ultimately, survival in different thermalenvironments.
Acknowledgements The authors acknowledge the financial andlogistical support provided to D.J.M. and E.A.T. by Fisheries andOceans Canada (St. Andrews Biological Station, St. Andrews, NB).Also J.D.K. thanks the Natural Sciences and Engineering ResearchCouncil for funding and the MADSAM fish group for continuedsupport. We also wish to thank Drs. J. Castell and D. MacLatchyfor invaluable advice and guidance on the research, E. Heikkila forher support and skilful editorial guidance, and two anonymousreviewers for helpful comments on the manuscript. All experi-mental protocols followed CCAC guidelines for the care and use ofexperimental animals.
References
Adriaens D, Verraes W (2002) An empirical approach to study therelation between ontogeny, size and age using geometric mor-phologies. In: Aerts P, D’Aout K, Herrel A, Van Damme R(eds) Topics in functional and ecological vertebrate morphol-ogy. Shaker Publishing, Maastricht, pp 293–324
Aiken DE (ed) (2003) Early rearing of haddock: state of the art.Aqua Assoc Can, Spec Pub 7: 136p
Atchley WR, Xu S, Cowley DE (1997) Altering developmentaltrajectories in mice by restricted index selection. Genetics146:629–640
Atchley WR, Wei R, Crenshaw P (2000) Cellular consequences inthe brain and liver of age-specific selection for rate of devel-opment in mice. Genetics 155:1347–1357
Balon EK (1999) Alternative ways how to become a definitivephenotype or a juvenile (and on some persisting linguistic of-fences). Environ Biol Fish 56:17–38
Blaxter JHS (1992) The effect of temperature on larval fishes. NethJ Zool 42:336–357
Devoto SH, Melancon E, Eisen JS, Westerfield M (1996) Identifi-cation of separate slow and fast muscle precursor cells in vivo,prior to somite formation. Development 22:3371–3380
Fauconneau B, Paboeuf G (2001) Muscle satellite cells in fish. In:Johnston IA (ed) Fish physiology, vol 18. Muscle developmentand growth. Academic, London, pp 73–101
Fijan N (2002) Morphogenesis of blood cell lineages in channelcatfish. J Fish Biol 60:999–1014
Fuiman LA, Poling KR, Higgs DM (1998) Quantifying develop-mental progress for comparative studies of larval fishes. Copeia1998:602–611
Galloway TF, Kjørsvik E, Kryvi H (1998) Effect of temperature onviability and axial muscle development in embryos and yolk saclarvae of the Northeast Arctic cod (Gadus morhua). Mar Biol132:559–567
Galloway TF, Kjørsvik E, Kryvi H (1999) Muscle growth anddevelopment in Atlantic cod larvae (Gadus morhua L.) relatedto different somatic growth rates. J Exp Biol 202:2111–2120
Gibson S, Johnston IA (1995) Temperature and development inlarvae of the turbot Scophthalmus maximus. Mar Biol 124:17–25
Hall TE, Johnston IA (2003) Temperature and developmentalplasticity during embryogenesis in the Atlantic cod Gadusmorhua L. Mar Biol 142:833–840
Hall BK, Olsen WM (eds) (2003) Keywords and concepts in evo-lutionary developmental biology. Harvard University Press,Cambridge
Hall TE, Smith P, Johnston IA (2004) Stages of embryonic devel-opment in the Atlantic cod Gadus morhua. J Morphol 259:255–270
Hamlin HJ, Hunt von Herbing I, Kling LJ (2000) Histological andmorphological evaluations of the digestive tract and associatedorgans of haddock throughout post-hatching ontogeny. J FishBiol 57:716–732
Hazel JR, Prosser CL (1974) Molecular mechanisms of tempera-ture compensation in poikilotherms. Physiol Rev 54:620–677
Hill J, Johnston IA (1997) Photomicrographic atlas of herringdevelopment. J Fish Biol 51:960–977
186
Hochachka PW, Somero GN (2002) Biochemical adaptation:mechanism and process in physiological evolution. OxfordUniversity Press, Toronto
Hunt von Herbing I (2001) Development of feeding structures inlarval fish with different life histories: winter flounder andAtlantic cod. J Fish Biol 59:767–782
Hunt von Herbing I, Boutilier RG, Miyake T, Hall BK (1996)Effects of temperature on morphological landmarks critical togrowth and survival in larval Atlantic cod (Gadus morhua). MarBiol 124:593–606
Jobling M (1994) Fish bioenergetics. Chapman and Hall, TorontoJobling M (1997) Temperature and growth: modulation of growth
rate via temperature change. In: Wood CM, McDonald DG(eds) Global warming: implications for freshwater and marinefish. Cambridge University Press, Cambridge, pp 225–253
Johnston IA (1993) Temperature influences muscle differentiationand the relative timing of organogenesis in herring (Clupeaharengus) larvae. Mar Biol 116:363–379
Johnston IA (1999) Muscle development and growth: potentialimplications for flesh quality in fish. Aquaculture 177:99–115
Johnston IA (2001) Genetic and environmental determinants ofmuscle growth patterns. In: Johnston IA (ed) Fish physiology,vol 18. Muscle development and growth. Academic, London,pp 141–184
Johnston IA, Vieira VLA, Hill J (1996) Temperature and ontogenyin ectotherms: muscle phenotype in fish. In: Johnston IA,Bennett AF (eds) Phenotypic and evolutionary adaptations oforganisms to temperature. Society for experimental biologyseminar series. Cambridge University Press, Cambridge, pp153–181
Johnston IA, Cole NJ, Vieira VLA, Davidson I (1997) Tempera-ture and developmental plasticity of muscle phenotype in her-ring larvae. J Exp Biol 200:849–868
Johnston IA, Vieira VLA, Temple GK (2001) Functional conse-quences and population differences in the developmental plas-ticity of muscle to temperature in Atlantic herring Clupeaharengus. Mar Ecol Prog Ser 213:285–300
Kamler E (1992) Early life history of fish: an energetics approach.Chapman and Hall, London
Kennedy CJ, Walsh PJ (1997) Effects of temperature on xenobioticmetabolism. In: Wood CM, McDonald DG (eds) Globalwarming: implications for freshwater and marine fish. Cam-bridge University Press, Cambridge, pp 303–324
Killeen JR, McLay HA, Johnston IA (1999) Temperature andneuromuscular development in embryos of the trout (Salmotrutta L.)
Kimmel CB, Ballard WW, Kimmel SR, Ullmann B, Schilling TF(1995) Stages of embryonic development of the zebrafish. DevDyn 203:253–310
Koumoundouros G, Divanach P, Kentouri M (1999) Ontogenyand allometric plasticity of Dentex dentex (Osteichthyes:Sparidae) in rearing conditions. Mar Biol 135:561–572
Kovac V (2002) Synchrony and heterochrony in ontogeny (of fish).J Theor Biol 217:499–507
Lancioni H, Lucentini L, Panara F (2005) Ontogentic changes ofcirculating erythroid cells and haemoglobin components inEsox lucius. J Fish Biol 66:1576–1588
Lindsey CC, Arnason AN (1981) A model for responses of verte-bral numbers in fish to environmental influences during devel-opment. Can J Fish Aquat Sci 38:334–347
Mabee PM, Olmstead KL, Cubbage CC (2000) An experimentalstudy of intraspecific variation, developmental timing, andheterochrony in fishes. Evolution 54:2091–2106
Martell DJ (2005) Temperature-affected phenotypic plasticity inhaddock (Melanogrammus aegelfinus L.) development. PhDThesis, University of New Brunswick
Martell DJ, Kieffer JD, Trippel EA (2005) Effects of temperatureduring early life history on embryonic and larval developmentand growth in haddock, Melanogrammus aeglefinus. J Fish Biol66:1558–1575. DOI 10.1111/j.1095-8649.2005.00699.x
Martin JH, Lynn JA, Nickey WM (1966) A rapid polychrome stainfor epoxy-embedded tissue. Am J Clin Path 46:250–251
Martinez GM, Bolker JA (2003) Embryonic and larval staging ofsummer flounder (Paralichthys dentatus). J Morphol 255:162–176
Morrison CM (1993) Histology of the Atlantic cod: an atlas. PartIV. Eleutheroembryo and larva. Can Spec Publ Fish Aquat Sci119:1–496
Morrison CM, Miyake T, Wright JR Jr (2001) Histological studyof the development of the embryo and early larva of Oreochr-omis niloticus (Pisces: Cichlidae). J Morphol 247:172–195
Ojanguren AF, Brana F (2003) Thermal dependence of embryonicgrowth and development in brown trout. J Fish Biol 62:580–590
Pavlov DA (1984) Effect of temperature during early ontogeny ofAtlantic salmon, Salmo salar. 1 Variability of morphologicalcharacters and duration of development of Atlantic salmonunder different temperatures. J Ichthyol 24:30–38
Presnell JK, Schreibman MP (1997) Humason’s animal tissuetechniques, 5 edn. The Johns Hopkins University Press, Balti-more
Radmilovich M, Fernandez A, Trujillo-Cenoz O (2003) Environ-mental temperature affects cell proliferation in the spinal cordand brain of juvenile turtles. J Exp Biol 206:3085–3093
Rideout RM, Trippel EA, Litvak MK (2004) Paternal effects onhaddock early life history traits. J Fish Biol 64:695–701. DOI10.1046/j.1095-8649.2003.00335.x
Rombough PJ (1997) The effects of temperature on embryonic andlarval development. In: Wood CM, McDonald DG (eds) Glo-bal warming: implications for freshwater and marine fish.Cambridge University Press, Cambridge, pp 177–223
Sanger AM, Stoiber W (2001) Muscle fibre diversity and plasticity.In: Johnston IA (ed) Fish physiology, vol 18. Muscle develop-ment and growth. Academic, London, pp 187–250
Scott WB, Scott MG (1988) Atlantic fishes of Canada. Can BullFish Aquat Sci 219:731 p
Spicer JI, Burggren WW (2003) Development of physiologicalregulatory system: altering the timing of crucial events. Zool106:1–9
Spurlock BO, Skinner MS, Kattine AA (1966) A simple rapidmethod for staining epoxy-embedded specimens for lightmicroscopy with the polychromatic stain, Paragon-1301. Am JClin Path 46:252–258
Trippel EA (1998) Egg size and viability and seasonal offspringproduction of young Atlantic cod. Trans Am Fish Soc 127:339–359
Veggetti A, Rowlerson A, Radaelli S, Arrighi S, Domeneghini C(1999) Post-hatching development of the gut and lateral musclein the sole. J Fish Biol 55A:44–65
Zapata A, Diez B, Cejalvo T, Gutierrez-de Frıas C, Cortes A (2005)Ontogeny of the immune system of fish. Fish Shellfish Immun(in press)
Zar JH (1999) Biostatistical analysis. Prentice-Hall Canada Inc,Toronto
187