report february 2009 yellow haddock - seafish - … haddock - 1 - report february 2009 yellow...
TRANSCRIPT
Yellow Haddock
- 1 -
Report February 2009 Yellow Haddock To: Steve Lamming Youngs Bluecrest Seafood Cc: John Croy, Torger Børresen; Richard Watson From: Caroline P. Baron Technical University of Denmark, DTU AQUA, Institute for Aquatic Resources Denmark. Tel: (+45) 45 25 49 19 Email: [email protected] This report concerns the last stages of the project (Stage 3) plan as outlined in the Project Document. Stage 1 Summary: This stage started early 2007 by collecting information and having meetings for planning experiments on board and in the lab. Initial analyses prior to the present project had pointed toward poor bleeding and/or delayed gutting as causes for yellow fillets as samples provided had shown high levels of iron and free fatty acids (FFA). High levels of iron indicate poor bleeding and high levels of FFA indicated breakdown of triglycerides (TG) or phospholipids (PL). It was thus thought that the emergence of yellow colour could be provoked experimentally by manipulating with bleeding and/or delayed gutting. However, after a series of experiments at this stage, the collected information and results of laboratory analyses indicated that yellow fillets could not be produced by provocation as easily as had been planned by poor bleeding or other catch handling manipulations. Stage 2 Summary: This part of the project dealt with more extensive experiments for inducing yellowing of haddock on board of vessel by applying the handling parameters that might be responsible for it. These parameters were based on new information gathered from the crew on board fishing vessels in the Barents Sea, ship owners, and companies buying and processing haddock on board, in Norway or in China. The new parameters included:
- Effects of spawning of the fish – spawning/non spawning investigated - Haddock feeding on herring roe – intensive feeding on roe could be a factor - Haddock could not stand rough mechanical handling or pressure on the fish - Fluctuation of freezing temperature could lead to muscle fractures causing chemical
reactions in the tissue producing yellow colour In the spring of 2008 on board experiments took place in Denmark (DK) and Norway (NO). Sampling on board in DK was from commercial fishing vessels fishing in Danish waters. Sampling on Board in NO was from a commercial vessel fishing in the Barents Sea. Samples were either headed & gutted (H & G) or only gutted (G) when arriving to our laboratories and frozen as blocks or as individuals unless otherwise stated. It was concluded that none of the new parameters could be taken as a single cause of yellow fillets, but clues emerged that a combination of factors was necessary, and a deeper investigation of the chemical composition of the compound or compounds responsible for the yellow colour was considered necessary.
Caroline P. Baron 02/2009
Yellow Haddock
- 2 -
Stage 3 Summary: This part of the project dealt with reporting and drawing conclusions from the different analyses performed of the different samples immediately after arrival to our laboratory and up to 5 months frozen storage under various freezing regimes. Further, in depth biochemical analyses were performed on potential mechanisms for the production of yellow colour in the muscle tissue. It has been clarified that most likely the enzyme phospholipase A2 (PLA) splits off a fatty acids from the PL phosphatidylethanolamine (PE), which consecutively reacts with muscle proteins forming yellow complexes. However, it is not known what activates such enzyme activity. Irrespective of the treatments, none of the samples were showing the very characteristic features of the reference yellow sample (R1) during the storage period. Therefore, it was not possible to draw conclusions and advise on good handling practice for avoiding the yellow haddock problem within the project period. Analysis of Yellow Reference Samples (R1): During Stage 3 reference samples were obtained from Youngs Seafood Ltd. and analysed for the critical chemical parameters having been determined as central for the yellow haddock problem. Investigations showed that the yellow haddock had a higher iron level and a substantially high FFA coming from PL breakdown and low peroxide indicating little lipid oxidation. This indicates an activation of the enzyme PLA. The PLA is believed to be responsible for the FFA release in the yellow haddock. However, when checked for activity of PLA in the reference sample, it was found to be extremely low (in some cases equal to zero), indicating that the enzyme had been active, but subsequently inactivated due to protein denaturation due to freezing. Thus the low PLA activity revealed severe general protein denaturation. The PL profile of the yellow sample was analysed and it was revealed that one of the phospholipids, PE, was completely depleted in the yellow samples compared to the non yellow samples. According to the literature PE and certain of its reaction products after hydrolysis are very reactive and under some conditions are able to interact with proteins to form yellow pigments. This is most likely the mechanism of yellowing in the haddock samples. When comparing our different samples with the critical values characteristic for our reference sample we are looking for conditions generating a sample with an average iron value of 2 ppm, measured colour values as ‘b* values’ ranging from 11.73 for very yellow sample to 5.84 for light yellow sample and lightness ‘L’ of ranging from 69.01 to 59.93, FFA ranging from 55.91 to 30.56 for very yellow and slightly yellow respectively and an extremely low PLA ranging from 8.17 for very yellow sample and of 39 for less yellow samples. It is clear from these information revealed that the yellowing process takes place by inducing a decrease in PLA activity an increase in FFA and an increase in ‘b*’ and ‘L’ values. All information and data related to analysis of the yellow sample references from different batch of samples (1 being very yellow to 4 being slightly yellow) are given in Appendix R1. RESULTS FROM STAGE 3: Onboard Sampling: DK sample from Denmark: Two set of experiments on board were performed in DK on a commercial fishing vessel in the Danish waters. Details of the fishing conditions for the trials and their location are given
Caroline P. Baron 02/2009

Yellow Haddock
- 3 -
in Appendix DK. Samples were frozen individually in plastic bags on board in an freezer at -20 °C.
a) The effect of delayed gutting was investigated in combination with mechanical pressure this was performed in February 2008. Three types of samples were generated. A normal protocol, B delayed gutting for 5 hours and storage on ice, C delayed gutting for 5 hours storage on ice with 30 kg on top of the fish to simulate mechanical pressure. (See Appendix A1 for experimental design).
b) The effect of good bleeding poor bleeding being investigated. The design following the project document. In addition extra parameters such as delayed gutting on ice or at deck temperature were also performed. Samples generated where A with normal processed, B delay gutting for 5 hours on ice, C delayed gutting for 5 hours at deck temperature. In addition each batch was either bleed for series 1 and non bleed for series 2.This experiment was performed in June 2008 (Appendix B1 for experimental design).
NO sample from Norway: Samples were collected from a Norwegian commercial vessel Ramoen from Vartdal Seafood in Ålesund, cruising in the Barents Sea. Sample were processed on board and frozen as H&G blocks. No precise details of the fishing conditions or exact location have been obtained but this was performed according to Vartdal standards.
c) One experiment was performed on board in NO in the Barents Sea with the effect of good bleeding poor bleeding being investigated according to the project document. Samples were H1 normal process and H2 non bleed samples. (See Appendix C1 for experimental design). Samples were stored at constant or at fluctuating temperature. Sampling took place in June 2008.
Additional samples were collected from their storage facilities:
d) Samples were collected from their storage facilities were collected to investigate the effect of spawning and of the feeding regime. Three lots of frozen blocks were collected 202 fish feeding on herring roe, 203 large fish (spawning), and 201 small fish (non-spawning). In addition, spiking with PLA was performed with these samples at two different level of PLA (commercial PLA from pig pancreas) to trigger the yellowing. Moreover, the effect of multiple freezing cycles was investigated in these different samples 201, 202 and 203. Sampling took place in March 2008 (See Appendix D1 for experimental design).
Analysis of Samples: Due to problems with our equipment it was unfortunately impossible to obtain iron level in any of the sample analysed. References for the protocols used for the analysis is given in appendix P1. DK sample from Denmark:
Caroline P. Baron 02/2009

Yellow Haddock
- 4 -
A) Samples from February have all been analysed. The results indicated that gutted samples that have been under mechanical pressure (C) seemed slightly more yellow. In addition these samples also had a reduced PLA activity and a lower FFA. The same tendency was observed after 2.5 months of frozen storage. However, here the b* value reporting yellowness was not obtained and visual inspection did not clearly give the impression that the yellow colour observed was as intense as our yellow reference sample. The importance of rigor mortis and the impact of the handling temperature seem to be a lead that might need further investigation, the reason being that if the fish is handled during rigor mortis cell membranes may break at an early stage, activating the PLA. Storage for 2.5 months at -20 °C as whole fish seemed to give higher quality than storage as fillets with respect to the parameters studies (FFA, PV, PLA). See appendix A2 for details. None of the treatments (A, B, C, respectively normal, delayed gutting on ice and delayed gutting on ice + 30 kg mechanical pressure) however, clearly resulted in the formation of the yellow haddock. From this investigation it is not possible to assess if these samples would have turned yellow after prolonged storage and resembled the yellow haddock reference.
B) Samples from June have all been analysed. The result on the fresh gutted fish (A) (as opposed to fillets stored 5 months) indicated that in general samples that were not bled (series 2: A2, B2, C2) had a lower PLA activity compared to bled samples (series 1: A1, B1, C1) and a slightly higher FFA. In addition delaying the gutting (B & C) decreased the remaining PLA activity and increased the FFA values. This effect was much more pronounced in samples that were stored on deck for 5 hours prior to freezing with then little effect of the bleeding step (no difference between C1 and C2). Fish that were stored for 5 hours at deck (C) were well into rigor compared to fish that were frozen immediately (A) and fish that were on ice (B). A possible effect of the onset of rigor mortis might be an important factor in the development of the yellow haddock. Calcium release and activation of PLA might be happening with the sample stored on the deck for long period of time. During storage of the fillets all samples developed high FFA values and a high PLA activity, but none them developed an intense yellow colour.
NO samples from Norway:
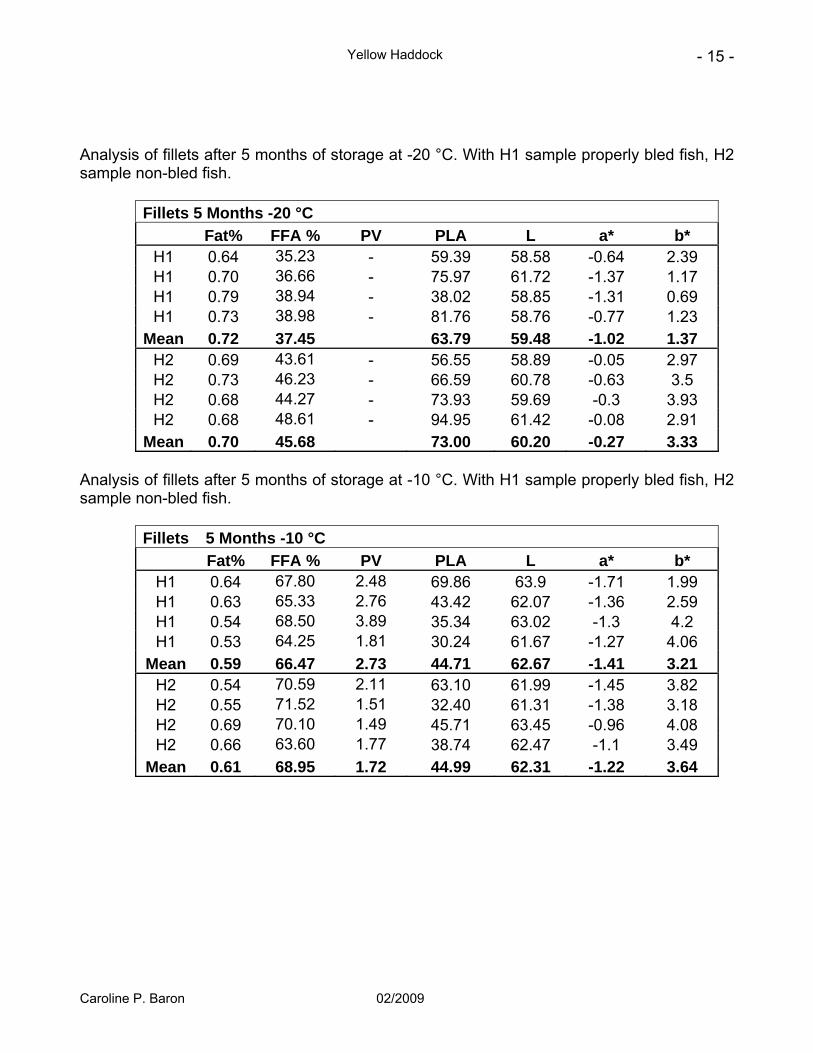
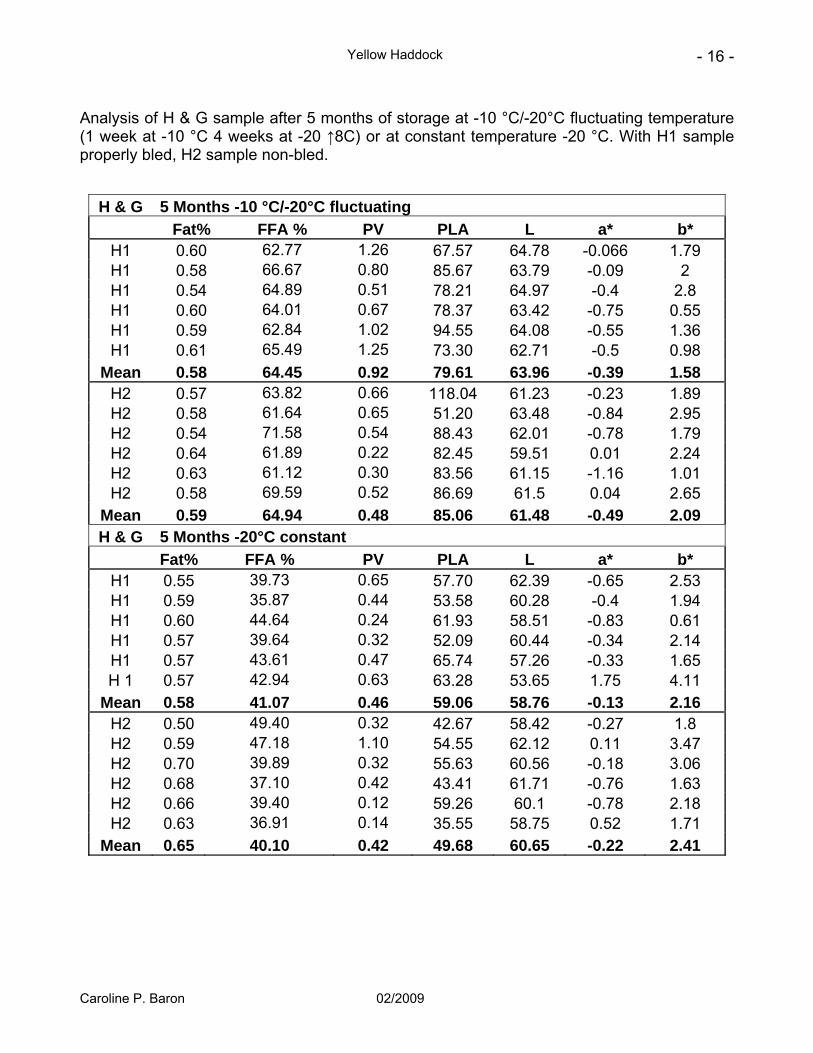
C) Samples from June have all been analysed. Poorly bleed sample (H2) had a significantly higher FFA and a lower PLA compared to the correctly bled samples (H1). After 5 months storage of the fillet H2 samples still had a higher FFA and was more yellow when compared to H1 samples. However, the PLA activity was very high for both samples. After 5 months storage of the H&G samples differences between H2 and H1 was not significant irrespective of the storage temperature (constant or fluctuating). None of the samples developed the characteristics of the yellow haddock.
D) Samples from March have all been analysed. In general, no yellow samples were observed in any of the samples analysed and they all had a high PLA and a low FFA. Samples from fish feeding on herring roe (202) had a slightly lower PLA but a very low FFA. None of the samples developed the characteristics of the yellow haddock
Caroline P. Baron 02/2009

Yellow Haddock
- 5 -
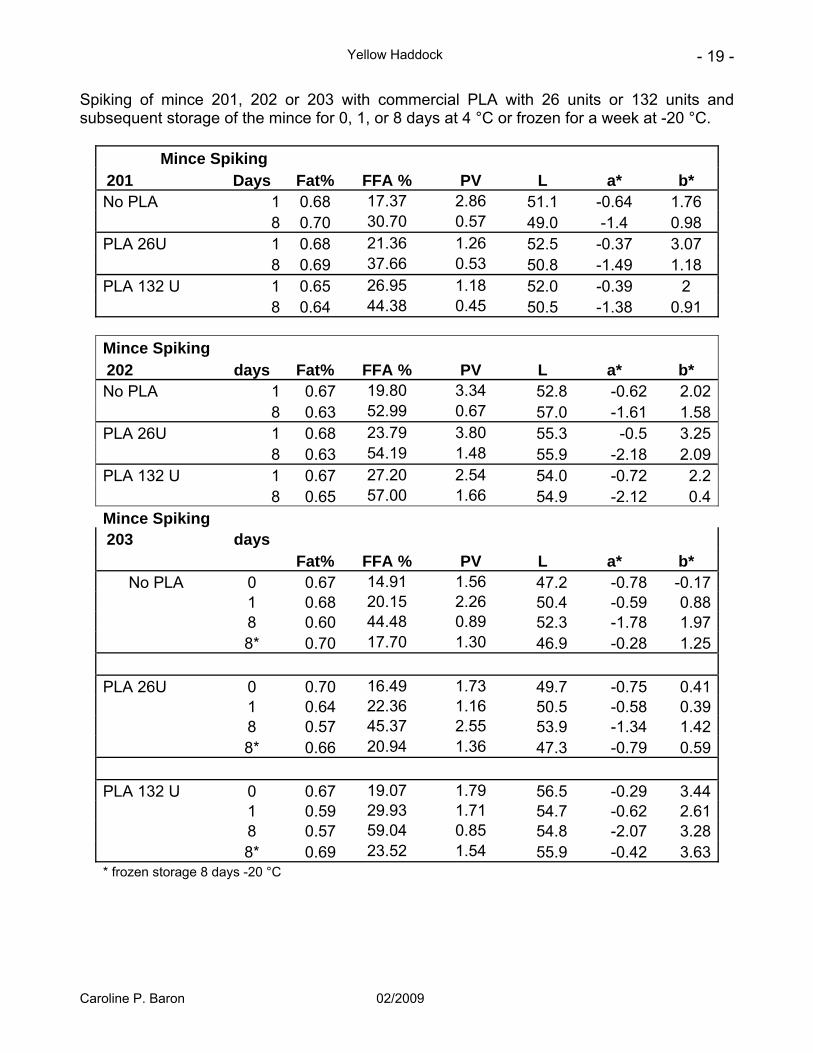
even after 9 months of storage. Samples from spawning fish did develop a more intense yellow colour compared to the other two codes after 9 months of storage but their PLA was still significantly high. After repeated thawing/freezing cycling and subsequent storage these samples also seemed to be more yellow than the other two sample codes, however, their FFA level was still reasonably low. Spiking of these samples with PLA did result in an increase in FFA and in yellowness with a more pronounced effect on the spawning fish (203).This clearly revealed the link between the development of the yellow colour, the PLA activity and the FFA.
GENERAL CONCLUSIONS: Strong evidence has been obtained for the molecular mechanism behind the formation of the yellow colour in haddock fillets. Hydrolysis of the fatty acids from the phospholipid due to activation of the phospholipases result in the release of free fatty acid that are able to interact with protein and induce protein denaturation and formation of a yellow pigment. Spiking experiment revealed that this is likely to be the case and that PLA is able to induce yellowing and high FFA level. However, the exact handling conditions of the catch and on board practice leading to the yellowing have not been clearly obtained, and the conditions necessary to induce the yellowing of the haddock have not been totally elucidated. It is likely that the yellow haddock effect is multifactorial. From our investigation it is evident that poor bleeding, prolonged storage of fillets, and fluctuating frozen storage temperature as well as multiple freezing thawing cycle are all parameters that will result in a lower quality haddock. However, none of the samples developed into the yellow haddock in the time frame of investigation. It is possible that with prolonged storage some samples would have turned into yellow haddock. From our investigation none of the investigated parameters (bleeding, storage temperature fluctuation, fish physiology, fishing grounds etc...) can be disregarded at this stage and a more thorough investigation will be necessary to reveal the exact combination of conditions leading to the yellow haddock problem. SUGGESTION FOR FURTHER WORK TO AVOID YELLOW HADDOCK Based on the present investigations it is not possible to give advice for how good handling practice for avoiding the yellow haddock problem. However, the work having been performed until now points towards a procedure for solving the problem. The basic problem of yellow haddock is due to activation of the PLA enzyme. Further investigation should thus target an understanding the factors that are inducing activation of the PLA thereby triggering the mechanism of yellowing in haddock. More fundamental research in PLA enzyme in fish and its activity in relation to fish physiology and fish handling as well as its activation mechanism should be investigated. Furthermore if additional on board investigations have to be performed would be important to have a full understanding of how PLA is triggered by bad handling practice. It is obvious to us that rigor mortis is an important parameter to take into consideration as release of compartmentalised calcium will result in activation of PLA2, and this happens as a result of rigor mortis. The way rigor mortis is passed, particularly relative to freezing operations, may be crucial for activating the PLA2 enzyme. Only when these mechanisms are understood it will be possible to give recommendations on good handling practice. It is obvious that the yellow haddock problem is multifactorial and only multivariate data analysis will help at interpretation of the present and future data sets.
Caroline P. Baron 02/2009
Yellow Haddock
- 6 -
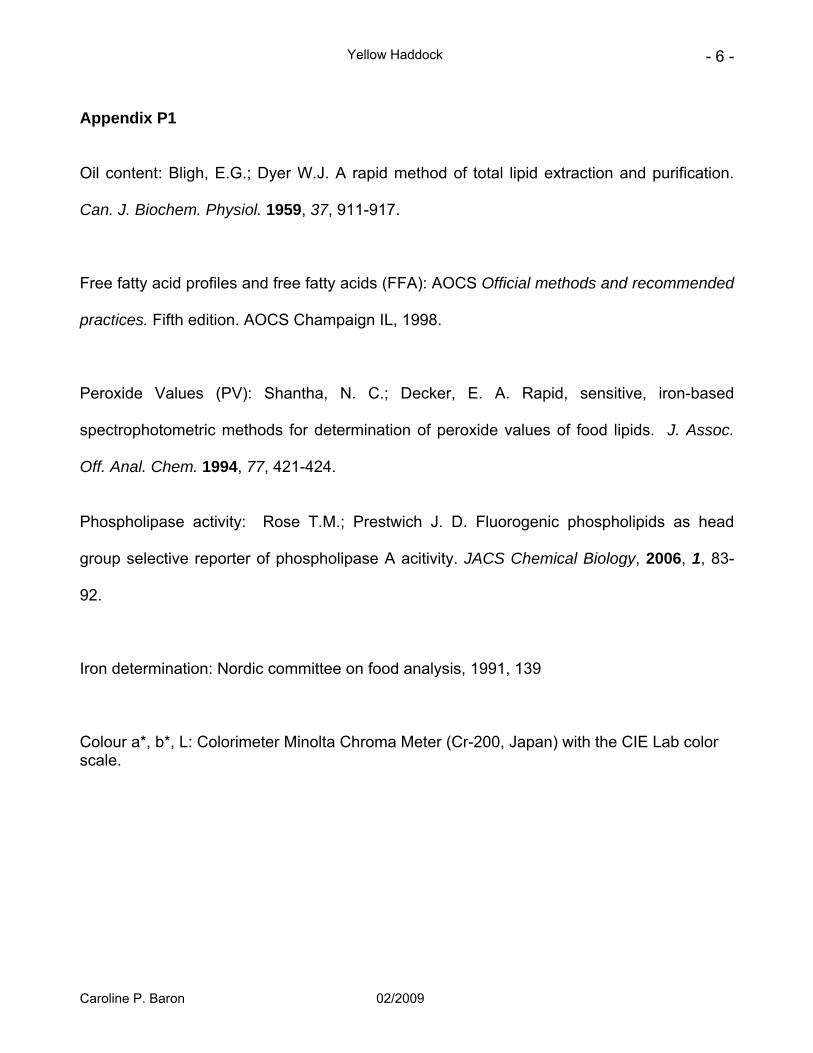
Appendix P1
Oil content: Bligh, E.G.; Dyer W.J. A rapid method of total lipid extraction and purification.
Can. J. Biochem. Physiol. 1959, 37, 911-917.
Free fatty acid profiles and free fatty acids (FFA): AOCS Official methods and recommended
practices. Fifth edition. AOCS Champaign IL, 1998.
Peroxide Values (PV): Shantha, N. C.; Decker, E. A. Rapid, sensitive, iron-based
spectrophotometric methods for determination of peroxide values of food lipids. J. Assoc.
Off. Anal. Chem. 1994, 77, 421-424.
Phospholipase activity: Rose T.M.; Prestwich J. D. Fluorogenic phospholipids as head
group selective reporter of phospholipase A acitivity. JACS Chemical Biology, 2006, 1, 83-
92.
Iron determination: Nordic committee on food analysis, 1991, 139
Colour a*, b*, L: Colorimeter Minolta Chroma Meter (Cr-200, Japan) with the CIE Lab color scale.
Caroline P. Baron 02/2009
Yellow Haddock
- 7 -
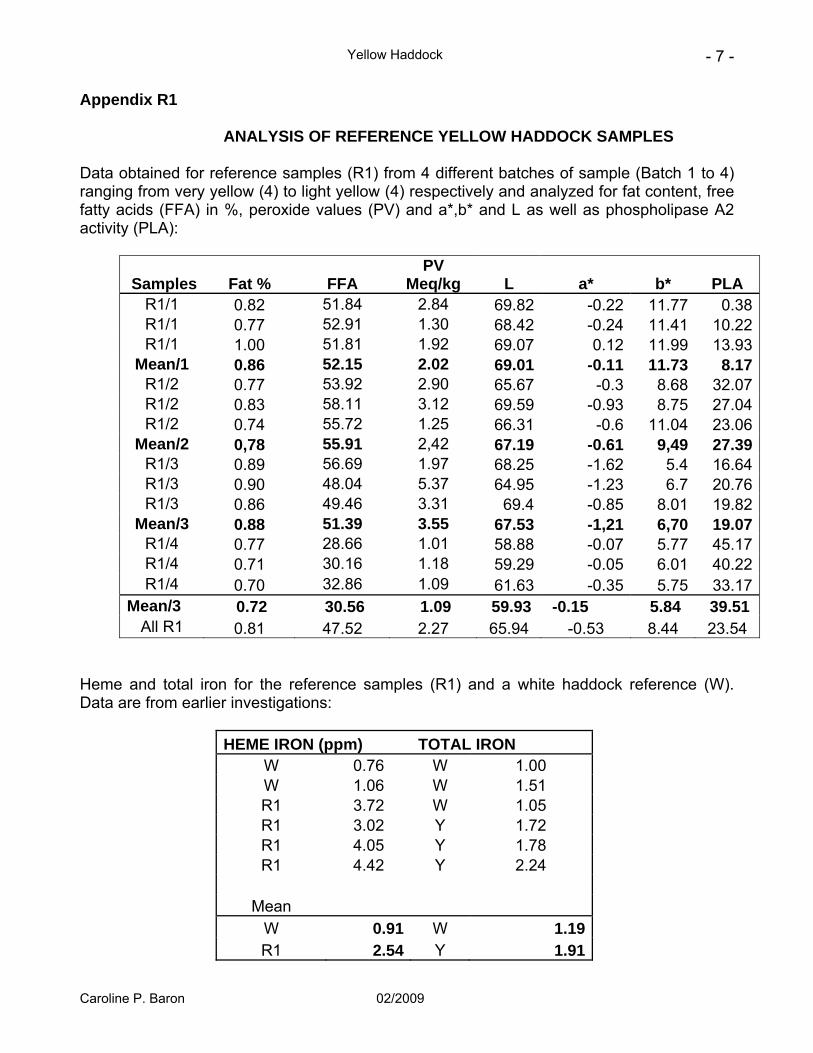
Appendix R1
ANALYSIS OF REFERENCE YELLOW HADDOCK SAMPLES
Data obtained for reference samples (R1) from 4 different batches of sample (Batch 1 to 4) ranging from very yellow (4) to light yellow (4) respectively and analyzed for fat content, free fatty acids (FFA) in %, peroxide values (PV) and a*,b* and L as well as phospholipase A2 activity (PLA):
Samples Fat % FFA PV
Meq/kg L a* b* PLA R1/1 0.82 51.84 2.84 69.82 -0.22 11.77 0.38R1/1 0.77 52.91 1.30 68.42 -0.24 11.41 10.22R1/1 1.00 51.81 1.92 69.07 0.12 11.99 13.93
Mean/1 0.86 52.15 2.02 69.01 -0.11 11.73 8.17R1/2 0.77 53.92 2.90 65.67 -0.3 8.68 32.07R1/2 0.83 58.11 3.12 69.59 -0.93 8.75 27.04R1/2 0.74 55.72 1.25 66.31 -0.6 11.04 23.06
Mean/2 0,78 55.91 2,42 67.19 -0.61 9,49 27.39R1/3 0.89 56.69 1.97 68.25 -1.62 5.4 16.64R1/3 0.90 48.04 5.37 64.95 -1.23 6.7 20.76R1/3 0.86 49.46 3.31 69.4 -0.85 8.01 19.82
Mean/3 0.88 51.39 3.55 67.53 -1,21 6,70 19.07R1/4 0.77 28.66 1.01 58.88 -0.07 5.77 45.17R1/4 0.71 30.16 1.18 59.29 -0.05 6.01 40.22R1/4 0.70 32.86 1.09 61.63 -0.35 5.75 33.17
Mean/3 0.72 30.56 1.09 59.93 -0.15 5.84 39.51 All R1 0.81 47.52 2.27 65.94 -0.53 8.44 23.54
Heme and total iron for the reference samples (R1) and a white haddock reference (W). Data are from earlier investigations:
HEME IRON (ppm) TOTAL IRON W 0.76 W 1.00 W 1.06 W 1.51 R1 3.72 W 1.05 R1 3.02 Y 1.72 R1 4.05 Y 1.78 R1 4.42 Y 2.24
Mean
W 0.91 W 1.19 R1 2.54 Y 1.91
Caroline P. Baron 02/2009
Yellow Haddock
- 8 -
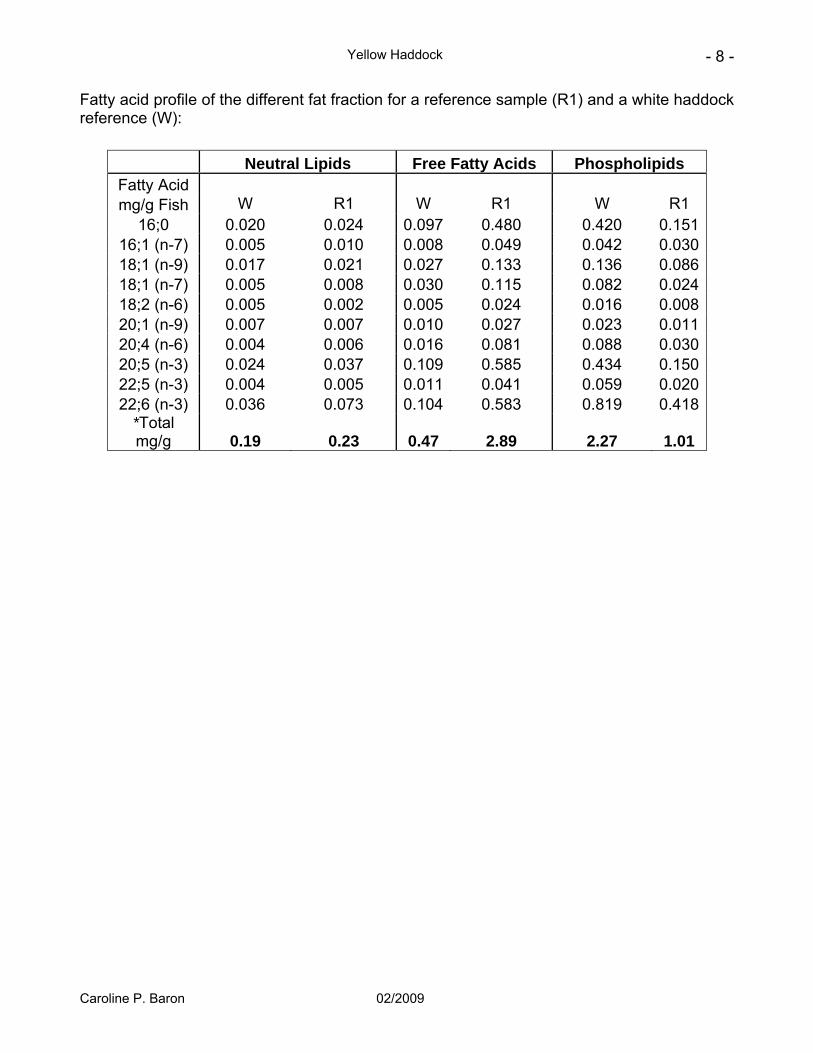
Fatty acid profile of the different fat fraction for a reference sample (R1) and a white haddock reference (W):
Neutral Lipids Free Fatty Acids Phospholipids Fatty Acid mg/g Fish W R1 W R1 W R1
16;0 0.020 0.024 0.097 0.480 0.420 0.15116;1 (n-7) 0.005 0.010 0.008 0.049 0.042 0.03018;1 (n-9) 0.017 0.021 0.027 0.133 0.136 0.08618;1 (n-7) 0.005 0.008 0.030 0.115 0.082 0.02418;2 (n-6) 0.005 0.002 0.005 0.024 0.016 0.00820;1 (n-9) 0.007 0.007 0.010 0.027 0.023 0.01120;4 (n-6) 0.004 0.006 0.016 0.081 0.088 0.03020;5 (n-3) 0.024 0.037 0.109 0.585 0.434 0.15022;5 (n-3) 0.004 0.005 0.011 0.041 0.059 0.02022;6 (n-3) 0.036 0.073 0.104 0.583 0.819 0.418
*Total mg/g 0.19 0.23 0.47 2.89 2.27 1.01
Caroline P. Baron 02/2009
Yellow Haddock
- 9 -
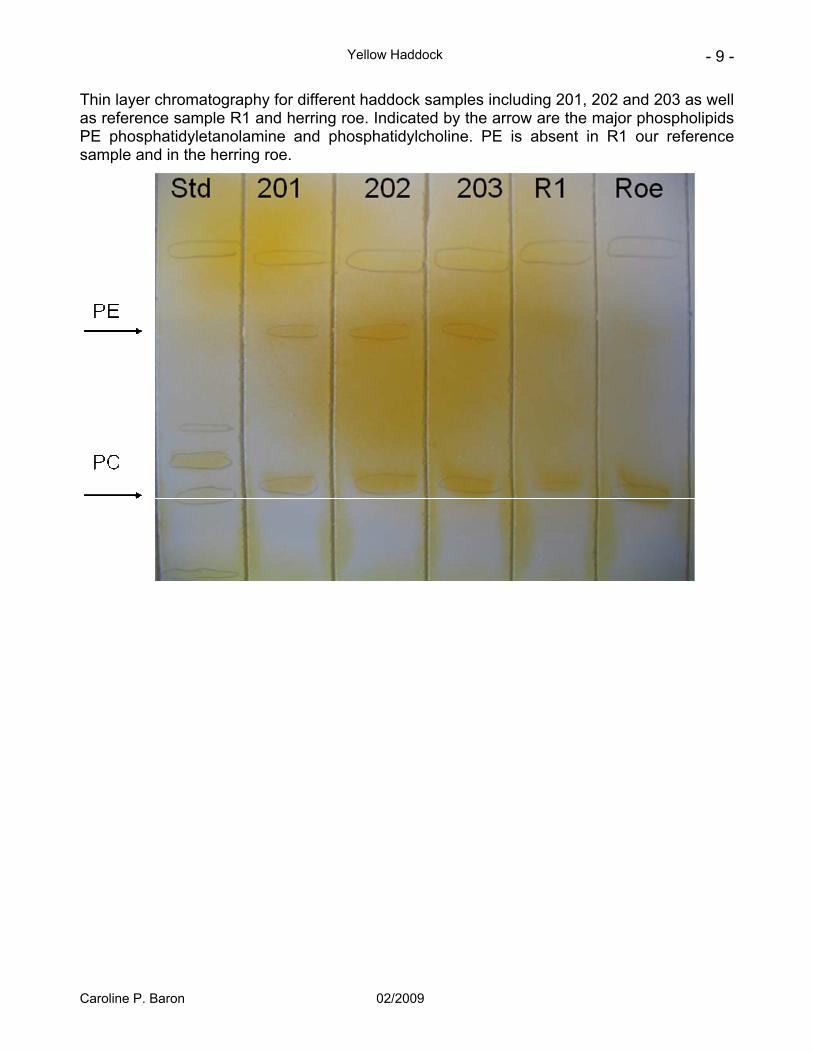
Thin layer chromatography for different haddock samples including 201, 202 and 203 as well as reference sample R1 and herring roe. Indicated by the arrow are the major phospholipids PE phosphatidyletanolamine and phosphatidylcholine. PE is absent in R1 our reference sample and in the herring roe.
Caroline P. Baron 02/2009

Yellow Haddock
- 10 -
APPENDIX A2 DK SAMPLES FROM DENMARK
Analysis of the gutted sample at arrival to our laboratory and after 2,5 months of storage at -20°C. With A immediately processed, B processed after 5 hours on ice, and C after 5 hours on ice with 30 kg on top. All samples were bleed and gutted. * indicate that the fish was into rigor before freezing. Gutted Fat% Mean FFA % Mean PV Meq/kg Mean PLA Mean
A 0.62 27.46 1.22 19.09 A 0.60 0.61 24.47 25.97 1.47 1.34 17.96 18.52B* 0.64 25.60 1.71 23.65 B* 0.75 0.69 26.34 25.97 0.71 1.21 15.99 19.82C* 0.65 22.96 2.06 12.58 C* 0.68 0.66 21.14 22.05 1.03 1.54 17.72 15.15
Gutted 2,5 Months -20 °C Fat% Mean FFA % Mean PV Meq/kg Mean PLA Mean
A 0.78 22.30 3.11 48.10 A 0.73 18.25 1.58 68.53 A 0.69 21.29 1.54 104.10 A 0.65 21.64 0.64 69.58 A 0.69 0.71 20.80 20.86 -0.09 1.36 51.70 68.40B* 0.77 21.58 1.40 57.16 B* 0.70 18.59 1.01 73.71 B* 0.74 21.75 -0.59 44.51 B* 0.71 22.82 0.71 50.71 B* 0.75 0.73 20.88 21.12 1.87 0.88 43.16 53.85C* 0.70 16.59 0.50 49.81 C* 0.68 18.72 1.35 58.38 C* 0.67 18.23 4.91 53.53 C* 0.66 19.93 5.24 47.43 C* 0.70 0.68 20.78 18.85 1.55 2.71 61.59 54.14
Caroline P. Baron 02/2009

Yellow Haddock
- 11 -
Analysis of the fillets after 2,5 months storage at -20°C with A immediately processed, B processed after 5 hours on ice, C and after 5 hours on ice with 30 kg on top. All samples were bled and gutted. * indicate that the fish was into rigor before freezing.
Fillets 2,5 Month -20 °C
Fat% Mean FFA % Mean
PV Meq/kg Mean PLA Mean
A 0.72 33.91 4.32 87.25 A 0.66 0.69 34.28 34.09 3.07 3.70 48.77 68.01 B* 0.70 33.25 4.02 68.80 B* 0.77 0.74 35.56 34.40 2.55 3.28 39.29 54.05 C* 0.67 32.20 4.23 73.14 C* 0.69 0.68 29.10 30.65 3.34 3.79 49.08 61.11
Caroline P. Baron 02/2009
Yellow Haddock
- 12 -
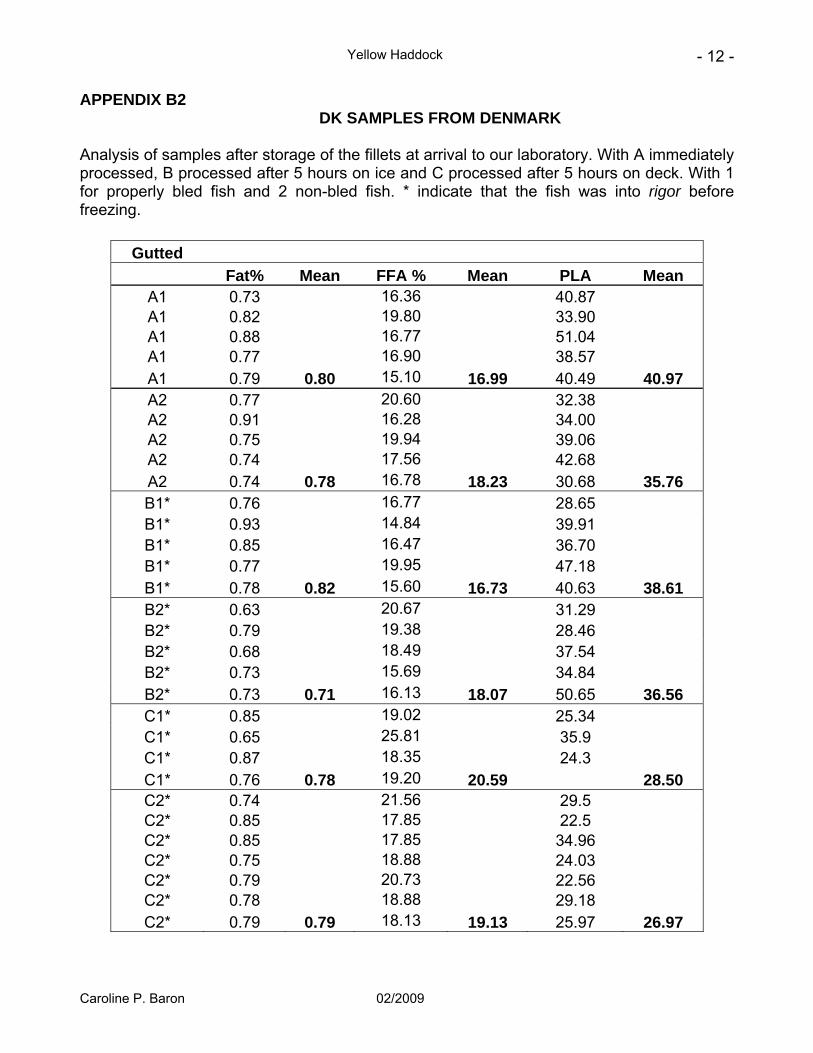
APPENDIX B2 DK SAMPLES FROM DENMARK
Analysis of samples after storage of the fillets at arrival to our laboratory. With A immediately processed, B processed after 5 hours on ice and C processed after 5 hours on deck. With 1 for properly bled fish and 2 non-bled fish. * indicate that the fish was into rigor before freezing.
Gutted Fat% Mean FFA % Mean PLA Mean
A1 0.73 16.36 40.87 A1 0.82 19.80 33.90 A1 0.88 16.77 51.04 A1 0.77 16.90 38.57 A1 0.79 0.80 15.10 16.99 40.49 40.97 A2 0.77 20.60 32.38 A2 0.91 16.28 34.00 A2 0.75 19.94 39.06 A2 0.74 17.56 42.68 A2 0.74 0.78 16.78 18.23 30.68 35.76 B1* 0.76 16.77 28.65 B1* 0.93 14.84 39.91 B1* 0.85 16.47 36.70 B1* 0.77 19.95 47.18 B1* 0.78 0.82 15.60 16.73 40.63 38.61 B2* 0.63 20.67 31.29 B2* 0.79 19.38 28.46 B2* 0.68 18.49 37.54 B2* 0.73 15.69 34.84 B2* 0.73 0.71 16.13 18.07 50.65 36.56 C1* 0.85 19.02 25.34 C1* 0.65 25.81 35.9 C1* 0.87 18.35 24.3 C1* 0.76 0.78 19.20 20.59 28.50 C2* 0.74 21.56 29.5 C2* 0.85 17.85 22.5 C2* 0.85 17.85 34.96 C2* 0.75 18.88 24.03 C2* 0.79 20.73 22.56 C2* 0.78 18.88 29.18 C2* 0.79 0.79 18.13 19.13 25.97 26.97
Caroline P. Baron 02/2009

Yellow Haddock
- 13 -
Analysis of the fillets after 5 months of storage at -20°C. With A immediately processed, B processed after 5 hours on ice and C processed after 5 hours on deck. With 1 for properly bled fish and 2 non-bled fish. * indicate that the fish was into rigor before freezing.
Fillets 5 Months -20 °C
Fat% FFA % PLA L a* b A1 0.72 44.68 49.59 58.22 -0.57 2.82 A1 0.54 50.07 38.71 57.34 -0.9 3.09 A1 0.57 47.43 47.53 55.83 -0.85 2.91 A1 0.58 45.89 46.00 58.34 -0.2 2.99
Mean 0.60 47.02 45.46 57.43 -0.63 2.95 A2 0.69 41.85 52.37 58.47 -0.86 2.91 A2 0.80 35.94 74.09 58.56 -0.43 1.51 A2 0.57 59.08 71.94 58.56 -0.41 2.52 A2 0.48 52.43 40.88 55.88 -0.54 3.26 A2 0.65 40.64 45.05 57.66 -0.57 3.39
Mean 0.64 45.99 56.87 57.83 -0.56 2.72 B1 0.76 35.53 64.53 59.23 0.24 4.57 B1 0.55 42.14 70.32 56.41 -0.93 1.52 B1 0.53 59.80 58.64 57.1 -0.91 2.17 B1 0.82 34.00 52.16 60.54 -0.23 3.66 B1 0.53 51.94 36.98 58.22 -0.91 2.46
Mean 0.64 44.68 56.52 58.30 -0.55 2.88 B2 0.70 42.58 63.21 59.58 -1.35 1.66 B2 0.61 40.37 90.11 57.95 -0.6 2.8 B2 0.55 51.62 53.88 58.01 -0.87 1.78 B2 0.59 42.56 55.83 57.3 -0.55 1.27 B2 0.57 43.63 75.28 59.34 -0.51 2.34
Mean 0.61 44.15 67.66 58.44 -0.78 1.97 C1 0.68 47.63 55.73 61.34 -0.21 4.44 C1 0.79 37.11 50.65 60.23 -1.06 2.9 C1 0.65 50.42 67.26 58.89 -0.05 2.97 C1 0.58 48.42 64.00 58.53 -0.67 2.51
Mean 0.68 45.90 63.43 59.46 -0.55 2.86 C2 0.73 38.85 52.36 60.99 -0.28 4.14 C2 0.70 40.63 54.92 60.61 -0.53 2.5 C2 0.57 54.02 60.83 58.79 -0.83 3.09 C2 0.60 52.81 56.23 57.31 -0.58 3.28 C2 0.60 44.30 53.97 56.73 -1.1 0.92 C2 0.55 51.31 52.35 59.47 -1.08 2.14
Mean 0.63 46.99 55.11 58.98 -0.73 2.68
Caroline P. Baron 02/2009
Yellow Haddock
- 14 -
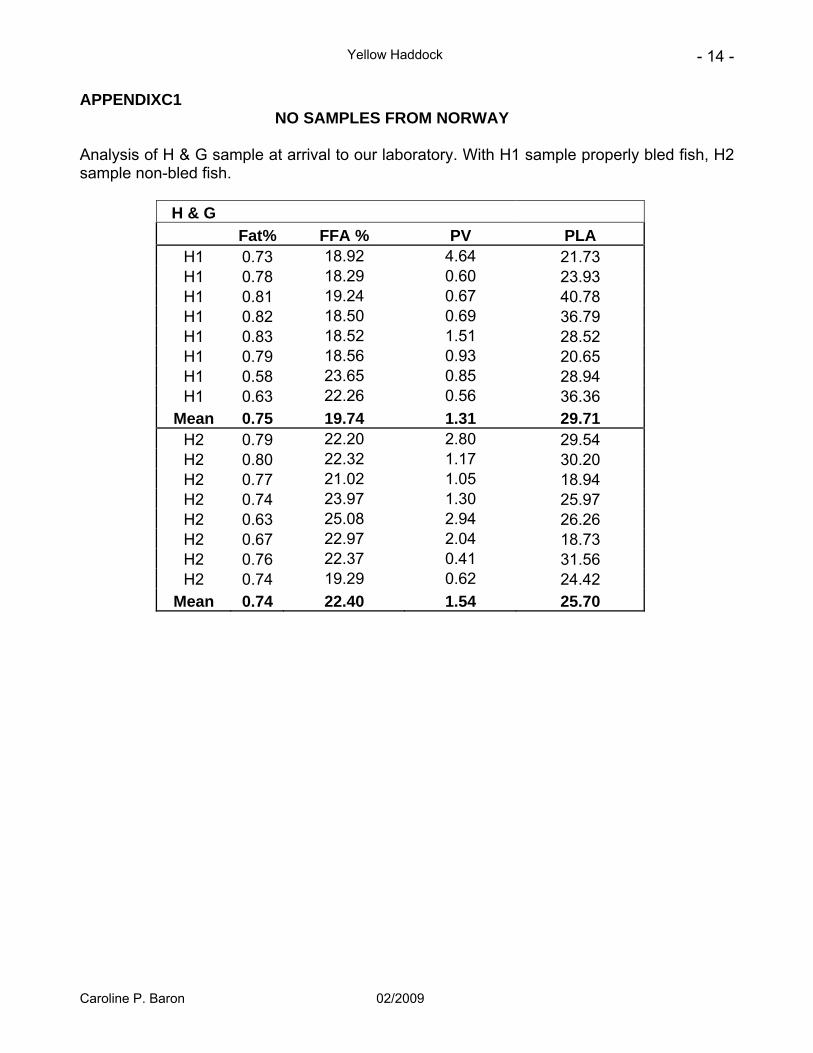
APPENDIXC1 NO SAMPLES FROM NORWAY Analysis of H & G sample at arrival to our laboratory. With H1 sample properly bled fish, H2 sample non-bled fish.
H & G
Fat% FFA % PV PLA H1 0.73 18.92 4.64 21.73 H1 0.78 18.29 0.60 23.93 H1 0.81 19.24 0.67 40.78 H1 0.82 18.50 0.69 36.79 H1 0.83 18.52 1.51 28.52 H1 0.79 18.56 0.93 20.65 H1 0.58 23.65 0.85 28.94 H1 0.63 22.26 0.56 36.36
Mean 0.75 19.74 1.31 29.71 H2 0.79 22.20 2.80 29.54 H2 0.80 22.32 1.17 30.20 H2 0.77 21.02 1.05 18.94 H2 0.74 23.97 1.30 25.97 H2 0.63 25.08 2.94 26.26 H2 0.67 22.97 2.04 18.73 H2 0.76 22.37 0.41 31.56 H2 0.74 19.29 0.62 24.42
Mean 0.74 22.40 1.54 25.70
Caroline P. Baron 02/2009
Yellow Haddock
- 15 -
Analysis of fillets after 5 months of storage at -20 °C. With H1 sample properly bled fish, H2 sample non-bled fish.
Fillets 5 Months -20 °C Fat% FFA % PV PLA L a* b*
H1 0.64 35.23 - 59.39 58.58 -0.64 2.39 H1 0.70 36.66 - 75.97 61.72 -1.37 1.17 H1 0.79 38.94 - 38.02 58.85 -1.31 0.69 H1 0.73 38.98 - 81.76 58.76 -0.77 1.23
Mean 0.72 37.45 63.79 59.48 -1.02 1.37 H2 0.69 43.61 - 56.55 58.89 -0.05 2.97 H2 0.73 46.23 - 66.59 60.78 -0.63 3.5 H2 0.68 44.27 - 73.93 59.69 -0.3 3.93 H2 0.68 48.61 - 94.95 61.42 -0.08 2.91
Mean 0.70 45.68 73.00 60.20 -0.27 3.33 Analysis of fillets after 5 months of storage at -10 °C. With H1 sample properly bled fish, H2 sample non-bled fish.
Fillets 5 Months -10 °C
Fat% FFA % PV PLA L a* b* H1 0.64 67.80 2.48 69.86 63.9 -1.71 1.99 H1 0.63 65.33 2.76 43.42 62.07 -1.36 2.59 H1 0.54 68.50 3.89 35.34 63.02 -1.3 4.2 H1 0.53 64.25 1.81 30.24 61.67 -1.27 4.06
Mean 0.59 66.47 2.73 44.71 62.67 -1.41 3.21 H2 0.54 70.59 2.11 63.10 61.99 -1.45 3.82 H2 0.55 71.52 1.51 32.40 61.31 -1.38 3.18 H2 0.69 70.10 1.49 45.71 63.45 -0.96 4.08 H2 0.66 63.60 1.77 38.74 62.47 -1.1 3.49
Mean 0.61 68.95 1.72 44.99 62.31 -1.22 3.64
Caroline P. Baron 02/2009
Yellow Haddock
- 16 -
Analysis of H & G sample after 5 months of storage at -10 °C/-20°C fluctuating temperature (1 week at -10 °C 4 weeks at -20 ↑8C) or at constant temperature -20 °C. With H1 sample properly bled, H2 sample non-bled.
H & G 5 Months -10 °C/-20°C fluctuating Fat% FFA % PV PLA L a* b*
H1 0.60 62.77 1.26 67.57 64.78 -0.066 1.79 H1 0.58 66.67 0.80 85.67 63.79 -0.09 2 H1 0.54 64.89 0.51 78.21 64.97 -0.4 2.8 H1 0.60 64.01 0.67 78.37 63.42 -0.75 0.55 H1 0.59 62.84 1.02 94.55 64.08 -0.55 1.36 H1 0.61 65.49 1.25 73.30 62.71 -0.5 0.98
Mean 0.58 64.45 0.92 79.61 63.96 -0.39 1.58 H2 0.57 63.82 0.66 118.04 61.23 -0.23 1.89 H2 0.58 61.64 0.65 51.20 63.48 -0.84 2.95 H2 0.54 71.58 0.54 88.43 62.01 -0.78 1.79 H2 0.64 61.89 0.22 82.45 59.51 0.01 2.24 H2 0.63 61.12 0.30 83.56 61.15 -1.16 1.01 H2 0.58 69.59 0.52 86.69 61.5 0.04 2.65
Mean 0.59 64.94 0.48 85.06 61.48 -0.49 2.09 H & G 5 Months -20°C constant
Fat% FFA % PV PLA L a* b* H1 0.55 39.73 0.65 57.70 62.39 -0.65 2.53 H1 0.59 35.87 0.44 53.58 60.28 -0.4 1.94 H1 0.60 44.64 0.24 61.93 58.51 -0.83 0.61 H1 0.57 39.64 0.32 52.09 60.44 -0.34 2.14 H1 0.57 43.61 0.47 65.74 57.26 -0.33 1.65 H 1 0.57 42.94 0.63 63.28 53.65 1.75 4.11
Mean 0.58 41.07 0.46 59.06 58.76 -0.13 2.16 H2 0.50 49.40 0.32 42.67 58.42 -0.27 1.8 H2 0.59 47.18 1.10 54.55 62.12 0.11 3.47 H2 0.70 39.89 0.32 55.63 60.56 -0.18 3.06 H2 0.68 37.10 0.42 43.41 61.71 -0.76 1.63 H2 0.66 39.40 0.12 59.26 60.1 -0.78 2.18 H2 0.63 36.91 0.14 35.55 58.75 0.52 1.71
Mean 0.65 40.10 0.42 49.68 60.65 -0.22 2.41
Caroline P. Baron 02/2009

Yellow Haddock
- 17 -
APPENDIX D1 NO SAMPLES FROM NORWAY
Analysis of fillets with 201 small fish not spawning, 202 fish feeding on herring roe, and 203 large fish spawning.
Fillets
Fat% FFA % PV PLA 201 0.75 16.03 2.70 70.82 201 0.65 16.54 5.90 71.47 201 0.69 15.47 4.17
Mean 0.70 16.01 4.25 71.14 202 0.68 18.44 2.54 52.48 202 0.79 14.97 0.17 51.03 202 0.70 16.00 -1.19
Mean 0.72 16.47 0.51 51.75 203 0.69 15.52 2.31 57.56 203 0.71 17.19 4.35 65.30 203 0.68 17.44 -0.75
Mean 0.69 16.72 1.97 61.43 R1 0.81 47.52 2.27 23.54 Herring Roe 6.00 5.37 0.92
Analysis of fillets after 9 months of storage at -20 C with 201 small fish not spawning, 202 fish feeding on herring roe, and 203 large fish spawning. Fillets 9 Months at -20 °C
Fat% FFA % PLA L a* b* 201 0.59 38.97 82.17 58.37 -1.19 2.8 201 0.68 38.09 49.54 58.95 -1.13 2.35
Mean 0.63 38.53 65.85 58.66 -1.16 2.58 202 0.70 38.69 138.13 61.3 -1.01 4.61 202 0.61 37.11 49.78 59.28 -1.45 3.04
Mean 0.65 37.90 93.95 60.29 -1.23 3.83 203 0.63 43.69 87.02 62.09 -0.04 4.27 203 0.66 40.46 55.80 61.68 -0.59 5.4
Mean 0.64 42.07 71.41 61.89 -0.32 4.84
Caroline P. Baron 02/2009

Yellow Haddock
- 18 -
Effect of multiple thawing/freezing cycles given in brackets on fillets subsequently stored for 5 months at -20°C
Fillets Thawing/Freezing Cycle (in bracket) and -20 °C 5 Months storage Fat% FFA % PV L a* b* 201(1) 0.79 33.48 2.42 58.1 -1.84 2.85201(2) 0.76 28.76 2.46 58.9 -0.75 4.47201(3) 0.72 35.17 1.73 57.7 -1.57 1.8 202(1) 0.70 31.05 3.08 60.3 -1.31 2.68202(2) 0.77 37.73 2.62 63.8 -1.53 4.25202(3) 0.77 38.02 4.43 62.2 -1.35 2.93 203(1) 0.79 29.92 0.89 58.8 0.66 5.66203(2) 0.86 30.57 1.59 61.3 1.49 7.44203(3) 0.82 34.05 3.36 59.9 0.5 7.32
Caroline P. Baron 02/2009
Yellow Haddock
- 19 -
Spiking of mince 201, 202 or 203 with commercial PLA with 26 units or 132 units and subsequent storage of the mince for 0, 1, or 8 days at 4 °C or frozen for a week at -20 °C.
Mince Spiking 201 Days Fat% FFA % PV L a* b* No PLA 1 0.68 17.37 2.86 51.1 -0.64 1.76 8 0.70 30.70 0.57 49.0 -1.4 0.98 PLA 26U 1 0.68 21.36 1.26 52.5 -0.37 3.07 8 0.69 37.66 0.53 50.8 -1.49 1.18 PLA 132 U 1 0.65 26.95 1.18 52.0 -0.39 2 8 0.64 44.38 0.45 50.5 -1.38 0.91 Mince Spiking 202 days Fat% FFA % PV L a* b* No PLA 1 0.67 19.80 3.34 52.8 -0.62 2.02 8 0.63 52.99 0.67 57.0 -1.61 1.58PLA 26U 1 0.68 23.79 3.80 55.3 -0.5 3.25 8 0.63 54.19 1.48 55.9 -2.18 2.09PLA 132 U 1 0.67 27.20 2.54 54.0 -0.72 2.2 8 0.65 57.00 1.66 54.9 -2.12 0.4Mince Spiking 203 days
Fat% FFA % PV L a* b* No PLA 0 0.67 14.91 1.56 47.2 -0.78 -0.17
1 0.68 20.15 2.26 50.4 -0.59 0.88 8 0.60 44.48 0.89 52.3 -1.78 1.97 8* 0.70 17.70 1.30 46.9 -0.28 1.25 PLA 26U 0 0.70 16.49 1.73 49.7 -0.75 0.41 1 0.64 22.36 1.16 50.5 -0.58 0.39 8 0.57 45.37 2.55 53.9 -1.34 1.42 8* 0.66 20.94 1.36 47.3 -0.79 0.59 PLA 132 U 0 0.67 19.07 1.79 56.5 -0.29 3.44 1 0.59 29.93 1.71 54.7 -0.62 2.61 8 0.57 59.04 0.85 54.8 -2.07 3.28 8* 0.69 23.52 1.54 55.9 -0.42 3.63* frozen storage 8 days -20 °C
Caroline P. Baron 02/2009

Yellow Haddock
- 20 -
Fatty acid profile of the phospholipid fraction of sample 201, 202, 203 as well as from our reference sample R1 and of herring roe.
Phospholipid fatty acids profile (in % of total fatty acids)
16;0
18;0
18:1 (n-9)
18:1 (n-7)
20:4 (n-6)
20:5 (n-3)
22:5 (n-3)
22:6 (n-3)
201 19.06
1.67
6.20
2.73
2.75
15.90
1.08
42.12
202 17.51
1.71
5.45
1.60
3.36
14.58
1.14
43.66
203 18.49
1.72
5.72
3.41
3.23
22.50
1.23
34.37
R1 12.47
2.37
7.78
2.55
2.42
15.15
2.23
41.49
Herring Roe
19.17
1.25
4.23
3.49
0.39
12.68
1.43
39.72
Caroline P. Baron 02/2009
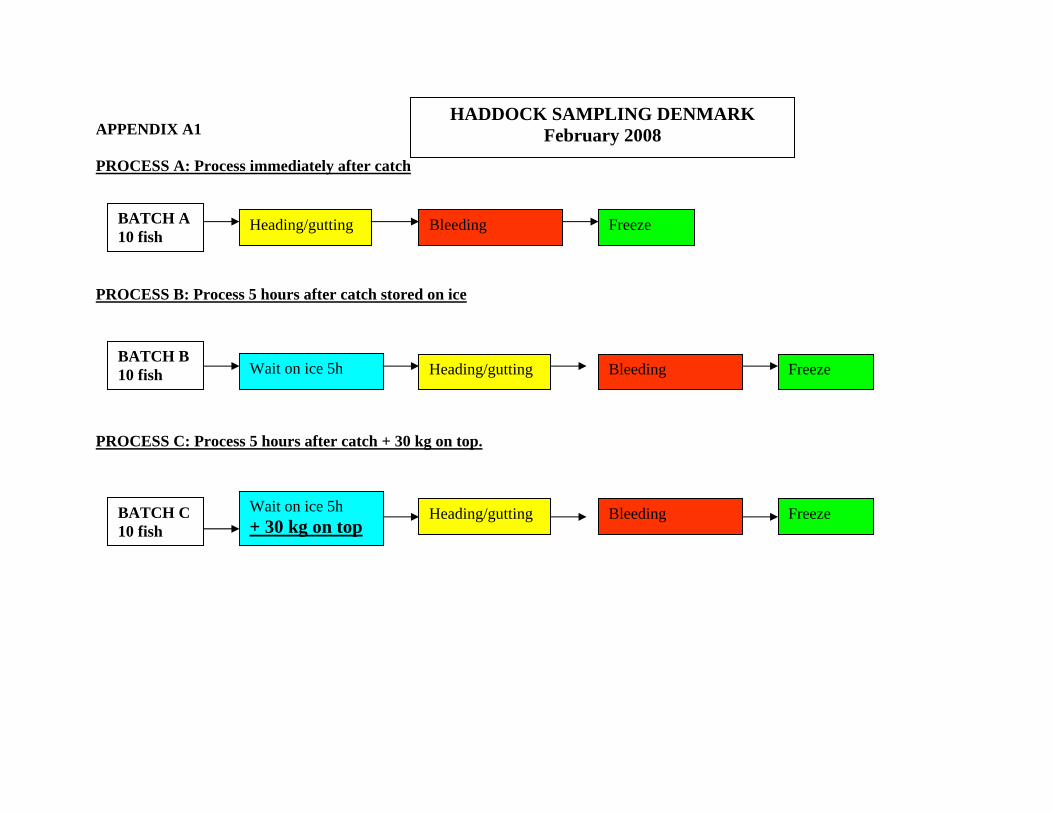
APPENDIX A1
PROCESS A: Process immediately after catch
HADDOCK SAMPLING DENMARK February 2008
Freeze Bleeding Heading/gutting BATCH A 10 fish
PROCESS B: Process 5 hours after catch stored on ice
Heading/gutting Wait on ice 5h BATCH B 10 fish Freeze Bleeding
PROCESS C: Process 5 hours after catch + 30 kg on top.
Wait on ice 5h + 30 kg on top
Heading/gutting BATCH C 10 fish
Freeze Bleeding

HADDOCK SAMPLING DENMARK June 2008
APPENDIX B1 PROCESS A: Process immediately after catch (1): NORMAL PROCESS: CODE A1 (2) BLEEDING/WASHING STEP IS NOT DONE : CODE A2
Freeze 6 Fish A1
Bleeding/Washing
(2)
(1)
Freeze 6 Fish A2
Heading/gutting BATCH A 12 fish
PROCESS B: Process 5 hours after catch stored on ice (1): NORMAL PROCESS: CODE B1 (2) BLEEDING/WASHING STEP IS NOT DONE : CODE B2
PROCESS C: Process 5 hours after catch stored at deck temperature, no ice. (1): NORMAL PROCESS: CODE C1 (2) BLEEDING/WASHING STEP IS NOT DONE : CODE C2
BATCH B 12 fish
Wait on ice 5h Heading/gutting
Bleeding/Washing Freeze 6 Fish B1
Freeze 6 Fish B2
(1)
(2)
(1)
Freeze 6 Fish C1
Bleeding/Washing
(2) Freeze 6 Fish C2
Heading/gutting Wait at deck temp 5h (NO ICE)
BATCH C 12 fish
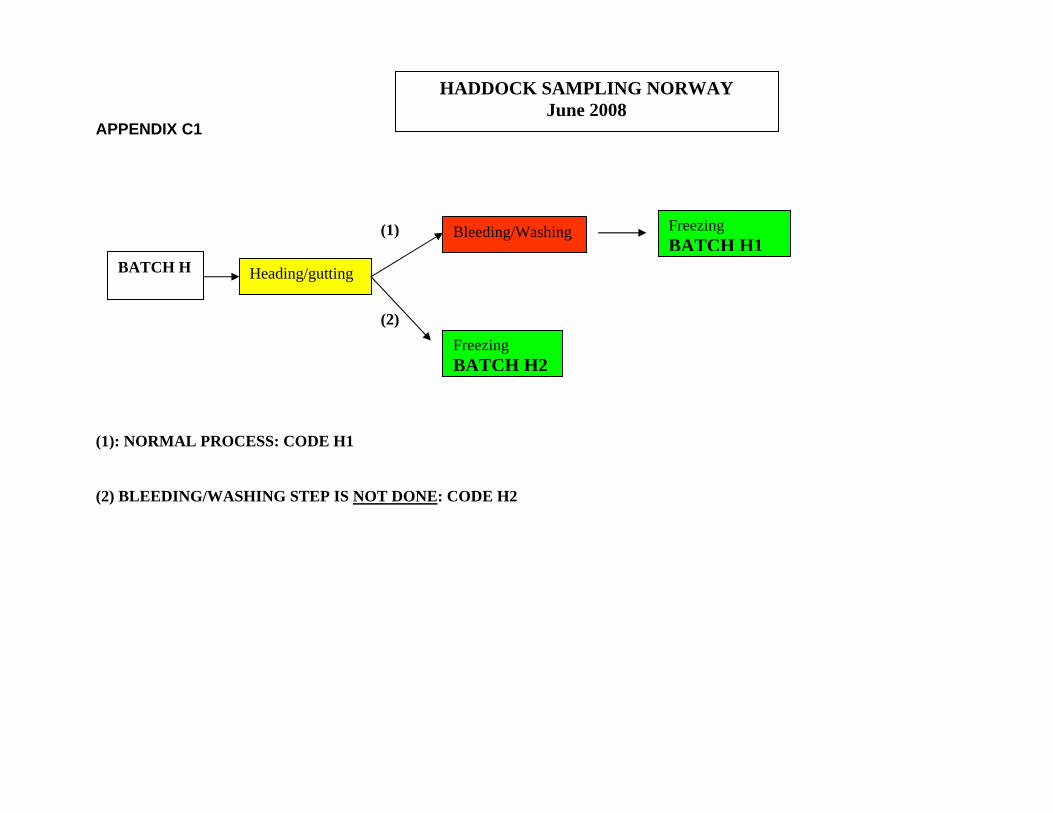
HADDOCK SAMPLING NORWAY June 2008
APPENDIX C1
Freezing BATCH H1
Bleeding/Washing
(2)
(1)
Freezing BATCH H2
Heading/gutting BATCH H
(1): NORMAL PROCESS: CODE H1
(2) BLEEDING/WASHING STEP IS NOT DONE: CODE H2
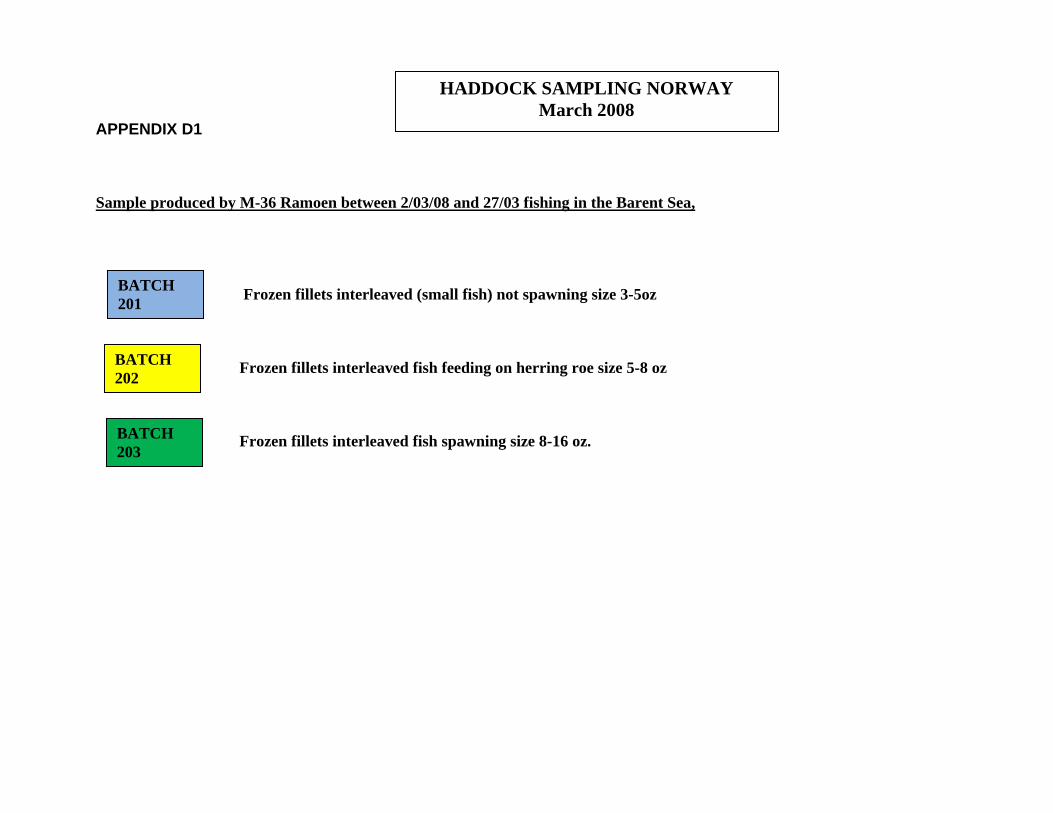
HADDOCK SAMPLING NORWAY March 2008
APPENDIX D1 Sample produced by M-36 Ramoen between 2/03/08 and 27/03 fishing in the Barent Sea,
Frozen fillets interleaved (small fish) not spawning size 3-5oz BATCH
201
Frozen fillets interleaved fish feeding on herring roe size 5-8 oz
BATCH 202
Frozen fillets interleaved fish spawning size 8-16 oz. BATCH
203

APPENDIX DK Data for Fishing trip in Denmark February 2008
Year 2008Boat L-757 Station 7
Day 14-02-
2008ICES SQ 44F5 Start time 06:15End time 08:35Fishing time 2,33Bottom Grus t 57m/s 51,95bredde start (dec deg) 57,866t 57m/s 57,15bredde slut (dec deg) 57,953t 5m/s 20,15lgd. Start (dec deg) 5,336t 5m/s 9,9lgd. Slut (dec deg) 5,165Mean Deepth 125Wind m/s 3retning (fra) Skiftende strøm 0,2retning mod V Water temp 7,257Air Temp 6Gear Trawl Total catch pr. trawl (kg) ca. 300
Data for Fishing trip in Denmark June 2008 Not recovered yet.