effects of soil ± structure interaction on longitudinal seismic response of msss bridges
DESCRIPTION
This paper presents the results of a comprehensive study on the effects of soil±structure interaction on longitudinal seismic response ofexisting bridges. FHWA's guidelines for footing foundation on semi-in®nite elastic half-space are used to determine translational androtational stiffnesses at the base of bridge abutments and piers. Similarly, stiffness and strength of abutment back®ll soil are determined basedon FHWA's procedures. Various stiffnesses at the abutments are then lumped (condensed) into one translational spring at the point of impactbetween the abutment and the deck. Translational springs at the abutments are bilinear with their yield strength in compression determinedbased on Mononobe±Okabe method. In tension it is equal to the friction force at the footing. Among the parameters considered is the case ofdamaged back wall, where it is assumed that due to shear failure at the juncture of the back wall and breast wall the abutment strength andstiffness, as well as mobilized abutment mass, have changed. Results indicate that soil±structure interaction (SSI) has a signi®cant effect onthe seismic response in the longitudinal direction. Abutment strength is the most critical parameter. Impact force, deck sliding, and SSIaffects all plastic rotations at the base of columns. Thus, it is important that analytical models used in seismic evaluation of bridge systemsexplicitly consider SSI. q 2000 Elsevier Science Ltd. All rights reservedTRANSCRIPT

Effects of soil±structure interaction on longitudinal seismic response ofMSSS bridges
M.A. Saadeghvaziri*, A.R. Yazdani-Motlagh, S. Rashidi
Department of Civil and Environmental Engineering, New Jersey Institute of Technology, University Heights, Newark, NJ 07102-1982, USA
Abstract
This paper presents the results of a comprehensive study on the effects of soil±structure interaction on longitudinal seismic response of
existing bridges. FHWA's guidelines for footing foundation on semi-in®nite elastic half-space are used to determine translational and
rotational stiffnesses at the base of bridge abutments and piers. Similarly, stiffness and strength of abutment back®ll soil are determined based
on FHWA's procedures. Various stiffnesses at the abutments are then lumped (condensed) into one translational spring at the point of impact
between the abutment and the deck. Translational springs at the abutments are bilinear with their yield strength in compression determined
based on Mononobe±Okabe method. In tension it is equal to the friction force at the footing. Among the parameters considered is the case of
damaged back wall, where it is assumed that due to shear failure at the juncture of the back wall and breast wall the abutment strength and
stiffness, as well as mobilized abutment mass, have changed. Results indicate that soil±structure interaction (SSI) has a signi®cant effect on
the seismic response in the longitudinal direction. Abutment strength is the most critical parameter. Impact force, deck sliding, and SSI
affects all plastic rotations at the base of columns. Thus, it is important that analytical models used in seismic evaluation of bridge systems
explicitly consider SSI. q 2000 Elsevier Science Ltd. All rights reserved.
Keywords: Soil±structure interaction; Abutment; Seismic response of bridges; Longitudinal direction; Impact; Multi-span simply supported bridges
1. Introduction
The Northridge Earthquake of January 17, 1994 and the
Loma Prieta Earthquake of October 17, 1989, led to an
increased awareness concerning the response of highway
bridges subjected to earthquake ground motions. In 1991,
the Interim AASHTO Standard Speci®cations for Highway
Bridges [1] adopted the 1988 National Earthquake Hazard
Reduction Program (NEHRP) Horizontal Acceleration
maps. Under NEHRP maps many areas on the East Coast
of the US, including New Jersey, were placed into higher
seismic risk categories. For example the acceleration
coef®cient, A, for northern New Jersey has been increased
from 0.1 to 0.18. In response to this and FHWA's mandates,
the New Jersey Department of Transportation (NJDOT)
initiated its Seismic Retro®t Program [2] using FHWA's
Seismic Retro®tting Manual for Highway Bridges [3].
Furthermore, NJDOT uses the AASHTO's Seismic Design
Guidelines in the design of new bridges. General issues
related to seismic design and retro®t of bridges have been
reported elsewhere [4]. The main objective of this paper is
to present the results of three case studies of the effects of
soil±structure interaction (SSI) on the longitudinal seismic
response of bridges in New Jersey.
Most bridges in New Jersey are Multi-Span Simply
Supported (MSSS) slab on girder where under earthquake
ground motions there is a high possibility of impact between
adjacent spans and between the end-span and the abutment.
Impact forces due to longitudinal earthquake ground motion
can be large enough to cause damage to the steel bearings
and abutment back walls. Girder seat length is another
important and critical parameter. Proper estimate of the
capacity±demand ratio for seat length at various locations
requires accurate consideration of the SSI. Generally, the
longitudinal bridge displacement is restraint by the abut-
ments. However, should there be additional movements at
the abutments the integrity of the entire bridge system can
be compromised. Movements at the abutments may be due
to elastic deformation and/or inelastic deformation (as a
result of yielding in the soil). Therefore, essential to
accurate estimate of capacity±demand ratios for seat
lengths, is consideration to abutment±soil system (capacity
and stiffness).
The importance of including the ¯exibility and strength of
supports at the abutments and piers in dynamic analysis of
highway bridges is well recognized by various agencies such
AASHTO [1] and CALTRANS (California Department of
Soil Dynamics and Earthquake Engineering 20 (2000) 231±242
0267-7261/00/$ - see front matter q 2000 Elsevier Science Ltd. All rights reserved.
PII: S0267-7261(00)00056-7
www.elsevier.com/locate/soildyn
* Corresponding author. Tel.: 11-973-596-5817; fax: 11-973-596-5970.
E-mail address: [email protected] (M.A. Saadeghvaziri).

Transportation) [5]. In design of new bridges using these
speci®cations, either an iterative process is used to estimate
the stiffness (or) and displacement at the abutments or
simpli®ed rules are employed to determine the stiffness
and strength of the boundary springs. Such procedures are
simpli®ed overly and do not consider the properties of soil
and all physical dimension of the substructure. In a study
conducted on the US 101/Painter Street Overpass [6] the
ªactualº abutment capacity and stiffness determined from
analyses of earthquake records were compared to ªdesignº
values provided by CALTRANS and AASHTO. It is
reported that the actual strength and stiffness values are
affected by SSI and are time variant, ªdecreasing signi®-
cantly as the abutment deformation increases.º It is
concluded that the CALTRANS procedure results in good
estimate of the stiffness and capacity of the abutment in the
transverse direction. However, in the longitudinal direction
the CALTRANS procedure overestimates the capacity and
stiffness by a factor of two. This indicates that the assumed
ultimate passive capacity of 368.7 kPa by CALTRANS may
be too high. It was also concluded that the AASHTO-83/
ATC-6 procedure results in large estimate of the abutment
stiffness in both directions. Other researchers have also
conducted extensive investigations on determining the
stiffness and strength of boundary springs to represent the
abutments in an analytical model used in time history analy-
sis. Such studies are based on the scienti®c knowledge of the
properties of soil and more detailed consideration of the
geometrical properties of the abutment. Among these
studies are works by Siddharthan, El-Gamal and Maragakis
[7] and Wilson and Tan [8]. In this study, the procedures
given by FHWA's Seismic Design of Highway Bridge Foun-
dations [9] are used to determine the parameters of the
boundary springs at the abutments and at the base of column
piers. This phase of the study is concentrated on the seismic
response of MSSS bridges under the longitudinal compo-
nent of ground motion. It is expected that the SSI is the most
critical factor for this direction where excessive deformation
can cause bridge failure in the form of span fall off. An
important aspect of SSI is foundation damping, which is a
complex problem. Radiation damping associated with wave
propagation between masses of the superstructure and foun-
dation-soil is one form of energy dissipation due to SSI.
Material nonlinearity in the foundation soil is another
form of damping. In this study the later form of energy
dissipation is explicitly modeled, while the radiation damp-
ing is accounted for implicitly through equivalent viscous
damping. In Section 2 the details of the analytical models
employed are described.
2. Analytical model
The three bridges considered (with 2, 3 and 4 spans) are
typical of bridges in New Jersey and more generally in the
Eastern United States. All the three bridges are MSSS slab-
on-girder decks with steel bearings, ®xed or expansion,
between the superstructure and substructures. Typical gap
between either adjacent spans or end-span and abutment
back wall is in the order of 25±76 mm. Multiple columns
are used at the internal pier bents. Columns are circular in
cross-section with varying lateral reinforcement (#3 hoops
at 305 mm to #4 spirals at 57 mm). In all of the three
bridges, footings support the abutments and the columns.
Abutments are seat-type, and an approach slab of varying
depth is used behind each abutment. A transition slab is then
placed between the approach slab and the roadway. The
abutment back®ll and foundation soils are considered
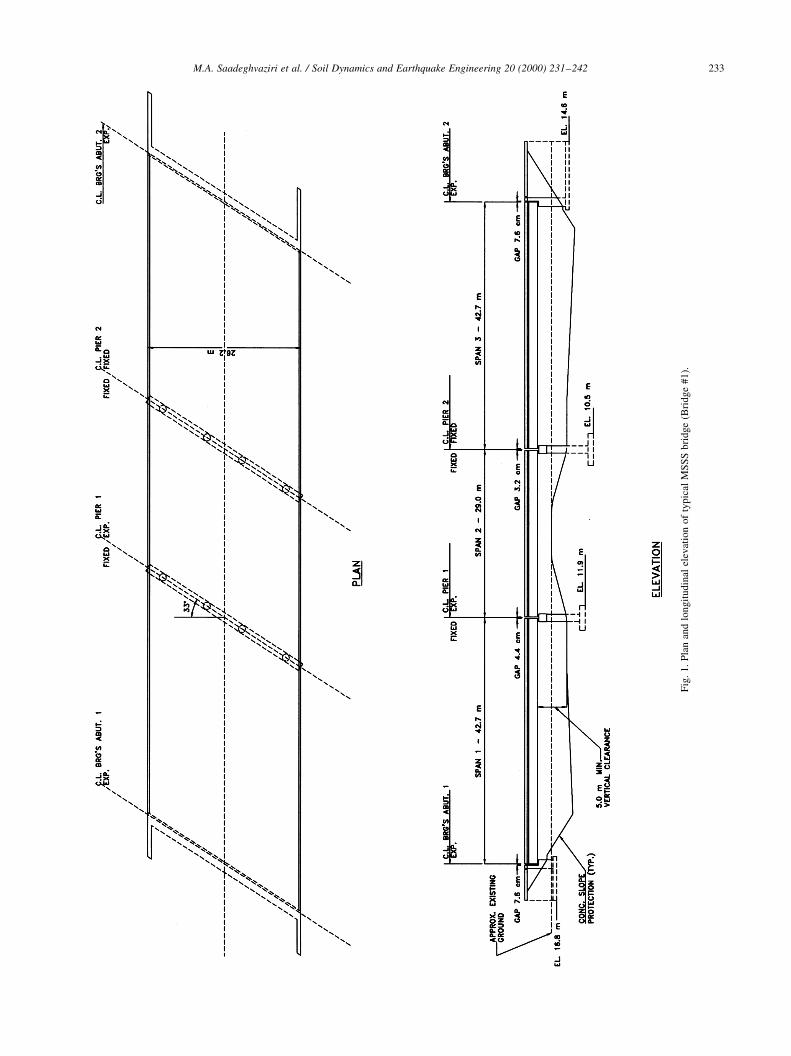
cohesionless. Typical plan and longitudinal elevation of
an MSSS bridge (Bridge #1) are shown in Fig. 1.
2.1. Footing and abutment wall stiffnesses
FHWA's procedure [9] for rigid footing foundation on
semi-in®nite elastic half-space is used to determine transla-
tional and rotational stiffnesses for abutment and pier
foundations. The procedure considers all six degrees of
freedom, resulting in a 6 £ 6-stiffness matrix. Due to
space limitation the details of the procedure and its imple-
mentation for the bridges considered would not be discussed
here and the reader is referred to [9±10]. The relevant foot-
ing stiffnesses for a typical abutment in the longitudinal
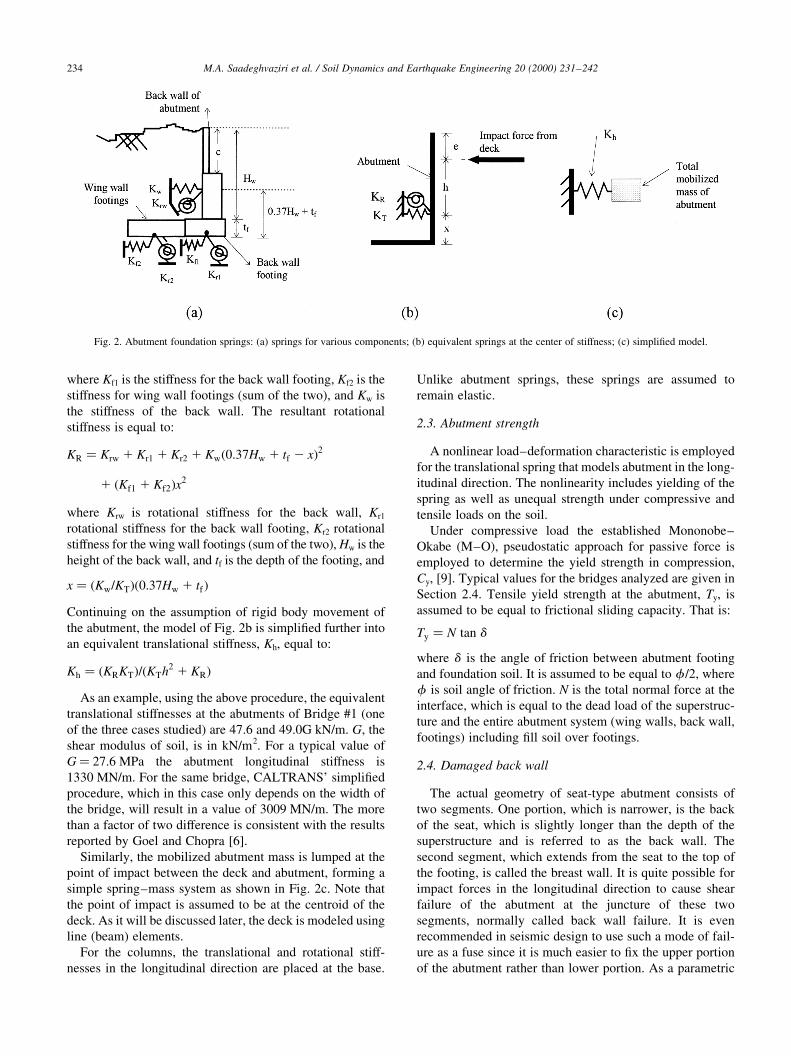
direction are shown in Fig. 2a. In the determination of the
stiffness of the abutment wall-back®ll system, the FHWA's
procedure considers the nature of pressure/displacement
distribution when the wall is displaced (pushed) into the
back®ll by longitudinal seismic forces from the bridge
deck [9]. This is achieved by employing the appropriate
pressure diagrams/pro®les for translational and rotational
mode of displacement. The resultant stiffnesses for long-
itudinal translational and rotational (tilting) modes of the
abutment wall are also shown in Fig. 2a. They are located
at 0.37 of the height of the wall from the base.
2.2. Equivalent foundation spring
Shown in Fig. 2 are also the schematic diagrams of resul-
tant foundation springs at an abutment as well as the ®nal
simpli®ed model or equivalent abutment foundation spring.
In arriving at the ®nal simple model, it is assumed that the
abutment deforms as a rigid body and translational stiffness
of the system at the location of impact between the abutment
and the bridge deck is determined. It should be noted that
the experimental investigation [11] has shown that the abut-
ment movement is indeed a rigid body movement.
As shown in Fig. 2b, the rotational and translational stiff-
ness springs from various footings and back wall are moved
to the center of stiffness located at a height x above the base
of the footing. The resultant translational stiffness is simply
equal to the algebraic sum of all translational stiffnesses,
that is:
KT � Kf1 1 Kf2 1 Kw
M.A. Saadeghvaziri et al. / Soil Dynamics and Earthquake Engineering 20 (2000) 231±242232
M.A. Saadeghvaziri et al. / Soil Dynamics and Earthquake Engineering 20 (2000) 231±242 233
Fig
.1.
Pla
nan
dlo
ngit
udin
alel
evat
ion
of
typic
alM
SS
Sbri
dge
(Bri
dge
#1).
where Kf1 is the stiffness for the back wall footing, Kf2 is the
stiffness for wing wall footings (sum of the two), and Kw is
the stiffness of the back wall. The resultant rotational
stiffness is equal to:
KR � Krw 1 Kr1 1 Kr2 1 Kw�0:37Hw 1 tf 2 x�2
1 �Kf1 1 Kf2�x2
where Krw is rotational stiffness for the back wall, Kr1
rotational stiffness for the back wall footing, Kr2 rotational
stiffness for the wing wall footings (sum of the two), Hw is the
height of the back wall, and tf is the depth of the footing, and
x � �Kw=KT��0:37Hw 1 tf�Continuing on the assumption of rigid body movement of
the abutment, the model of Fig. 2b is simpli®ed further into
an equivalent translational stiffness, Kh, equal to:
Kh � �KRKT�=�KTh2 1 KR�As an example, using the above procedure, the equivalent
translational stiffnesses at the abutments of Bridge #1 (one
of the three cases studied) are 47.6 and 49.0G kN/m. G, the
shear modulus of soil, is in kN/m2. For a typical value of
G� 27.6 MPa the abutment longitudinal stiffness is
1330 MN/m. For the same bridge, CALTRANS' simpli®ed
procedure, which in this case only depends on the width of
the bridge, will result in a value of 3009 MN/m. The more
than a factor of two difference is consistent with the results
reported by Goel and Chopra [6].
Similarly, the mobilized abutment mass is lumped at the
point of impact between the deck and abutment, forming a
simple spring±mass system as shown in Fig. 2c. Note that
the point of impact is assumed to be at the centroid of the
deck. As it will be discussed later, the deck is modeled using
line (beam) elements.
For the columns, the translational and rotational stiff-
nesses in the longitudinal direction are placed at the base.
Unlike abutment springs, these springs are assumed to
remain elastic.
2.3. Abutment strength
A nonlinear load±deformation characteristic is employed
for the translational spring that models abutment in the long-
itudinal direction. The nonlinearity includes yielding of the
spring as well as unequal strength under compressive and
tensile loads on the soil.
Under compressive load the established Mononobe±
Okabe (M±O), pseudostatic approach for passive force is
employed to determine the yield strength in compression,
Cy, [9]. Typical values for the bridges analyzed are given in
Section 2.4. Tensile yield strength at the abutment, Ty, is
assumed to be equal to frictional sliding capacity. That is:
Ty � N tan d
where d is the angle of friction between abutment footing
and foundation soil. It is assumed to be equal to f /2, where
f is soil angle of friction. N is the total normal force at the
interface, which is equal to the dead load of the superstruc-
ture and the entire abutment system (wing walls, back wall,
footings) including ®ll soil over footings.
2.4. Damaged back wall
The actual geometry of seat-type abutment consists of
two segments. One portion, which is narrower, is the back
of the seat, which is slightly longer than the depth of the
superstructure and is referred to as the back wall. The
second segment, which extends from the seat to the top of
the footing, is called the breast wall. It is quite possible for
impact forces in the longitudinal direction to cause shear
failure of the abutment at the juncture of these two
segments, normally called back wall failure. It is even
recommended in seismic design to use such a mode of fail-
ure as a fuse since it is much easier to ®x the upper portion
of the abutment rather than lower portion. As a parametric
M.A. Saadeghvaziri et al. / Soil Dynamics and Earthquake Engineering 20 (2000) 231±242234
Fig. 2. Abutment foundation springs: (a) springs for various components; (b) equivalent springs at the center of stiffness; (c) simpli®ed model.

study in this investigation special attention is devoted to
such highly possible mode of failure. For this purpose, the
stiffness of the abutment in the longitudinal direction is
determined based on mobilizing only the soil height equal
to the depth of the superstructure. Two different load trans-
fer mechanisms control the capacity of the section at the
juncture of the back wall and breast wall, namely: (i) shear
resistance provided by the concrete; (ii) shear friction,
which is a post-failure behavior and follows the ®rst
mechanism. The strength of the latter mode is actually
larger and will be used. In accordance with AASHTO
LRFD [12] the following equation can be used to determine
the nominal shear capacity, Vn:
Vn � mAvfFy
where m is the friction coef®cient between two sliding
surfaces and here is assumed to be equal to one for concrete
placed against hardened concrete, Avf is the sum of areas of
vertical rebars at the juncture, and Fy is yield strength of the
rebars.
If time history analysis indicates that this shear capacity is
exceeded, the model is modi®ed such that the back wall
stiffness and compressive strength are determined using
only the height of the back wall (i.e. total abutment height
less the breast wall height). The strength of the abutment in
tension is also reduced since only the weight of the back
wall is used in calculating the frictional resistance when the
abutment is under tensile load.
2.5. Other modeling considerations
Similar to abutments and foundations, other components
of the bridge system and parameters of response were
modeled and/or analyzed employing FHWA's Seismic
Retro®t Manual [3] and/or established principles. It is not
within the scope of this paper to present details of modeling
for these components and the reader is referred to reference
[10]. However, a brief description of the procedures
employed is presented in this section.
Columns: All three bridges analyzed under this study
have round columns. Con®nement effect is considered in
evaluation of column curvature ductility and plastic rotation
capacity per FHWA's guidelines. The effects of column
curvature ductility and lateral reinforcement on shear capa-
city are also considered. The exact moment±curvature
relationship and moment±axial load interaction for column
cross-sections are determined. This is achieved by dividing
the cross-section into a number of ®bers and satisfying
compatibility and equilibrium using commonly used
stress±strain relationships for concrete and steel materials.
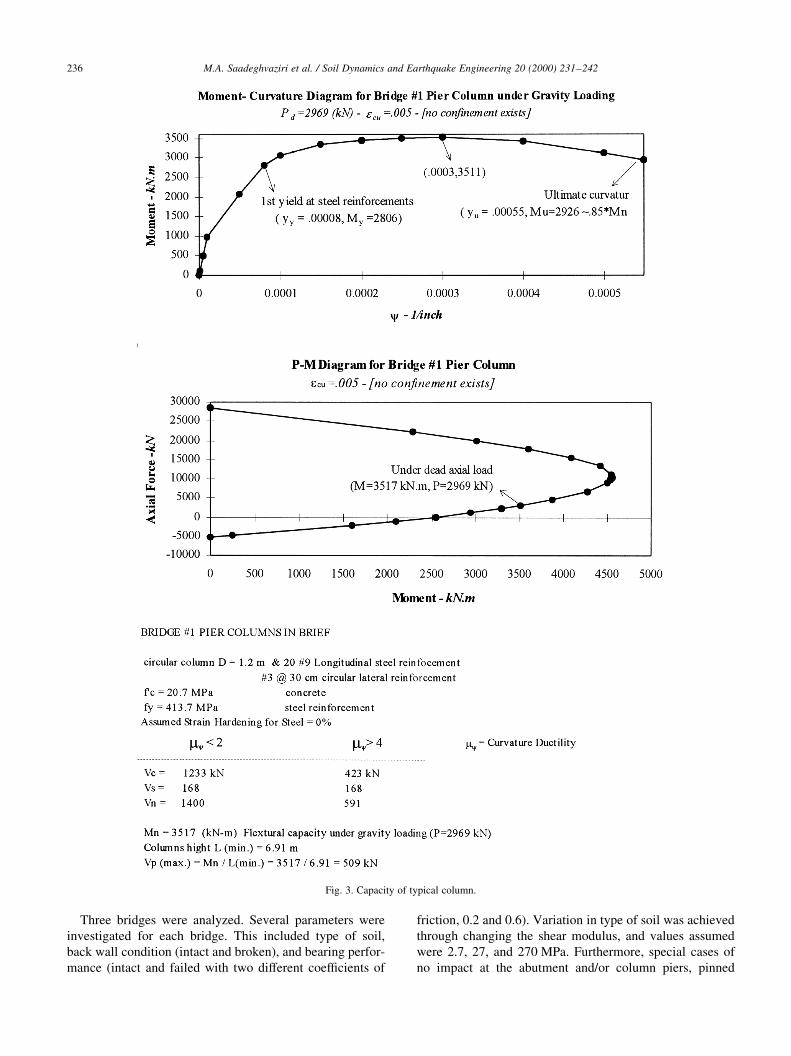
The moment±curvature, axial load±moment interaction,
and shear capacity for a typical column are shown in
Fig. 3. The column is then modeled using elasto-plastic
beam elements with an initial stiffness based on the effective
moment of inertia determined using FHWA's guidelines.
The plastic moment capacity is determined by ®tting the
bilinear model to the actual moment±curvature relationship.
The actual moment±curvature relationship along with the
equations given by FHWA for plastic hinge rotation and
plastic hinge length are used to determine the plastic
hinge capacity.
Bearings: Steel bearings are used to transfer the vertical
and horizontal forces from the superstructure to the
substructure. Typically four 22-mm diameter A325 steel
bolts are used to connect the bearing to the girder, and
two 64-mm diameter A615 steel anchor bolts are used to
connect the bearings to the abutments and cap beams. These
elements are the weak links in the load transfer from the
superstructure to the substructure through the bearings, and
impact forces can easily exceed the shear capacity of these
bolts. Therefore, post-failure behavior of the bearings
(Coulomb friction) is also investigated. It is modeled
using a bilinear force±deformation relationship with yield
strength equal to coef®cient of friction times the normal
gravity force per bearing. The coef®cient of friction is
taken to be in the range of 0.2±0.6 as a parameter.
Damping: Rayleigh's damping proportional to both stiff-
ness and mass matrices is assumed. The coef®cients of
proportionality are determined such that the damping matrix
will correspond to 5% damping in the ®rst and second
modes. This is consistent with AASHTO's response spectra
and is a commonly used value in time history analysis of
structural systems. This level of damping can be looked
upon as radiation damping at the foundations, because,
there is no other source of viscous damping in the long-
itudinal direction due to high rigidity of the deck in the
axial direction. Note that, as mentioned before, energy dissi-
pation through nonlinear phenomena such as plasticity in the
columns and friction at the bearings are modeled explicitly.
Input motions: Three different ground acceleration
records are used as input motion. These are the El Centro
S00E record from the Imperial Valley Earthquake of May
18, 1940, in California; the Cholame±Shandon Array No. 2
N65E record from the Park®eld Earthquake of June 27,
1966 in California; and the Nahanni record from the
Saguany Earthquake of December 23, 1985 in eastern
Canada. Nahanni record is assumed to be a good represen-
tative of intraplate earthquakes in eastern North America.
Two peak ground accelerations (PGA) of 0.18 and 0.4 g are
considered. The former is the maximum ground acceleration
in New Jersey as per AASHTO and the latter is for regions
of higher seismicity such as California.
3. Computer model
The bridges are analyzed using DRAIN-2DX [13] where
beam±column elements are used to model the columns and
simple connection elements are employed in modeling of
bearings and soil springs. Link elements are used to model
the gap and impact between adjacent spans and between an
end-span and the abutment.
M.A. Saadeghvaziri et al. / Soil Dynamics and Earthquake Engineering 20 (2000) 231±242 235
Three bridges were analyzed. Several parameters were
investigated for each bridge. This included type of soil,
back wall condition (intact and broken), and bearing perfor-
mance (intact and failed with two different coef®cients of
friction, 0.2 and 0.6). Variation in type of soil was achieved
through changing the shear modulus, and values assumed
were 2.7, 27, and 270 MPa. Furthermore, special cases of
no impact at the abutment and/or column piers, pinned
M.A. Saadeghvaziri et al. / Soil Dynamics and Earthquake Engineering 20 (2000) 231±242236
Fig. 3. Capacity of typical column.
abutment and ®xed columns, and high-mobilized mass at
the abutments were also investigated. As discussed before,
three ground motion records and two PGAs were consid-
ered. This will result in a large number of cases to simulate
with large volume of data per simulation to process. There-
fore, to be more effective, cases not deemed important were
not considered. For example, since every response parameter
for Park®eld record with 0.18 g PGA was consistently higher
than the other two records, those two records were not
considered for all cases with PGA of 0.4 g. The total number
of simulations was therefore reduced to about 200 cases.
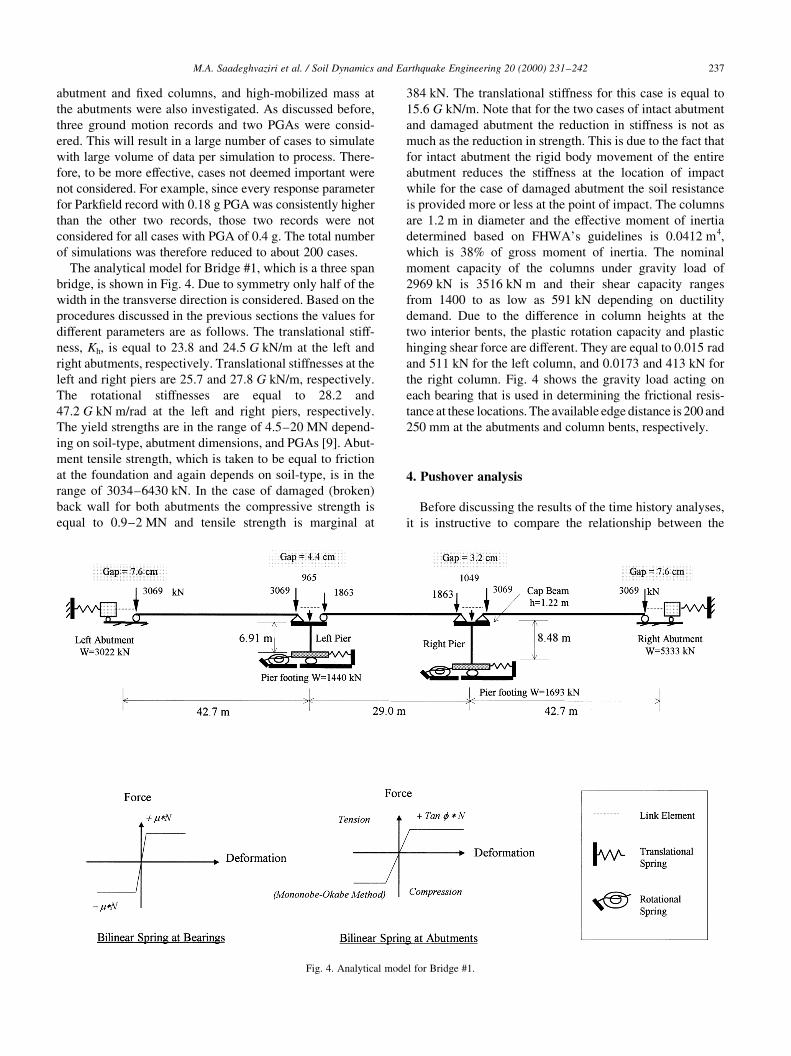
The analytical model for Bridge #1, which is a three span
bridge, is shown in Fig. 4. Due to symmetry only half of the
width in the transverse direction is considered. Based on the
procedures discussed in the previous sections the values for
different parameters are as follows. The translational stiff-
ness, Kh, is equal to 23.8 and 24.5 G kN/m at the left and
right abutments, respectively. Translational stiffnesses at the
left and right piers are 25.7 and 27.8 G kN/m, respectively.
The rotational stiffnesses are equal to 28.2 and
47.2 G kN m/rad at the left and right piers, respectively.
The yield strengths are in the range of 4.5±20 MN depend-
ing on soil-type, abutment dimensions, and PGAs [9]. Abut-
ment tensile strength, which is taken to be equal to friction
at the foundation and again depends on soil-type, is in the
range of 3034±6430 kN. In the case of damaged (broken)
back wall for both abutments the compressive strength is
equal to 0.9±2 MN and tensile strength is marginal at
384 kN. The translational stiffness for this case is equal to
15.6 G kN/m. Note that for the two cases of intact abutment
and damaged abutment the reduction in stiffness is not as
much as the reduction in strength. This is due to the fact that
for intact abutment the rigid body movement of the entire
abutment reduces the stiffness at the location of impact
while for the case of damaged abutment the soil resistance
is provided more or less at the point of impact. The columns
are 1.2 m in diameter and the effective moment of inertia
determined based on FHWA's guidelines is 0.0412 m4,
which is 38% of gross moment of inertia. The nominal
moment capacity of the columns under gravity load of
2969 kN is 3516 kN m and their shear capacity ranges
from 1400 to as low as 591 kN depending on ductility
demand. Due to the difference in column heights at the
two interior bents, the plastic rotation capacity and plastic
hinging shear force are different. They are equal to 0.015 rad
and 511 kN for the left column, and 0.0173 and 413 kN for
the right column. Fig. 4 shows the gravity load acting on
each bearing that is used in determining the frictional resis-
tance at these locations. The available edge distance is 200 and
250 mm at the abutments and column bents, respectively.
4. Pushover analysis
Before discussing the results of the time history analyses,
it is instructive to compare the relationship between the
M.A. Saadeghvaziri et al. / Soil Dynamics and Earthquake Engineering 20 (2000) 231±242 237
Fig. 4. Analytical model for Bridge #1.
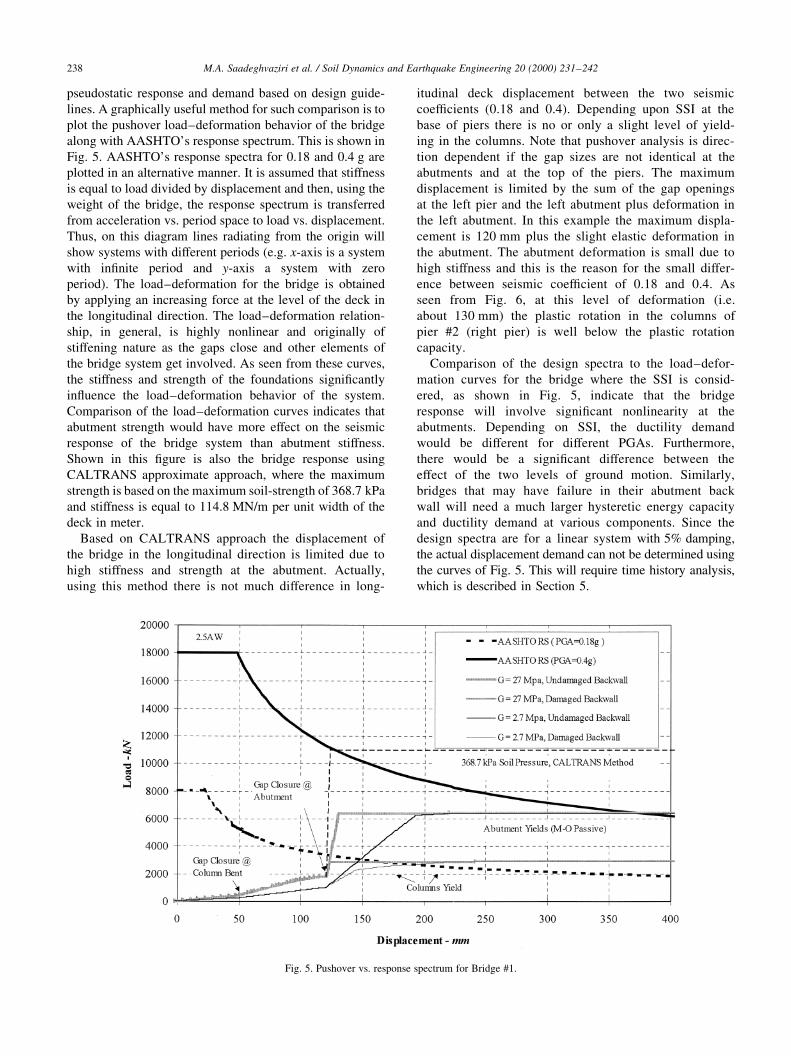
pseudostatic response and demand based on design guide-
lines. A graphically useful method for such comparison is to
plot the pushover load±deformation behavior of the bridge
along with AASHTO's response spectrum. This is shown in
Fig. 5. AASHTO's response spectra for 0.18 and 0.4 g are
plotted in an alternative manner. It is assumed that stiffness
is equal to load divided by displacement and then, using the
weight of the bridge, the response spectrum is transferred
from acceleration vs. period space to load vs. displacement.
Thus, on this diagram lines radiating from the origin will
show systems with different periods (e.g. x-axis is a system
with in®nite period and y-axis a system with zero
period). The load±deformation for the bridge is obtained
by applying an increasing force at the level of the deck in
the longitudinal direction. The load±deformation relation-
ship, in general, is highly nonlinear and originally of
stiffening nature as the gaps close and other elements of
the bridge system get involved. As seen from these curves,
the stiffness and strength of the foundations signi®cantly
in¯uence the load±deformation behavior of the system.
Comparison of the load±deformation curves indicates that
abutment strength would have more effect on the seismic
response of the bridge system than abutment stiffness.
Shown in this ®gure is also the bridge response using
CALTRANS approximate approach, where the maximum
strength is based on the maximum soil-strength of 368.7 kPa
and stiffness is equal to 114.8 MN/m per unit width of the
deck in meter.
Based on CALTRANS approach the displacement of
the bridge in the longitudinal direction is limited due to
high stiffness and strength at the abutment. Actually,
using this method there is not much difference in long-
itudinal deck displacement between the two seismic
coef®cients (0.18 and 0.4). Depending upon SSI at the
base of piers there is no or only a slight level of yield-
ing in the columns. Note that pushover analysis is direc-
tion dependent if the gap sizes are not identical at the
abutments and at the top of the piers. The maximum
displacement is limited by the sum of the gap openings
at the left pier and the left abutment plus deformation in
the left abutment. In this example the maximum displa-
cement is 120 mm plus the slight elastic deformation in
the abutment. The abutment deformation is small due to
high stiffness and this is the reason for the small differ-
ence between seismic coef®cient of 0.18 and 0.4. As
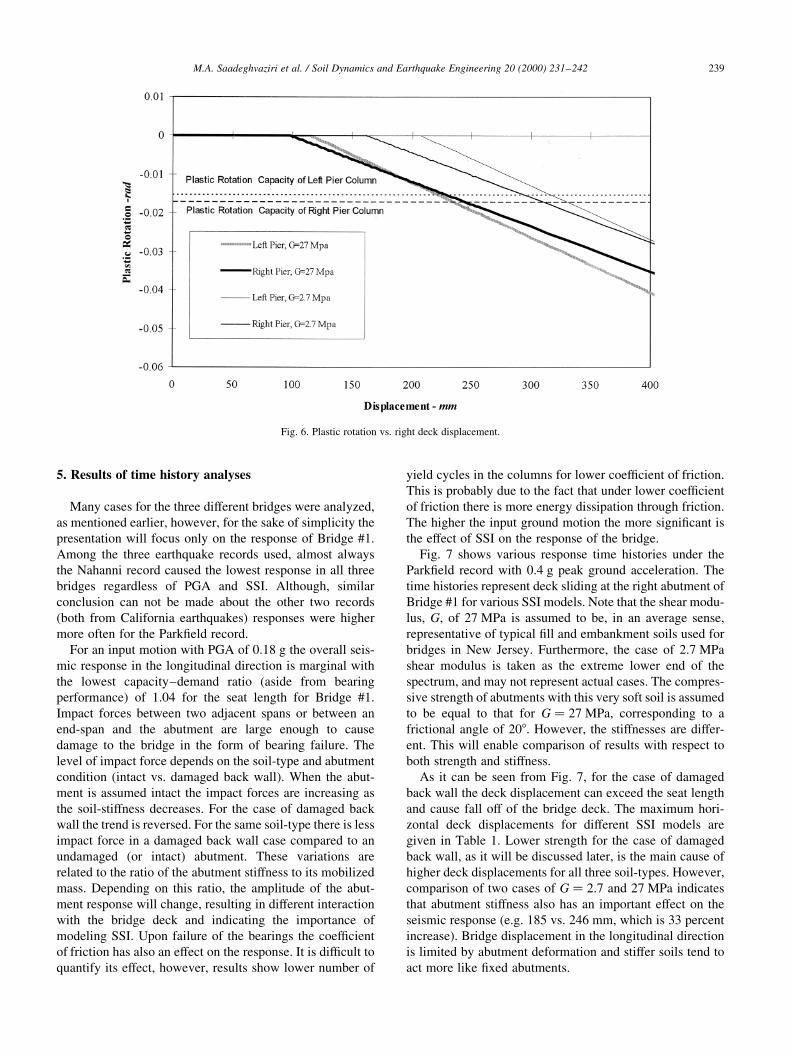
seen from Fig. 6, at this level of deformation (i.e.
about 130 mm) the plastic rotation in the columns of
pier #2 (right pier) is well below the plastic rotation
capacity.
Comparison of the design spectra to the load±defor-
mation curves for the bridge where the SSI is consid-
ered, as shown in Fig. 5, indicate that the bridge
response will involve signi®cant nonlinearity at the
abutments. Depending on SSI, the ductility demand
would be different for different PGAs. Furthermore,
there would be a signi®cant difference between the
effect of the two levels of ground motion. Similarly,
bridges that may have failure in their abutment back
wall will need a much larger hysteretic energy capacity
and ductility demand at various components. Since the
design spectra are for a linear system with 5% damping,
the actual displacement demand can not be determined using
the curves of Fig. 5. This will require time history analysis,
which is described in Section 5.
M.A. Saadeghvaziri et al. / Soil Dynamics and Earthquake Engineering 20 (2000) 231±242238
Fig. 5. Pushover vs. response spectrum for Bridge #1.
5. Results of time history analyses
Many cases for the three different bridges were analyzed,
as mentioned earlier, however, for the sake of simplicity the
presentation will focus only on the response of Bridge #1.
Among the three earthquake records used, almost always
the Nahanni record caused the lowest response in all three
bridges regardless of PGA and SSI. Although, similar
conclusion can not be made about the other two records
(both from California earthquakes) responses were higher
more often for the Park®eld record.
For an input motion with PGA of 0.18 g the overall seis-
mic response in the longitudinal direction is marginal with
the lowest capacity±demand ratio (aside from bearing
performance) of 1.04 for the seat length for Bridge #1.
Impact forces between two adjacent spans or between an
end-span and the abutment are large enough to cause
damage to the bridge in the form of bearing failure. The
level of impact force depends on the soil-type and abutment
condition (intact vs. damaged back wall). When the abut-
ment is assumed intact the impact forces are increasing as
the soil-stiffness decreases. For the case of damaged back
wall the trend is reversed. For the same soil-type there is less
impact force in a damaged back wall case compared to an
undamaged (or intact) abutment. These variations are
related to the ratio of the abutment stiffness to its mobilized
mass. Depending on this ratio, the amplitude of the abut-
ment response will change, resulting in different interaction
with the bridge deck and indicating the importance of
modeling SSI. Upon failure of the bearings the coef®cient
of friction has also an effect on the response. It is dif®cult to
quantify its effect, however, results show lower number of
yield cycles in the columns for lower coef®cient of friction.
This is probably due to the fact that under lower coef®cient
of friction there is more energy dissipation through friction.
The higher the input ground motion the more signi®cant is
the effect of SSI on the response of the bridge.
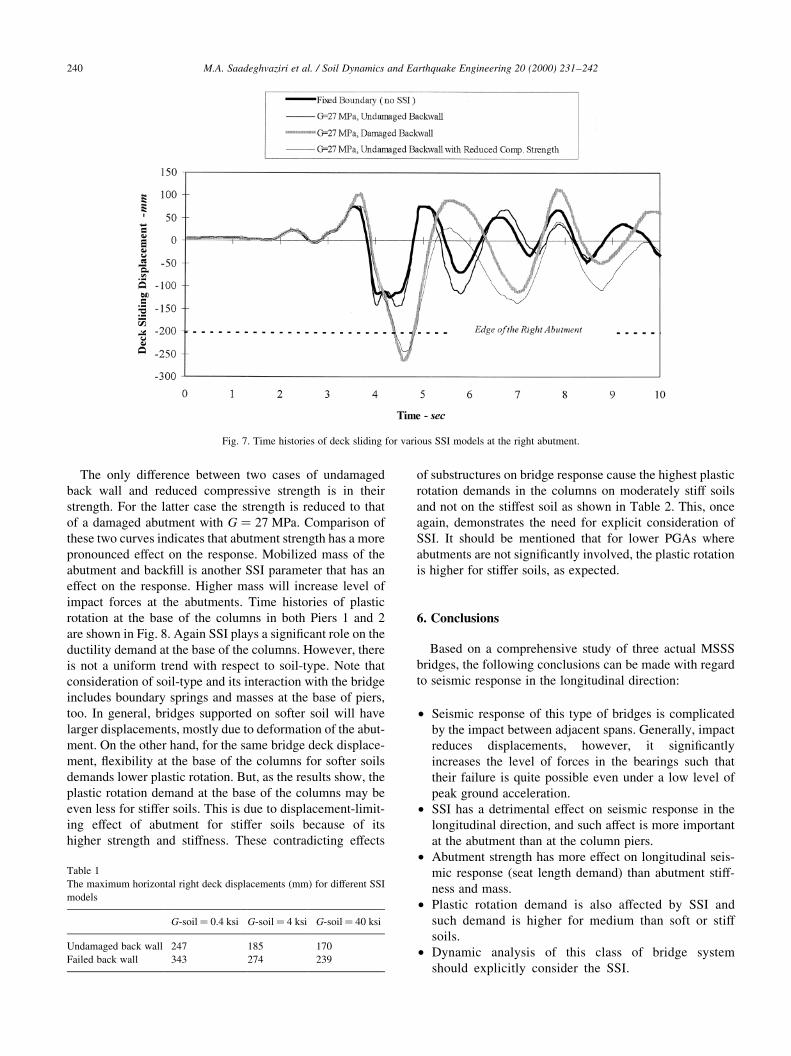
Fig. 7 shows various response time histories under the
Park®eld record with 0.4 g peak ground acceleration. The
time histories represent deck sliding at the right abutment of
Bridge #1 for various SSI models. Note that the shear modu-
lus, G, of 27 MPa is assumed to be, in an average sense,
representative of typical ®ll and embankment soils used for
bridges in New Jersey. Furthermore, the case of 2.7 MPa
shear modulus is taken as the extreme lower end of the
spectrum, and may not represent actual cases. The compres-
sive strength of abutments with this very soft soil is assumed
to be equal to that for G � 27 MPa; corresponding to a
frictional angle of 208. However, the stiffnesses are differ-
ent. This will enable comparison of results with respect to
both strength and stiffness.
As it can be seen from Fig. 7, for the case of damaged
back wall the deck displacement can exceed the seat length
and cause fall off of the bridge deck. The maximum hori-
zontal deck displacements for different SSI models are
given in Table 1. Lower strength for the case of damaged
back wall, as it will be discussed later, is the main cause of
higher deck displacements for all three soil-types. However,
comparison of two cases of G � 2:7 and 27 MPa indicates
that abutment stiffness also has an important effect on the
seismic response (e.g. 185 vs. 246 mm, which is 33 percent
increase). Bridge displacement in the longitudinal direction
is limited by abutment deformation and stiffer soils tend to
act more like ®xed abutments.
M.A. Saadeghvaziri et al. / Soil Dynamics and Earthquake Engineering 20 (2000) 231±242 239
Fig. 6. Plastic rotation vs. right deck displacement.
The only difference between two cases of undamaged
back wall and reduced compressive strength is in their
strength. For the latter case the strength is reduced to that
of a damaged abutment with G � 27 MPa: Comparison of
these two curves indicates that abutment strength has a more
pronounced effect on the response. Mobilized mass of the
abutment and back®ll is another SSI parameter that has an
effect on the response. Higher mass will increase level of
impact forces at the abutments. Time histories of plastic
rotation at the base of the columns in both Piers 1 and 2
are shown in Fig. 8. Again SSI plays a signi®cant role on the
ductility demand at the base of the columns. However, there
is not a uniform trend with respect to soil-type. Note that
consideration of soil-type and its interaction with the bridge
includes boundary springs and masses at the base of piers,
too. In general, bridges supported on softer soil will have
larger displacements, mostly due to deformation of the abut-
ment. On the other hand, for the same bridge deck displace-
ment, ¯exibility at the base of the columns for softer soils
demands lower plastic rotation. But, as the results show, the
plastic rotation demand at the base of the columns may be
even less for stiffer soils. This is due to displacement-limit-
ing effect of abutment for stiffer soils because of its
higher strength and stiffness. These contradicting effects
of substructures on bridge response cause the highest plastic
rotation demands in the columns on moderately stiff soils
and not on the stiffest soil as shown in Table 2. This, once
again, demonstrates the need for explicit consideration of
SSI. It should be mentioned that for lower PGAs where
abutments are not signi®cantly involved, the plastic rotation
is higher for stiffer soils, as expected.
6. Conclusions
Based on a comprehensive study of three actual MSSS
bridges, the following conclusions can be made with regard
to seismic response in the longitudinal direction:
² Seismic response of this type of bridges is complicated
by the impact between adjacent spans. Generally, impact
reduces displacements, however, it signi®cantly
increases the level of forces in the bearings such that
their failure is quite possible even under a low level of
peak ground acceleration.
² SSI has a detrimental effect on seismic response in the
longitudinal direction, and such affect is more important
at the abutment than at the column piers.
² Abutment strength has more effect on longitudinal seis-
mic response (seat length demand) than abutment stiff-
ness and mass.
² Plastic rotation demand is also affected by SSI and
such demand is higher for medium than soft or stiff
soils.
² Dynamic analysis of this class of bridge system
should explicitly consider the SSI.
M.A. Saadeghvaziri et al. / Soil Dynamics and Earthquake Engineering 20 (2000) 231±242240
Fig. 7. Time histories of deck sliding for various SSI models at the right abutment.
Table 1
The maximum horizontal right deck displacements (mm) for different SSI
models
G-soil� 0.4 ksi G-soil� 4 ksi G-soil� 40 ksi
Undamaged back wall 247 185 170
Failed back wall 343 274 239

Finally, as we go towards performance-based seismic
design of structural systems including bridges, it is
important to develop realistic response spectra that
re¯ect the actual level of equivalent damping. To this
end, in order to be able to quantify the effect of SSI in
a ªdesignº format, consideration should be given to
detailed study of nonlinear systems with stiffening
load±deformation characteristics.
Acknowledgements
This research study is supported by the New Jersey
Department of Transportation/FHWA and the National
Center for Transportation and Industrial Productivity at
NJIT. The results and conclusions are those of the authors
and do not necessarily re¯ect the views of the sponsors.
References
[1] Standard speci®cations for highway bridges. 15th ed. Washington,
DC: AASHTO, 1992.
[2] Torrieri JD Jr, DiBartolo RP. NJDOT's bridge seismic retro®t
program Ð a movement towards multi-year prioritization. In:
Saadeghvaziri MA, editor. Proceedings of the Structures Seminar,
North Jersey Branch, ASCE, NJIT, March 19±20, 1996.
[3] Seismic retro®tting manual for highway bridges. Publication
M.A. Saadeghvaziri et al. / Soil Dynamics and Earthquake Engineering 20 (2000) 231±242 241
Fig. 8. Time histories of plastic rotations.
Table 2
The maximum plastic rotation (rad) demand at the base of left columns for
different SSI models
G-soil� 0.4 ksi G-soil� 4 ksi G-soil� 40 ksi
Undamaged back wall 0.00 0.015 0.014
Failed back wall 0.015 0.021 0.016

FHWA-RD-94-052, FHWA, US Department of Transportation,
1995.
[4] Saadeghvaziri MA, Rashidi S. Seismic design and retro®t issues for
bridges in New Jersey. Transportation Research Record no. 1594,
1997. p. 94±104.
[5] CALTRANS, Bridge design aids 14-1. California Department of
Transportation, Sacremento, CA, October, 1989.
[6] Goel RK, Chopra AK. Evaluation of bridge abutment capacity and
stiffness during earthquakes. Earthquake Spectra 1997;13(1):1±23.
[7] Siddharthan Raj V, El-Gamal M, Maragakis EA. Stiffnesses of
abutments on spread footings with cohesionless back®ll. Canadian
Geotechnical Journal 1997;34:686±97.
[8] Wilson J, Tan BS. Bridge abutments: formulation of simple model for
earthquake response analysis. Journal of Engineering Mechanics,
ASCE 1990;116(8):1828±37.
[9] Seismic design of highway bridge foundations vol. II: design
procedures and guidelines. Report no. FHWA/RD-86/102. Federal
Highway Administration, June 1986.
[10] Saadeghvaziri MA, Yazdani-Motlagh AR, Rashidi S. Nonlinear
response of MSSS bridges under longitudinal ground motion. Interim
Report to NJDOT/FHWA, November 1998.
[11] Maroney B, Kutter B, Romstad K, Chai YH, Vanderbilt E. Interpreta-
tion of large scale bridge abutment test results. Proceedings of the 3rd
Annual Seismic Research Workshop, California Department of
transportation, Sacramento, CA, 1994.
[12] AASHTO LRFD bridge design speci®cations customary US units. 1st
ed., Washington, DC: AASHTO, 1994.
[13] Prakash V, Powell GH, Filippou FC. DRAIN-2DX base program
description and user guide. Report no. UCB/SEMM-92/29,
Department of Civil Engineering, Berkeley, CA, 1992.
M.A. Saadeghvaziri et al. / Soil Dynamics and Earthquake Engineering 20 (2000) 231±242242