effects of resin architecture and protein size on ...¬€ects of resin architecture and protein...
TRANSCRIPT
Effects of Resin Architecture and Protein Size on Nanoscale ProteinDistribution in Ion-Exchange MediaStijn H. S. Koshari, Norman J. Wagner, and Abraham M. Lenhoff*
Center for Molecular and Engineering Thermodynamics, Department of Chemical and Biomolecular Engineering, University ofDelaware, 150 Academy Street, Newark, Delaware 19716, United States
*S Supporting Information
ABSTRACT: Knowledge of the nanoscale distribution of proteins inchromatographic resins is critical to our mechanistic understanding ofseparations performance. However, the nano- to mesoscale architecture ofthese materials is challenging to characterize using conventional techniques.Small-angle neutron scattering was used to probe (1) the nano- to mesoscalestructure of chromatographic media and (2) protein sorption in these media insitu with protein-scale resolution. In particular, we characterize the effect of thearchitecture of cellulose-based and traditional and dextran-modified agarose-based ion-exchange resins on the nanoscale distribution of a relatively smallprotein (lysozyme) and two larger proteins (lactoferrin and a monoclonalantibody) at different protein loadings. Traditional agarose-based resins (SP Sepharose FF) can be envisioned as comprisinglong, thin strands of helical resin material around which the proteins adsorb, while higher static capacities are achieved in dextran-modified resins (SP Sepharose XL and Capto S) due to protein partitioning into the increased effective binding volume providedby the dextran. While protein size is shown not to affect the underlying sorption behavior in agarose-based resins such as SPSepharose FF and XL, it plays an important role in the cellulose-based S HyperCel and the more highly cross-linked agarose-based Capto S, where size-exclusion effects prevent larger proteins from binding to the base matrix resin strands. Based on thedata, we propose that entropic partitioning effects such as depletion forces may drive the observed protein crowding. In general,these observations elucidate the structure and point to the mechanism of protein partitioning in different classes ofchromatographic materials, providing guidance for optimizing their performance.
■ INTRODUCTION
The distribution of sorbed proteins within chromatographicresins is thought to affect separation performance by affectinguptake rate and capacity. Current design strategies to improvechromatographic resins include influencing the proteindistribution through manipulation of the resin architecture,including the use of highly porous resin matrices and polymer-modification.1−4 As opposed to traditional resins, for whichproteins adsorb as monolayers directly on the surface of thebase matrix, polymer-modified materials contain functionalizedpolymers that allow volumetric protein partitioning into thepolymer-occupied space.5,6 Although such advances have led toresins with improved performance, especially in terms ofbinding capacities, mechanistic understanding of the underlyingstructural interactions between proteins and the architecture ofthese resins is currently incomplete. For example, polymerextenders can decrease the effective mesh size and lead to size-exclusion effects that are not present in traditional materials.Consequently, detailed measurements of resin architecture andsorbed protein distribution can improve our understanding ofresin performance and aid in the design of superior materials.Nanoscale characterization of protein adsorption within the
resin architecture is challenging with conventional methods.While imaging techniques such as optical, fluorescence, orelectron microscopy can visualize the micro- and macro-
structure of the resins, they lack the resolution required tostudy the structure on the length scale of the protein.7−11 Inaddition, microscopy techniques often require drying, chemicalfixation, or fluorescence labeling of the protein, which raisesconcerns about whether the observed structural information isan accurate representation of the structure under normaloperating conditions.10−12 Conversely, characterization techni-ques such as gas adsorption or inverse size-exclusionchromatography (ISEC) can measure general structuralparameters such as the total surface area and the pore sizedistribution of the resins, but they do not allow detailedvisualization of the resin architecture and are challenging to useafter protein sorption.6,10,13−16 Hence, a true nanoscalecharacterization of protein distribution in chromatographicresins requires a technique with protein-scale resolution thatallows in situ characterization without modification of theprotein.In prior research, we developed the method of small-angle
neutron scattering (SANS) to characterize resin architectureand protein distribution within chromatographic resins.17
SANS is particularly well-suited to study these systems as it is
Received: September 18, 2017Revised: November 22, 2017
Article
pubs.acs.org/LangmuirCite This: Langmuir XXXX, XXX, XXX−XXX
© XXXX American Chemical Society A DOI: 10.1021/acs.langmuir.7b03289Langmuir XXXX, XXX, XXX−XXX
capable of capturing structural features from the nanometer tothe micrometer length scale, can probe relatively large samplevolumes, can penetrate opaque materials to determine internalstructure, and is minimally disruptive.18−22 The adsorption oflysozyme on a cellulose-based chromatographic material, SHyperCel, was studied to validate the method and create aframework to support further investigation of chromatographicmaterials.17,23 Importantly, we demonstrated that SANS iscapable of quantifying the nano- and microscale fractalarchitecture of S HyperCel and the nanoscale distribution oflysozyme in this material, which manifests as a densification ofthe sorbent’s fractal network. Furthermore, quantitative analysisof SANS measurements determined the amount of sorbedprotein under relevant physicochemical conditions. Thesefindings support the view that adsorption in this resin showssimilarities to volumetric partitioning in polymer-modifiedresins because of the high cross-link density and consequentfractal nature of the cellulose base matrix, explaining thematerial’s high static and dynamic binding capacities for smallproteins.10,11
In the present work, we study the nano- to mesoscalearchitectures of three fundamentally different resins: a tradi-tional agarose-based resin (SP Sepharose Fast Flow) and twodextran-modified agarose-based resins (SP Sepharose XL andCapto S), in addition to the previously studied S HyperCel.The four resins are referred to in this report simply as FF, XL,Capto, and HyperCel, respectively. These materials have beenextensively studied before, in terms of both performance as wellas structural characterization using conventional techniquessuch as ISEC and microscopy techniques.6−11,13,24 As ahypothesis, we propose that the size of proteins will affecttheir sorbed distribution at the nanoscale in these differentchromatographic media. To test this, we use SANS to quantifythe nanostructural changes in these resins after adsorption oflysozyme, lactoferrin, and a monoclonal antibody (mAb) undervarying loadings.
■ EXPERIMENTAL SECTIONMaterials. Buffers. Monobasic sodium phosphate (NaH2PO4) and
sodium chloride (NaCl) were purchased from Fisher Scientific(Waltham, MA), deuterium oxide (D2O) at 99.8 atom % D waspurchased from Cambridge Isotope Laboratories, Inc. (Tewksbury,MA), and acetic acid was purchased from Sigma-Aldrich (St. Louis,MO). They were used to prepare 10 mM sodium phosphate buffersolutions at pH 7 and 10 mM acetic acid buffer solutions at pH 5 inboth deionized (DI) water (H2O) and D2O. The total ionic strength(TIS) in the solutions was adjusted using NaCl to 20, 50, 100, and 200mM TIS.Protein Solutions. Hen egg white lysozyme (molecular weight
[MW] 14.3 kDa) was purchased from Sigma-Aldrich, recombinanthuman lactoferrin (MW 78 kDa) was purchased from LeeBioSolutions (Maryland Heights, MO), and an IgG2 monoclonalantibody (mAb, MW 144 kDa, pI 7.9) was provided by Amgen, Inc.(Thousand Oaks, CA). The lysozyme and lactoferrin were prepared bydissolving the lyophilized proteins in each of the four TIS-controlled,sodium phosphate pH 7 buffers in H2O, while the mAb was providedin a concentrated solution and diluted with each of the four TIS-controlled, acetic acid pH 5 buffers in H2O before buffer exchange.Subsequently, protein solutions were buffer-exchanged three timeswith the appropriate pH 7 (lysozyme and lactoferrin) or pH 5 (mAb)H2O-based buffer, using either 3 or 50 kDa Amicon Ultra-15centrifugal filters from Millipore (Billerica, MA). Concentrated proteinsolutions were filtered at 0.22 μm and concentrations were determinedusing UV spectrophotometry (Thermo Scientific NanoDrop 2000,Waltham, MA).
Chromatographic Media. S HyperCel (lot AU31072012-4) wasprovided by Pall Corporation (Northborough, MA). SP SepharoseFast Flow (lot 10224983), SP Sepharose XL (lot 311563), and CaptoS (lot 10061582) were obtained from GE Healthcare (Piscataway, NJ).All four resins are functionalized for cation exchange (CEX) with asulfonate ligand; other key properties of these resins have beenreported before.7−11 FF and XL have the same agarose base matrix, but40 kDa dextran is grafted onto XL, which can result in the attachmentof each dextran molecule at more than one point. Both resins arefunctionalized with the same sulfonate group on a six-carbon spacerarm. Conversely, Capto uses the same 40 kDa dextran extenders asXL, but it has a more highly cross-linked agarose base matrix and isfunctionalized with a sulfonate group on a two-carbon spacer arm.HyperCel is synthesized from a highly cross-linked cellulosic basematrix and functionalized with a sulfonate ligand without a spacer arm.The relatively narrow pore structure of HyperCel has been comparedto that of the dextran-modified resins.11 Consequently, these resins aresuitable for making direct structural comparisons. The average particlediameter is reported to be 90 μm for the agarose-based resins7 and75−80 μm for HyperCel.10
The chromatographic particles were washed three times bysuspending in DI H2O and then centrifuging and decanting. Thiswas followed by solvent exchange with D2O by repeating thisprocedure twice by suspending in D2O and letting the solutionequilibrate for a 12 h interval.
Sample Preparation. Each of the four resins was investigated “neat”without adsorbed protein as well as after adsorption of the threeproteins, leading to 16 resin−protein combinations. Each of thesecombinations was investigated at four TIS conditions, 20, 50, 100, and200 mM TIS, to influence the protein loading, leading to a total of 64resin−protein samples, which include neat samples with no protein.
To measure the structure of the neat chromatographic media, the16 samples were prepared by equilibrating 0.5 mL of hydrated particlevolume (hpv) of chromatographic particles with 9.5 mL of theappropriate TIS-controlled sodium phosphate buffer in D2O. Afterequilibration by gentle end-over-end rotation over a 48 h period, thesettled chromatographic particle slurry was separated from thesupernatant to use in the neutron scattering experiment.
To measure protein uptake, each of the 48 protein-laden sampleswas prepared with (1) 0.5 mL of hydrated particle volume (hpv) ofchromatographic media equilibrated with pure D2O, (2) a certainvolume of concentrated protein solution in the appropriate TIS-controlled H2O buffer, determined by the desired final proteinconcentration, and (3) the appropriate pH 5 or pH 7 TIS-controlledD2O buffer solution to bring the total sample volume to 10 mL.Samples were equilibrated by gentle rotation over a 48 h period, afterwhich protein concentrations in the supernatant solutions weremeasured using UV spectrophotometry (Thermo Scientific NanoDrop2000). The settled particle suspension, consisting of approximately 10vol % protein, 20 vol % particles, and 70 vol % water, depending onthe sample, was separated from the supernatant to use in the neutronscattering experiment.
Sample Compositions. For each resin−protein combination, theadded amount of concentrated protein solution at each of the fourTISs was specifically selected such that sorbed protein concentrationswould vary within the resin−protein combination, while keeping thesupernatant protein concentration after adsorption around 1 mg/mL.The added amounts of protein were based on previous adsorptionisotherm data for these resin−protein combinations.7,11 The super-natant protein concentration of 1 mg/mL was chosen such that theprotein loading would lie well within the plateau region of theadsorption isotherms and the static binding capacity of the resins forthe specific protein and TIS conditions was approached.
The adsorbed amount q (mg/mL hpv) was determined by massbalance
= −qVV
C C( )m
0(1)
Langmuir Article
DOI: 10.1021/acs.langmuir.7b03289Langmuir XXXX, XXX, XXX−XXX
B
where V (mL) is the total solution volume, Vm (mL hpv) is thehydrated particle volume (hpv), C0 (mg/mL) is the initial proteinconcentration, and C (mg/mL) is the final protein concentration inthe supernatant. Figure 1 shows the protein loadings obtained for eachresin−protein combination. Each point in this figure is a single pointof the protein adsorption isotherm, typically lying in the plateau regionof the isotherm. The observed trends in protein loading generallycorrespond well to protein adsorption isotherm data measuredpreviously, with decreased protein loading at higher TISs. However,for a few samples at 20 mM, the protein loading is significantly lowerthan expected from previous isotherm data, e.g., mAb in agarose-basedresins. Additionally, previous data show higher adsorbed amounts thanmeasured here,7,11 which is also reflected in the fact that thesupernatant protein concentrations are generally slightly higher thanthe intended 1 mg/mL. The lower adsorption might be due to severalfactors, including slow protein uptake at very low TIS25 and D2Obeing a major component of the solvent instead of just H2O. However,these observations do not compromise further structural analysis fromthe SANS spectra.Small amounts of H2O are introduced into the samples via the
concentrated protein solutions, leading to varying D2O/H2O fractionsin the solvent of the samples. As the amount of H2O in the sample hasan important effect on the background scattering, scattering lengthdensity, and overall scattering intensity, these variations in D2O:H2Ofraction were taken into consideration during analysis of the scatteringspectra.Methods. Small-Angle Neutron Scattering. The theoretical
background on small-angle neutron scattering (SANS) has beendiscussed extensively in prior work.17 Concisely, SANS can probestructural heterogeneities within the sample by measuring the intensity
I(Q) of deflected neutrons at a certain angle from the incident beam,θ, which for simple systems can be described as20−22
ρ∝ Δ +I Q P Q S Q B( ) ( ) ( ) ( )2 (2)
in which
πλ
θ=Q4
sin2 (3)
is the magnitude of the momentum transfer vector, λ is the wavelengthof the neutrons, and ρ is the scattering length density (SLD), which ismaterial-dependent and determines the scattering contrast in thesample. As Q is related to the length scale being probed, L, by Bragg’slaw20
π=LQ2
(4)
features observed in SANS spectra contain structural information ofthe sample on these real-space length scales. This structuralinformation is represented in eq 2 by the form factor P(Q), whichrepresents the contribution of the shape of the particles or buildingblocks in the system to the scattering intensity, and the effectivestructure factor S(Q), which represents the contribution of theinteractions among these components. The background scattering B istypically observed in the high-Q region of the spectrum and dependson sample composition but provides no structural information.
The experiments were carried out on the 30 m NG7 SANSinstrument at the NIST Center for Neutron Research (NCNR),National Institute of Standards and Technology (NIST), Gaithersburg,MD.26 The diffractometer settings for the tests were:
Figure 1. Adsorbed protein concentrations in the chromatographic media as a function of supernatant concentration. Labels indicate theapproximate total ionic strength (TIS) of each sample.
Langmuir Article
DOI: 10.1021/acs.langmuir.7b03289Langmuir XXXX, XXX, XXX−XXX
C
• high Q: 1 m sample-to-detector distance (SDD) with 6 Åneutrons for a 360 s count time,
• intermediate Q: 4 m SDD with 6 Å neutrons for a 600 s counttime, and
• low Q: 13 m SDD with lenses with 8 Å neutrons for a 900 scount time.
When spliced together, these regions result in a scattering range0.001 Å−1 < Q < 0.4 Å−1, corresponding to length scales ranging from∼6000 to ∼10 Å. Demountable quartz window sample cells with apath length (thickness) of 1 mm were used for all samples and awavelength spread of 0.15 was used for all experiments. Standard datareduction procedures were followed using the program IGOR Pro toobtain corrected and radially averaged SANS scattering spectra.27
Instrument corrections were applied to the models for comparisonwith data and the effects of instrumental smearing on the parametervalues were determined to be negligible during model fitting usingIGOR Pro.Structural Models. The SANS spectra were modeled by standard
expressions to obtain quantitative structural information, namely, (1)the generalized Guinier−Porod model28 for the cellulose-based resinand (2) the polydisperse cylinder model29 for the agarose-based resins.These models were used to fit the scattering spectra of the resinsregardless of the presence of adsorbed protein as they accurately fit thescattering data both before and after protein adsorption.The generalized Guinier−Porod model is an empirical model that
successfully describes the nano- to mesoscale structure of Hyper-Cel.17,23 The model describes a material with a fractal nature and isgiven by28
=−
−+ ≤
= + >
⎡⎣⎢⎢
⎤⎦⎥⎥I Q
G Q R
sB Q Q
I QD
QB Q Q
( )Q
exp3
for and
( ) form
s
2g
2
1
1 (5)
in which
= − −
=−
−−
⎡⎣⎢⎢
⎤⎦⎥⎥
QR
m s s
D GQ R
sQ
1 ( )(3 )2
and
exp3
g m s
1g
2 2
1(6)
based on continuity constraints. In these expressions, B is thebackground scattering, G is a scaling coefficient, Rg is the radius ofgyration, and m and s are the Porod exponent and the dimensionvariable, which are related to the fractal dimensions of themicrostructure on short and long real-space length scales, respectively.The radius of gyration can be obtained from the Q-value at theinflection point Q1 between the two fractal regions. Hence, this radiusof gyration is a characteristic average length scale within the particlestructure, with length scales below the Rg characterized by a fractaldimension related to the Porod exponent and length scales above theRg characterized by a fractal dimension related to the dimensionvariable.The SANS spectra from the agarose-based resins were fit using a
polydisperse cylinder model, which represents a collection ofnoninteracting cylinders with a mean radius R and length L.Polydispersity of the cylinder radius is modeled using a normalizedlog-normal distribution n(r). For this model, the scattering intensity asa function of Q is calculated as29
∬ϕ ρ ρ α α α= − +I QV
n r F Q r r B( ) ( ) ( ) ( , , )sin d dcyl solv2 2
(7)
in which
π
π σ
α α αα
=
=−
=
σ
⎜ ⎟
⎡⎣⎢
⎤⎦⎥
⎛⎝
⎞⎠
( )V R L
n rR
F Q r VjQL J Qr
Qr
( )exp
2, and
( , , ) 2cos2
( sin )
sin
r R
2
12
ln( / ) 2
01
(8)
The seven fitting parameters are (1) the volume fraction ϕ, (2) themean radius R, (3) the length L, (4) the radial polydispersity σ, whichis equal to the standard deviation of the log-normal distribution, (5)the SLD of the cylinder ρcyl, (6) the SLD of the solvent ρsolv, and (7)the background B. The polydisperse cylinder model is a two-phasemodel, one phase consisting of the cylinders and one phase consistingof the solvent. In such models, the SLD values of the two phases affectonly the overall scaling of the scattering intensity, not the shape of thescattering spectrum and consequently not the other structuralparameters of the model except the volume fraction, which also scalesdirectly with the scattering spectrum.
Protein Form Factors. Equation 2 can be applied directly to proteinsystems within a framework in which the form factor P(Q) is theprotein monomers’ characteristic scattering pattern due to their shape,while the effective structure factor S(Q) is due to local interactions insolution, clustering, and aggregation. Both of these can have an effecton the total scattering spectrum from protein solutions. However, indilute protein solutions, the structure factor contribution becomesnegligible and the protein form factor can be directly obtained fromSANS measurements. The form factors of the three proteins weremeasured experimentally by SANS after dilution of the concentratedprotein solutions to approximately 5 mg/mL in the pH 7 (lysozymeand lactoferrin) or pH 5 (mAb) buffer in D2O at 20 mM TIS, aconcentration low enough to minimize contributions from the proteinstructure factor. The experimental form factors of the three proteinsare shown in Figure 2.
The scattering spectrum contribution from the form factor iscalculated directly from the atomic structure of the protein using theprogram CRYSON30 as applied to structural data from the RCSBProtein Data Bank (PDB).31 These calculations can take effects suchas the solvation shell (not applied here) and the solvent composition(100 mol % D2O) into account. The CRYSON output is the formfactor of a single protein monomer in units of barn (1 b = 10−28 m2).
Figure 2. Scattering spectra of protein solutions at low concentrations(approximately 5 mg/mL), showing the characteristic scatteringspectrum of protein monomers, i.e., the protein form factor. CRYSONscattering predictions from protein PDB files are shown by the dashedlines. Successive curves are offset by a factor of 4 for clarity.
Langmuir Article
DOI: 10.1021/acs.langmuir.7b03289Langmuir XXXX, XXX, XXX−XXX
D
The scattering spectrum scales linearly with the protein concentration,so the concentration of the protein can be taken into account bymultiplication of the calculated scattering spectrum by the proteinconcentration. Thus, the protein monomer contribution can bepredicted from the protein concentration in the system, or conversely,the protein concentration can be determined from its contribution tothe scattering intensity.CRYSON was used to compare the experimentally measured form
factors to the values calculated from the protein atomic structures. ThePDB files used to model lysozyme, lactoferrin, and the mAb have thePDB IDs 6LYS,32 2BJJ,33 and 1IGT,34 respectively. The CRYSONpredictions are shown by the dashed lines in Figure 2. They capturethe experimentally determined structure factors fairly well, althoughsmall deviations can be observed for each protein in specific regions.These deviations can be caused by the flexibility of the proteinstructure in solution, such as mAb hinge motions, as opposed to thecrystalline protein structure obtained from the PDB files. Con-sequently, such small deviations can be expected and the CRYSONpredictions adequately confirm the experimentally determined formfactors, which are used to characterize protein adsorption in thechromatographic resins.Model Fitting of Neat Resins. For the neat resins with no adsorbed
protein, structural models described the scattering spectra well overthe whole Q range, and the models could consequently be directly fitto the experimental data using IGOR Pro’s NCNR Analysis Macros.27
For the generalized Guinier-Porod model for HyperCel, no parameterswere held fixed during the fitting process, generally resulting in fivefitting parameters. For the polydisperse cylinder model for agarose-based resins, the cylinder length and the SLD values were held fixedduring fitting. The model described the experimental data well forcylinders that were effectively infinitely long. Hence, the cylinderlength was fixed at 10 000 Å to simplify the model and reduce thenumber of fitting parameters to four.SLD values for the base matrix and the solvent were calculated using
the NCNR SLD Calculator,35,36 for which the molecular densitieswere calculated from the displaced solvent volumes of the ensembleatomic groups.37 The SLD of pure D2O and of the agarose base matrixin pure D2O were calculated to be 6.33 × 10⁻⁶ and 2.22 × 10⁻⁶ Å−2,respectively. Note that the SLD of polymers such as agarose andproteins can change depending on the D2O content of thesurrounding environment due to deuterium exchange. For thesecalculations, it was assumed that the fraction of exchanged hydrogenson the polymer was equal to the fraction of D2O in the solvent (100%for the neat resins). Contributions to the solvent SLD from buffercomponents and to the cylinder SLD from sulfonate ligands anddextran extenders were assumed to be negligible to simplify modelcalculations. Deviations due to such contributions are effectively allincluded in the fitted volume fraction and polydispersity.Model Fitting of Protein-Laden Resins. To first order, one might
expect that the scattering spectra from protein-laden resins can bemodeled by a summation of the scattering spectra from the neat resinsand the protein monomer form factor. However, the sorption of theprotein to the resin can introduce changes to both the apparentnanostructure of the resin as well as the proteins’ contribution to thescattering. Indeed, as the resin and protein have similar scatteringlength densities, protein distribution into the available space within theresins will be perceived by SANS as an apparent change of the resinnanostructure. Furthermore, resin−protein and protein−proteininteractions can lead to changes in the protein scattering contribution.Regardless of these changes, the same structural models with differentparameters can be used for the protein-laden resins as the neat resins,with the exception of the high-Q region, where explicit proteincontributions are evident. This region was instead fit directly to theexpected form factor scattering from the protein monomers. Moredetailed information on the modeling of protein-laden resins, includingspecific fitting ranges and fixed fitting parameters, are included in theSupporting Information.
■ RESULTS AND DISCUSSIONSANS spectra were measured for four resins (HyperCel, FF,XL, and Capto) and three proteins (lysozyme, lactoferrin, and amAb), in addition to the neat resin structure with no adsorbedprotein, leading to 16 resin−protein configurations. Eachconfiguration was studied at four different total ionic strengths,which affect the total protein loading. This results in a total of64 scattering spectra, of which only a select few are showndirectly here for brevity. However, all scattering spectra andmodel parameters are included in the Supporting Information.
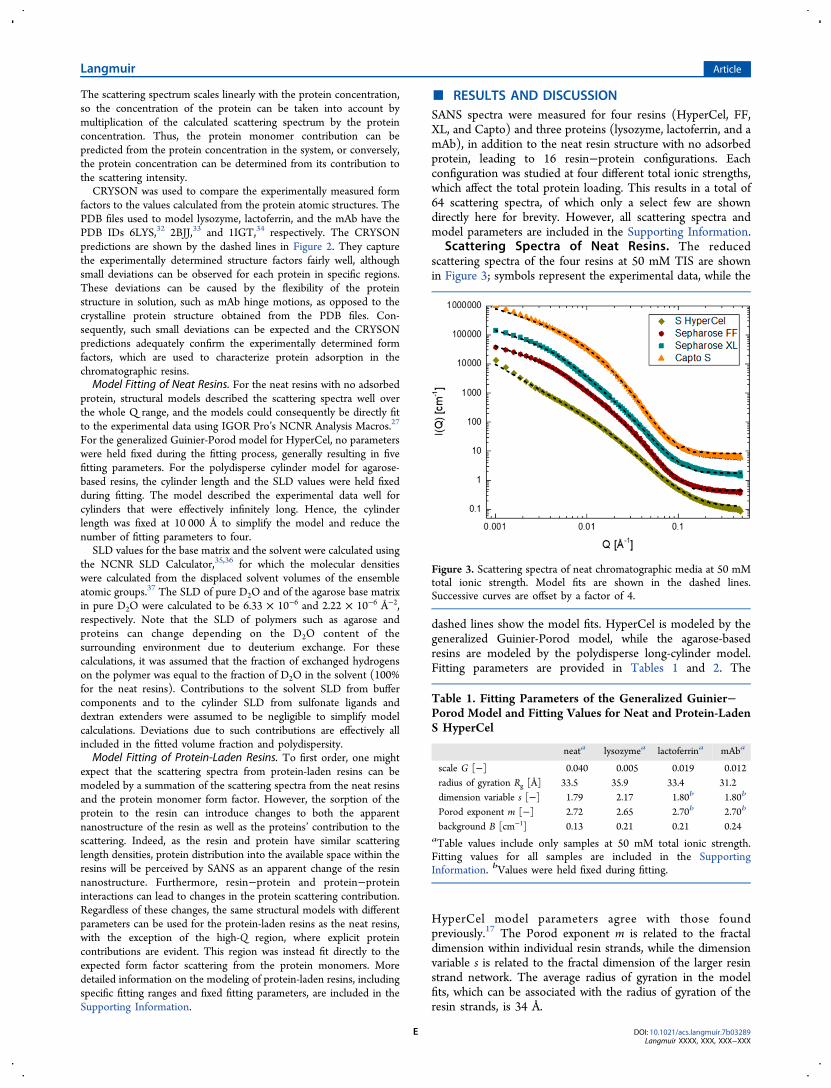
Scattering Spectra of Neat Resins. The reducedscattering spectra of the four resins at 50 mM TIS are shownin Figure 3; symbols represent the experimental data, while the
dashed lines show the model fits. HyperCel is modeled by thegeneralized Guinier-Porod model, while the agarose-basedresins are modeled by the polydisperse long-cylinder model.Fitting parameters are provided in Tables 1 and 2. The
HyperCel model parameters agree with those foundpreviously.17 The Porod exponent m is related to the fractaldimension within individual resin strands, while the dimensionvariable s is related to the fractal dimension of the larger resinstrand network. The average radius of gyration in the modelfits, which can be associated with the radius of gyration of theresin strands, is 34 Å.
Figure 3. Scattering spectra of neat chromatographic media at 50 mMtotal ionic strength. Model fits are shown in the dashed lines.Successive curves are offset by a factor of 4.
Table 1. Fitting Parameters of the Generalized Guinier−Porod Model and Fitting Values for Neat and Protein-LadenS HyperCel
neata lysozymea lactoferrina mAba
scale G [−] 0.040 0.005 0.019 0.012radius of gyration Rg [Å] 33.5 35.9 33.4 31.2dimension variable s [−] 1.79 2.17 1.80b 1.80b
Porod exponent m [−] 2.72 2.65 2.70b 2.70b
background B [cm−1] 0.13 0.21 0.21 0.24aTable values include only samples at 50 mM total ionic strength.Fitting values for all samples are included in the SupportingInformation. bValues were held fixed during fitting.
Langmuir Article
DOI: 10.1021/acs.langmuir.7b03289Langmuir XXXX, XXX, XXX−XXX
E
For the agarose-based resins, in FF and XL the mean cylinderradii are 14 and 3 Å and the radial polydispersities σ are 0.9 and1.3, respectively. In the more densely cross-linked Capto, themean cylinder radius is 51 Å and the polydispersity is 0.6. Themeasured volume fractions of the cylinders range from 3 to 5%,which is consistent with the use of 4% agarose in Sepharose FFbeads (Sepharose 4). For the neat resins, these parameters arenot strongly affected by changing the TIS.Nano- to Mesoscale Architecture of Neat Resins. The
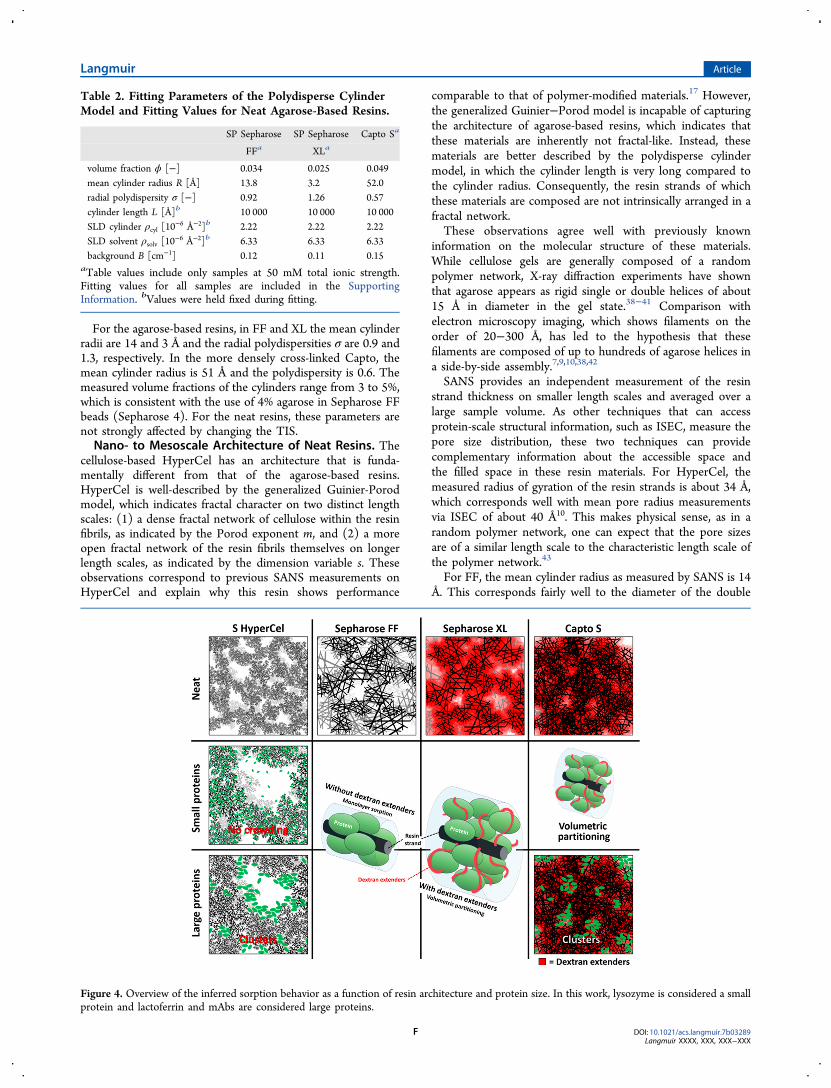
cellulose-based HyperCel has an architecture that is funda-mentally different from that of the agarose-based resins.HyperCel is well-described by the generalized Guinier-Porodmodel, which indicates fractal character on two distinct lengthscales: (1) a dense fractal network of cellulose within the resinfibrils, as indicated by the Porod exponent m, and (2) a moreopen fractal network of the resin fibrils themselves on longerlength scales, as indicated by the dimension variable s. Theseobservations correspond to previous SANS measurements onHyperCel and explain why this resin shows performance
comparable to that of polymer-modified materials.17 However,the generalized Guinier−Porod model is incapable of capturingthe architecture of agarose-based resins, which indicates thatthese materials are inherently not fractal-like. Instead, thesematerials are better described by the polydisperse cylindermodel, in which the cylinder length is very long compared tothe cylinder radius. Consequently, the resin strands of whichthese materials are composed are not intrinsically arranged in afractal network.These observations agree well with previously known
information on the molecular structure of these materials.While cellulose gels are generally composed of a randompolymer network, X-ray diffraction experiments have shownthat agarose appears as rigid single or double helices of about15 Å in diameter in the gel state.38−41 Comparison withelectron microscopy imaging, which shows filaments on theorder of 20−300 Å, has led to the hypothesis that thesefilaments are composed of up to hundreds of agarose helices ina side-by-side assembly.7,9,10,38,42
SANS provides an independent measurement of the resinstrand thickness on smaller length scales and averaged over alarge sample volume. As other techniques that can accessprotein-scale structural information, such as ISEC, measure thepore size distribution, these two techniques can providecomplementary information about the accessible space andthe filled space in these resin materials. For HyperCel, themeasured radius of gyration of the resin strands is about 34 Å,which corresponds well with mean pore radius measurementsvia ISEC of about 40 Å10. This makes physical sense, as in arandom polymer network, one can expect that the pore sizesare of a similar length scale to the characteristic length scale ofthe polymer network.43
For FF, the mean cylinder radius as measured by SANS is 14Å. This corresponds fairly well to the diameter of the double
Table 2. Fitting Parameters of the Polydisperse CylinderModel and Fitting Values for Neat Agarose-Based Resins.
SP Sepharose SP Sepharose Capto Sa
FFa XLa
volume fraction ϕ [−] 0.034 0.025 0.049mean cylinder radius R [Å] 13.8 3.2 52.0radial polydispersity σ [−] 0.92 1.26 0.57cylinder length L [Å]b 10 000 10 000 10 000SLD cylinder ρcyl [10
−6 Å−2]b 2.22 2.22 2.22SLD solvent ρsolv [10
−6 Å−2]b 6.33 6.33 6.33background B [cm−1] 0.12 0.11 0.15
aTable values include only samples at 50 mM total ionic strength.Fitting values for all samples are included in the SupportingInformation. bValues were held fixed during fitting.
Figure 4. Overview of the inferred sorption behavior as a function of resin architecture and protein size. In this work, lysozyme is considered a smallprotein and lactoferrin and mAbs are considered large proteins.
Langmuir Article
DOI: 10.1021/acs.langmuir.7b03289Langmuir XXXX, XXX, XXX−XXX
F
helices that compose agarose gels. The fact that SANS candetect these thin strands implies that these helices aresufficiently far apart that they can be observed as distinctscattering objects. Consequently, the observation that thesehelices form a dense side-by-side assembly within the largerfilaments in electron microscopy may be incorrect. Instead, thescattering data suggest that within the filaments, the agarosehelices are more loosely distributed. We suspect that thesebundle features observed in electron microscopy imagesprobably arise from polymer rearrangement due to resin dryingduring sample preparation and are not reflective of the media inits native state.As FF and XL have the same agarose base matrix, the
measured difference in cylinder radius between the twomaterials is due to the dextran modifications in XL. Thedecrease in the mean cylinder radius from 14 Å in FF to 3 Å inXL and the increase in the polydispersity are consistent withthe idea of dextran extending into the pore space, assuming thatSANS resolves the individual dextran strands.In Capto, the significantly larger mean radius of the resin
strands of 51 Å is probably caused by the more highly cross-linked base matrix, which makes it similar to HyperCel.Consequently, due to the higher cross-linking, agarose helicesin Capto may arrange in the dense side-by-side assembly toform thicker strands as hypothesized before.38,42 The fact thatthe dextran extenders are not directly observed in Capto maybe due to the fact that larger scattering objects, such as thethicker strands, cause a significantly increased scattering
intensity, which can overwhelm the scattering from the muchsmaller dextran polymers.Schematic representations of these interpretations, based on
the structural models, are shown in the top panels of Figure 4.In this figure, the long strands in the agarose-based materialsrepresent the helices. Random, single-strand connectionsbetween these helices are not explicitly shown, nor are thedextran extenders.
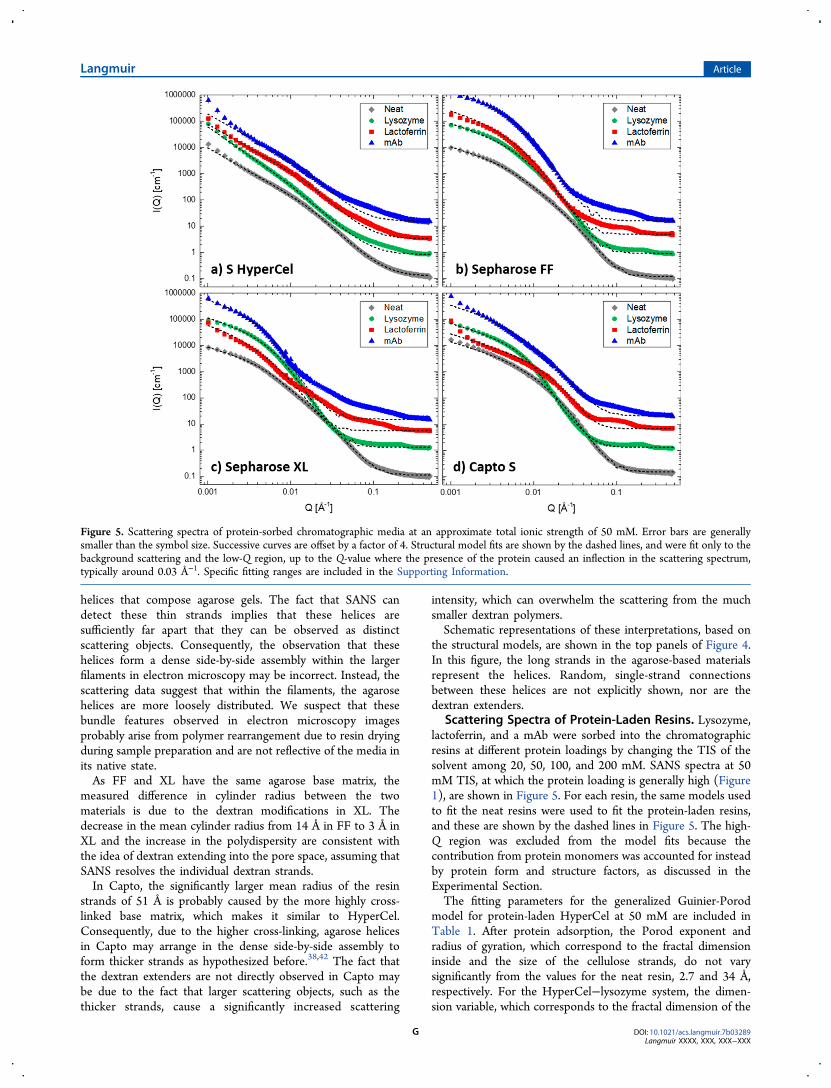
Scattering Spectra of Protein-Laden Resins. Lysozyme,lactoferrin, and a mAb were sorbed into the chromatographicresins at different protein loadings by changing the TIS of thesolvent among 20, 50, 100, and 200 mM. SANS spectra at 50mM TIS, at which the protein loading is generally high (Figure1), are shown in Figure 5. For each resin, the same models usedto fit the neat resins were used to fit the protein-laden resins,and these are shown by the dashed lines in Figure 5. The high-Q region was excluded from the model fits because thecontribution from protein monomers was accounted for insteadby protein form and structure factors, as discussed in theExperimental Section.The fitting parameters for the generalized Guinier-Porod
model for protein-laden HyperCel at 50 mM are included inTable 1. After protein adsorption, the Porod exponent andradius of gyration, which correspond to the fractal dimensioninside and the size of the cellulose strands, do not varysignificantly from the values for the neat resin, 2.7 and 34 Å,respectively. For the HyperCel−lysozyme system, the dimen-sion variable, which corresponds to the fractal dimension of the
Figure 5. Scattering spectra of protein-sorbed chromatographic media at an approximate total ionic strength of 50 mM. Error bars are generallysmaller than the symbol size. Successive curves are offset by a factor of 4. Structural model fits are shown by the dashed lines, and were fit only to thebackground scattering and the low-Q region, up to the Q-value where the presence of the protein caused an inflection in the scattering spectrum,typically around 0.03 Å−1. Specific fitting ranges are included in the Supporting Information.
Langmuir Article
DOI: 10.1021/acs.langmuir.7b03289Langmuir XXXX, XXX, XXX−XXX
G
larger-scale resin strand network, increases as a function of theamount of adsorbed protein, going up to 2.4 for the 20 mMlysozyme sample as compared to the 1.8 of the neat resin.However, for the larger proteins the dimension variable doesnot change after protein adsorption at any TIS value; only thescaling coefficient changes due to variation in the SLDs.Consequently, the HyperCel architecture does not change at allwith adsorption of larger proteins, which is illustrated by fixingthe Porod exponent and dimension variable for these protein−resin combinations. The only change in the scattering spectrumis the contribution of the protein monomers at high Q and anupturn at very low Q, which indicates the presence of largerobjects outside the scattering limits.The fitting parameters for the polydisperse cylinder model
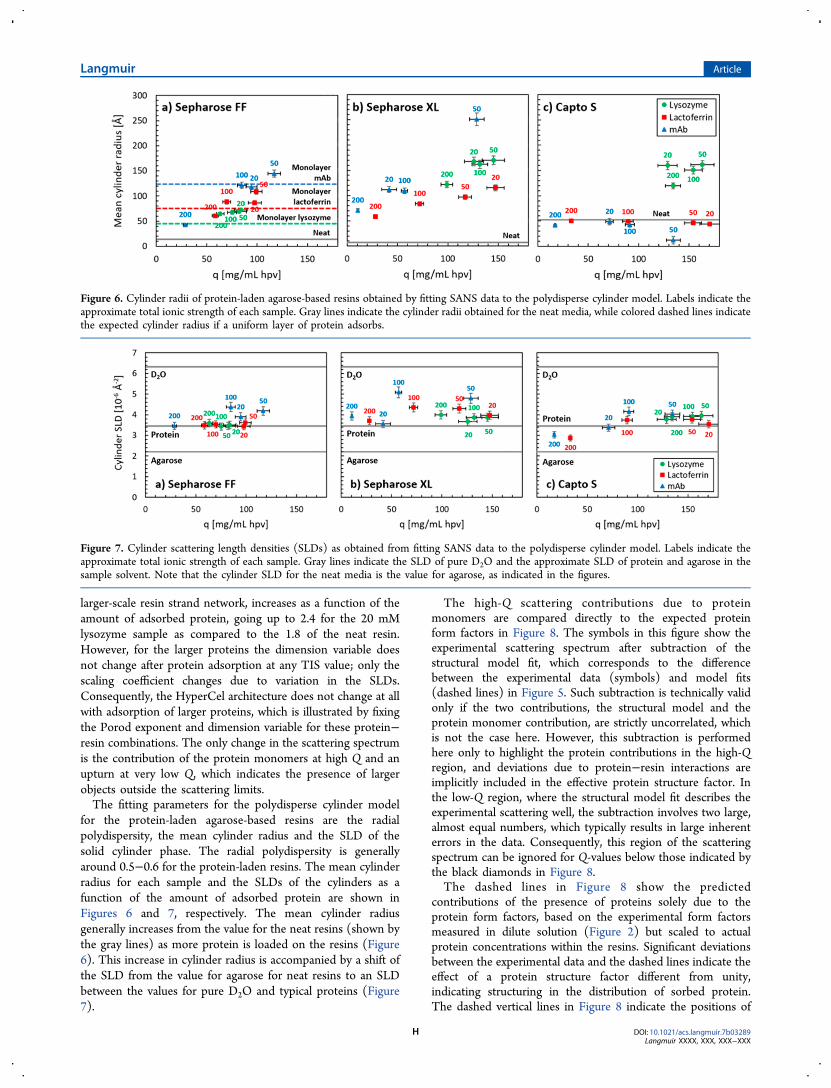
for the protein-laden agarose-based resins are the radialpolydispersity, the mean cylinder radius and the SLD of thesolid cylinder phase. The radial polydispersity is generallyaround 0.5−0.6 for the protein-laden resins. The mean cylinderradius for each sample and the SLDs of the cylinders as afunction of the amount of adsorbed protein are shown inFigures 6 and 7, respectively. The mean cylinder radiusgenerally increases from the value for the neat resins (shown bythe gray lines) as more protein is loaded on the resins (Figure6). This increase in cylinder radius is accompanied by a shift ofthe SLD from the value for agarose for neat resins to an SLDbetween the values for pure D2O and typical proteins (Figure7).
The high-Q scattering contributions due to proteinmonomers are compared directly to the expected proteinform factors in Figure 8. The symbols in this figure show theexperimental scattering spectrum after subtraction of thestructural model fit, which corresponds to the differencebetween the experimental data (symbols) and model fits(dashed lines) in Figure 5. Such subtraction is technically validonly if the two contributions, the structural model and theprotein monomer contribution, are strictly uncorrelated, whichis not the case here. However, this subtraction is performedhere only to highlight the protein contributions in the high-Qregion, and deviations due to protein−resin interactions areimplicitly included in the effective protein structure factor. Inthe low-Q region, where the structural model fit describes theexperimental scattering well, the subtraction involves two large,almost equal numbers, which typically results in large inherenterrors in the data. Consequently, this region of the scatteringspectrum can be ignored for Q-values below those indicated bythe black diamonds in Figure 8.The dashed lines in Figure 8 show the predicted
contributions of the presence of proteins solely due to theprotein form factors, based on the experimental form factorsmeasured in dilute solution (Figure 2) but scaled to actualprotein concentrations within the resins. Significant deviationsbetween the experimental data and the dashed lines indicate theeffect of a protein structure factor different from unity,indicating structuring in the distribution of sorbed protein.The dashed vertical lines in Figure 8 indicate the positions of
Figure 6. Cylinder radii of protein-laden agarose-based resins obtained by fitting SANS data to the polydisperse cylinder model. Labels indicate theapproximate total ionic strength of each sample. Gray lines indicate the cylinder radii obtained for the neat media, while colored dashed lines indicatethe expected cylinder radius if a uniform layer of protein adsorbs.
Figure 7. Cylinder scattering length densities (SLDs) as obtained from fitting SANS data to the polydisperse cylinder model. Labels indicate theapproximate total ionic strength of each sample. Gray lines indicate the SLD of pure D2O and the approximate SLD of protein and agarose in thesample solvent. Note that the cylinder SLD for the neat media is the value for agarose, as indicated in the figures.
Langmuir Article
DOI: 10.1021/acs.langmuir.7b03289Langmuir XXXX, XXX, XXX−XXX
H
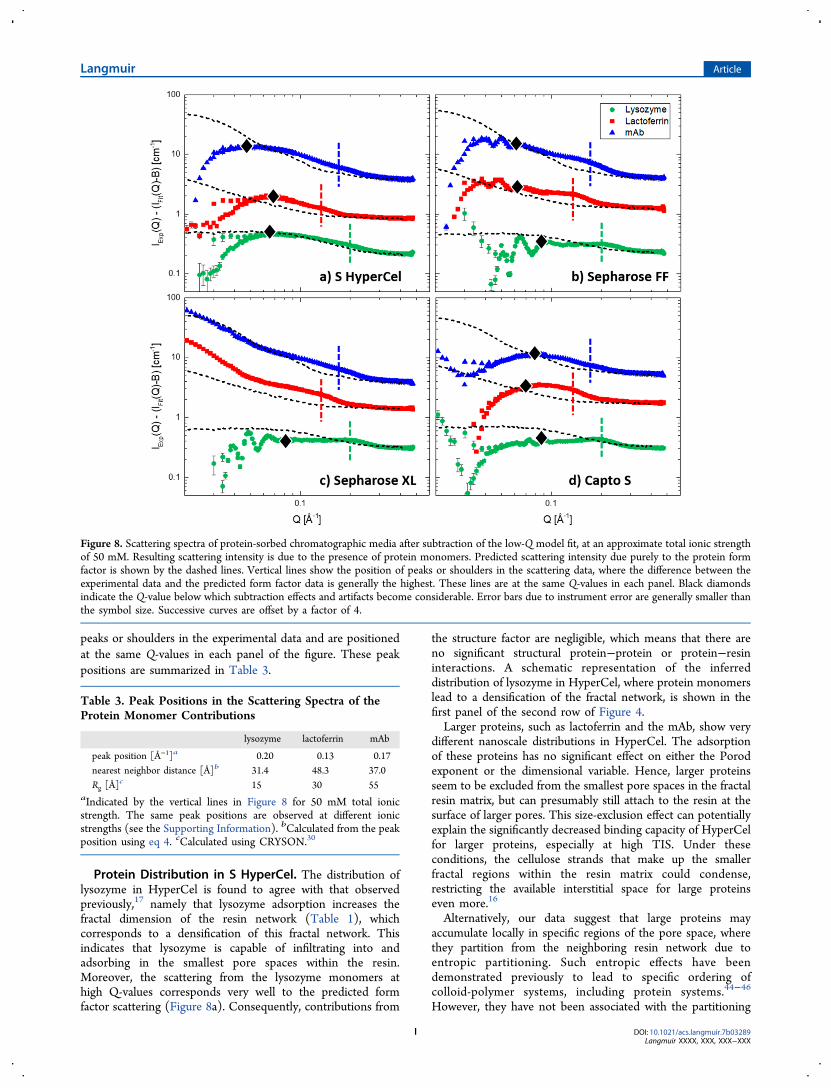
peaks or shoulders in the experimental data and are positionedat the same Q-values in each panel of the figure. These peakpositions are summarized in Table 3.
Protein Distribution in S HyperCel. The distribution oflysozyme in HyperCel is found to agree with that observedpreviously,17 namely that lysozyme adsorption increases thefractal dimension of the resin network (Table 1), whichcorresponds to a densification of this fractal network. Thisindicates that lysozyme is capable of infiltrating into andadsorbing in the smallest pore spaces within the resin.Moreover, the scattering from the lysozyme monomers athigh Q-values corresponds very well to the predicted formfactor scattering (Figure 8a). Consequently, contributions from
the structure factor are negligible, which means that there areno significant structural protein−protein or protein−resininteractions. A schematic representation of the inferreddistribution of lysozyme in HyperCel, where protein monomerslead to a densification of the fractal network, is shown in thefirst panel of the second row of Figure 4.Larger proteins, such as lactoferrin and the mAb, show very
different nanoscale distributions in HyperCel. The adsorptionof these proteins has no significant effect on either the Porodexponent or the dimensional variable. Hence, larger proteinsseem to be excluded from the smallest pore spaces in the fractalresin matrix, but can presumably still attach to the resin at thesurface of larger pores. This size-exclusion effect can potentiallyexplain the significantly decreased binding capacity of HyperCelfor larger proteins, especially at high TIS. Under theseconditions, the cellulose strands that make up the smallerfractal regions within the resin matrix could condense,restricting the available interstitial space for large proteinseven more.16
Alternatively, our data suggest that large proteins mayaccumulate locally in specific regions of the pore space, wherethey partition from the neighboring resin network due toentropic partitioning. Such entropic effects have beendemonstrated previously to lead to specific ordering ofcolloid-polymer systems, including protein systems.44−46
However, they have not been associated with the partitioning
Figure 8. Scattering spectra of protein-sorbed chromatographic media after subtraction of the low-Q model fit, at an approximate total ionic strengthof 50 mM. Resulting scattering intensity is due to the presence of protein monomers. Predicted scattering intensity due purely to the protein formfactor is shown by the dashed lines. Vertical lines show the position of peaks or shoulders in the scattering data, where the difference between theexperimental data and the predicted form factor data is generally the highest. These lines are at the same Q-values in each panel. Black diamondsindicate the Q-value below which subtraction effects and artifacts become considerable. Error bars due to instrument error are generally smaller thanthe symbol size. Successive curves are offset by a factor of 4.
Table 3. Peak Positions in the Scattering Spectra of theProtein Monomer Contributions
lysozyme lactoferrin mAb
peak position [Å−1]a 0.20 0.13 0.17nearest neighbor distance [Å]b 31.4 48.3 37.0Rg [Å]
c 15 30 55aIndicated by the vertical lines in Figure 8 for 50 mM total ionicstrength. The same peak positions are observed at different ionicstrengths (see the Supporting Information). bCalculated from the peakposition using eq 4. cCalculated using CRYSON.30
Langmuir Article
DOI: 10.1021/acs.langmuir.7b03289Langmuir XXXX, XXX, XXX−XXX
I
of proteins in materials such as these chromatographic resins.We argue that instead of solely size-exclusion effects, proteincrowding in chromatographic resins may be entropicallyfavored due to depletion or excluded-volume forces.For these larger proteins, the scattering from the protein
monomers at high Q-values is no longer well-described by theform factor alone (Figure 8a). A significant structure factor ispresent, indicating the presence of protein−protein or protein−resin interactions indicative of local crowding. Such structuringis observed for all other resin−protein combinations inves-tigated in this paper (Figure 8). Indeed, all high-Q scatteringspectra have a significant deviation from the predicted formfactor scattering. In particular, all scattering spectra show ascattering peak or shoulder in the same position for a specificprotein. The approximate positions are indicated by the verticallines in Figure 8 and are summarized in Table 3. Note that thevertical line for a given protein is at the same Q-value in eachpanel of Figure 8.Interestingly, these peaks and their positions are similar to
those observed in SANS spectra of frozen protein solutions.47,48
In frozen solutions, proteins are concentrated in dense phasesdue to the formation of ice crystals. Consequently, thescattering spectra show a protein−protein interaction peak,also termed the nearest-neighbor peak, as the position of thepeak is related to the average distance between neighboringprotein molecules in the dense phase through eq 4. The averageprotein−protein distance as obtained from the approximatepeak positions in this work are included in Table 3, where theyare compared to the radii of gyration of the proteins asobtained from CRYSON.30 For lysozyme, the interproteindistance corresponds to twice the protein radius, indicating thatthe protein molecules are in close contact. For lactoferrin, theinterprotein distance is slightly smaller than twice the radius ofgyration. This is possible as lactoferrin has a two-lobed,dumbbell-like shape (Figure 9) and the protein molecules canstack side by side. This side-by-side configuration is expected tobe facilitated by the highly charged patch on one of lactoferrin’slobes, which may allow it to adsorb end-on on thefunctionalized resin. For mAbs, the interprotein distance issignificantly smaller than twice the radius of gyration. Again,this is expected as mAbs are known to interdigitate due to their
Y-like shape and flexibility, and the interprotein distance isgoverned by the size of the Fab domains.48
These observations support the idea that in HyperCel,lysozyme can infiltrate the fractal resin network, densifying thenetwork but minimizing protein−protein contact. However,larger proteins are excluded from the network and instead formdense phases on the surfaces of the larger pores in the materialdue to size-exclusion or entropic effects.
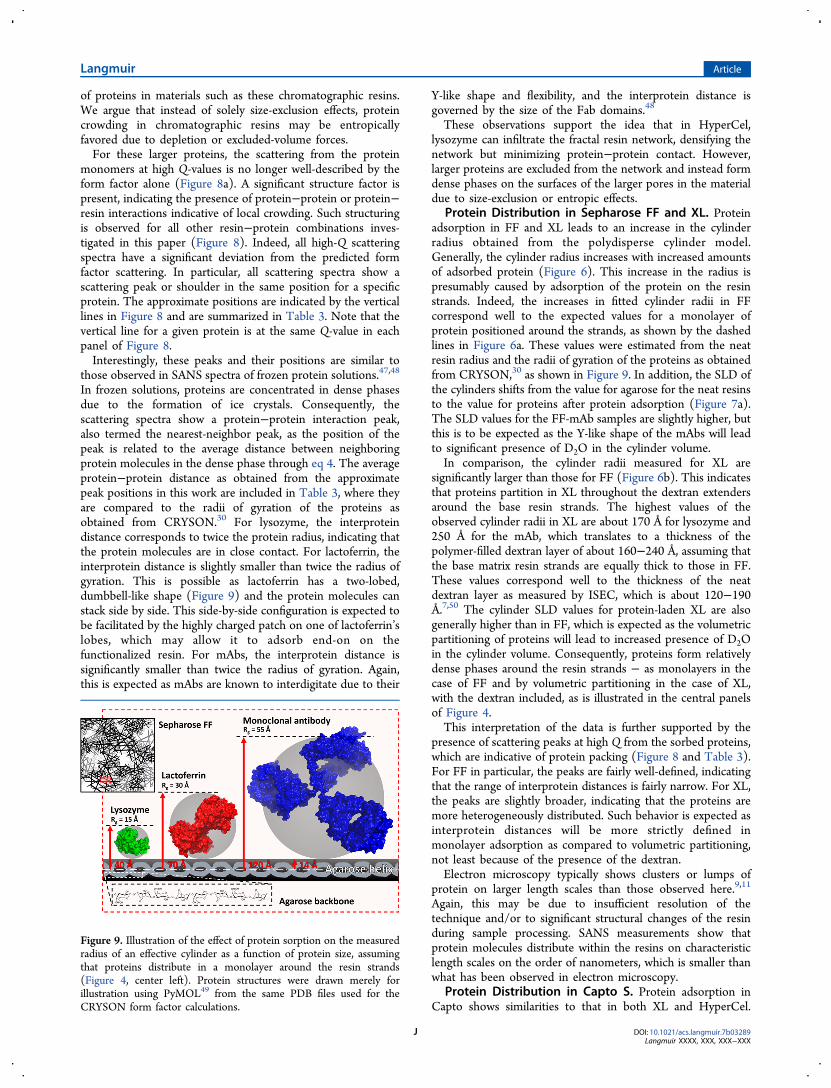
Protein Distribution in Sepharose FF and XL. Proteinadsorption in FF and XL leads to an increase in the cylinderradius obtained from the polydisperse cylinder model.Generally, the cylinder radius increases with increased amountsof adsorbed protein (Figure 6). This increase in the radius ispresumably caused by adsorption of the protein on the resinstrands. Indeed, the increases in fitted cylinder radii in FFcorrespond well to the expected values for a monolayer ofprotein positioned around the strands, as shown by the dashedlines in Figure 6a. These values were estimated from the neatresin radius and the radii of gyration of the proteins as obtainedfrom CRYSON,30 as shown in Figure 9. In addition, the SLD ofthe cylinders shifts from the value for agarose for the neat resinsto the value for proteins after protein adsorption (Figure 7a).The SLD values for the FF-mAb samples are slightly higher, butthis is to be expected as the Y-like shape of the mAbs will leadto significant presence of D2O in the cylinder volume.In comparison, the cylinder radii measured for XL are
significantly larger than those for FF (Figure 6b). This indicatesthat proteins partition in XL throughout the dextran extendersaround the base resin strands. The highest values of theobserved cylinder radii in XL are about 170 Å for lysozyme and250 Å for the mAb, which translates to a thickness of thepolymer-filled dextran layer of about 160−240 Å, assuming thatthe base matrix resin strands are equally thick to those in FF.These values correspond well to the thickness of the neatdextran layer as measured by ISEC, which is about 120−190Å.7,50 The cylinder SLD values for protein-laden XL are alsogenerally higher than in FF, which is expected as the volumetricpartitioning of proteins will lead to increased presence of D2Oin the cylinder volume. Consequently, proteins form relativelydense phases around the resin strands − as monolayers in thecase of FF and by volumetric partitioning in the case of XL,with the dextran included, as is illustrated in the central panelsof Figure 4.This interpretation of the data is further supported by the
presence of scattering peaks at high Q from the sorbed proteins,which are indicative of protein packing (Figure 8 and Table 3).For FF in particular, the peaks are fairly well-defined, indicatingthat the range of interprotein distances is fairly narrow. For XL,the peaks are slightly broader, indicating that the proteins aremore heterogeneously distributed. Such behavior is expected asinterprotein distances will be more strictly defined inmonolayer adsorption as compared to volumetric partitioning,not least because of the presence of the dextran.Electron microscopy typically shows clusters or lumps of
protein on larger length scales than those observed here.9,11
Again, this may be due to insufficient resolution of thetechnique and/or to significant structural changes of the resinduring sample processing. SANS measurements show thatprotein molecules distribute within the resins on characteristiclength scales on the order of nanometers, which is smaller thanwhat has been observed in electron microscopy.
Protein Distribution in Capto S. Protein adsorption inCapto shows similarities to that in both XL and HyperCel.
Figure 9. Illustration of the effect of protein sorption on the measuredradius of an effective cylinder as a function of protein size, assumingthat proteins distribute in a monolayer around the resin strands(Figure 4, center left). Protein structures were drawn merely forillustration using PyMOL49 from the same PDB files used for theCRYSON form factor calculations.
Langmuir Article
DOI: 10.1021/acs.langmuir.7b03289Langmuir XXXX, XXX, XXX−XXX
J
Lysozyme adsorption in Capto S shows the same behavior asthat in XL, with similar cylinder radii, SLDs, and interactionpeaks. Consequently, the interpretation is the same as for thatresin. However, lactoferrin and mAb adsorption in Capto ischaracterized by almost no change in the measured cylinderradius (Figure 6c). Similarly to the case for HyperCel, theselarger proteins seem to be excluded from at least the smallestpores in the resin matrix or within the dextran layer, makingthem unable to bind close to the base resin strands. However,they can presumably still attach to dextran extenders at thesurface of larger pores, as is shown in the bottom right panel ofFigure 4. Alternatively, similar to the behavior in HyperCel,these larger proteins in Capto may crowd due to entropicpartitioning. Such partitioning would help to explain thedifferences in protein transport observed between traditionaland dextran-modified resins. For dextran-modified resins, it hasbeen proposed that protein uptake occurs with a sharp uptakefront with incomplete saturation.8 The reason for theincomplete saturation was hypothesized to be the inefficientpacking of the protein, which can rearrange over time toaccommodate more protein. Entropic partitioning is a possiblemechanistic explanation for this protein rearrangement.
■ CONCLUSIONSSmall-angle neutron scattering allows in situ characterization ofresin architectures and the internal protein distributions, withprotein-scale resolution. The results obtained here show thatprotein molecules arrange in chromatographic resins onnanometer length scales, smaller than what has previouslybeen observed with conventional characterization techniques,and the results reflect the variability of these arrangements thatwould be expected as a function of resin architecture andprotein size. Dextran-modification or the fractal architectures ofcellulose-based materials can increase protein loading due tothe possibility of volumetric partitioning. However, highlycross-linked chromatographic materials can exhibit crowdingbehavior of larger proteins such as lactoferrin and mAbs due tosize-exclusion or entropic partitioning effects. While theseobservations confirm the structural origins of the increasedbinding capacities in the resins investigated, they could alsoexplain the higher salt sensitivity of larger proteins in thesematerials and their distinct transport behavior. Consequently,these observations can be used to guide design of chromato-graphic resins. Moreover, the techniques presented here allowcharacterization of novel and future resin materials, and themechanisms inferred to contribute to the observed behaviorcan certainly be applicable in other systems.
■ ASSOCIATED CONTENT*S Supporting InformationThe Supporting Information is available free of charge on theACS Publications website at DOI: 10.1021/acs.lang-muir.7b03289.
Scattering spectra and fitting parameters for all resin−protein combinations and loading conditions (PDF)
■ AUTHOR INFORMATIONCorresponding Author*E-mail: [email protected]. Telephone: 302-831-8989.ORCIDNorman J. Wagner: 0000-0001-9565-619XAbraham M. Lenhoff: 0000-0002-7831-219X
NotesThe authors declare no competing financial interest.
■ ACKNOWLEDGMENTSThe authors thank Amgen for donating the monoclonalantibody. This work was supported by National ScienceFoundation Grant No. CBET-1263966. N.J.W. acknowledgessupport under cooperative agreements # 70NANB12H239 and70NANB15H260 from NIST, U.S. Department of Commerce.The authors acknowledge the support of the National Instituteof Standards and Technology, U.S. Department of Commerce,in providing the neutron research facilities used in this work.This work utilized facilities supported in part by the NationalScience Foundation under Agreement No. DMR-0944772. Thestatements, findings, conclusions and recommendations arethose of the authors and do not necessarily reflect the view ofNIST or the U.S. Department of Commerce.
■ REFERENCES(1) Thommes, J. Investigations on Protein Adsorption to Agarose-Dextran Composite Media. Biotechnol. Bioeng. 1999, 62 (3), 358−362.(2) Cooper, C. L.; Dubin, P. L.; Kayitmazer, A. B.; Turksen, S.Polyelectrolyte−protein Complexes. Curr. Opin. Colloid Interface Sci.2005, 10 (1−2), 52−78.(3) Johansson, H.-O.; Van Alstine, J. M. Modeling of ProteinInteractions with Surface-Grafted Charged Polymers. Correlationsbetween Statistical Molecular Modeling and a Mean Field Approach.Langmuir 2006, 22 (21), 8920−8930.(4) Lenhoff, A. M. Protein Adsorption and Transport in Polymer-Functionalized Ion-Exchangers. J. Chromatogr. A 2011, 1218 (49),8748−8759.(5) Muller, E. Properties and Characterization of High CapacityResins for Biochromatography. Chem. Eng. Technol. 2005, 28 (11),1295−1305.(6) Yao, Y.; Lenhoff, A. M. Pore Size Distributions of Ion Exchangersand Relation to Protein Binding Capacity. J. Chromatogr. A 2006, 1126(1−2), 107−119.(7) Bowes, B. D.; Koku, H.; Czymmek, K. J.; Lenhoff, A. M. ProteinAdsorption and Transport in Dextran-Modified Ion-Exchange Media.I: Adsorption. J. Chromatogr. A 2009, 1216 (45), 7774−7784.(8) Bowes, B. D.; Lenhoff, A. M. Protein Adsorption and Transportin Dextran-Modified Ion-Exchange Media. III. Effects of Resin ChargeDensity and Dextran Content on Adsorption and Intraparticle Uptake.J. Chromatogr. A 2011, 1218 (40), 7180−7188.(9) Koku, H. Microstructure-Based Analysis and Simulation of Flowand Mass Transfer in Chromatographic Stationary Phases. Ph.D.Dissertation, University of Delaware, 2011.(10) Angelo, J. M.; Cvetkovic, A.; Gantier, R.; Lenhoff, A. M.Characterization of Cross-Linked Cellulosic Ion-Exchange Adsorbents:1. Structural Properties. J. Chromatogr. A 2013, 1319, 46−56.(11) Angelo, J. M.; Cvetkovic, A.; Gantier, R.; Lenhoff, A. M.Characterization of Cross-Linked Cellulosic Ion-Exchange Adsorbents:2. Protein Sorption and Transport. J. Chromatogr. A 2016, 1438, 100−112.(12) Hahn, R. Methods for Characterization of BiochromatographyMedia. J. Sep. Sci. 2012, 35 (22), 3001−3032.(13) Yao, Y.; Lenhoff, A. M. Determination of Pore SizeDistributions of Porous Chromatographic Adsorbents by InverseSize-Exclusion Chromatography. J. Chromatogr. A 2004, 1037 (1−2),273−282.(14) Tao, Y.; Carta, G.; Ferreira, G.; Robbins, D. Adsorption ofDeamidated Antibody Variants on Macroporous and Dextran-GraftedCation Exchangers: I. Adsorption Equilibrium. J. Chromatogr. A 2011,1218 (11), 1519−1529.(15) Ubiera, A. R.; Carta, G. Radiotracer Measurements of ProteinMass Transfer: Kinetics in Ion Exchange Media. Biotechnol. J. 2006, 1(6), 665−674.
Langmuir Article
DOI: 10.1021/acs.langmuir.7b03289Langmuir XXXX, XXX, XXX−XXX
K
(16) DePhillips, P.; Lenhoff, A. M. Pore Size Distributions of Cation-Exchange Adsorbents Determined by Inverse Size-Exclusion Chroma-tography. J. Chromatogr. A 2000, 883 (1−2), 39−54.(17) Koshari, S. H. S.; Wagner, N. J.; Lenhoff, A. M. Characterizationof Lysozyme Adsorption in Cellulosic Chromatographic MaterialsUsing Small-Angle Neutron Scattering. J. Chromatogr. A 2015, 1399,45−52.(18) Krueger, S.; Andrews, A. P.; Nossal, R. Small Angle NeutronScattering Studies of Structural Characteristics of Agarose Gels.Biophys. Chem. 1994, 53 (1−2), 85−94.(19) Svergun, D. I.; Koch, M. H. J. Small-Angle Scattering Studies ofBiological Macromolecules in Solution. Rep. Prog. Phys. 2003, 66 (10),1735−1782.(20) Grillo, I. Small-Angle Neutron Scattering and Applications inSoft Condensed Matter. In Soft-Matter Characterization; Borsali, R.,Pecora, R., Eds.; Springer: Berlin, 2008; pp 705−764.(21) Hammouda, B. Probing Nanoscale Structures - The SANSToolbox; National Institute of Standards and Technology: Gaithers-burg, MD, 2010.(22) Sivia, D. S. Elementary Scattering Theory, First ed.; OxfordUniversity Press: New York, 2011.(23) Koshari, S. H. S. Characterization of Lysozyme Adsorption inCellulosic Chromatographic Materials Using Small-Angle NeutronScattering. Master’s Thesis, University of Delaware, 2014.(24) Bowes, B. D.; Traylor, S. J.; Timmick, S. M.; Czymmek, K. J.;Lenhoff, A. M. Insights into Protein Sorption and Desorption onDextran-Modified Ion-Exchange Media. Chem. Eng. Technol. 2012, 35(1), 91−101.(25) Harinarayan, C.; Mueller, J.; Ljunglof, A.; Fahrner, R.; VanAlstine, J.; van Reis, R. An Exclusion Mechanism in Ion ExchangeChromatography. Biotechnol. Bioeng. 2006, 95 (5), 775−787.(26) Glinka, C. J.; Barker, J. G.; Hammouda, B.; Krueger, S.; Moyer,J. J.; Orts, W. J. The 30 M Small-Angle Neutron ScatteringInstruments at the National Institute of Standards and Technology.J. Appl. Crystallogr. 1998, 31 (3), 430−445.(27) Kline, S. R. Reduction and Analysis of SANS and USANS DataUsing IGOR Pro. J. Appl. Crystallogr. 2006, 39 (6), 895−900.(28) Hammouda, B. A New Guinier−Porod Model. J. Appl.Crystallogr. 2010, 43 (4), 716−719.(29) Guinier, A.; Fournet, G. Small-Angle Scattering of X-Rays, firsted.; John Wiley and Sons: New York, 1955.(30) Svergun, D. I.; Richard, S.; Koch, M. H. J.; Sayers, Z.; Kuprin, S.;Zaccai, G. Protein Hydration in Solution: Experimental Observationby X-Ray and Neutron Scattering. Proc. Natl. Acad. Sci. U. S. A. 1998,95 (5), 2267−2272.(31) Berman, H. M.; Westbrook, J.; Feng, Z.; Gilliland, G.; Bhat, T.N.; Weissig, H.; Shindyalov, I. N.; Bourne, P. E. The Protein DataBank; www.rcsb.org.(32) Diamond, R. Real-Space Refinement of the Structure of HenEgg-White Lysozyme. J. Mol. Biol. 1974, 82 (3), 371−391.(33) Thomassen, E. A. J.; van Veen, H. A.; van Berkel, P. H. C.;Nuijens, J. H.; Abrahams, J. P. The Protein Structure of RecombinantHuman Lactoferrin Produced in the Milk of Transgenic Cows CloselyMatches the Structure of Human Milk-Derived Lactoferrin. TransgenicRes. 2005, 14 (4), 397−405.(34) Harris, L. J.; Larson, S. B.; Hasel, K. W.; McPherson, A. RefinedStructure of an Intact IgG2a Monoclonal Antibody. Biochemistry 1997,36 (7), 1581−1597.(35) Sears, V. F. Neutron Scattering Lengths and Cross Sections.Neutron News 1992, 3 (3), 26−37.(36) Kienzle, P. Neutron activation and scattering calculator; http://www.ncnr.nist.gov/resources/activation/.(37) Svergun, D.; Barberato, C.; Koch, M. CRYSOL - a Program toEvaluate X-Ray Solution Scattering of Biological Macromolecules fromAtomic Coordinates. J. Appl. Crystallogr. 1995, 28, 768−773.(38) Arnott, S.; Fulmer, A.; Scott, W. E.; Dea, I. C. M.; Moorhouse,R.; Rees, D. A. The Agarose Double Helix and Its Function in AgaroseGel Structure. J. Mol. Biol. 1974, 90 (2), 269−284.
(39) Foord, S. A.; Atkins, E. D. Y. New X-Ray Diffraction Resultsfrom Agarose: Extended Single Helix Structures and Implications forGelation Mechanism. Biopolymers 1989, 28 (8), 1345−1365.(40) Schafer, S. E.; Stevens, E. S. A Reexamination of the Double-Helix Model for Agarose Gels Using Optical Rotation. Biopolymers1995, 36, 103−108.(41) Guenet, J.-M.; Rochas, C. Agarose Sols and Gels Revisited.Macromol. Symp. 2006, 242 (1), 65−70.(42) Amsterdam, A.; Er-El, Z.; Shaltiel, S. Ultrastructure of BeadedAgarose. Arch. Biochem. Biophys. 1975, 171 (2), 673−677.(43) Ogston, A. G. The Spaces in a Uniform Random Suspension ofFibres. Trans. Faraday Soc. 1958, 54, 1754.(44) Adams, M.; Dogic, Z.; Keller, S. L.; Fraden, S. EntropicallyDriven Microphase Transitions in Mixtures of Colloidal Rods andSpheres. Nature 1998, 393 (6683), 349−352.(45) Dogic, Z.; Fraden, S. Ordered Phases of Filamentous Viruses.Curr. Opin. Colloid Interface Sci. 2006, 11 (1), 47−55.(46) Zhou, H.-X.; Rivas, G.; Minton, A. P. MacromolecularCrowding and Confinement: Biochemical, Biophysical, and PotentialPhysiological Consequences. Annu. Rev. Biophys. 2008, 37 (1), 375−397.(47) Curtis, J. E.; Nanda, H.; Khodadadi, S.; Cicerone, M.; Lee, H. J.;McAuley, A.; Krueger, S. Small-Angle Neutron Scattering Study ofProtein Crowding in Liquid and Solid Phases: Lysozyme in AqueousSolution, Frozen Solution, and Carbohydrate Powders. J. Phys. Chem.B 2012, 116 (32), 9653−9667.(48) Castellanos, M. M.; Clark, N. J.; Watson, M. C.; Krueger, S.;McAuley, A.; Curtis, J. E. Role of Molecular Flexibility and ColloidalDescriptions of Proteins in Crowded Environments from Small-AngleScattering. J. Phys. Chem. B 2016, 120 (49), 12511−12518.(49) DeLano, W. L. The PyMOL Molecular Graphics System; DeLanoScientific: San Carlos, CA, 2002.(50) Angelo, J. M. Mechanisms Underlying Protein Sorption andTransport within Polysaccharide-Based Stationary Phases for Ion-Exchange Chromatography. Ph.D. Dissertation, University of Dela-ware, 2016.
■ NOTE ADDED AFTER ASAP PUBLICATIONThis paper was published ASAP on December 29, 2017, withan incorrect value in the Methods section and with other minorerrors in the text. The corrected version was reposted onJanuary 4, 2018.
Langmuir Article
DOI: 10.1021/acs.langmuir.7b03289Langmuir XXXX, XXX, XXX−XXX
L