effects of pulsed radar waveforms on lte (tdd)...
TRANSCRIPT

Effects of Pulsed Radar Waveforms on LTE (TDD) Receiver Performance
January 2014
Robert Sole: [email protected] Frank Sanders: [email protected]
John Carroll: [email protected]
National Telecommunications and Information Administration 1401 Constitution Avenue, NW
Washington, DC 20230

2
Background
FCC 3.5 GHz NPRM: Calls for effects of pulsed radar signals on performance of LTE receivers to be investigated
NTIA / ITS action to date: Designed tests to demonstrate the effects of pulsed radar signals
on the performance of LTE receivers Worked with a carrier to perform tests in realistic conditions Published results in an NTIA Technical Report (TR-14-499)

3
Test Design and Execution
Develop a matrix of test waveforms Types of radar signals in and around 3550-3650 MHz
Not specifically matched to any particular operational radars Span the parameter range of existing and future radar systems in band
2 Gaussian noise waveforms Other waveforms used in previous ECC tests
Work with a carrier to perform the tests Inject radar waveforms into TDD 4G LTE base station receiver Measure
Data throughput (handset to base station) Block error rate
Receiver noise

Radar Waveform Matrix
4
P0N (carrier wave) pulsed radar waveform parameters.
Q3N (swept-frequency) pulsed radar waveform parameters, 1 MHz/µs chirp. Duty Cycle
(%) Chirped Pulse Group 1 Chirped Pulse Group 2 Chirped Pulse Group 3
PW (µs) PRR (s-1) PW (µs) PRR (s-1) PW (µs) PRR (s-1)
1 10 1000 Q3N-1 1 10,000
Q3N-2 0.33 30,000 Q3N-3
10 100 20 1000 200 Q3N-4 10 10,000
Q3N-5 3.3 30,000 Q3N-6
20 200 20 1000 100 Q3N-7 20 10,000
Q3N-8 6.6 30,000 Q3N-9
30 300 20 1000 67 Q3N-10 30 20 10,000 6,667
Q3N-11 10 30,000 Q3N-12
Duty Cycle (%) PRR = 1000/sec PRR = 3000/sec PRR = 10,000/sec
0.1 PW = 1 µs P0N-1
PW = 0.33 µs P0N-2
PW = 0.1 µs P0N-3
1 PW = 10 µs P0N-4
PW = 3.33 µs P0N-5
PW = 1 µs P0N-6
3 PW = 30 µs P0N-7
PW = 10 µs P0N-8
PW = 3 µs P0N-9
10 PW = 100 µs P0N-10
PW = 33.3 µs P0N-11
PW = 10 µs P0N-12

5
Additional special interference waveforms used in testing.
Radar Waveforms (continued)
Interference waveform design overall goal: vary interference duty cycle (DC) values in an approximately logarithmic progression
Chirp bandwidth of Q3N (chirped) pulses was an additional degree of freedom in the waveform design. Solution: Hold chirp frequency-sweeping rate constant at 1 MHz /µs Hold pulse widths to 20 µs Full explanation and documentation in NTIA Technical Report TR-14-499
Additional special interference waveforms used in testing. Duty Cycle (%) Waveform Names PW (µs) PRR (pulses/sec)
0.4 ECC-1 — WFM-1 4 1000
3 ECC-2 — WFM-2 100 300
.05 TDWR — P0N-13 1 500

6
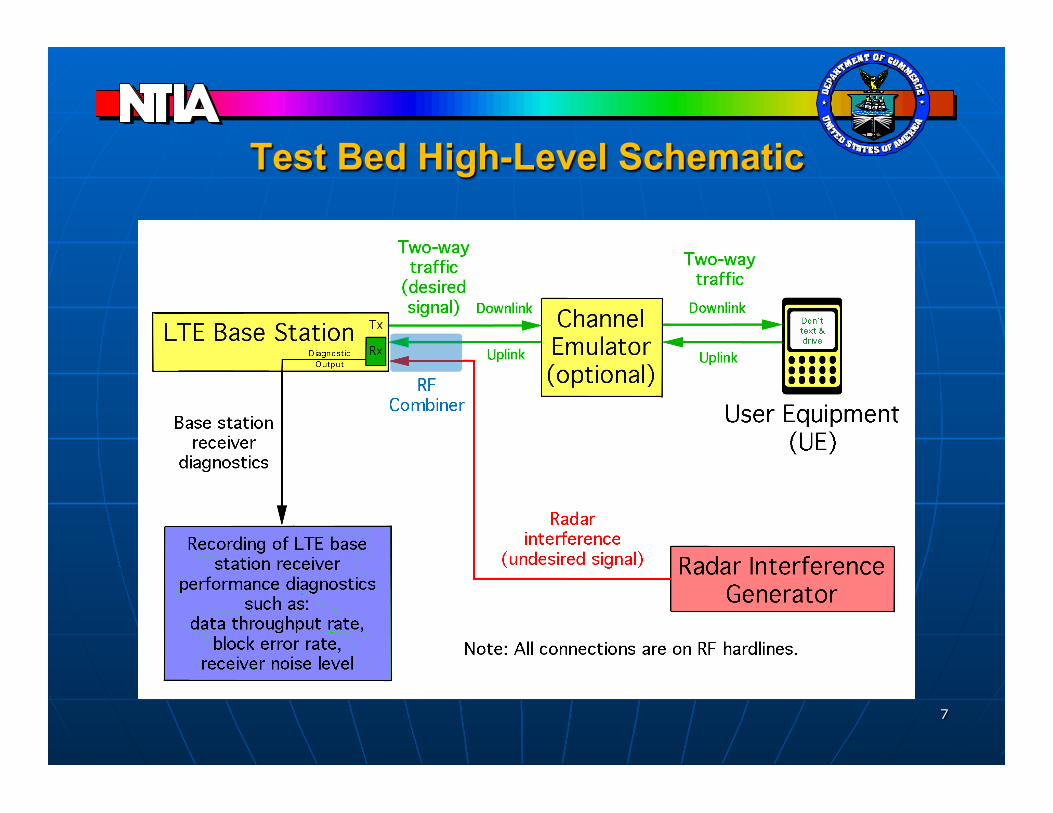
Coupling Scenario
Air search radars’ beams look slightly above the local horizons, coupling most strongly into base stations
Test bed needed to replicate this coupling scenario
7
Test Bed High-Level Schematic
8
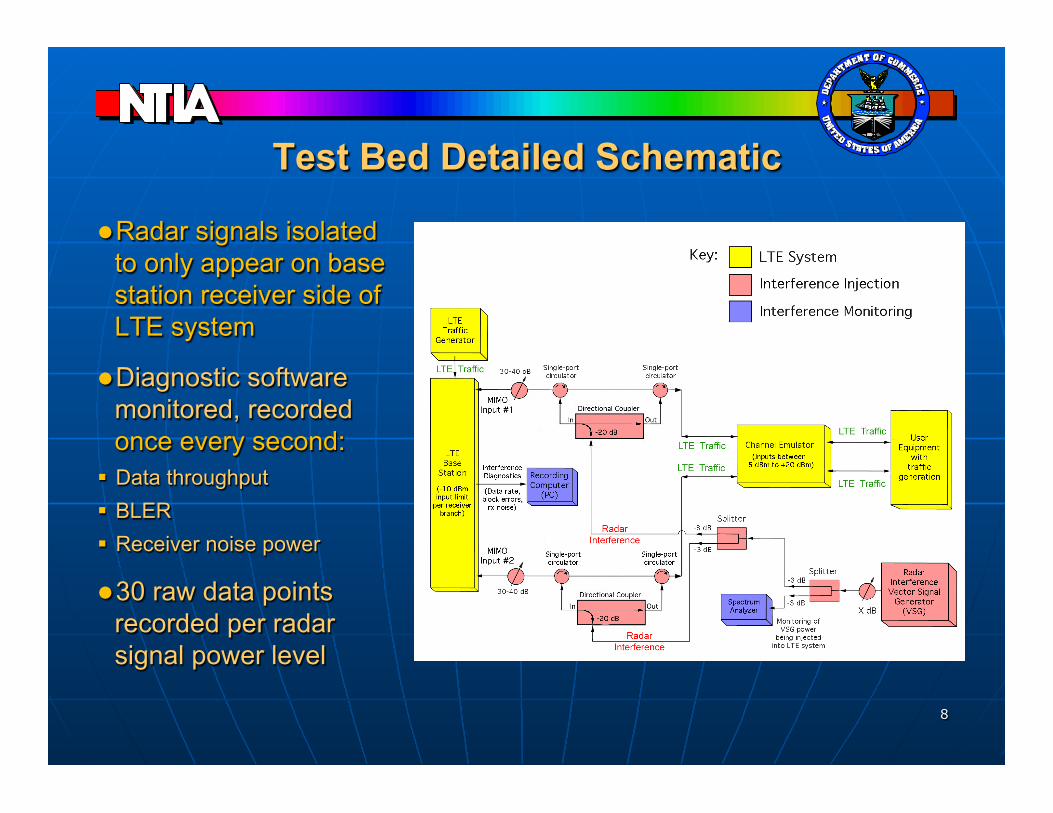
Test Bed Detailed Schematic
Radar signals isolated to only appear on base station receiver side of LTE system
Diagnostic software monitored, recorded once every second:
Data throughput BLER Receiver noise power
30 raw data points recorded per radar signal power level

Baseline Test State
Handset → base station nominal data rate 16 Mbit/s with no radar signal present
Handset power at base station receiver input = -83 dBm/180 kHz resource block, held constant throughout
Radar signals not synchronized to any TDD time slots
Not tested: Call initiation and call hand-off LTE receiver saturation and burnout levels
9

Baseline Test Methodology
Un-modulated radar signals on-tuned with center frequency of the 20 MHz wide LTE channel Chirp center on-tuned with the LTE center frequency Chirp was low to high frequency, linear
Radar signal power Initiated at a low level Increased in 4 and 10 dB steps to close to maximum permissible
power set by the carrier’s conditions Pulsed radar signal continuously applied at each power level
Data post processed to produce figures showing data throughput, BLER, and receiver noise level as a function of S/(I+N) for each radar waveform
10

Test Results
NTIA is not specifying any particular acceptable radar signal power level for LTE receivers for the NPRM
NTIA work has only shown effects that can happen in the presence of radar signals Some radar waveforms had a drastic effect on the data
throughput and caused the link to crash Some radar waveforms had moderate effects A few radar waveforms had no effect NTIA has not investigated why or how the effects are different
NTIA looks to the 4G LTE Industry to assist in analyzing the data and the results, and perhaps performing additional tests
11

12
PW = 100 µs, PRR = 1,000/sec, DC = 10%
Example S/(I+N): Extreme Effect on Throughput Waveform P0N-10

13
PW = 10 µs, PRR = 10,000/sec, DC = 10%
Example S/(I+N): Extreme Effect on Throughput Waveform Q3N-5

14
PW = 3.3 µs, PRR = 30,000/sec, DC = 10%
Example S/(I+N): Moderate Effect on Throughput Waveform Q3N-6

15
PW = 20 µs, PRR = 100/sec (equivalent to PW = 200 µs, PRR = 1,000/sec), DC = 20%
Example S/(I+N): No Effect on Throughput Waveform Q3N-7

Future Work NTIA looks forward to working with Industry on tests to: Test the authors’ hypothesis that similar tests on a micro-cell LTE system will yield similar results
Theoretical analysis to better understand why various radar interference waveforms have particular effects
Increase understanding of LTE signal detection and processing
Determine the non-linear effects of saturation and front-end overload from radar signals on LTE receivers
Determine effects of a variety of radar beam-dwell periods on LTE base station receivers by testing with bursts of pulses to simulate radar beam scanning or antenna rotation
16
References [1] “Proposal to Create a Citizen’s Broadband Service in the 3550-3650 MHz
Band”, FCC Docket No. 12-354. http://www.fcc.gov/document/enabling-innovative-small-cell-use-35-ghz-band-nprm-order
[2] “An Assessment of the Near-Term Viability of Accommodating Wireless Broadband Systems in the 1675-1710 MHz, 1755-1780 MHz, 3500-3650 MHz, 4200-4220 MHz and 4380-4400 MHz Bands (President's Spectrum Plan Report)”, NTIA, U.S. Dept. of Commerce, Nov. 2010. http://www.ntia.doc.gov/report/2010/assessment-near-term-viability-accommodating-wireless-broadband-systems-1675-1710-mhz-17
[3] CEPT ECC Report 174, “Compatibility Between the Mobile Service in the Band 2500-2690 MHz and the radiodetermination service in the band 2700-2900 MHz”, CEPT Electronic Communications Committee, Mar. 2012. http://www.erodocdb.dk/docs/doc98/official/Pdf/ECCRep174.pdf
17
References [4] “LTE radio link budgeting and RF planning”, Section 2.1 (Typical parameter
values). https://sites.google.com/site/lteencyclopedia/lte-radio-link-budgeting-and-rf-planning
[5] Sanders, F. H., R. L. Hinkle and B. J. Ramsey, “Measurement Procedures for the Radar Spectrum Engineering Criteria (RSEC)”, NTIA Technical Report TR-05-420, U.S. Dept. of Commerce, Mar. 2005. http://www.its.bldrdoc.gov/publications/2450.aspx
[6] Sanders, F. H., R. L. Sole, J. E. Carroll, G. S. Secrest and T. Lynn Allmon, "Analysis and Resolution of RF Interference to Radars Operating in the Band 2700-2900 MHz from Broadband Communication Transmitters," NTIA Technical Report TR-13-490, U.S. Dept. of Commerce, Oct. 2012. http://www.its.bldrdoc.gov/publications/2684.aspx
[7] Sanders, F. H., “The Rabbit Ears Pulse Envelope Phenomenon in Off-Fundamental Detection of Pulsed Signals”, NTIA Technical Report TR-12-487, U.S. Dept. of Commerce, Jul. 2012. http://www.its.bldrdoc.gov/publications/2678.aspx 18

References [8] Sanders, F. H., R. L. Hinkle and B. J. Ramsey, “Analysis of Electromagnetic
Compatibility Between Radar Stations and 4 GHz Earth Stations”, NTIA Technical Report TR-94-313, U.S. Dept. of Commerce, Jul. 1994. http://www.its.bldrdoc.gov/publications/2340.aspx
[9] Sanders, F. H., Sole, R. L., J. E. Carroll, G. S. Secrest and T. L. Allmon, “Analysis and Resolution of RF Interference to Radars Operating in the Band 2700-2900 MHz from Broadband Commuication Transmitters,” NTIA Technical Report TR-13-490, Oct. 2012. Available: http://www.its.bldrdoc.gov/publications/2684.aspx
[10] Sanders, F. and R. Dalke, “Relationships Between Measured Power and Measurement Bandwidth for Frequency-Modulated (Chirped) Pulses,” NTIA Technical Report TR-12-488, Aug. 2012. Available: http://www.its.bldrdoc.gov/publications/2680.aspx
[11] Sanders, F., J. E. Carroll, G. A. Sanders and R. L. Sole, “Effects of Radar Interference on LTE Base Station Receiver Performance,” NTIA Technical Report TR-14-499, Dec. 2013. Available: http://www.its.bldrdoc.gov/publications/2742.aspx 19

This Presentation
20