effects of milling and other repairs on the smoothness of ...pcs data showed that overlays were...
TRANSCRIPT

August 2014Research Report: UCPRC-RR-2013-09.1
Effects of Milling and Other Repairs on the
Smoothness of Overlays on Asphalt Pavements from
2000 to 2009
Authors:Shawn S. Hung, Arash Rezaei, and John T. Harvey
Version 1.1
Work Conducted Under Partnered Pavement Research Center Strategic Plan Element No. 4.42:
Effects of Milling and Other Repairs on Smoothness of Overlays on Asphalt Pavements
PREPARED FOR: California Department of Transportation Division of Research, Innovation and System
Information (DRISI) Office of Materials and Infrastructure
PREPARED BY:
University of CaliforniaPavement Research Center
UC Davis and UC Berkeley


UCPRC-RR-2013-09.1 i
TECHNICAL REPORT DOCUMENTATION PAGE 1. REPORT NUMBER
UCPRC-RR-2013-09.1
2. GOVERNMENT ASSOCIATION NUMBER
3. RECIPIENT’S CATALOG NUMBER
4. TITLE AND SUBTITLE
Effects of Milling and Other Repairs on the Smoothness of Overlays on Asphalt Pavements from 2000 to 2009
5. REPORT PUBLICATION DATE
6. PERFORMING ORGANIZATION CODE
7. AUTHOR(S)
S. S. Hung, A. Rezaei, and J. T. Harvey
8. PERFORMING ORGANIZATION REPORT NO.
9. PERFORMING ORGANIZATION NAME AND ADDRESS University of California Pavement Research Center Department of Civil and Environmental Engineering, UC Davis 1 Shields Avenue Davis, CA 95616
10. WORK UNIT NUMBER
11. CONTRACT OR GRANT NUMBER
12. SPONSORING AGENCY AND ADDRESS
California Department of Transportation Division of Research, Innovation, and System Information P.O. Box 942873 Sacramento, CA 94273-0001
13. TYPE OF REPORT AND PERIOD COVERED
Research Report 2013 – 2014
14. SPONSORING AGENCY CODE
15. SUPPLEMENTAL NOTES
16. ABSTRACT
The application of asphalt overlays comprises a significant percentage of the maintenance activities undertaken to improve the condition of existing asphalt pavements, and greater attention is now being paid to improving surface smoothness by constructing smoother overlays. The expected benefits of smoother overlays include longer service life due to decreased dynamic loading, improved fuel economy, and greater road-user comfort. In this study, data from the California Department of Transportation (Caltrans) Pavement Condition Survey (PCS) for projects built between 2000 and 2009 were used to investigate the effects of repairs, pavement pre-overlay smoothness (in terms of International Roughness Index, IRI), overlay mix type (dense-graded, gap-graded, open-graded), and binder type (rubberized versus conventional or polymer-modified) on initial post-construction overlay smoothness. The results are based on overlays constructed prior to implementation of the Caltrans smoothness specification for overlay construction. Linear mixed effects models were used in the analysis to take into account the variation across random effect variables. In this study, overlay smoothness was measured in terms of IRI. The analysis results indicated that the pavement pre-overlay IRI was the most important variable affecting overlay smoothness: pavements with lower pre-overlay IRI were smoother than those with higher pre-overlay IRI. When the pre-overlay condition was poor, increasing overlay thickness was also found to have a significant effect on post-overlay smoothness. In terms of pre-overlay repairs, analysis of Caltrans PCS data showed that overlays were smoother when digouts (milling and patching in the wheelpaths) were performed compared with milling of the entire surface prior to the overlay. The effects of overlay mix type and binder type were dependent on the pre-existing pavement condition and/or other factors. Note: This report (version 1.1) was revised in December 2017 to clarify that the IRI measurements presented were made after the close of each construction contract and therefore they include the effects of any grinding that Caltrans required the contractor to perform prior to that close. The revisions appear in the executive summary (introduction, conclusions and recommendations), Chapter 1, Section 3.1.1, Section 4.1, and Section 4.2.
17. KEY WORDS
Smoothness, pre-overlay surface, milling, thickness, rubberized binder
18. DISTRIBUTION STATEMENT
No restrictions. This document is available to the public through the National Technical Information Service, Springfield, VA 22161
19. SECURITY CLASSIFICATION (of this report)
Unclassified
20. NUMBER OF PAGES 72
21. PRICE None
Reproduction of completed page authorized

ii UCPRC-RR-2013-09.1
UCPRC ADDITIONAL INFORMATION DRAFT STAGE
Stage 6, final version
PARTNERED PAVEMENT RESEARCH CENTER STRATEGIC PLAN ELEMENT NUMBER
4.42
FHWA NUMBER CA152363A
VERSION NUMBER 1.1
CALTRANS TECHNICAL LEAD AND REVIEWER(S) S. Balasubramanian and P. Vacura
PROPOSALS FOR IMPLEMENTATION It is recommended that milling (cold planning) not be used as a means to improve smoothness prior to overlays when the pre-overlay IRI is less than 120 in./mile. Changes in Caltrans milling practice since 2009 may have made this recommendation unnecessary for pavements constructed since that time, but this should be investigated using projects built after the change to Caltrans smoothness specifications in 2013. Second, consider separate PaveM performance equations for overlays with and without digouts. Third, compare the results obtained in this study with smoothness values obtained since implementation of the Caltrans smoothness specification to see if improvements were made, and if adjustments to the specification are needed or desired.
RELATED DOCUMENTS
SIGNATURES
S. S. Hung FIRST AUTHOR
J.T. Harvey P. Tohme TECHNICAL REVIEW
D. Spinner EDITOR
J.T. Harvey PRINCIPAL INVESTIGATOR
S. Balasubramanian P. Vacura CALTRANS TECH. LEADS
T. Joseph Holland CALTRANS CONTRACT MANAGER
Reproduction of completed page authorized

UCPRC-RR-2013-09.1 iii
TABLE OF CONTENTS
LIST OF FIGURES .............................................................................................................................................. ivLIST OF TABLES ................................................................................................................................................. vDISCLAIMER STATEMENT ............................................................................................................................ viPROJECT OBJECTIVES .................................................................................................................................. viiEXECUTIVE SUMMARY .................................................................................................................................. ix
Recommendations .......................................................................................................................................... xiiLIST OF ABBREVIATIONS ............................................................................................................................ xivLIST OF TEST METHODS AND SPECIFICATIONS .................................................................................. xiv1 INTRODUCTION .......................................................................................................................................... 12 LITERATURE REVIEW .............................................................................................................................. 5
2.1 Factors that Affect Overlay Smoothness ................................................................................................... 52.1.1Pre-Overlay Repairs ............................................................................................................................. 52.1.2Overlay Thickness ................................................................................................................................ 52.1.3Pavement Smoothness Prior to Overlay ............................................................................................... 62.1.4Overlay Materials ................................................................................................................................. 62.1.5Other Factors ........................................................................................................................................ 7
2.2 Summary of the Factors Affecting Overlay Smoothness Found in Previous Studies ............................... 73 INVESTIGATION OF FACTORS AFFECTING OVERLAY SMOOTHNESS ...................................... 9
3.1 Data Extraction and Data Mining ............................................................................................................. 93.1.1Caltrans PCS Data ................................................................................................................................ 93.1.2LTPP SPS-5 Data ................................................................................................................................ 11
3.2 Data Analysis .......................................................................................................................................... 113.2.1Caltrans PCS Data ............................................................................................................................... 113.2.2Re-Analysis of the LTPP SPS-5 Data ................................................................................................ 33
4 CONCLUSIONS AND RECOMMENDATIONS ...................................................................................... 394.1 Conclusions ............................................................................................................................................. 394.2 Recommendations ................................................................................................................................... 40
REFERENCES .................................................................................................................................................... 42APPENDIX .......................................................................................................................................................... 44
iv UCPRC-RR-2013-09.1
LIST OF FIGURES
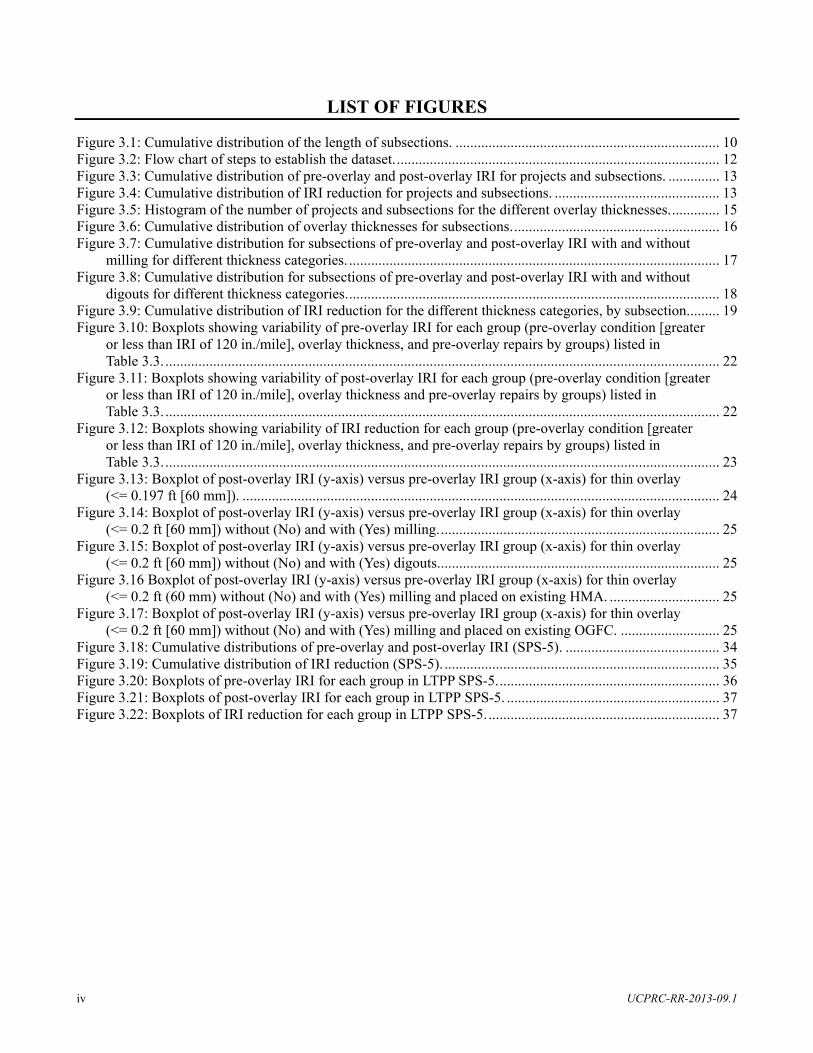
Figure 3.1: Cumulative distribution of the length of subsections. ........................................................................ 10Figure 3.2: Flow chart of steps to establish the dataset. ........................................................................................ 12Figure 3.3: Cumulative distribution of pre-overlay and post-overlay IRI for projects and subsections. .............. 13Figure 3.4: Cumulative distribution of IRI reduction for projects and subsections. ............................................. 13Figure 3.5: Histogram of the number of projects and subsections for the different overlay thicknesses. ............. 15Figure 3.6: Cumulative distribution of overlay thicknesses for subsections. ........................................................ 16Figure 3.7: Cumulative distribution for subsections of pre-overlay and post-overlay IRI with and without
milling for different thickness categories. ..................................................................................................... 17Figure 3.8: Cumulative distribution for subsections of pre-overlay and post-overlay IRI with and without
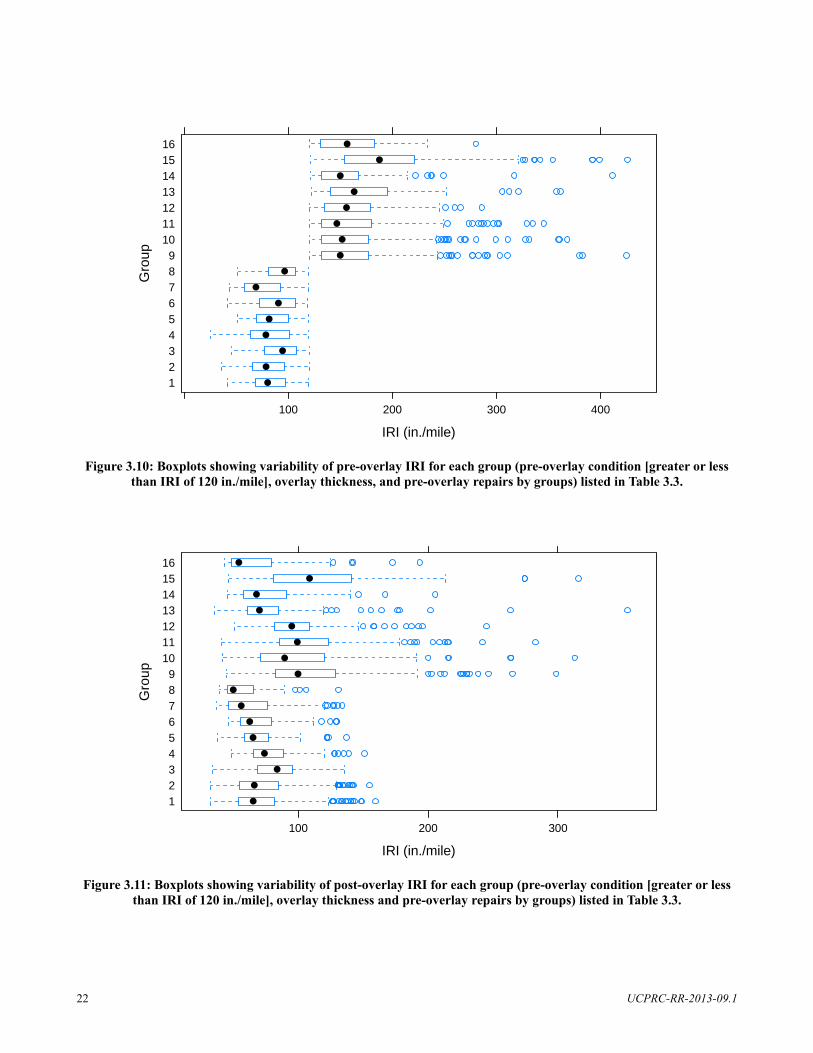
digouts for different thickness categories. ..................................................................................................... 18Figure 3.9: Cumulative distribution of IRI reduction for the different thickness categories, by subsection. ........ 19Figure 3.10: Boxplots showing variability of pre-overlay IRI for each group (pre-overlay condition [greater
or less than IRI of 120 in./mile], overlay thickness, and pre-overlay repairs by groups) listed in Table 3.3. ....................................................................................................................................................... 22
Figure 3.11: Boxplots showing variability of post-overlay IRI for each group (pre-overlay condition [greater or less than IRI of 120 in./mile], overlay thickness and pre-overlay repairs by groups) listed in Table 3.3. ....................................................................................................................................................... 22
Figure 3.12: Boxplots showing variability of IRI reduction for each group (pre-overlay condition [greater or less than IRI of 120 in./mile], overlay thickness, and pre-overlay repairs by groups) listed in Table 3.3. ....................................................................................................................................................... 23
Figure 3.13: Boxplot of post-overlay IRI (y-axis) versus pre-overlay IRI group (x-axis) for thin overlay (<= 0.197 ft [60 mm]). .................................................................................................................................. 24
Figure 3.14: Boxplot of post-overlay IRI (y-axis) versus pre-overlay IRI group (x-axis) for thin overlay (<= 0.2 ft [60 mm]) without (No) and with (Yes) milling. ............................................................................ 25
Figure 3.15: Boxplot of post-overlay IRI (y-axis) versus pre-overlay IRI group (x-axis) for thin overlay (<= 0.2 ft [60 mm]) without (No) and with (Yes) digouts. ............................................................................ 25
Figure 3.16 Boxplot of post-overlay IRI (y-axis) versus pre-overlay IRI group (x-axis) for thin overlay (<= 0.2 ft (60 mm) without (No) and with (Yes) milling and placed on existing HMA. .............................. 25
Figure 3.17: Boxplot of post-overlay IRI (y-axis) versus pre-overlay IRI group (x-axis) for thin overlay (<= 0.2 ft [60 mm]) without (No) and with (Yes) milling and placed on existing OGFC. ........................... 25
Figure 3.18: Cumulative distributions of pre-overlay and post-overlay IRI (SPS-5). .......................................... 34Figure 3.19: Cumulative distribution of IRI reduction (SPS-5). ........................................................................... 35Figure 3.20: Boxplots of pre-overlay IRI for each group in LTPP SPS-5. ............................................................ 36Figure 3.21: Boxplots of post-overlay IRI for each group in LTPP SPS-5. .......................................................... 37Figure 3.22: Boxplots of IRI reduction for each group in LTPP SPS-5. ............................................................... 37

UCPRC-RR-2013-09.1 v
LIST OF TABLES
Table 2.1: Potential Factors Affecting Overlay Smoothness Included in Earlier Studies ....................................... 8Table 3.1: Number of Projects and Subsections for Different Overlay Thickness ................................................ 14Table 3.2: Caltrans 2006 Standard Specifications for Asphalt Lift Thickness ...................................................... 15Table 3.3: Descriptive Statistics of Dataset Prior to Further Division by Binder and Mix Type .......................... 21Table 3.4: List of Regression Models .................................................................................................................... 30Table 3.5: Significance of Independent Variables and Akaike Information Criterion for Regression Models
(α=0.05) ......................................................................................................................................................... 31Table 3.6: Significance of Variables in Different Pre-Overlay Conditions (α=0.05) for Models 9 and 10 with
Pre-Overlay IRI Divided at 120 in./mile ....................................................................................................... 32Table 3.7: Significance of Variables in Different Pre-Overlay Conditions (α=0.05) for Models 11 through 14
with Pre-Overlay IRI Divided at 95, 120, and 170 in./mile .......................................................................... 32Table 3.8: Significance of Variables in Different Pre-Overlay Conditions (α=0.05) for Models 15 and 16 ......... 33Table 3.9: Descriptive Statistics of Dataset (SPS-5) ............................................................................................. 36Table 3.10: Significance of Variables in Different Pre-Overlay Condition (α=0.05) for Models 17 through 19 .. 38Table A.1: Descriptive Statistics of Dataset .......................................................................................................... 44Table A.2: Number of Subsections for Each Group (Milling) .............................................................................. 46Table A.3: Number of Subsections for Each Group (Digouts) ............................................................................. 47Table A.4: Regression Results of Model 1 (α=0.05) ............................................................................................. 47Table A.5: Regression Results of Model 2 (α= 0.05) ............................................................................................ 48Table A.6: Regression Results of Model 3 (α= 0.05) ............................................................................................ 48Table A.7: Regression Results of Model 4 (α= 0.05) ............................................................................................ 48Table A.8: Regression Results of Model 5 (α= 0.05) ............................................................................................ 49Table A.9: Regression Results of Model 6 (α= 0.05) ............................................................................................ 49Table A.10: Regression Results of Model 7 (α= 0.05) .......................................................................................... 49Table A.11: Regression Results of Model 8 (α= 0.05) .......................................................................................... 50Table A.12: Regression Results of Model 9 (α= 0.05) .......................................................................................... 50Table A.13: Regression Results of Model 10 (α=0.05) ......................................................................................... 50Table A.14: Regression Results of Model 11 (α=0.05) ......................................................................................... 51Table A.15: Regression Results of Model 12 (α=0.05) ......................................................................................... 51Table A.16: Regression Results of Model 13 (α=0.05) ......................................................................................... 51Table A.17: Regression Results of Model 14 (α=0.05) ......................................................................................... 52Table A.18: Regression Results of Model 15 (α=0.05) ......................................................................................... 52Table A.19: Regression Results of Model 16 (α=0.05) ......................................................................................... 53Table A.20: Regression Results of Model 17 (α=0.05) ......................................................................................... 53Table A.21: Regression Results of Model 18 (α=0.05) ......................................................................................... 54Table A.22: Regression Results of Model 19 (α=0.05) ......................................................................................... 54

vi UCPRC-RR-2013-09.1
DISCLAIMER STATEMENT
This document is disseminated in the interest of information exchange. The contents of this report reflect the views
of the authors who are responsible for the facts and accuracy of the data presented herein. The contents do not
necessarily reflect the official views or policies of the State of California or the Federal Highway Administration.
This publication does not constitute a standard, specification or regulation. This report does not constitute an
endorsement by Caltrans of any product described herein.
For individuals with sensory disabilities, this document is available in alternate formats. For information, call
(916) 654-8899, TTY 711, or write to California Department of Transportation, Division of Research, Innovation
and System Information, MS-83, P.O. Box 942873, Sacramento, CA 94273-0001.
ACKNOWLEDGMENTS
The authors would like to thank the following people for technical direction and advice: Peter Vacura and Srikanth
Balasubramanian of the Caltrans Pavement Program, Office of Asphalt Pavements, who served as technical leads,
T. Joe Holland, the Caltrans contract manager and DRISI Technical Advisor, and Rupinder (Bobby) Dosanjh,
who also offered technical guidance at different times during the project. Haiping Zhou of the Caltrans Office of
Asphalt Pavements reviewed the Stage 4.2 report. The authors would also like to thank the Pavement Program
Office of Pavement Management and Performance for providing Caltrans Pavement Condition Survey data.

UCPRC-RR-2013-09.1 vii
PROJECT OBJECTIVES
The goal of this project, Partnered Pavement Research Center Strategic Plan Element (PPRC SPE) 4.42, “Effects
of Milling and Other Repairs on Smoothness of Overlays,” was to provide up-to-date information and technical
assistance that will support the development of guidelines and specifications for pre-overlay treatments and the
smoothness of overlays for the California Department of Transportation (Caltrans) based on the results of
measurements, the analysis of construction projects, and the benefits/costs that are based on them.
The objectives of this study were achieved through the following tasks:
1. Review the existing literature to identify potential smoothness levels achievable with different initial
surface profiles and different pre-overlay treatments.
2. Develop a factorial for the selection of construction projects that considers the explanatory variables,
including pre-overlay pavement condition, overlay thickness, pre-overlay repairs, overlay mix type, and
material used. Other variables were considered but discarded based on initial statistical review or lack of
information, including underlying pavement type (except for certain cases which were considered) and
structural thickness, paving sequence, paving season, climate region, and existing distresses.
3. Work with Caltrans district offices and headquarters to identify planned overlay projects and make
arrangements for testing on them to include several types of pre-overlay treatments. Characterize
pavement surfaces before overlay projects begin and after they are completed.
4. Analyze the data collected to determine the effects of the explanatory variables on overlay smoothness
and the benefit-to-cost ratio of different pre-overlay treatment strategies.
5. Monitor the performance of the overlays in order to quantify the functional performance of the different
strategies over time.
6. Prepare annual construction summaries and analysis reports, and a summary report that details the
research and findings.
This report completes the work of Tasks 1, 2, and 4, except that benefit-to-cost was not evaluated because it was
found that a number of the pre-overlay strategies had no benefit.

viii UCPRC-RR-2013-09.1
(This page intentionally left blank)

UCPRC-RR-2013-09.1 ix
EXECUTIVE SUMMARY
The primary purpose of the study presented in this report was to investigate the effects that pre-overlay pavement
condition, overlay thickness, pre-overlay repairs, mix type (based on aggregate gradation), and binder type have
on the smoothness of overlays. Previous studies were reviewed to determine the possible factors that might affect
overlay smoothness. Using data mining, construction projects appropriate for data analysis were selected from
databases provided by the Caltrans Pavement Program. Statistical analysis was then used to determine the effects
of different explanatory variables, and the results were used to make recommendations for the design of overlays
based on existing pavement condition.
The study analyzed the following factors in order to determine their effects on constructed overlay smoothness:
initial pavement smoothness prior to overlay; overlay thickness; overlay mix type (dense- or gap-graded versus
open-graded); binder type (rubberized versus conventional or polymer-modified); and pre-overlay repairs, which
consist of milling (milling of entire lane width) and digouts (milling and patching of wheelpaths only).
The data used in this study were taken from the Caltrans Pavement Condition Survey (PCS) between the years
2000 and 2009, a period during which as-built overlay smoothness was controlled with a specification based on
the California Profilograph. In September 2013, Caltrans implemented a new Standard Special Provision
(SSP) 39-1.12 for asphalt pavement to replace Standard Specifications Section 39-1.12, and revised SSP 40-1 for
PCC pavement, both of which require the contractor to determine pavement smoothness profiles using an inertial
profiler and to use the International Roughness Index (IRI) as the roughness parameter for overlay construction
smoothness. However, even though the asphalt overlay results in this study are based on overlays constructed
prior to implementation of these new Caltrans smoothness specifications based on IRI, IRI was still used as the
roughness parameter. The IRI measurements presented were made after the close of each construction contract
and therefore they include the effects of any grinding that Caltrans required the contractor to perform prior to that
close.
The scope of this study only includes asphalt overlays on existing asphalt surfaces built by contractors for both
the Caltrans maintenance (HM) and rehabilitation (HA22) programs, including the Capital Preventive
Maintenance (CAPM) overlays that are part of the latter. This report does not include asphalt overlays on PCC
surfaces.
Along with the data obtained from the Caltrans PCS, this study also extracted data from other Caltrans sources
that contained information not included in the PCS. Construction as-built information (as-built thicknesses,
materials, and construction dates) was obtained from the Caltrans Division of Construction through the Caltrans

x UCPRC-RR-2013-09.1
document retrieval system. However, the construction information available did not include pavement
maintenance performed directly by Caltrans maintenance personnel.
In order to provide the level of detail needed for analysis, the data from the as-built documents were combined
with the Caltrans PCS data to obtain details of overlay construction contracts, such as information about overlay
thicknesses, pre-overlay repairs, and the materials used. Some difficulties and limitations arose when this data
was used, primarily due to changes in PCS segment boundaries and to issues with data collection equipment.
Due to these limitations and the need to relate construction information to condition information, a comprehensive
data mining exercise was carried out to prepare an adequate dataset for the study. The initial part of the data-
mining process yielded 193 contracts that met the requirements of the study. Applying this process further,
different pre-overlay repairs, overlay thicknesses, or overlay materials within the same contract were each treated
as independent projects, and thus 228 projects were identified among the 193 contracts. Each overlay project
included one or more PCS data collection subsections in the longitudinal direction, and, moreover, sections in
multiple lanes—with their associated IRI values—were considered as separate subsections. The length of the
subsections varied from project to project, most with lengths between 0.1 and 1.5 miles (0.16 and 2.4 km). The
total number of subsections in the final data set was 4,475.
Data were also analyzed from 120 subsections in the Specific Pavement Studies (SPS-5) experiment portion of
the Long-Term Pavement Performance (LTPP) program database operated by the U.S. Federal Highway
Administration (FHWA). These SPS-5 sections included data from 15 states and provinces across the United States
and Canada.
In addition to the data analysis, this report also includes a number of models that were developed as part of the
statistical analysis. The aim of this analysis was to find what level of smoothness can be achieved with a new
overlay and to recommend best practices for overlay repairs based on the existing pavement condition. Multiple
regression analysis was used to develop these models in order to conduct a further analysis of the effects of the
explanatory variables on overlay smoothness. In the multiple regression models, post-overlay IRI and IRI
reduction were the dependent variables. The independent variables in the regression models were pre-overlay
condition, overlay thickness, pre-overlay repairs (two types: milling, which is referred to as cold planing in
Caltrans contract cost items and consists of the removal of 0.1 to 0.2 ft [30 to 60 mm] of material, often across the
entire lane; and digouts, which consists of the removal of 0.25 to 0.4 ft [75 to 120 mm] in the wheelpaths), overlay
type (open-graded or non-open-graded [including rubberized hot mix asphalt mixes, and dense-graded
conventional and modified mixes]), and type of binder (asphalt rubber binder versus conventional or modified).

UCPRC-RR-2013-09.1 xi
Based on the results of the analysis of the available data, the following conclusions were drawn:
Regardless of other factors, applying an overlay on a pavement with a low pre-overlay IRI can further
reduce the post-overlay IRI.
Increasing the thickness of an overlay has no additional benefit when the pre-overlay IRI is less than
120 in./mile (1.90 m/km). When the pre-overlay IRI is greater than 120 in./mile, thicker dense- and
rubberized gap-graded overlays reduce post-overlay IRI more than thinner overlays do. Considering that
some of the medium overlays (0.25 ft to 0.40 ft thick) and all of the thick overlays (thicker than 0.45 ft)
would have been paved in two or sometimes more lifts, the multiple passes of the paver would have
contributed to the improved smoothness. With open-graded mixes, overlay thickness does not show any
significant effect on post-overlay IRI, reflecting the narrower range of thicknesses for open-graded
overlays. The thickness effect could not be separated for different kinds of open-graded overlays
(conventional, polymer-modified, rubberized, bonded wearing course).
Milling prior to overlay and using rubberized binder (grouping gap-graded and open-graded mixes
together in the statistical analysis) alone do not provide any additional benefits for achieving lower post-
overlay IRI. However, using rubberized binder in open-graded overlays may help achieve lower post-
overlay IRI.
Milling prior to overlay on pavements with existing IRI less than 120 in./mile, and particularly when the
existing IRI is less than 95 in./mile, is disadvantageous and will likely result in a rougher pavement than
if milling had not been done, based on the data used for this study. As with all of the results in this study,
changes in specifications and quality assurance practice may change this conclusion.
Digouts, which should be done to correct cracking in the wheelpath prior to overlay, generally provide a
benefit when the pre-overlay IRI is greater than 95 in./mile, but have the greatest benefit in reducing post-
overlay IRI when the pre-overlay IRI is greater than 120 in./mile.
Analysis of the Caltrans PCS database indicates that projects with digouts in the wheelpath have better
post-overlay IRI than those that were milled across the entire width of the pavement prior to overlay. This
result may be because relatively shallow milling (see definition above) may not address underlying
structural problems in the wheelpaths, while digouts are generally only used where there are evident
structural problems in the wheelpaths and, as defined for this study (see above), result in deeper removal
of material in those locations.
Although, in general, overlay mix type alone (open-graded versus dense- and gap-graded) has no effect
on post-overlay IRI, milling or digouts prior to placing open-graded overlays may help to achieve lower
post-overlay IRI.
Sparse data indicate that milling of existing open-graded surfaces prior to overlay may result in rougher
overlays than if milling was not done.

xii UCPRC-RR-2013-09.1
The IRI measurements presented were made after the close of each construction contract and therefore they
include the effects of any grinding that Caltrans required the contractor to perform prior to that close.
A similar analysis of the LTPP SPS-5 sections from 120 subsections collected from the SPS-5 data—from fifteen
states and provinces across the United States and Canada—resulted in the following conclusions:
Overall, pre-overlay condition has a significant effect on both post-overlay IRI and IRI reduction. Post-
overlay IRI was higher in the groups with poor pre-overlay condition, although IRI reduction was also
higher in the groups with poor pre-overlay condition.
Overlay thickness was shown to have little influence on post-overlay IRI and IRI reduction for all mixes
included in those sections. There was no information available regarding lift thicknesses used for different
overlay total thicknesses. This finding is somewhat different from that found using the Caltrans data which
showed that overlay thickness had no benefit on post-overlay IRI when the pre-overlay IRI was below
120 in./mile, but showed a benefit of thicker overlays when the pre-overlay IRI was greater than
120 in./mile.
No specific trends could be found for pre-overlay repairs and mix types based on the descriptive statistics
and boxplots.
Recommendations
The following recommendations are based on the conclusions of this study:
Caltrans should use the results of this study to provide guidance to designers regarding use of milling and
recommend against using milling as a means to improve the smoothness of an overlay when the IRI of
the existing pavement is less than 120 in./mile (1.9 m/km). Changes in milling practice since 2009 may
change this recommendation, but this should be investigated using projects built since the change in the
Caltrans smoothness specification in 2013.
Digouts are used for pre-overlay repair to remove cracking only in the wheelpaths and only when the
nonwheelpath pavement is in satisfactory condition; a decision to use digouts is based solely on the
severity and extent of cracking. However, consideration should be given to using separate IRI
performance equations in the PaveM pavement management system for overlays with and without digouts
since their use on rough pavements helps improve overlay smoothness.
Caltrans should compare the results from this study, which is based on data collected prior to
implementation of an IRI-based construction smoothness specification in 2013, with smoothness values
obtained since implementation of the new smoothness specification to see if it has resulted in any changes
in the findings of this study and whether adjustments to the specification are needed or desired. These
new measurements should be taken by the UCPRC prior to any grinding for smoothness that Caltrans

UCPRC-RR-2013-09.1 xiii
requires the contractor to do prior to closing the construction contract, and if possible the UCPRC should
also collect information regarding the amount of grinding that was required to pass the specification.

xiv UCPRC-RR-2013-09.1
LIST OF ABBREVIATIONS
AASHTO American Association of State Highway and Transportation Officials
AC Asphalt concrete
AIC Akaike Information Criterion
Caltrans California Department of Transportation
CCA Construction Contract Acceptance
FHWA Federal Highway Administration
FDOT Florida Department of Transportation
GPS General Pavement Studies
IRI International Roughness Index
ITRD International Transport Research Documentation
LTPP Long-Term Pavement Performance
M&R Maintenance and Rehabilitation
MTD Material Transfer Device
OECD Organization for Economic Co-operation and Development
PCC Portland cement concrete
PCS Pavement Condition Survey
PPRC SPE Partnered Pavement Research Center Strategic Plan Element
RAP Reclaimed Asphalt Pavement
TRID Transport Research International Documentation
TRIS Transportation Research Information Services
TWM Total Weight of Mixture
VDOT Virginia Department of Transportation
UCPRC University of California Pavement Research Center
LIST OF TEST METHODS AND SPECIFICATIONS
ASTM E1926-08 Standard Practice for Computing International Roughness Index of Roads from
Longitudinal Profile Measurements
CT 526 Method of Test for Operation of California Highway Profilograph and Evaluation of
Profiles

UCPRC-RR-2013-09.1 xv
SI* (MODERN METRIC) CONVERSION FACTORS APPROXIMATE CONVERSIONS TO SI UNITS
Symbol When You Know Multiply By To Find Symbol LENGTH
in inches 25.4 Millimeters mm ft feet 0.305 Meters m yd yards 0.914 Meters m mi miles 1.61 Kilometers Km
AREAin2 square inches 645.2 Square millimeters mm2 ft2 square feet 0.093 Square meters m2 yd2 square yard 0.836 Square meters m2 ac acres 0.405 Hectares ha mi2 square miles 2.59 Square kilometers km2
VOLUMEfl oz fluid ounces 29.57 Milliliters mL gal gallons 3.785 Liters L ft3 cubic feet 0.028 cubic meters m3 yd3 cubic yards 0.765 cubic meters m3
NOTE: volumes greater than 1000 L shall be shown in m3
MASSoz ounces 28.35 Grams g lb pounds 0.454 Kilograms kg T short tons (2000 lb) 0.907 megagrams (or "metric ton") Mg (or "t")
TEMPERATURE (exact degrees)°F Fahrenheit 5 (F-32)/9 Celsius °C
or (F-32)/1.8
ILLUMINATION fc foot-candles 10.76 Lux lx fl foot-Lamberts 3.426 candela/m2 cd/m2
FORCE and PRESSURE or STRESS lbf poundforce 4.45 Newtons N lbf/in2 poundforce per square inch 6.89 Kilopascals kPa
APPROXIMATE CONVERSIONS FROM SI UNITS
Symbol When You Know Multiply By To Find Symbol LENGTH
mm millimeters 0.039 Inches in m meters 3.28 Feet ft m meters 1.09 Yards yd km kilometers 0.621 Miles mi
AREAmm2 square millimeters 0.0016 square inches in2 m2 square meters 10.764 square feet ft2 m2 square meters 1.195 square yards yd2 ha Hectares 2.47 Acres ac km2 square kilometers 0.386 square miles mi2
VOLUMEmL Milliliters 0.034 fluid ounces fl oz L liters 0.264 Gallons gal m3 cubic meters 35.314 cubic feet ft3 m3 cubic meters 1.307 cubic yards yd3
MASSg grams 0.035 Ounces oz kg kilograms 2.202 Pounds lb Mg (or "t") megagrams (or "metric ton") 1.103 short tons (2000 lb) T
TEMPERATURE (exact degrees) °C Celsius 1.8C+32 Fahrenheit °F
ILLUMINATION lx lux 0.0929 foot-candles fc cd/m2 candela/m2 0.2919 foot-Lamberts fl
FORCE and PRESSURE or STRESSN newtons 0.225 Poundforce lbf kPa kilopascals 0.145 poundforce per square inch lbf/in2
*SI is the symbol for the International System of Units. Appropriate rounding should be made to comply with Section 4 of ASTM E380 (Revised March 2003).


UCPRC-RR-2013-09.1 1
1 INTRODUCTION
The pavement structures in state highway and local road networks represent significant assets that have been built
and are maintained with public funds. To make the most of this funding while preserving these assets requires
highway agencies to select maintenance strategies that will maximize the network’s serviceability while remaining
within budget. One prominent strategy used by Caltrans to manage its network is the application of asphalt
overlays on existing pavements to preserve or restore pavement condition and pavement smoothness in particular.
Maintaining pavement smoothness is important because it has been identified as a significant factor in drivers’
perception of pavement condition [1], and because smooth pavements also reduce vehicle operating costs,
including vehicle maintenance and fuel consumption [2], and reduce carbon dioxide emissions and energy use [3].
The primary purpose of the study presented in this report was to investigate the effects that pre-overlay pavement
condition, overlay thickness, type of pre-overlay repairs, mix type (based on aggregate gradation), and binder type
have on the smoothness of overlays using data from 2000 to 2009. Accomplishing this involved reviewing earlier
studies to determine what factors might affect overlay smoothness, mining databases provided by the Caltrans
Pavement Program to select construction projects appropriate for data analysis, and conducting a statistical
analysis to determine the effects of different explanatory variables. The results obtained were then used to make
recommendations for the design of overlays based on existing pavement condition.
In September 2013, Caltrans implemented a new Standard Special Provision (SSP) 39-1.12 for asphalt pavement,
to replace Standard Specifications Section 39-1.12, and revised SSP 40-1 for concrete pavement, both of which
require the contractor to determine pavement smoothness profiles using an inertial profiler and to use the
International Roughness Index (IRI) as the roughness parameter for overlay construction smoothness. However,
even though the asphalt overlay results in this study are based on overlays constructed prior to implementation of
these new Caltrans smoothness specifications, IRI was still used as the roughness parameter.
The study analyzed the following factors in order to determine their effects on constructed overlay smoothness:
initial pavement smoothness prior to overlay; overlay thickness; overlay mix type (open-graded, gap-graded, or
dense-graded); binder type (rubberized versus conventional or polymer-modified); and two types of pre-overlay
repairs (milling, which is referred to as cold planing in Caltrans contract cost items and consists of the removal of
0.1 to 0.2 ft [30 to 60 mm] of material, often across the entire lane; and digouts, which consists of the removal of
0.25 to 0.4 ft [75 to 120 mm] in the wheelpaths), overlay type (open-graded or non-open-graded [including

2 UCPRC-RR-2013-09.1
rubberized hot mix asphalt mixes, and dense-graded conventional and modified mixes]), and type of binder
(asphalt rubber binder versus conventional or modified).
As noted, this study used IRI as the measure of smoothness (ride quality). IRI is defined as the accumulated
vertical movement of the sprung mass of one quarter of a standard vehicle divided by the distance traveled, as
calculated by a computer simulation of the quarter-car operating in the wheelpath on the longitudinal profile of
the measured pavement per ASTM E1926-08 (“Standard Practice for Computing International Roughness Index
of Roads from Longitudinal Profile Measurements”). Von Quintus et al. [4] pointed out that IRI is significantly
affected not only by the initial pavement smoothness but also by pavement distresses such as fatigue cracking,
transverse cracking, block cracking, and rutting, particularly when they are severe and widespread. IRI is typically
expressed in the units inches per mile (in./mile) or meters per kilometer (m/km) [5].
The objectives of this study were achieved through the following tasks:
1. Review the existing literature to identify potential smoothness levels achievable with different initial
surface profiles and different pre-overlay treatments.
2. Develop a factorial for the selection of construction projects that considers the explanatory variables,
including pre-overlay pavement condition, overlay thickness, pre-overlay repairs, overlay type, and
material used. Other variables were considered but discarded based on initial statistical review or lack of
information, including underlying pavement type (except for certain cases which were considered) and
structural thickness, paving sequence, paving season, climate region, and existing distresses.
3. Work with Caltrans district offices and headquarters to identify planned overlay projects and make
arrangements for testing on them to include several types of pre-overlay treatment. Characterize pavement
surfaces before overlay projects begin and after they are completed.
4. Analyze the data collected to determine the effects of the explanatory variables on overlay smoothness
and the benefit-to-cost ratio of different pre-overlay treatment strategies.
5. Monitor the performance of the overlays in order to quantify the functional performance of the different
strategies over time.
6. Prepare annual construction summaries and analysis reports, and a summary report that details the
research and findings.
This report completes the work of Tasks 1, 2, and 4, except that benefit-to-cost was not evaluated because it was
found that a number of the pre-overlay strategies had no benefit.
The data used in this study were taken from the Caltrans PCS between the years 2000 and 2009, a period during
which as-built overlay smoothness was controlled with a specification based on the California Profilograph

UCPRC-RR-2013-09.1 3
(California Test 526, “Method of Test for Operation of California Highway Profilograph and Evaluation of
Profiles”) (Note: In 2013, Caltrans implemented a new construction smoothness specification based on
measurement of IRI: CPB13-2, “Inertial Profiler Construction Inspection Guidance and Evaluation of Profiles.”)
The scope of this study only includes asphalt overlays on existing asphalt surfaces built by contractors for both
the Caltrans maintenance (HM) and rehabilitation (HA22) programs, including the Capital Preventive
Maintenance (CAPM) overlays that are part of the latter. This report does not include hot mix asphalt (HMA)
overlays on PCC surfaces. Note: the IRI measurements presented were made after the close of each construction
contract and therefore they include the effects of any grinding that Caltrans required the contractor to perform
prior to that close.

4 UCPRC-RR-2013-09.1
(This page intentionally left blank)

UCPRC-RR-2013-09.1 5
2 LITERATURE REVIEW
The primary source for this literature review was TRID, an integrated database that combines records from the
Transportation Research Board’s (TRB) Transportation Research Information Services (TRIS) database and the
Joint Transport Research Centre’s (JTRC) International Transport Research Documentation (ITRD) database of
the Organization for Economic Co-operation and Development (OECD). In this report, the information collected
from the databases regarding overlay smoothness was synthesized to identify the factors that affect overlay
smoothness and to determine their significance levels.
2.1 Factors that Affect Overlay Smoothness
Earlier studies that addressed the factors affecting overlay smoothness were found in the literature review. Some
of these studies used pavement performance data collected from across the U.S. and Canada for the LTPP program
database operated by FHWA, while others used state- or province-specific data. As part of the LTPP program,
General Pavement Studies (GPS) were conducted to evaluate the performance of in-service pavement sections
either after the original construction or after an overlay (that is, after an HMA overlay of an existing HMA
pavement or PCC pavement). Additional Specific Pavement Studies (SPS) were conducted to evaluate the
performance of specific design features of pavements [6].
2.1.1 Pre-Overlay Repairs
The results of earlier studies on the effects of pre-overlay repairs on overlay smoothness are inconsistent as to
whether or not milling is significant. For example, using the LTPP data, West et al. [7] found that milling prior to
overlay significantly decreased IRI and future cracking. Using that same LTPP data, Raymond et al. [8] also found
that the extent of surface preparation (milling) had a significant effect on overlay roughness when the pre-overlay
IRI was over 95 in./mile (1.5 m/km). On the other hand, when Perera and Kohn [9] investigated the influence of
milling on overlay smoothness, also by analyzing the LTPP data, they found that milling did not result in any
statistically significant effect on post-overlay IRI when the measurements were compared to results collected from
unmilled sections. Based on these results, it appears that the effect of pre-overlay repairs may have a certain level
of interaction with post-overlay smoothness, but there was no consensus among the studies as to whether or not
milling prior to overlay has a significant effect.
2.1.2 Overlay Thickness
Studies that analyzed the LTPP data for the effect of overlay thickness on post-overlay IRI found varying and
sometimes contradictory results. For example, Raymond et al. [8] and Perera and Kohn [9] found that overlays
between 2 inches (50 mm) and 5 inches (125 mm) had no significant effect on post-overlay IRI regardless of the
6 UCPRC-RR-2013-09.1
pre-overlay condition. However, West et al. [7] found that 5 inch (125 mm) thick overlays yielded better
performance than 2 inch (50 mm) thick overlays in terms of smoothness—and in delaying the onset of cracking
and raveling—thus showing that overlay thickness significantly affects pavement roughness.
The effects of overlay thickness on long-term condition were also investigated using the LTPP data. In one study,
Hall et al. [10] found that 5 inch thick overlays outperformed 2 inch thick overlays in terms of smoothness and
fatigue cracking over an average analysis period of 7.8 years. In another study, Wen et al. [11] found that a small
increase of overlay thickness can effectively reduce the development rate of transverse cracking. These results
showed that increased thickness has some positive effects on slowing the increase of IRI over time.
2.1.3 Pavement Smoothness Prior to Overlay
As with the preceding factors discussed, inconsistent results among earlier studies have not clarified the role of
pavement smoothness prior to overlay as a key factor affecting overlay smoothness. A study by Hall et al. [10]
found that original surface roughness had a significant effect on the smoothness of overlays and work by McGhee
[12] found a correlation between pre-overlay IRI and post-overlay IRI. However, Perera and Kohn [9] found a
contradictory result that showed no correlation between the IRI before and after the overlay.
2.1.4 Overlay Materials
The effects of materials used for overlays were evaluated by McGhee [12] and the results showed that the asphalt
mix type had no significant effect on pavement smoothness. However, that evaluation was limited to gap-graded
mixes with different stiffness values and asphalt contents. The types of mixes considered in the data analysis in
this current study are broader than those included in the study by McGhee partly because Caltrans has increased
its use of rubberized gap-graded overlays, and rubberized, polymer-modified, and conventional open-graded
overlays. It is still to be determined whether and how these materials affect pavement smoothness after overlay.
In recent years, the use of Reclaimed Asphalt Pavement (RAP) in overlays has also gradually increased, and the
performance of overlays with increased RAP contents is a concern for some state highway agencies. Research
results from two studies indicated that there was no significant effect on post-overlay IRI or on the long-term
development of roughness, rutting, block cracking, or raveling introduced by mixes with either virgin aggregate
or with 30 percent RAP [10, 11]. It should be noted that during the period covered by this current study, Caltrans
did not allow RAP in rubberized gap-graded mixes or in any type of open-graded mix, and limited RAP content
to a maximum of 15 percent in dense-graded mixes.

UCPRC-RR-2013-09.1 7
2.1.5 Other Factors
Smith and Tighe [13] investigated the effects of freeze-thaw cycles and trapped water on the performance of
overlays and found that they accelerated pavement roughness progression. The study also found that if the water
does not freeze, it does not affect roughness progression.
The effects on overlay smoothness of adding supplemental structural layers and the time of day when the paving
was performed (daytime or nighttime) were also evaluated in earlier studies. Study results published by the
Virginia Department of Transportation (VDOT) [12] showed that an added intermediate or base layer in a
pavement structure had little positive effect on reducing post-overlay IRI. That report, as well as another one by
the Florida Department of Transportation (FDOT) [14], showed that daytime versus nighttime paving also had no
significant effect on post-overlay IRI.
In addition, Holzschuher et al. [14] found that adding a Material Transfer Device (MTD, referred to as a Material
Transfer Vehicle [MTV] by Caltrans) to the paving process significantly reduced the post-overlay IRI of
pavements. This is because the use of the device helped achieve continuous movement of the paver and a uniform
flow of consistent mix, thus eliminating the need to stop the paver to connect it with haul trucks. MTD use also
improved the consistency of the asphalt mix temperature and gradation when the mixes were delivered to the
paver. The study’s results showed that the use of an MTD can improve IRI by about 15 to 25 percent compared to
IRI values measured on overlays performed without the use of an MTD.
2.2 Summary of the Factors Affecting Overlay Smoothness Found in Previous Studies
A summary of the factors discussed above that might affect the smoothness of overlays are listed below and are
shown in Table 2.1. Among the factors that were considered to possibly affect overlay smoothness, the most
common ones investigated in the literature were found to be pre-overlay IRI, overlay thickness, and pre-overlay
repairs. Inconsistencies among the results of those studies leave it unclear whether or not these factors have
significant effects on overlay smoothness.
In several of the studies, overlay thickness and milling did not have a significant effect on post-overlay
IRI regardless of the pre-overlay condition, but some of the studies pointed out that overlay thickness or
milling might influence long-term overlay smoothness.
Differences in the materials used in overlays, such as binder type, aggregate gradation, and mix type
(virgin or containing RAP [referred to as “recycled” in modeling performed for this study]), do not have
a significant influence on overlay smoothness.
8 UCPRC-RR-2013-09.1
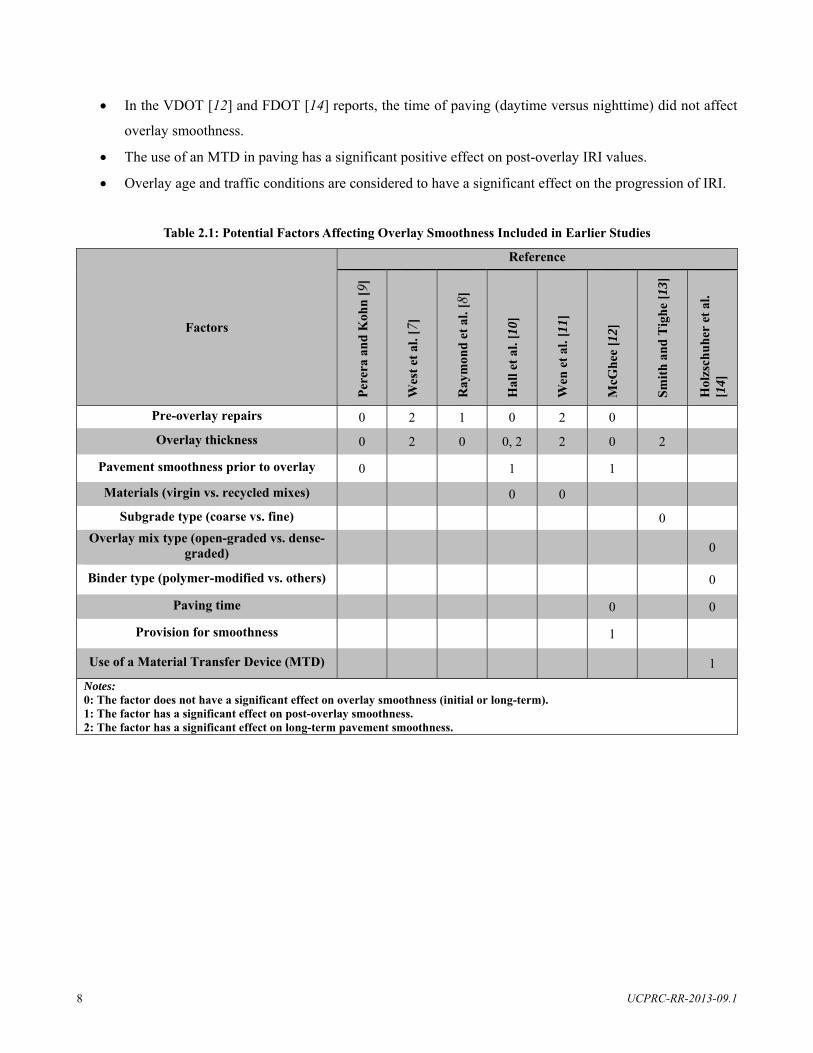
In the VDOT [12] and FDOT [14] reports, the time of paving (daytime versus nighttime) did not affect
overlay smoothness.
The use of an MTD in paving has a significant positive effect on post-overlay IRI values.
Overlay age and traffic conditions are considered to have a significant effect on the progression of IRI.
Table 2.1: Potential Factors Affecting Overlay Smoothness Included in Earlier Studies
Factors
Reference
Per
era
and
Koh
n [
9]
Wes
t et
al.
[7]
Ray
mon
d et
al.
[8]
Hal
l et
al. [
10]
Wen
et
al. [
11]
McG
hee
[12
]
Sm
ith
and
Tig
he
[13]
Hol
zsch
uh
er e
t al
. [1
4]
Pre-overlay repairs 0 2 1 0 2 0
Overlay thickness 0 2 0 0, 2 2 0 2
Pavement smoothness prior to overlay 0 1 1
Materials (virgin vs. recycled mixes) 0 0
Subgrade type (coarse vs. fine) 0
Overlay mix type (open-graded vs. dense-graded) 0
Binder type (polymer-modified vs. others) 0
Paving time 0 0
Provision for smoothness 1
Use of a Material Transfer Device (MTD) 1
Notes: 0: The factor does not have a significant effect on overlay smoothness (initial or long-term). 1: The factor has a significant effect on post-overlay smoothness. 2: The factor has a significant effect on long-term pavement smoothness.

UCPRC-RR-2013-09.1 9
3 INVESTIGATION OF FACTORS AFFECTING OVERLAY SMOOTHNESS
As noted in the literature review, it is currently unknown whether or to what extent overlay smoothness is affected
by overlay thickness, pre-overlay pavement condition, pre-overlay repairs, materials, or other factors. In order to
better understand which factors significantly affect overlay smoothness and what potential levels of smoothness
can be achieved after placement of overlays, two different datasets—the Caltrans PCS and the LTPP SPS-5—were
used to conduct a more precise analysis.
3.1 Data Extraction and Data Mining
3.1.1 Caltrans PCS Data
Data for this study were extracted from the Caltrans PCS and from other Caltrans sources that contained
information not included in the PCS. All the data were then combined to perform the analysis. Data from the
Caltrans PCS included information on IRI, wheelpath cracking, and other distresses, which is collected on a
regular basis.
Construction as-built information (as-built thicknesses, materials, and construction dates) was obtained from the
Caltrans Division of Construction through the Caltrans document retrieval system. This construction information
did not include data regarding pavement maintenance performed directly by Caltrans maintenance personnel, and
did not include data regarding the amount of grinding that Caltrans required the contractor to perform based on
the profilograph measurements prior to closing the contract. The data from the as-built documents provided the
details of overlay construction contracts, such as overlay thicknesses, pre-overlay repairs, and materials used.
Some difficulties and limitations arose when putting together the PCS IRI data with the as-built data, primarily
due to changes in the PCS segment boundaries from year to year and issues with IRI data collection equipment.
Due to these limitations and the need to relate construction information to condition information, a comprehensive
data mining exercise was carried out to prepare an adequate dataset for the study. The initial part of the data-
mining process yielded 193 contracts that met the requirements of the study. Applying this process further,
different pre-overlay repairs, overlay thicknesses, or overlay materials within the same contract were each treated
as an independent project, and thus 228 projects were identified among the 193 contracts. Each overlay project
included one or more PCS data collection subsections in the longitudinal direction; moreover, sections in multiple
lanes—with their associated IRI values—were considered as separate subsections. The length of the subsections
varied from project to project, most with lengths between 0.1 and 1.5 mi. The total number of subsections in the
final dataset was 4,475.

10 UCPRC-RR-2013-09.1
The cumulative distribution of the length of the subsections is shown in Figure 3.1. The figure is a cumulative
distribution plot which shows the subsection lengths on the x-axis and the cumulative percentage of subsections
on the y-axis. From the plot it can be seen that the median (50th percentile) subsection length is a little less than
0.3 miles, that about 20 percent of the sections were less than 0.1 miles, and that the longest subsection was 5 miles,
which was the maximum length introduced into the data set.
Figure 3.1: Cumulative distribution of the length of subsections. The data-mining process is summarized in the following steps and shown as part of the flow chart in Figure 3.2
(starting at Step 3).
1. Projects with more than two years’ worth of reasonable data (IRI variation with time is considered
reasonable) after completion of their overlay projects were selected.
2. The actual construction date of each project was identified by a drop in its IRI. Subsections within each
project were also checked for a drop in IRI, and the date of construction assigned to them was defined
as the time when most of the subsections showed a drop in IRI.
3. Because the construction contract acceptance (CCA) date (as-built) was used rather than the construction
completion date (which is not recorded), two assumptions were made when selecting subsections. First,
projects showing a drop in IRI in the year preceding the CCA date or in the two years following it were
selected. Second, projects that had more than one IRI drop within the period were eliminated because
the extra IRI might have been caused by other unknown maintenance activities.

UCPRC-RR-2013-09.1 11
4. The latest IRI measurement taken before applying the overlay was defined as the pre-overlay IRI; and
the earliest IRI measurement taken after applying the overlay was defined as the post-overlay IRI.
5. Projects with an interval longer than three years between IRI measurements were eliminated in order to
reduce the effects from traffic or aging.
6. Altogether, 228 overlay projects were identified for data analysis in this study.
After a number of variables were considered, the following were selected for data analysis: pre-overlay IRI, post-
overlay IRI, overlay thickness, the application of milling, the application of digouts, overlay mix type (dense- or
gap-graded versus open-graded), and binder type (rubberized versus conventional or polymer-modified).
3.1.2 LTPP SPS-5 Data
The LTPP SPS-5 experiment data was extracted from the LTPP program’s online database (www.infopave.com).
(Note: accessing the database requires registration at the LTPP InfoPave website.) All the extracted data were raw
data, so the program ProVAL (www.roadprofile.com) was used to obtain the IRI value for the specified sections.
After this was done, the extracted data were compared to that of an earlier study [9] to ensure their accuracy.
3.2 Data Analysis
3.2.1 Caltrans PCS Data
Figure 3.3 shows the cumulative distributions of pre-overlay and post-overlay IRI for all the subsections and
projects. About 90 percent of the pre-overlay IRI values are below 170 in./mile (2.70 m/km), while 90 percent of
the post-overlay IRI values are below 120 in./mile (1.90 m/km). The post-overlay IRI reduction is proportional to
the pre-overlay IRI. Figure 3.4 shows the IRI reduction cumulative distributions for the subsections and the
projects. The average IRI reduction values for the projects were obtained using the average IRI reduction for all
the subsections within the same project. A negative IRI reduction value indicates that the post-overlay IRI value
exceeded those of the pre-overlay. About 20 percent of the subsections showed higher IRI values due to overlay
construction. This increase in the IRI values of the subsections can be attributed to construction quality or, in a
few cases, to measurement errors or errors in the location referencing of the pre- and post-overlay IRI
measurements. In general, nearly all the overlays improved pavement smoothness in terms of project averages.

12 UCPRC-RR-2013-09.1
Figure 3.2: Flow chart of steps to establish the dataset.
Final Dataset
A total of 228 projects were selected for data analysis.
Data Mining: Step 5
Projects with an interval longer than three years between IRI measurements were eliminated in order to reduce the effects from traffic or aging.
Data Mining: Step 4
The latest IRI measurement taken before applying the overlay was defined as the pre-overlay IRI.
The earliest IRI measurement taken after applying the overlay was defined as the post-overlay IRI.
Data Mining: Step 3
Projects showing a drop in IRI in the year preceding the CCA date or in the two years following it were selected. Projects that had more than one IRI drop within the period were eliminated.
Data Mining: Step 2
Subsections within each project were checked for a drop in IRI, and the date of construction was defined as the time when most of the subsections showed a drop in IRI.
Data Mining: Step 1
Projects that had more than two years’ worth of reasonable data after completion of their overlay projects were selected.
Maintenance Type Selection
Overlays on flexible pavements were selected.
Data Combination
Caltrans PCS data and as-built documents were combined to provide the level of detail needed for analysis.

UCPRC-RR-2013-09.1 13
Figure 3.3: Cumulative distribution of pre-overlay and post-overlay IRI for projects and subsections.
Figure 3.4: Cumulative distribution of IRI reduction for projects and subsections.

14 UCPRC-RR-2013-09.1
Four categories of overlay thickness were defined in the dataset: Very Thin (≤0.098 ft [30 mm]), Thin (0.099
to 0.197 ft [31 to 60 mm]), Medium (0.198 to 0.410 ft [61 to 125 mm]), and Thick (≥0.411 ft [125 mm]).These
categories of thickness were based on thickness definitions in the Caltrans pavement management system at the
time the analysis was done. The Caltrans PMS also used metric units at the time the statistical analysis was
performed. The number of projects and subsections for the different overlay thicknesses in the dataset are shown
in Table 3.1. A histogram of the overlay thicknesses in the dataset is shown in Figure 3.5. Figure 3.6 shows a
cumulative distribution plot of overlay thicknesses of the subsections. Based on the information in these two
figures, it can be seen that about half of the subsections have “very thin” overlays, about 80 percent of the projects
have overlays of 0.197 ft (50 mm) or less thickness—which fit in the “thin” and “very thin” categories—and less
than eight percent were thicker than 0.4 ft.
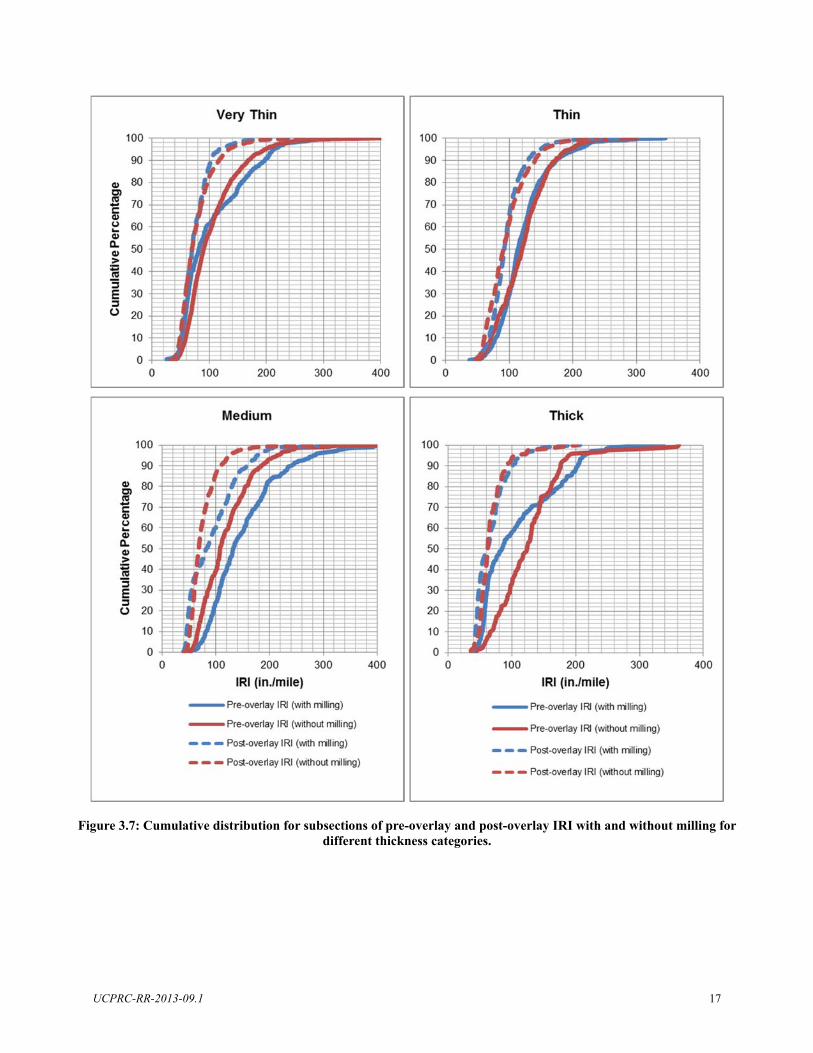
The majority of the subsections have overlays less than or equal to 0.197 ft (60 mm). The cumulative distribution
of pre-overlay IRI and post-overlay IRI with and without milling for each category of overlay thickness is shown
in Figure 3.7 for all subsections. The cumulative distribution for all subsections of pre-overlay IRI and post-
overlay IRI with and without digouts for each category of overlay thickness is shown in Figure 3.8. Based on the
figures, for the “very thin” and “thin” categories, overlays with milling or digouts had little effect on the post-
overlay IRI. For the “medium” and “thick” categories, overlays with milling had little effect on post-overlay IRI,
but overlays with digouts showed lower post-overlay IRI. The cumulative distribution of IRI reduction for each
category of overlay thickness is shown in Figure 3.9. In general, thicker overlays reduce IRI more and provide a
smoother pavement compared to thinner overlays.
Caltrans Standard specifications (2006 shown here as an example) for asphalt lift thicknesses are shown in
Table 3.2. These specifications indicate that the “very thin” overlays (≤0.098 ft [30 mm]) would have been
compacted in one lift, the “thin” overlays (0.1 to 0.2 ft [30 to 60 mm]) would have been compacted in one lift, the
“medium” overlays (0.2 to 0.4 ft [61 to 125 mm]) would have been compacted in one lift if less than 0.25 ft and
two lifts if between 0.25 and 0.40 ft, and the “thick” overlays (≥0.4 ft [125 mm]) would have been compacted in
two or more lifts.
Table 3.1: Number of Projects and Subsections for Different Overlay Thickness
Overlay Thickness
Very Thin (≤0.098 ft [30 mm])
Thin (0.099 – 0.197 ft [31 – 60 mm])
Medium (0.198 – 0.410 ft [61 – 125 mm])
Thick (≥0.411 ft [125 mm])
Projects 112 46 46 24
Subsections 2,284 1,260 604 327

UCPRC-RR-2013-09.1 15
Table 3.2: Caltrans 2006 Standard Specifications for Asphalt Lift Thickness
Total Thickness
No. of
Top Layer Thickness
(foot)
Next Lower Layer Thickness
(foot)
All Other Lower Layer Thickness
(foot) Shown on Plans
a Layers Min. Max. Min. Max. Min. Max.
0.20-foot or less 1 — — — — — — 0.25-foot 2
b 0.12 0.13 0.12 0.13 — —
0.30 – 0.40 foot 2 0.15 0.20 0.15 0.25 — — 0.45-foot or more c 0.15 0.20 0.15 0.25 0.15 0.40
a When pavement reinforcing fabric is shown to be placed between layers of, the thickness of asphalt concrete above the pavement reinforcing fabric shall be considered to be the "Total Thickness Shown on Plans" for the purpose of spreading and compacting the asphalt concrete above the pavement reinforcing fabric.
b At the option of the Contractor, one layer 0.25-foot thick may be placed. c At least two layers shall be placed if total thickness is 0.45-foot. At least three layers shall be placed if total thickness is more than
0.45-foot and less than 0.90-foot. At least four layers shall be placed if total thickness is 0.90-foot or more.
Figure 3.5: Histogram of the number of projects and subsections for the different overlay thicknesses.

16 UCPRC-RR-2013-09.1
Figure 3.6: Cumulative distribution of overlay thicknesses for subsections.
UCPRC-RR-2013-09.1 17
Figure 3.7: Cumulative distribution for subsections of pre-overlay and post-overlay IRI with and without milling for different thickness categories.

18 UCPRC-RR-2013-09.1
Figure 3.8: Cumulative distribution for subsections of pre-overlay and post-overlay IRI with and without digouts for different thickness categories.
0
10
20
30
40
50
60
70
80
90
100
0 100 200 300 400
Cumulative
Percentage
(%)
IRI (in./mile)
Medium
Pre‐overlay IRI (with digout)
Pre‐overlay IRI (without digout)
Post‐overlay IRI (with digout)
Post‐overlay IRI (without digout)
0
10
20
30
40
50
60
70
80
90
100
0 100 200 300 400
IRI (in./mile)
Thick
Pre‐overlay IRI (with digout)
Pre‐overlay IRI (without digout)
Post‐overlay IRI (with digout)
Post‐overlay IRI (without digout)

UCPRC-RR-2013-09.1 19
Figure 3.9: Cumulative distribution of IRI reduction for the different thickness categories, by subsection.
In order to better understand the effects of factors that might influence post-overlay IRI, the data were divided
into four categories: pre-overlay condition, overlay thickness, the application of milling, and the application of
digouts, as shown in Table 3.3. In order to have a large enough sample size for each experimental block, pre-
overlay condition was also classified into two categories, with Good being IRI lower than 120 in./mile (1.90 m/km)
and Poor being IRI greater than 120 in./mile (1.90 m/km). Overlay thickness was also divided into two categories,
with Thin defined as thickness ≤ 0.197 ft (60 mm) and Thick defined as > 0.197 ft (60 mm). Two categories of
thickness were used instead of four in order to reduce the complexity of the analysis results, and because there
were small sample sizes in the thicker categories for the number of independent variables considered. Table 3.3
shows the descriptive statistics (averages and standard deviations) for pre-overlay IRI, post-overlay IRI, and
reduction of IRI for all the data groups, before they were further divided into mix and binder type. The descriptive
statistics for all subdivisions of the data including mix and binder type are shown in the Appendix.
Figure 3.10 to Figure 3.12 show boxplots of pre-overlay IRI, post-overlay IRI, and IRI reduction for each group
shown in Table 3.3. It can be seen in Figure 3.10 that the pre-overlay IRI values within the Good Condition group
(Groups 1 through 8 in Table 3.3, IRI less than 120 in./mile [(1.90 m/km)]) were similar regardless of the overlay
thickness or pre-overlay repairs, except for Group 7 (thick overlay, milling, no digouts) which had lower IRI on
average. The Poor Condition group (Groups 9 through 16, greater IRI values) also had generally consistent pre-
overlay IRI values, except for Group 15 (thick overlay, milling, no digouts), which tended to have somewhat
greater pre-overlay IRI values than the rest of the Poor Condition group data set.

20 UCPRC-RR-2013-09.1
Among the post-overlay IRI value group distributions shown in Figure 3.11, the average values of the overlays
placed on the originally Good pavements (Groups 1 through 8 in Table 3.3, low pre-overlay IRI), Group 8 (thick
overlays, digouts, milling, but note small sample size) had the lowest post-overlay IRI values, while Groups 3 and
4 (thin overlays, milling, with and without digouts) had the worst post-overlay IRIs. The average post-overlay
IRIs of the thin overlays with milling on Good pavement (Groups 3 and 4) were higher than those of the thin
overlays without milling on Good pavement (Groups 1 and 2). The post-overlay IRI values for the overlays placed
on originally Poor pavement show that the lowest post-overlay values were for Group 16 (thick overlays, milling,
digouts) and the highest were for Group 15 (thick overlays, milling, no digouts).
From the IRI reduction group distributions shown in Figure 3.12, the average values of the overlays placed on the
originally Good pavements (Groups 1 through 8 in Table 3.3, lower pre-overlay IRI) were all much lower than
those of the overlays placed on originally Poor pavements (Groups 9 through 16, higher pre-overlay IRI), as
expected. The average IRI reductions for the thinner overlays on Good pavement were all less than 13 in./mile,
although with standard deviations of about 20 in./mile. The average IRI reductions for thin overlays on Good
pavement with milling were less than those without milling. The thicker overlays on Good pavement reduced IRI
more than thinner overlays, as expected, but with similar standard deviations. The IRI reductions for the overlays
placed on originally Poor pavement show that on average the thicker overlays reduced IRI more than the thinner
overlays, as expected, but the standard deviations of IRI reduction for overlays on Poor pavements ranged from
30 to 60 in./mile for the different groups. Average IRI reductions for overlays on Poor pavements were greater
with digouts than without digouts, except for thick overlays that also had milling where the results were similar.
Average IRI reductions for overlays on Poor pavements with and without milling were generally similar and had
similar standard deviations.

UCPRC-RR-2013-09.1 21
Table 3.3: Descriptive Statistics of Dataset Prior to Further Division by Binder and Mix Type
Group Pre-Overlay Condition
Overlay Thickness
Milling Digouts Number
of Projects
Number of
Subsections
Average Pre-Overlay
IRI (in./mile)
Std. Dev. ofPre-OverlayIRI (in./mile)
Average Post-Overlay
IRI (in./mile)
Std. Dev. ofPost-OverlayIRI (in./mile)
Average Reduction
IRI (in./mile)
Std. Dev. ofReduction
IRI (in./mile)
1
Good
Thin No
No 51 650 82 19 70 21 13 19 2 Yes 56 979 81 20 72 22 9 22 3
Yes No 23 422 91 20 82 20 8 20
4 Yes 15 248 81 22 78 18 2 21 5
Thick No
No 17 97 83 19 70 18 14 19 6 Yes 20 142 89 19 70 20 19 22 7
Yes No 20 175 76 21 65 23 11 18
8 Yes 7 81 94 17 57 18 37 23 9
Poor
Thin No
No 45 327 163 44 110 41 53 42 10 Yes 53 467 161 39 98 37 63 46 11
Yes No 24 319 162 42 106 36 56 46
12 Yes 18 132 163 35 100 31 63 39 13
Thick No
No 14 73 177 54 85 51 93 49 14 Yes 20 116 161 39 98 28 63 39 15
Yes No 22 184 197 60 115 45 82 60
16 Yes 11 63 159 34 70 33 89 30 Notes:
1. Good pre-overlay condition: pre-overlay IRI < 120 in./mile (1.9 m/km); poor pre-overlay condition: pre-overlay IRI ≥ 120 in./mile. 2. Thin overlay: overlay thickness ≤ 0.197 ft (60 mm); thick overlay: overlay thickness > 0.197 ft (60 mm) 3. The average standard deviation of post-overlay IRI for good pre-overlay condition among all subsections: 21.7. 4. The average standard deviation of post-overlay IRI for poor pre-overlay condition among all subsections: 39.6.
22 UCPRC-RR-2013-09.1
Figure 3.10: Boxplots showing variability of pre-overlay IRI for each group (pre-overlay condition [greater or less than IRI of 120 in./mile], overlay thickness, and pre-overlay repairs by groups) listed in Table 3.3.
Figure 3.11: Boxplots showing variability of post-overlay IRI for each group (pre-overlay condition [greater or less than IRI of 120 in./mile], overlay thickness and pre-overlay repairs by groups) listed in Table 3.3.
IRI (in./mile)
Gro
up
123456789
10111213141516
100 200 300 400
IRI (in./mile)
Gro
up
123456789
10111213141516
100 200 300
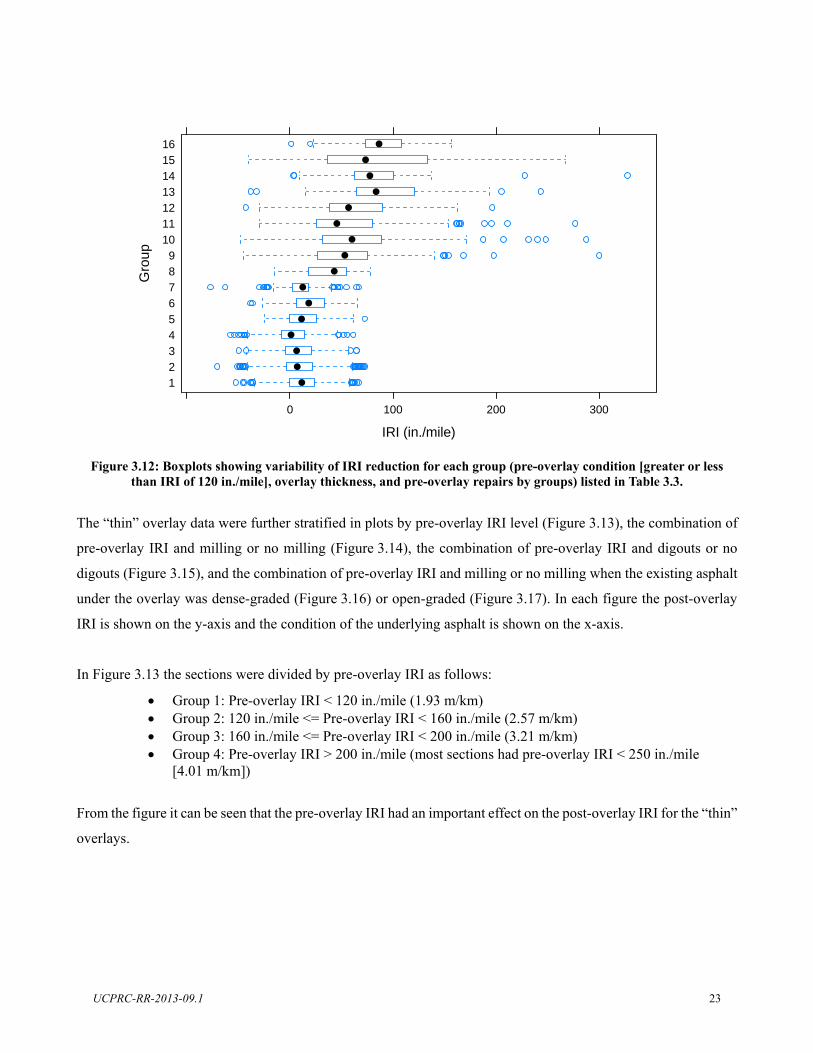
UCPRC-RR-2013-09.1 23
Figure 3.12: Boxplots showing variability of IRI reduction for each group (pre-overlay condition [greater or less than IRI of 120 in./mile], overlay thickness, and pre-overlay repairs by groups) listed in Table 3.3.
The “thin” overlay data were further stratified in plots by pre-overlay IRI level (Figure 3.13), the combination of
pre-overlay IRI and milling or no milling (Figure 3.14), the combination of pre-overlay IRI and digouts or no
digouts (Figure 3.15), and the combination of pre-overlay IRI and milling or no milling when the existing asphalt
under the overlay was dense-graded (Figure 3.16) or open-graded (Figure 3.17). In each figure the post-overlay
IRI is shown on the y-axis and the condition of the underlying asphalt is shown on the x-axis.
In Figure 3.13 the sections were divided by pre-overlay IRI as follows:
Group 1: Pre-overlay IRI < 120 in./mile (1.93 m/km) Group 2: 120 in./mile <= Pre-overlay IRI < 160 in./mile (2.57 m/km) Group 3: 160 in./mile <= Pre-overlay IRI < 200 in./mile (3.21 m/km) Group 4: Pre-overlay IRI > 200 in./mile (most sections had pre-overlay IRI < 250 in./mile
[4.01 m/km])
From the figure it can be seen that the pre-overlay IRI had an important effect on the post-overlay IRI for the “thin”
overlays.
IRI (in./mile)
Gro
up
123456789
10111213141516
0 100 200 300

24 UCPRC-RR-2013-09.1
Figure 3.13: Boxplot of post-overlay IRI (y-axis) versus pre-overlay IRI group (x-axis) for thin overlay (<= 0.197 ft [60 mm]).
Figure 3.14 shows that milling had different effects on thin overlays that were placed on existing smooth
pavements (IRI Groups 1 and 2) and on rougher pavements (IRI Groups 3 and especially 4). It can be seen that
milling on the existing less rough pavements with pre-overlay IRI values up to 200 in./mile (the Yes 1, Yes 2, and
Yes 3 groups [with milling] versus groups No 1 and , No 2, and No 3 [without milling]) resulted in the overlays
being rougher than when there was no milling, while milling on the existing very rough pavements with pre-
overlay IRI values greater than 200 in./mile (the Yes 4 group) resulted in the overlays being smoother than when
there was no milling. On the other hand, digouts had a beneficial effect on overlays for all existing roughness
categories, with the benefit increasing as the roughness of the existing pavement increased, as can be seen in
Figure 3.15. Comparison of both figures indicates that digouts had a greater benefit than did milling on thin
overlays placed over existing rough pavements.
Figure 3.16 and Figure 3.17 show the effects of existing pavement roughness and milling or no milling on thin
overlays placed on existing dense-graded asphalt (also referred to as hot mix asphalt [HMA]) and open-graded
asphalt, respectively. There were relatively few data for thin overlays on existing open-graded asphalt, which
limits the ability to compare the results. However, the results for thin overlays on existing dense-graded HMA
indicates that milling, in general, results in rougher overlays for pre-overlay IRI values up to 200 in./mile (3.21
m/km). The sparse data for overlays on existing open-graded asphalt indicate that milling generally made them
rougher.
1 2 3 4
5015
025
0
Thin Overlay
IRI_group
IRI (
in./m
ile)

UCPRC-RR-2013-09.1 25
Figure 3.14: Boxplot of post-overlay IRI (y-axis) versus pre-overlay IRI group (x-axis) for thin overlay
(<= 0.2 ft [60 mm]) without (No) and with (Yes) milling.
Figure 3.15: Boxplot of post-overlay IRI (y-axis) versus pre-overlay IRI group (x-axis) for thin overlay
(<= 0.2 ft [60 mm]) without (No) and with (Yes) digouts.
Figure 3.16 Boxplot of post-overlay IRI (y-axis) versus pre-overlay IRI group (x-axis) for thin overlay
(<= 0.2 ft (60 mm) without (No) and with (Yes) milling and placed on existing HMA.
Figure 3.17: Boxplot of post-overlay IRI (y-axis) versus pre-overlay IRI group (x-axis) for thin overlay
(<= 0.2 ft [60 mm]) without (No) and with (Yes) milling and placed on existing OGFC.
A decision was also made to analyze the data using two different dependent variables: post-overlay IRI and IRI
reduction. The following conclusions were drawn from the table and figures:
Pre-overlay condition has a significant effect on both post-overlay IRI and IRI reduction. Post-overlay
IRI was higher in the groups with poor pre-overlay condition. IRI reduction was also higher in the groups
with poor pre-overlay condition. In other words, an overlay will have a more pronounced effect on IRI
reduction on a pavement with a poor pre-overlay condition than it will on a pavement with a good pre-
overlay condition.
Although overlay thickness shows some influence on post-overlay IRI and IRI reduction, it is hard to
recognize the difference on the boxplots, especially for the groups with poor pre-overlay condition.
No.
1
Yes.
1
No.
2
Yes.
2
No.
3
Yes.
3
No.
4
Yes.
4
50
100
150
200
250
300
Thin Overlay
IRI (
in./m
ile)
Milling*IRI_group
No.
1
Yes.
1
No.
2
Yes.
2
No.
3
Yes.
3
No.
4
Yes.
4
50
100
150
200
250
300
Thin Overlay
IRI
(in./m
ile)
Digout*IRI_group
No.
1
Yes.
1
No.
2
Yes.
2
No.
3
Yes.
3
No.
4
Yes.
4
50
100
150
200
250
300
Thin Overlay (HMA)
IRI
(in./m
ile)
Milling*IRI_group
No.
1
Yes.
1
No.
2
Yes.
2
No.
3
Yes.
3
No.
4
Yes.
4
50
100
150
Thin Overlay (OGFC)
IRI
(in./m
ile)
Milling*IRI_group
Placed on existing OGFC Placed on existing HMA

26 UCPRC-RR-2013-09.1
The effects of pre-overlay repairs (milling and digouts) indicate, based on the table and boxplots, that
milling makes post-overlay IRI worse when the existing pavement is smoother while it improves the post-
overlay IRI when the existing pavement is rough. On the other hand, digouts, which should only be done
when there is cracking in the wheelpaths, appeared to improve the post-overlay IRI regardless of the pre-
overlay IRI and had the most benefit when the existing pavement was rough. Groups with poor pre-
overlay condition had greater post-overlay IRI variance than did groups with good pre-overlay condition,
but no specific trends can be found for other factors.
Multiple regression analysis was used to conduct a further analysis of the effects of the explanatory variables on
overlay smoothness. Post-overlay IRI and IRI reduction were the dependent variables in the multiple regression
models. The aim of this analysis was to find what level of smoothness can be achieved with a new overlay and to
recommend best practices for overlay repairs based on the condition of the existing pavement. The independent
variables in the regression models were pre-overlay condition, overlay thickness, pre-overlay repairs (milling
[removal of 0.1 to 0.2 ft (30 to 60 mm) of material often across the entire lane] and digouts [removal of 0.25 to
0.4 ft (75 to 120 mm) in the wheelpaths]), overlay mix type (open-graded or non-open-graded [including gap-
graded rubberized mixes, and dense-graded conventional and polymer-modified mixes]), and binder type
(rubberized versus conventional or polymer-modified). Pre-overlay IRI and overlay thickness were considered as
both continuous variables and categorical variables, with the category-based models set up for comparison with
the observations from Table 3.3. Milling, digouts, overlay mix type, and binder type were treated as categorical
variables.
In order to take into account the variation across random effect variables, mixed effects models were employed.
With this approach, the accuracy of the regression models is improved and the heterogeneity bias is avoided.
Identification of the individual projects, defined as the work completed in a unique construction contract, and
climate zone (per Caltrans performance-graded asphalt (PG) climate zones), were considered as random effects
variables in the mixed effect models. Individual project, which could also be defined as a specific contractor
working on a specific project, was not identified because it was desired to look across all projects and contractors
in the data set without separating them. Climate zone was not included because the goal of this research was to
look at IRI immediately before and after construction and not at longer-term IRI performance. Climate, which
consists primarily of rainfall and temperature effects, should not affect the smoothness obtained during
construction, except for any potential effects of temperature on late-season paving and these were not considered.
It was assumed that Caltrans specifications for minimum temperatures for paving and incentives for compaction
would limit the effects of climate zones on the results.
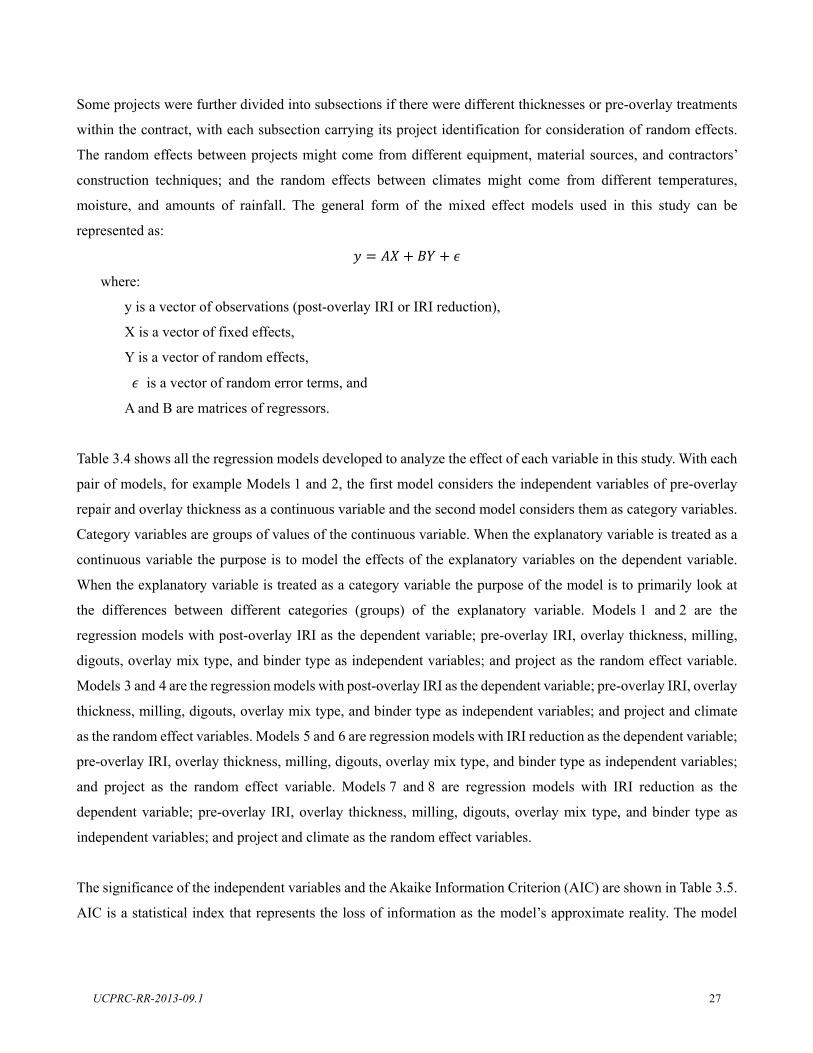
UCPRC-RR-2013-09.1 27
Some projects were further divided into subsections if there were different thicknesses or pre-overlay treatments
within the contract, with each subsection carrying its project identification for consideration of random effects.
The random effects between projects might come from different equipment, material sources, and contractors’
construction techniques; and the random effects between climates might come from different temperatures,
moisture, and amounts of rainfall. The general form of the mixed effect models used in this study can be
represented as:
where:
y is a vector of observations (post-overlay IRI or IRI reduction),
X is a vector of fixed effects,
Y is a vector of random effects,
is a vector of random error terms, and
A and B are matrices of regressors.
Table 3.4 shows all the regression models developed to analyze the effect of each variable in this study. With each
pair of models, for example Models 1 and 2, the first model considers the independent variables of pre-overlay
repair and overlay thickness as a continuous variable and the second model considers them as category variables.
Category variables are groups of values of the continuous variable. When the explanatory variable is treated as a
continuous variable the purpose is to model the effects of the explanatory variables on the dependent variable.
When the explanatory variable is treated as a category variable the purpose of the model is to primarily look at
the differences between different categories (groups) of the explanatory variable. Models 1 and 2 are the
regression models with post-overlay IRI as the dependent variable; pre-overlay IRI, overlay thickness, milling,
digouts, overlay mix type, and binder type as independent variables; and project as the random effect variable.
Models 3 and 4 are the regression models with post-overlay IRI as the dependent variable; pre-overlay IRI, overlay
thickness, milling, digouts, overlay mix type, and binder type as independent variables; and project and climate
as the random effect variables. Models 5 and 6 are regression models with IRI reduction as the dependent variable;
pre-overlay IRI, overlay thickness, milling, digouts, overlay mix type, and binder type as independent variables;
and project as the random effect variable. Models 7 and 8 are regression models with IRI reduction as the
dependent variable; pre-overlay IRI, overlay thickness, milling, digouts, overlay mix type, and binder type as
independent variables; and project and climate as the random effect variables.
The significance of the independent variables and the Akaike Information Criterion (AIC) are shown in Table 3.5.
AIC is a statistical index that represents the loss of information as the model’s approximate reality. The model
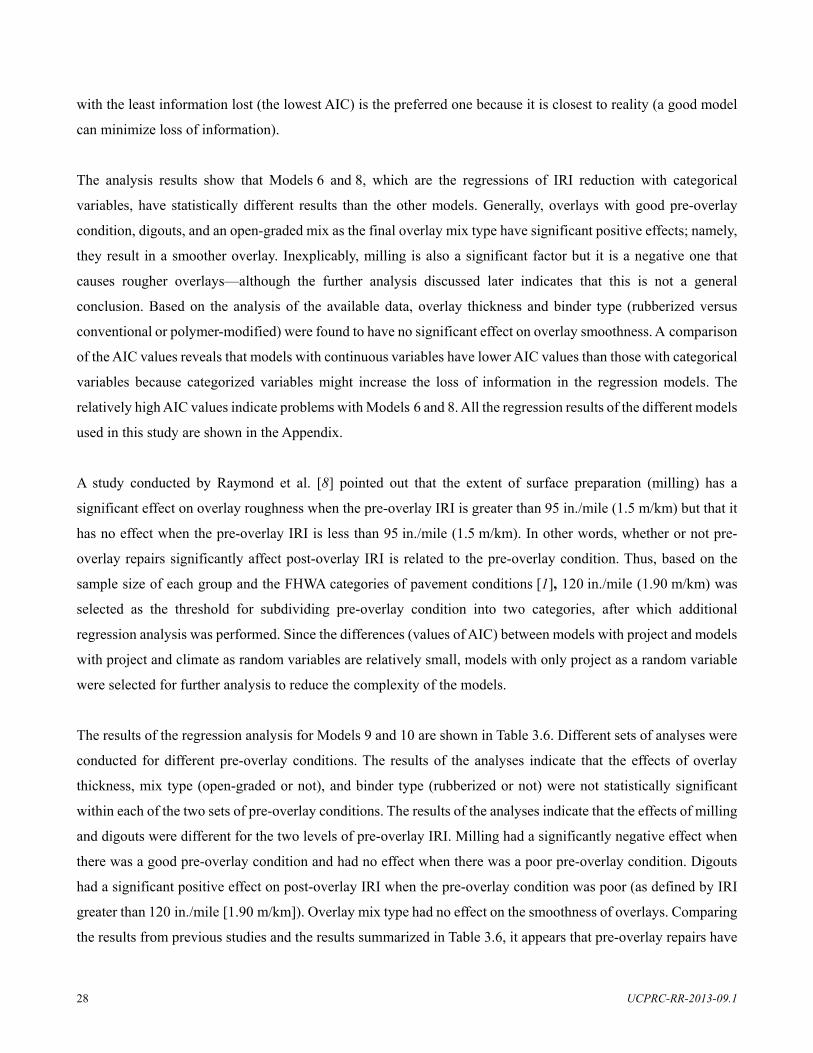
28 UCPRC-RR-2013-09.1
with the least information lost (the lowest AIC) is the preferred one because it is closest to reality (a good model
can minimize loss of information).
The analysis results show that Models 6 and 8, which are the regressions of IRI reduction with categorical
variables, have statistically different results than the other models. Generally, overlays with good pre-overlay
condition, digouts, and an open-graded mix as the final overlay mix type have significant positive effects; namely,
they result in a smoother overlay. Inexplicably, milling is also a significant factor but it is a negative one that
causes rougher overlays—although the further analysis discussed later indicates that this is not a general
conclusion. Based on the analysis of the available data, overlay thickness and binder type (rubberized versus
conventional or polymer-modified) were found to have no significant effect on overlay smoothness. A comparison
of the AIC values reveals that models with continuous variables have lower AIC values than those with categorical
variables because categorized variables might increase the loss of information in the regression models. The
relatively high AIC values indicate problems with Models 6 and 8. All the regression results of the different models
used in this study are shown in the Appendix.
A study conducted by Raymond et al. [8] pointed out that the extent of surface preparation (milling) has a
significant effect on overlay roughness when the pre-overlay IRI is greater than 95 in./mile (1.5 m/km) but that it
has no effect when the pre-overlay IRI is less than 95 in./mile (1.5 m/km). In other words, whether or not pre-
overlay repairs significantly affect post-overlay IRI is related to the pre-overlay condition. Thus, based on the
sample size of each group and the FHWA categories of pavement conditions [1], 120 in./mile (1.90 m/km) was
selected as the threshold for subdividing pre-overlay condition into two categories, after which additional
regression analysis was performed. Since the differences (values of AIC) between models with project and models
with project and climate as random variables are relatively small, models with only project as a random variable
were selected for further analysis to reduce the complexity of the models.
The results of the regression analysis for Models 9 and 10 are shown in Table 3.6. Different sets of analyses were
conducted for different pre-overlay conditions. The results of the analyses indicate that the effects of overlay
thickness, mix type (open-graded or not), and binder type (rubberized or not) were not statistically significant
within each of the two sets of pre-overlay conditions. The results of the analyses indicate that the effects of milling
and digouts were different for the two levels of pre-overlay IRI. Milling had a significantly negative effect when
there was a good pre-overlay condition and had no effect when there was a poor pre-overlay condition. Digouts
had a significant positive effect on post-overlay IRI when the pre-overlay condition was poor (as defined by IRI
greater than 120 in./mile [1.90 m/km]). Overlay mix type had no effect on the smoothness of overlays. Comparing
the results from previous studies and the results summarized in Table 3.6, it appears that pre-overlay repairs have

UCPRC-RR-2013-09.1 29
either no effect or a negative effect on post-overlay smoothness when the pre-overlay pavement condition is good,
and have either a positive effect or no effect when the pre-overlay condition is poor.
Table 3.7 goes into further detail regarding the effects of the explanatory variables, breaking the two categories of
pre-overlay IRI in Table 3.6 into four categories. The regression results are similar to those for the pre-overlay
repairs in Table 3.6. Changes in the models with the more detailed breakdown of pre-overlay condition indicate
that overlay thickness now becomes significant and positive for existing pavement with IRI values of 170 in./mile
and higher, milling remains significant and negative for pre-overlay IRI values less than 120 in./mile, digouts
remain significant and negative for pre-overlay IRI values greater than 120 in./mile, and digouts are not significant
when the pre-overlay IRI is between 95 and 120 in./mile. In addition, rubberized binder becomes significant and
positive when pre-overlay IRI is less than 95 in./mile or greater than 170 in./mile. Although the results for overlay
thickness, overlay mix type, and binder type were different for the four categories of pre-overlay condition, it is
also noteworthy that breaking down the pavement condition into four categories reduced the reliability of the
statistics of the models.

30 UCPRC-RR-2013-09.1
Table 3.4: List of Regression Models
Regression Model
Dependent Variable
Independent Variable
Fixed Effect (Type) Fixed Effect (Type) Random Effect
Model 1 Post-overlay
IRI
Pre-overlay IRI (Continuous)Milling
(Categorical) Project Digouts
Overlay Thickness (Continuous)Overlay mix
type Binder ype
Model 2 Post-overlay
IRI
Pre-overlay IRI (Categorical)Milling
(Categorical) Project Digouts
Overlay Thickness (Categorical)Overlay mix
type Binder ype
Model 3 Post-overlay
IRI
Pre-overlay IRI (Continuous)Milling
(Categorical)
Project Digouts
Overlay Thickness (Continuous)Overlay mix
type Climate Binder ype
Model 4 Post-overlay
IRI
Pre-overlay IRI (Categorical)Milling
(Categorical)
Project Digouts
Overlay Thickness (Categorical)Overlay mix
type Climate Binder ype
Model 5 IRI reduction
Pre-overlay IRI (Continuous)Milling
(Categorical) Project Digouts
Overlay Thickness (Continuous)Overlay mix
type Binder ype
Model 6 IRI reduction
Pre-overlay IRI (Categorical)Milling
(Categorical) Project Digouts
Overlay Thickness (Categorical)Overlay mix
type Binder ype
Model 7 IRI reduction
Pre-overlay IRI (Continuous)Milling
(Categorical)
Project Digouts
Overlay Thickness (Continuous)Overlay mix
type Climate Binder ype
Model 8 IRI reduction
Pre-overlay IRI (Categorical)Milling
(Categorical)
Project Digouts
Overlay Thickness (Categorical)Overlay mix
type Climate Binder type

UCPRC-RR-2013-09.1 31
Table 3.5: Significance of Independent Variables and Akaike Information Criterion for Regression Models (α=0.05)
Models Significance
Pre-Overlay IRI
Overlay Thickness
Milling Digouts Overlay
Mix Type (OG)
Material Used (Rubberized)
AIC
Model 1 Yes No Yes Yes Yes No 40115 Model 2 Yes No Yes Yes Yes No 40882 Model 3 Yes No Yes Yes Yes No 40087 Model 4 Yes No Yes Yes Yes No 40843 Model 5 Yes No Yes Yes Yes No 40115 Model 6 Yes Yes No No No No 42861 Model 7 Yes No Yes Yes Yes No 40087 Model 8 Yes Yes No No No No 42861
Notes: 1. Green cells represent a positive effect on improving pavement smoothness. 2. Red cells represent a negative effect on improving pavement smoothness.
In order to better determine the effect of pre-overlay repairs, the combination of all the factors had to be considered.
Therefore, further analysis was conducted by adding ten interaction terms into the regression models to account
for the different interactions among the contributing factors. The results of the analysis with two-factor interaction
terms added are shown in Table 3.8. The table shows that sections with thicker overlays had lower post-overlay
IRI than sections with thinner overlays when the pre-overlay IRI was greater than 120 in./mile (1.90 m/km);
sections with milling prior to overlay had higher post-overlay IRI than sections without milling, regardless of their
pre-overlay condition; sections with rubberized binder had higher post-overlay IRI than sections with
conventional/polymer-modified binder when the pre-overlay IRI was less than 120 in./mile (1.90 m/km), and
rubberized open-graded mixes had lower post-overlay IRI than did other types of mixes.
Generally, sections with lower pre-overlay IRI had lower post-overlay IRI regardless of other factors. Thicker
overlays had lower post-overlay IRI when the pre-overlay IRI was greater than 120 in./mile and especially when
greater than 170 in./mile, with the exception of milled or open-graded surfaces. Milling did not provide any
benefits for achieving a smoother overlay except on open-graded surfaces. Digouts proved to be an efficient pre-
overlay repair for reducing the post-overlay IRI in all the models, except that a more detailed breakdown indicated
that they are not beneficial when the pre-overlay IRI is less than 95 in./mile.
It should be remembered that these results are from projects built between 2000 and 2009 and pertain to practices
used during that period. These results may change if any of the practices considered in this study are changed.

32 UCPRC-RR-2013-09.1
Table 3.6: Significance of Variables in Different Pre-Overlay Conditions (α=0.05) for Models 9 and 10 with Pre-Overlay IRI Divided at 120 in./mile
Regression Models on Post-Overlay
IRI
Significance
Pre-Overlay IRI
Overlay Thickness
Milling Digouts
Overlay Mix Type (OG)
Binder Type (Rubberized)
Random Effect
Model 9 Pre-overlay IRI < 120 in./mile
Yes No Yes No No No Project
Model 10 Pre-overlay IRI ≥ 120 in./mile
Yes No No Yes No No Project
Notes: 1. Green cells represent a positive effect on improving pavement smoothness. 2. Red cells represent a negative effect on improving pavement smoothness.
Table 3.7: Significance of Variables in Different Pre-Overlay Conditions (α=0.05) for Models 11 through 14 with Pre-Overlay IRI Divided at 95, 120, and 170 in./mile
Regression Models on Post-Overlay IRI
Significance
Pre-Overlay IRI
Overlay Thickness
Milling Digouts
Overlay Mix Type (OG)
Binder Type (Rubberized)
Random Effect
Model 11 Pre-overlay IRI
< 95 in./mile Yes No Yes Yes No Yes Project
Model 12 Pre-overlay IRI
≥ 95 & < 120 in./mile Yes No Yes No No No Project
Model 13 Pre-overlay IRI
≥ 120 & < 170 in./mile) Yes No No Yes No No Project
Model 14 Pre-overlay IRI ≥ 170 in./mile
Yes Yes No Yes No Yes Project
Notes: 1. Green cells represent a positive effect on improving pavement smoothness. 2. Red cells represent a negative effect on improving pavement smoothness. 3. 95 in./mile = 1.5 m/km, 120 in./mile = 1.9 m/km, 170 in./mile = 1.9 m/km,

UCPRC-RR-2013-09.1 33
Table 3.8: Significance of Variables in Different Pre-Overlay Conditions (α=0.05) for Models 15 and 16
Linear Mixed Effects Models on Post-Overlay IRI with Project as a Random Effects Variable
Coefficients Model 15
Pre-overlay IRI < 120 in./mile (< 1.90 m/km)
Model 16 Pre-overlay IRI ≥ 120 in./mile
(≥ 1.90 m/km)
(Intercept) Yes Yes
Pre-overlay IRI Yes Yes
Thickness No Yes
Milling (Yes) Yes Yes
Digouts (Yes) No Yes
Overlay mix type (OG) No No
Binder Type (Rubberized) Yes No
Thickness*Milling (Yes) No Yes
Thickness*Digouts (Yes) Yes No Thickness*Overlay mix type
(OG) No Yes
Thickness*Binder Type (Rubberized)
No No
Milling (Yes)*Digouts (Yes) No No Milling (Yes)*Overlay mix type
(OG) Yes Yes
Milling (Yes)* Binder Type (Rubberized)
No Yes
Digouts (Yes)*Overlay mix type (OG) Yes No
Digouts (Yes)* Binder Type (Rubberized)
Yes No
Overlay mix type (OG)* Binder Type (Rubberized)
Yes Yes
Notes: 1. Green cells represent a positive effect on pavement smoothness. 2. Red cells represent a negative effect on pavement smoothness.
3.2.2 Re-Analysis of the LTPP SPS-5 Data
The LTPP SPS-5 data were originally used in studies for investigating the effects of pre-overlay repairs, overlay
thickness, and material type of overlay on flexible pavements. Those studies used specially designed experimental
pavements. Since the independent variables in the LTPP SPS-5 data were considered to be very similar to the
independent variables collected in the Caltrans PCS data, a selection of SPS-5 data was made for this project and
re-analyzed. Once the analyses were completed, the results from the LTPP SPS-5 data were compared to the actual
field construction results from the Caltrans PCS data.
Data from 120 subsections were collected from the SPS-5 data, from 15 states and provinces across United States
and Canada. Each state had one overlay project including eight subsections. The dataset included pre-overlay IRI,
post-overlay IRI, overlay thickness (0.167 ft [50 mm] and 0.410 ft [125 mm]), pre-overlay repairs (intense and
minimal), and material used (virgin mixes and 30 percent recycled mixes). Figure 3.18 shows a cumulative
distribution of pre-overlay IRI and post-overlay IRI from the LTPP SPS-5 data. The distribution of the pre-overlay

34 UCPRC-RR-2013-09.1
IRI from the LTPP SPS-5 data is quite similar to that from the Caltrans PCS data, but the distribution of post-
overlay IRI has much lower values than the Caltrans PCS data. It can be seen in Figure 3.18 that the 50th percentile
post-overlay IRI is 56 in./mile, while in the Caltrans PCS data from 2000 to 2009 the 50th percentile value is
76 in./mile (for subsections, Figure 3.3). The cumulative distribution of IRI reduction is shown in Figure 3.19.
Only 5 percent of IRI reduction is negative, a much smaller value than 20 percent from the Caltrans PCS data.
Overall, the overlay projects in the LTPP SPS-5 data showed better performance in post-overlay IRI than the
overlay projects in the Caltrans PCS data.
Figure 3.18: Cumulative distributions of pre-overlay and post-overlay IRI (SPS-5).

UCPRC-RR-2013-09.1 35
Figure 3.19: Cumulative distribution of IRI reduction (SPS-5).
Table 3.9 shows the average pre-overlay IRI, post-overlay IRI, and IRI reduction for each group based on the
LTPP SPS-5 data. As with the PCS data, pre-overlay condition was reclassified into two categories, with Good
being IRI less than 120 in./mile (1.90 m/km) and Poor being IRI greater than 120 in./mile (1.90 m/km). Two
overlay thickness categories were identified in the LTPP SPS-5 data: 0.167 ft (50 mm) and 0.410 ft (125 mm).
Pre-overlay repairs consisted of minimal repairs that included patching and leveling without milling, and intense
repairs that included patching, crack sealing, and milling. Materials included virgin and reclaimed asphalt (referred
to as “recycled” in models) that were used in overlay projects. Boxplots for pre-overlay IRI, post-overlay IRI, and
IRI reduction are shown in Figure 3.20 to Figure 3.22. Based on Table 3.9 and the boxplots, the following points
were drawn from the SPS-5 data:
Pre-overlay condition has a significant effect on both post-overlay IRI and IRI reduction. The post-overlay
IRI was higher in the groups with poor pre-overlay condition. The IRI reduction was higher in the groups
with poor pre-overlay condition as well.
Overlay thickness was shown to have little influence on post-overlay IRI and IRI reduction.
No specific trends could be found for pre-overlay repairs and mix types based on the descriptive statistics
and boxplots.

36 UCPRC-RR-2013-09.1
Table 3.9: Descriptive Statistics of Dataset (SPS-5)
Group Pre-Overlay Condition
Thickness Pre-Overlay
Repairs Mix Type
Number of
Projects
Pre-Overlay IRI
(in./mile)
Post-Overlay IRI
(in./mile)
IRI Reduction(in./mile)
1
Good
Thin Minimal
Virgin 13 88.56 58.97 29.58 2 Recycled 8 81.81 61.78 20.04 3
Intense Virgin 10 86.11 52.84 33.26
4 Recycled 7 79.56 48.24 31.32 5
Thick Minimal
Virgin 10 90.16 55.95 34.21 6 Recycled 9 89.20 53.79 35.41 7
Intense Virgin 9 84.76 60.97 23.80
8 Recycled 12 89.13 53.38 35.75 9
Poor
Thin Minimal
Virgin 2 162.52 74.45 88.07 10 Recycled 8 155.68 71.69 84.00 11
Intense Virgin 5 142.69 65.01 77.68
12 Recycled 8 144.94 67.40 77.54 13
Thick Minimal
Virgin 5 153.33 70.08 83.26 14 Recycled 6 144.25 68.11 76.14 15
Intense Virgin 6 151.75 57.24 94.51
16 Recycled 3 145.31 66.74 78.57 Notes: 1. Good pre-overlay condition: pre-overlay IRI < 120 in./mile (1.90 m/km); poor pre-overlay condition: pre-overlay
IRI ≥ 120 in./mile (1.90 m/km) 2. Thin overlay: 0.167 ft (50 mm); thick overlay: 0.410 ft (125 mm)
Figure 3.20: Boxplots of pre-overlay IRI for each group in LTPP SPS-5.

UCPRC-RR-2013-09.1 37
Figure 3.21: Boxplots of post-overlay IRI for each group in LTPP SPS-5.
Figure 3.22: Boxplots of IRI reduction for each group in LTPP SPS-5.

38 UCPRC-RR-2013-09.1
As with the Caltrans PCS data, mixed effect models were used to investigate the effects of variables in the LTPP
SPS-5 data. In the regression models, post-overlay IRI was the dependent variable; and pre-overlay IRI, overlay
thickness, pre-overlay repair (minimal or intense), and mix type (virgin or recycled) were the independent
variables. Pre-overlay IRI was analyzed as a continuous variable, and the rest of factors were analyzed as
categorical variables. State was considered to be the random effect variable in the regression models.
Table 3.10 shows the results of the regression models, and indicates that pre-overlay condition and surface
preparation are the only two variables that had significant effects on the smoothness of overlays in the model with
all of the data. The results from this re-analysis of the regression models differ from the earlier studies. The
difference might be due to the use of mixed effects models in this study. The following conclusions were drawn
from the regression analysis of the LTPP SPS-5 data:
Pre-overlay condition was a significant factor for the model that analyzed all of the LTPP SPS-5 data.
Overlay thickness and mix type have no effect on the post-overlay IRI.
According to the analysis of the LTPP SPS-5 data, milling has a positive effect on the post-overlay IRI.
No significant variables were found for the models with two categories of pre-overlay condition. This
result might be due to the small sample size.
Table 3.10: Significance of Variables in Different Pre-Overlay Condition (α=0.05) for Models 17 through 19
Regression Models on Post-
Overlay IRI
Significance
Pre-Overlay IRI Overlay
Thickness Pre-Overlay
Repairs Overlay Mix Type
Random Effect
Model 17 All data
Yes No Yes No State
Model 18 Pre-overlay IRI < 120 in./mile (< 1.90 m/km)
No No No No State
Model 19 Pre-overlay IRI ≥ 120 in./mile (≥ 1.90 m/km)
No No No No State
Notes: 1. Green cells represent a positive effect on improving pavement smoothness. 2. Red cells represent a negative effect on improving pavement smoothness.

UCPRC-RR-2013-09.1 39
4 CONCLUSIONS AND RECOMMENDATIONS
4.1 Conclusions
In this research study, California Pavement Condition Survey (PCS) data from overlays constructed based on the
profilograph specification were analyzed using mixed effect models, and the effects of several factors on initial
overlay smoothness were evaluated. The PCS data were collected prior to the 2013 implementation of the Caltrans
smoothness specification for overlay construction based on IRI. Based on the results of the analysis of the available
data, the following conclusions were drawn:
Regardless of other factors, applying an overlay on a pavement with a low pre-overlay IRI can further
reduce the post-overlay IRI.
Increasing the thickness of an overlay has no additional benefit when the pre-overlay IRI is less than
120 in./mile (1.90 m/km). When the pre-overlay IRI is greater than 120 in./mile, thicker dense- and
rubberized gap-graded overlays reduce post-overlay IRI more than thinner overlays do. Considering that
some of the medium overlays (0.25 ft to 0.40 ft thick) and all of the thick overlays (thicker than 0.45 ft)
would have been paved in two or sometimes more lifts, the multiple passes of the paver would have
contributed to the improved smoothness. With open-graded mixes, overlay thickness does not show any
significant effect on post-overlay IRI, reflecting the narrower range of thicknesses for open-graded
overlays. The thickness effect could not be separated for different kinds of open-graded overlays
(conventional, polymer-modified, rubberized, bonded wearing course).
Milling prior to overlay and using rubberized binder (grouping gap-graded and open-graded mixes
together in the statistical analysis) alone do not provide any additional benefits for achieving lower post-
overlay IRI based on the data used for this study from the period of 2000 to 2009. As with all of the results
in this study, changes in specifications and quality assurance practice may change this conclusion.
However, using rubberized binder in open-graded overlays may help achieve lower post-overlay IRI.
Milling prior to overlay on pavements with existing IRI less than 120 in./mile, and particularly when the
existing IRI is less than 95 in./mile, is disadvantageous and will likely result in a rougher pavement than
if milling had not been done, based on the data used for this study. As with all of the results in this study,
changes in specifications and quality assurance practice may change this conclusion.
Digouts, which should be done to correct cracking in the wheelpath prior to overlay, generally provide a
benefit when the pre-overlay IRI is greater than 95 in./mile, but they have the greatest benefit in reducing
post-overlay IRI when the pre-overlay IRI is greater than 120 in./mile.
Analysis of the Caltrans PCS database indicates that projects with digouts in the wheelpath have better
post-overlay IRI than those that were milled across the entire width of the pavement prior to overlay. This
result may be because relatively shallow milling (see definition above) may not address underlying

40 UCPRC-RR-2013-09.1
structural problems in the wheelpaths, while digouts are generally only used where there are evident
structural problems in the wheelpaths and, as defined for this study (see above), result in deeper removal
of material in those locations.
Although, in general, overlay mix type alone (open-graded versus dense- and gap-graded) has no effect
on post-overlay IRI, milling or digouts prior to placing open-graded overlays may help to achieve lower
post-overlay IRI.
Sparse data indicate that milling of existing open-graded surfaces prior to overlay may result in rougher
overlays than if milling was not done.
The IRI measurements presented were made after the close of each construction contract and therefore they
include the effects of any grinding that Caltrans required the contractor to perform prior to that close.
A similar analysis of the LTPP SPS-5 sections from 120 subsections collected from the SPS-5 data—from fifteen
states and provinces across the United States and Canada—resulted in the following conclusions:
Overall, pre-overlay condition has a significant effect on both post-overlay IRI and IRI reduction. Post-
overlay IRI was higher in the groups with poor pre-overlay condition, although IRI reduction was also
higher in the groups with poor pre-overlay condition.
Overlay thickness was shown to have little influence on post-overlay IRI and IRI reduction for all mixes
included in those sections. There was no information available regarding lift thicknesses used for different
overlay total thicknesses. This finding is somewhat different from that found using the Caltrans data which
showed that overlay thickness had no benefit on post-overlay IRI when the pre-overlay IRI was below
120 in./mile, but showed a benefit of thicker overlays when the pre-overlay IRI was greater than
120 in./mile.
No specific trends could be found for pre-overlay repairs and mix types based on the descriptive statistics
and boxplots.
4.2 Recommendations
The following recommendations are based on the conclusions of this study:
Caltrans should use the results of this study to provide guidance to designers regarding use of milling and
recommend against using milling as a means to improve the smoothness of an overlay when the IRI of
the existing pavement is less than 120 in./mile (1.9 m/km). Changes in milling practice since 2009 may
change this recommendation, but this should be investigated using projects built since the change in the
Caltrans smoothness specification in 2013.
UCPRC-RR-2013-09.1 41
Digouts are used for pre-overlay repair to remove cracking only in the wheelpaths and only when the
nonwheelpath pavement is in satisfactory condition; a decision to use digouts is based solely on the
severity and extent of cracking. However, consideration should be given to using separate IRI
performance equations in the PaveM pavement management system for overlays with and without digouts
since their use on rough pavements helps improve overlay smoothness.
Caltrans should compare the results from this study, which is based on data collected prior to
implementation of an IRI-based construction smoothness specification in 2013, with smoothness values
obtained since implementation of the new smoothness specification to see if it has resulted in any changes
in the findings of this study and whether adjustments to the specification are needed or desired. These
new measurements should be taken by the UCPRC prior to any grinding for smoothness that Caltrans
requires the contractor to do prior to closing the construction contract, and if possible the UCPRC should
also collect information regarding the amount of grinding that was required to pass the specification.

42 UCPRC-RR-2013-09.1
REFERENCES
1. Smith, K.L., Smith, K.D., Evans, L.D., Hoerner, T.E., Darter, M.I., and Woodstrom, J.H. “Smoothness
specifications for pavements.” NCHRP Web Document 1, 1997. www.nap.edu/openbook.php?isbn=nch001.
(Accessed Dec. 20, 2012.)
2. Chatti, K., and Zaabar, I. “Estimating the effects of pavement condition on vehicle operating costs.”
Transportation Research Board, NCHRP Report 720, 2012.
3. Wang, T., Lee, I.-S., Kendall, A., Harvey, J., Lee, E.-B., and Kim, C. “Life cycle energy consumption and
GHG emission from pavement rehabilitation with different rolling resistance,” Journal of Cleaner Production,
Vol. 33, pp. 86-96, 2012.
4. Von Quintus, H.L., Eltahan, A., and Yau, A. “Smoothness models for hot-mix asphalt-surfaced pavements:
Developed from long-term pavement performance program data,” Transportation Research Record: Journal
of the Transportation Research Board, Vol. 1764, pp. 139–156, 2001.
5. Sayers M.W., and Karamihas, S.M. The Little Book of Profiling. University of Michigan Transportation
Research Institute, Michigan, U.S., 1998.
6. FHWA. DataPave Online. www.datapave.com. (Accessed Dec. 15, 2012.)
7. West, R., Michael, J., Turochy, R., and Maghsoodloo, S. “Use of data from specific pavement studies
experiment 5 in the long-term pavement performance program to compare virgin and recycled asphalt
pavements,” Transportation Research Record: Journal of the Transportation Research Board, Vol. 2208,
pp. 82–89, 2011.
8. Raymond, C.M., Tighe, S.L., Haas, R., and Rothenburg, L. “Analysis of influences on as-built pavement
roughness in asphalt overlays.” International Journal of Pavement Engineering, Vol. 4, pp. 181–192, 2003.
9. Perera, R.W., and Kohn, S.D. “International roughness index of asphalt concrete overlays: Analysis of data
from long-term pavement performance program SPS-5 projects,” Transportation Research Record: Journal
of the Transportation Research Board, Vol. 1655, pp. 100–109, 1999.
10. Hall, K.T., Correa, C.E., and Simpson, A.L. “Performance of flexible pavement rehabilitation treatments in
the long-term pavement performance SPS-5 experiment,” Transportation Research Record: Journal of the
Transportation Research Board, Vol. 1823, pp. 93–101, 2003.
11. Wen, H., Titi, H., and Berry, D. Study of Best Practices for Pre-overlay Repair and Asphalt Overlay, in Airfield
and Highway Pavement: Meeting Today’s Challenges with Emerging Technologies. Edited by I. Al-Qadi.
ASCE, Reston, Va., 2006, pp. 815–823.
12. McGhee, K.K. “Measuring, Achieving, and Promoting Smoothness of Virginia’s Asphalt Overlays,”
No. VTRC 9-R19, 1999.

UCPRC-RR-2013-09.1 43
13. Smith, J.T., and Tighe, S.L. “Assessment of overlay roughness in long-term pavement performance test sites:
Canadian case study,” Transportation Research Record: Journal of the Transportation Research Board,
Vol. 1869, pp. 126–135, 2004.
14. Holzschuher, C., Scott, S., and Kroodsma, K. Flexible Pavement Smoothness Acceptance Report,
International Roughness Index Edition. State of Florida Department of Transportation FL/DOT/SMO/11-546,
2011.

44 UCPRC-RR-2013-09.1
APPENDIX
Table A.1: Descriptive Statistics of Dataset
Group Pre-
Overlay Condition
Overlay Thickness
Milling Digout Surface
Type
RubberizedMaterial
Used
Number of
Projects
Number of
Subsections
Avg. Pre- Overlay
IRI (in./mile)
SD Pre- Overlay
IRI (in./mile)
Post- Overlay
IRI (in./mile)
SD Post-Overlay
IRI (in./mile)
Reduction IRI
(in./mile)
SD of Reduction
IRI (in./mile)
1
Good
Thin
No No
Non-OG No 7 19 103 10 70 12 33 14 Yes 12 128 87 22 74 24 13 18
OG No 17 227 80 19 73 22 7 17
Yes 17 276 80 18 65 19 16 19
2 No Yes Non-OG
No 8 126 86 22 71 21 15 24 Yes 30 366 80 20 70 20 9 20
OG No 11 170 95 16 96 21 -1 25 Yes 10 317 73 17 60 13 13 19
3 Yes No Non-OG
No 7 58 95 16 91 16 4 18 Yes 10 284 96 16 87 18 9 20
OG No 3 24 87 16 67 17 20 24 Yes 3 56 60 10 56 11 4 14
4 Yes Yes Non-OG
No 4 38 102 12 91 23 11 23 Yes 8 134 82 18 78 17 4 16
OG No 1 50 66 25 78 13 -13 22 Yes 2 26 71 20 62 9 9 22
5
Thick
No No Non-OG
No 9 46 84 18 74 17 10 18 Yes 3 10 82 15 70 14 12 18
OG No 6 31 78 22 65 21 13 19 Yes 1 10 95 11 62 5 33 9
6 No Yes Non-OG
No 11 58 92 21 72 23 20 26 Yes 4 60 83 16 63 13 20 17
OG No 2 4 110 5 88 14 22 18 Yes 3 20 97 14 82 17 15 21
7 Yes No Non-OG
No 15 72 93 16 80 22 13 21 Yes 2 5 84 15 97 19 -13 31
OG No 2 96 62 13 51 12 11 14 Yes 1 2 107 0 106 1 1 1
8 Yes Yes Non-OG
No 2 7 83 24 65 18 19 21 Yes 2 63 95 16 51 9 44 19
OG No 1 9 83 15 65 13 19 17 Yes 2 2 95 2 51 36 44 33
Note: SD = Standard Deviation
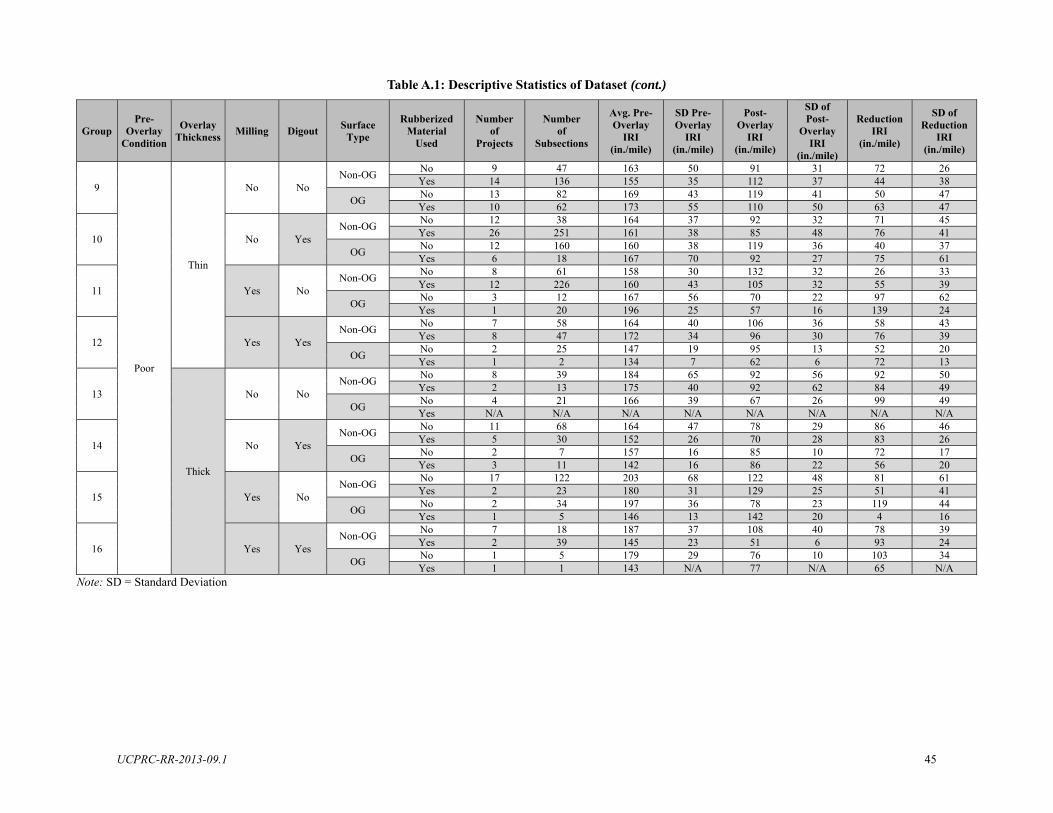
UCPRC-RR-2013-09.1 45
Table A.1: Descriptive Statistics of Dataset (cont.)
Group Pre-
Overlay Condition
Overlay Thickness
Milling Digout Surface
Type
RubberizedMaterial
Used
Number of
Projects
Number of
Subsections
Avg. Pre- Overlay
IRI (in./mile)
SD Pre- Overlay
IRI (in./mile)
Post- Overlay
IRI (in./mile)
SD of Post-
Overlay IRI
(in./mile)
Reduction IRI
(in./mile)
SD of Reduction
IRI (in./mile)
9
Poor
Thin
No No Non-OG
No 9 47 163 50 91 31 72 26 Yes 14 136 155 35 112 37 44 38
OG No 13 82 169 43 119 41 50 47 Yes 10 62 173 55 110 50 63 47
10 No Yes Non-OG
No 12 38 164 37 92 32 71 45 Yes 26 251 161 38 85 48 76 41
OG No 12 160 160 38 119 36 40 37 Yes 6 18 167 70 92 27 75 61
11 Yes No Non-OG
No 8 61 158 30 132 32 26 33 Yes 12 226 160 43 105 32 55 39
OG No 3 12 167 56 70 22 97 62 Yes 1 20 196 25 57 16 139 24
12 Yes Yes Non-OG
No 7 58 164 40 106 36 58 43 Yes 8 47 172 34 96 30 76 39
OG No 2 25 147 19 95 13 52 20 Yes 1 2 134 7 62 6 72 13
13
Thick
No No Non-OG
No 8 39 184 65 92 56 92 50 Yes 2 13 175 40 92 62 84 49
OG No 4 21 166 39 67 26 99 49 Yes N/A N/A N/A N/A N/A N/A N/A N/A
14 No Yes Non-OG
No 11 68 164 47 78 29 86 46 Yes 5 30 152 26 70 28 83 26
OG No 2 7 157 16 85 10 72 17 Yes 3 11 142 16 86 22 56 20
15 Yes No Non-OG
No 17 122 203 68 122 48 81 61 Yes 2 23 180 31 129 25 51 41
OG No 2 34 197 36 78 23 119 44 Yes 1 5 146 13 142 20 4 16
16 Yes Yes Non-OG
No 7 18 187 37 108 40 78 39 Yes 2 39 145 23 51 6 93 24
OG No 1 5 179 29 76 10 103 34 Yes 1 1 143 N/A 77 N/A 65 N/A
Note: SD = Standard Deviation

46 UCPRC-RR-2013-09.1
Table A.2: Number of Subsections for Each Group (Milling) Pre-Overlay Condition
Number of Subsections
Thickness Number of Subsections
Milling Number of Subsections
Overlay Mix Type
Number of Subsections
Rubberized Overlay
Number of Subsections
Good 2,794
Thin 2,299
No 1,629 Non-OG 639
No 145 Yes 494
OG 990 No 397 Yes 593
Yes 670 Non-OG 514
No 96 Yes 418
OG 156 No 74 Yes 82
Thick 495
No 239 Non-OG 174
No 104 Yes 70
OG 65 No 35 Yes 30
Yes 256 Non-OG 147
No 79 Yes 68
OG 109 No 105 Yes 4
Poor 1,681
Thin 1,245
No 794
Non-OG 472 No 85
Yes 387
OG 322 No 242
Yes 80
Yes 451
Non-OG 392 No 119
Yes 273
OG 59 No 37
Yes 22
Thick 436
No 189
Non-OG 150 No 107
Yes 43
OG 39 No 28
Yes 11
Yes 247
Non-OG 202 No 140
Yes 62
OG 45 No 39
Yes 6

UCPRC-RR-2013-09.1 47
Table A.3: Number of Subsections for Each Group (Digouts) Pre-Overlay Condition
Number of Subsections
Thickness Number of Subsections
Digouts Number of Subsections
Overlay Mix Type
Number of Subsections
Rubberized Overlay
Number of Subsections
Good 2,794
Thin 2,299
No 1,072 Non-OG 489
No 77 Yes 412
OG 583 No 251 Yes 332
Yes 1,227 Non-OG 664
No 164 Yes 500
OG 563 No 220 Yes 343
Thick 495
No 272 Non-OG 133
No 118 Yes 15
OG 139 No 127 Yes 12
Yes 223 Non-OG 188
No 65 Yes 123
OG 35 No 13 Yes 22
Poor 1,681
Thin 1,245
No 646
Non-OG 470 No 108
Yes 362
OG 176 No 94
Yes 82
Yes 559
Non-OG 394 No 96
Yes 298
OG 205 No 185
Yes 20
Thick 436
No 257
Non-OG 197 No 161
Yes 36
OG 60 No 55
Yes 5
Yes 179
Non-OG 155 No 86
Yes 69
OG 24 No 12
Yes 12
Table A.4: Regression Results of Model 1 (α=0.05)
Model 1
Coefficients: Estimate Std. Error t-value Pr(>|t|) Significance
(Intercept) 53.688690 2.408578 22.29 0.0001 Yes
Pre-overlay IRI 0.280152 0.007794 35.95 0.0001 Yes
Thickness 1.591108 2.559577 0.62 0.9378 No
Milling (Yes) 4.807362 1.671557 2.88 0.0008 Yes
Digouts (Yes) -4.595220 1.180360 -3.89 0.0001 Yes
Overlay mix type (OG) -5.409904 2.296037 -2.36 0.0142 Yes
Binder type (Rubberized) -0.120175 1.786771 -0.07 0.4904 No

48 UCPRC-RR-2013-09.1
Table A.5: Regression Results of Model 2 (α= 0.05)
Model 2
Coefficients Estimate Std. Error t-value Pr(>|t|) Significance
(Intercept) 82.4201 2.4955 33.03 0.0001 Yes
Pre-overlay IRI 15.9924 0.8379 19.09 0.0001 Yes
Thickness 4.2779 2.4717 1.73 0.7796 No
Milling (Yes) 6.9828 1.8447 3.79 0.0001 Yes
Digouts (Yes) -5.4406 1.2920 -4.21 0.0001 Yes
Overlay mix type (OG) -9.0316 2.5671 -3.52 0.0002 Yes
Binder type (Rubberized) -0.6606 1.9958 -0.33 0.1674 No
Table A.6: Regression Results of Model 3 (α= 0.05)
Model 3
Coefficients Estimate Std. Error t-value Pr(>|t|) Significance
(Intercept) 53.170535 4.449969 11.95 0.0001 Yes
Pre-overlay IRI 0.277631 0.007775 35.71 0.0001 Yes
Thickness 1.844065 2.553524 0.72 0.7090 No
Milling (Yes) 6.478822 1.713821 3.78 0.0002 Yes
Digouts (Yes) -4.199970 1.181123 -3.56 0.0002 Yes
Overlay mix type (OG) -4.866324 2.341401 -2.08 0.0234 Yes
Binder type (Rubberized) 0.874185 1.877612 0.47 0.8500 No
Table A.7: Regression Results of Model 4 (α= 0.05)
Model 4
Coefficients Estimate Std. Error t-value Pr(>|t|) Significance
(Intercept) 82.3025 5.6529 14.559 0.0001 Yes
Pre-overlay IRI 15.8765 0.8331 19.058 0.0001 Yes
Thickness 3.1447 2.5005 1.258 0.6780 No
Milling (Yes) 9.0695 1.8958 4.784 0.0001 Yes
Digouts (Yes) -4.9165 1.2906 -3.810 0.0002 Yes
Overlay mix type (OG) -9.0828 2.6086 -3.098 0.0002 Yes
Binder type (Rubberized) 0.9872 2.0889 0.473 0.8256 No

UCPRC-RR-2013-09.1 49
Table A.8: Regression Results of Model 5 (α= 0.05)
Model 5
Coefficients Estimate Std. Error t-value Pr(>|t|) Significance
(Intercept) -53.688690 2.408578 -22.29 0.0001 Yes
Pre-overlay IRI 0.719848 0.007794 92.36 0.0001 Yes
Thickness -1.591108 2.559577 -0.62 0.9090 No
Milling (Yes) -4.807362 1.671557 -2.88 0.0004 Yes
Digouts (Yes) 4.595220 1.180360 3.89 0.0001 Yes
Overlay mix type (OG) 5.409904 2.296037 2.36 0.0120 Yes
Binder type (Rubberized) 0.120175 1.786771 0.07 0.4886 No
Table A.9: Regression Results of Model 6 (α= 0.05)
Model 6
Coefficients Estimate Std. Error t-value Pr(>|t|) Significance
(Intercept) 13.4966 2.6635 5.07 0.0001 Yes
Pre-overlay IRI 52.4861 1.0475 50.11 0.0001 Yes
Thickness 7.5022 2.7477 2.73 0.0018 Yes
Milling (Yes) -0.5042 2.1524 -0.23 0.5466 No
Digouts (Yes) 2.7082 1.5516 1.75 0.0820 No
Overlay mix type (OG) -1.6738 2.7110 -0.62 0.6180 No
Binder type (Rubberized) -0.5942 2.2277 -0.27 0.8858 No
Table A.10: Regression Results of Model 7 (α= 0.05)
Model 7
Coefficients Estimate Std. Error t-value Pr(>|t|) Significance
(Intercept) -53.170535 4.449969 -11.95 0.0001 Yes
Pre-overlay IRI 0.722369 0.007775 92.91 0.0001 Yes
Thickness -1.844065 2.553524 -0.72 0.6938 No
Milling (Yes) -6.478822 1.713821 -3.78 0.0002 Yes
Digouts (Yes) 4.199970 1.181123 3.56 0.0008 Yes
Overlay mix type (OG) 4.866324 2.341401 2.08 0.0234 Yes
Binder type (Rubberized) -0.874185 1.877612 -0.47 0.8842 No

50 UCPRC-RR-2013-09.1
Table A.11: Regression Results of Model 8 (α= 0.05)
Model 8
Coefficients Estimate Std. Error t-value Pr(>|t|) Significance
(Intercept) 14.1579 3.0809 4.60 0.0008 Yes
Pre-overlay IRI 52.4804 1.0475 50.10 0.0001 Yes
Thickness 7.3296 2.7535 2.66 0.0018 Yes
Milling (Yes) -1.0393 2.1724 -0.48 0.3986 No
Digouts (Yes) 2.6471 1.5540 1.70 0.1012 No
Overlay mix type (OG) -1.7841 2.7351 -0.65 0.4832 No
Binder type (Rubberized) -0.4544 2.2962 -0.20 0.7814 No
Table A.12: Regression Results of Model 9 (α= 0.05)
Model 9
Coefficients Estimate Std. Error t-value Pr(>|t|) Significance
(Intercept) 42.68821 2.42809 17.581 0.0001 Yes
Pre-overlay IRI 0.34006 0.01719 19.788 0.0001 Yes
Thickness 2.43273 2.17532 1.118 0.6628 No
Milling (Yes) 5.91571 1.47985 3.998 0.0008 Yes
Digouts (Yes) 0.47711 0.94026 0.507 0.6074 No
Overlay mix type (OG) -1.63934 1.88113 -0.871 0.2628 No
Binder type (Rubberized) -0.25391 1.47802 -0.172 0.2718 No
Table A.13: Regression Results of Model 10 (α=0.05)
Model 10
Coefficients Estimate Std. Error t-value Pr(>|t|) Significance
(Intercept) 54.77480 4.92648 11.118 0.0001 Yes
Pre-overlay IRI 0.34627 0.01732 19.990 0.0001 Yes
Thickness -0.91947 5.65146 -0.163 0.3884 No
Milling (Yes) -1.27644 3.36150 -0.380 0.5686 No
Digouts (Yes) -19.40115 2.86119 -6.781 0.0001 Yes
Overlay mix type (OG) -7.71945 4.24860 -1.817 0.1258 No
Binder type (Rubberized) -1.89548 3.62718 -0.523 0.5606 No

UCPRC-RR-2013-09.1 51
Table A.14: Regression Results of Model 11 (α=0.05)
Model 11
Coefficients Estimate Std. Error t-value Pr(>|t|) Significance
(Intercept) 38.79442 2.67663 14.494 0.0001 Yes
Pre-overlay IRI 0.39447 0.02515 15.686 0.0001 Yes
Thickness 2.86763 2.28841 1.253 0.5420 No
Milling (Yes) 4.47956 1.60469 2.792 0.0072 Yes
Digouts (Yes) 2.07726 0.97273 2.136 0.0262 Yes
Overlay mix type (OG) -0.97793 1.97046 -0.496 0.3716 No
Binder type (Rubberized) -3.53387 1.59471 -2.216 0.0082 Yes
Table A.15: Regression Results of Model 12 (α=0.05)
Model 12
Coefficients Estimate Std. Error t-value Pr(>|t|) Significance
(Intercept) 58.45510 9.89032 5.910 0.0001 Yes
Pre-overlay IRI 0.24064 0.08654 2.781 0.0166 Yes
Thickness -3.79298 4.40084 -0.862 0.2074 No
Milling (Yes) 7.51982 2.82429 2.663 0.0218 Yes
Digouts (Yes) -3.96105 2.00838 -1.972 0.0536 No
Overlay mix type (OG) -3.25365 3.01969 -1.077 0.2764 No
Binder type (Rubberized) -2.60385 2.55675 -1.018 0.0520 No
Table A.16: Regression Results of Model 13 (α=0.05)
Model 13
Coefficients Estimate Std. Error t-value Pr(>|t|) Significance
(Intercept) 56.67975 7.49530 7.562 0.0001 Yes
Pre-overlay IRI 0.27535 0.04647 5.925 0.0001 Yes
Thickness 0.61029 4.63766 0.132 0.5538 No
Milling (Yes) -2.59598 3.25736 0.797 0.0726 No
Digouts (Yes) -15.07081 2.58210 -5.837 0.0001 Yes
Overlay mix type (OG) -1.68049 4.28519 -0.392 0.9100 No
Binder type (Rubberized) 3.36190 3.52332 0.954 0.4446 No

52 UCPRC-RR-2013-09.1
Table A.17: Regression Results of Model 14 (α=0.05)
Model 14
Coefficients Estimate Std. Error t-value Pr(>|t|) Significance
(Intercept) 56.67975 7.49530 7.562 0.0001 Yes
Pre-overlay IRI 0.27535 0.04674 5.925 0.0001 Yes
Thickness 0.61029 4.63766 0.132 0.0024 Yes
Milling (Yes) 2.59598 3.25736 0.797 0.6296 No
Digouts (Yes) -15.07081 2.58210 -5.837 0.0001 Yes
Overlay mix type (OG) -1.68049 4.28519 -0.392 0.0556 No
Binder type (Rubberized) 3.36190 3.52332 -0.954 0.0048 Yes
Table A.18: Regression Results of Model 15 (α=0.05)
Multiple Regression Analysis: Model 15
Coefficients Estimate Std. Error t-value Pr(>|t|) Significance
(Intercept) 39.36153 3.40027 11.576 0.0001 Yes
Pre-overlay IRI 0.32842 0.01726 19.031 0.0001 Yes
Thickness 0.56205 4.28228 0.131 0.9790 No
Milling (Yes) 11.38524 3.55008 3.207 0.0004 Yes
Digouts (Yes) 3.22908 2.68715 1.202 0.2878 No
Overlay mix type (OG) 2.96872 3.27755 0.906 0.4342 No
Rubberized Overlay (Yes) 7.94607 3.43977 2.310 0.0414 Yes
Thickness*Milling (Yes) -3.54927 5.59309 -0.635 0.3662 No
Thickness*Digouts (Yes) -11.91048 5.53230 -2.153 0.0278 Yes
Thickness*Overlay mix type (OG) 3.13222 5.58884 0.560 0.5712 No
Thickness*Rubberized Overlay (Yes) 7.28784 8.00925 0.910 0.3382 No
Milling (Yes)*Digouts (Yes) 3.45917 2.07635 1.666 0.1442 No
Milling (Yes)*Overlay mix type (OG) -10.52115 3.41884 -3.077 0.0004 Yes
Milling (Yes)*Rubberized Overlay (Yes) -1.80557 3.57168 -0.506 0.1730 No
Digouts (Yes)*Overlay mix type (OG) 4.40895 1.96688 2.242 0.0102 Yes
Digouts (Yes)*Rubberized Overlay (Yes) -5.84029 2.26765 -2.575 0.0086 Yes
Overlay mix type (OG)*Rubberized Overlay (Yes) -10.78510 3.61616 -2.982 0.0018 Yes

UCPRC-RR-2013-09.1 53
Table A.19: Regression Results of Model 16 (α=0.05)
Multiple Regression Analysis: Model 16
Coefficients Estimate Std. Error t-value Pr(>|t|) Significance
(Intercept) 54.80594 6.56091 8.353 0.0001 Yes
Pre-overlay IRI 0.34631 0.01706 20.298 0.0001 Yes
Thickness -33.79657 12.66940 -2.668 0.0062 Yes
Milling (Yes) 8.23098 6.31754 1.303 0.0286 Yes
Digouts (Yes) -27.80400 6.29974 -4.414 0.0004 Yes
Overlay mix type (OG) 2.90719 7.13799 0.407 0.5866 No
Rubberized Overlay (Yes) 6.33247 6.74535 0.939 0.1098 No
Thickness*Milling (Yes) 23.20683 10.88609 2.132 0.0406 Yes
Thickness*Digout (Yes) 6.84401 10.51592 0.651 0.8626 No
Thickness*Overlay mix type (OG) 27.61267 11.68240 2.364 0.0210 Yes
Thickness*Rubberized Overlay (Yes) 18.77007 24.93357 0.753 0.3406 No
Milling (Yes)*Digouts (Yes) 12.50828 5.66084 2.210 0.0502 No
Milling (Yes)*Overlay mix type (OG) -44.40778 8.20404 -5.413 0.0001 Yes
Milling (Yes)*Rubberized Overlay (Yes) -22.72801 7.40836 -3.068 0.0001 Yes
Digouts (Yes)*Overlay mix type (OG) 3.98700 6.22687 0.640 0.2326 No
Digouts (Yes)*Rubberized Overlay (Yes) 2.75788 6.02034 0.458 0.4202 No
Overlay mix type (OG)*Rubberized Overlay (Yes) -22.45089 8.79987 -2.551 0.0144 Yes
Table A.20: Regression Results of Model 17 (α=0.05)
Model 17
Coefficients Estimate Std. Error t-value Pr(>|t|) Significance
(Intercept) 56.6053 6.21325 9.110 0.0001 Yes
Pre-overlay IRI 0.0549 0.04253 1.291 0.0272 Yes
Thickness (Thick) -1.7776 1.74866 -1.017 0.3690 No
Pre-overlay Repairs (Intense) -4.1017 1.74976 -2.344 0.0426 Yes
Mix Type (Recycled) 0.3698 1.75706 0.210 0.9218 No
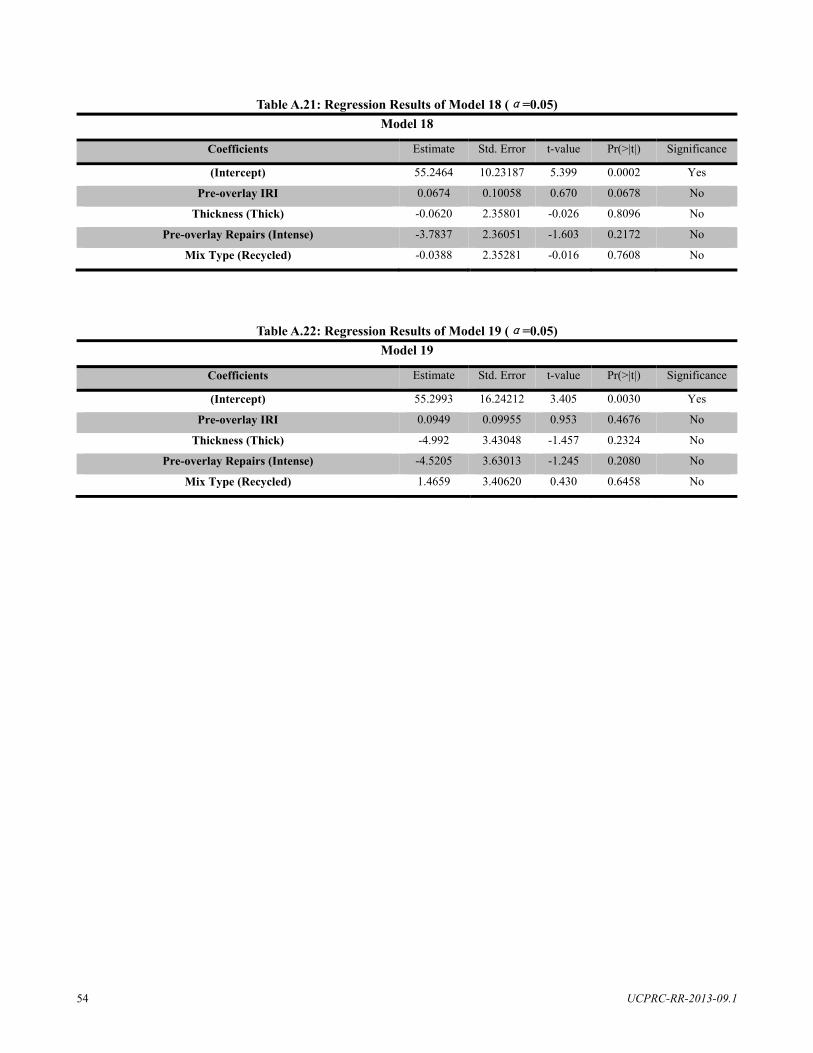
54 UCPRC-RR-2013-09.1
Table A.21: Regression Results of Model 18 (α=0.05)
Model 18
Coefficients Estimate Std. Error t-value Pr(>|t|) Significance
(Intercept) 55.2464 10.23187 5.399 0.0002 Yes
Pre-overlay IRI 0.0674 0.10058 0.670 0.0678 No
Thickness (Thick) -0.0620 2.35801 -0.026 0.8096 No
Pre-overlay Repairs (Intense) -3.7837 2.36051 -1.603 0.2172 No
Mix Type (Recycled) -0.0388 2.35281 -0.016 0.7608 No
Table A.22: Regression Results of Model 19 (α=0.05)
Model 19
Coefficients Estimate Std. Error t-value Pr(>|t|) Significance
(Intercept) 55.2993 16.24212 3.405 0.0030 Yes
Pre-overlay IRI 0.0949 0.09955 0.953 0.4676 No
Thickness (Thick) -4.992 3.43048 -1.457 0.2324 No
Pre-overlay Repairs (Intense) -4.5205 3.63013 -1.245 0.2080 No
Mix Type (Recycled) 1.4659 3.40620 0.430 0.6458 No