assessing iri vs. pi as a measure of pavement smoothness · as a measure of pavement smoothness ......
TRANSCRIPT

Assessing IRI vs PI as a Measure of Pavement Smoothness
Organizational Results Research Report June 2006 OR06017
Prepared by Missouri
Transportation Institute and
Missouri Department of
Transportation
Assessing IRI vs PI as a Measurement of Pavement Smoothness
FINAL REPORT
RI06-003
Prepared for the Missouri Department of Transportation
Organizational Results
by
Charles J Nemmers PE University of Missouri-Columbia Nicolas Gagarin PhD PE Starodub Inc Kensington MD
James R Mekemson PhD PE Starodub Inc Kensington MD
June 2006
The opinions findings and conclusions expressed in this report are those of the principal investigator and the Missouri Department of Transportation They are not necessarily those of the US Department of Transportation or the Federal Highway Administration This report does not constitute a standard specification or regulation
1 Report No OR06-17
2 Government Accession No 3 Recipients Catalog No
4 Title and Subtitle Assessing IRI vs PI as a Measurement of Pavement Smoothness
5 Report Date June 7 2006 6 Performing Organization Code
7 Author(s)
Nicolas Gagarin PhD PE James R Mekemson PhD PE and Charles J Nemmers PE
8 Performing Organization Report No
9 Performing Organization Name and Address University of Missouri-Columbia E2509 Lafferre Hall Columbia MO 65211
10 Work Unit No
11 Contract or Grant No R106-003
12 Sponsoring Agency Name and Address Missouri Transportation Institute for Missouri Department of Transportation 710 University Drive Ste 100 Rolla MO 65409-1470
13 Type of Report and Period Final Report 14 Sponsoring Agency Code MTI MoDOT
15 Supplementary Notes Starodub Inc from Kensington Maryland was a subcontractor on the project
16 Abstract A Pavement smoothness specification that allows either the International Roughness Index (IRI) or Profile Index (PI) to measure pavement smoothness would be advantageous to both industry and MoDOT This brief study provides for MoDOT an understanding of the relationship between IRI and PI an analysis comparing the two systems a review of potential specifications and offers a ldquosmoothness adjustment tablerdquo that would fit into Section 502153 of the Missouri specifications Furthermore safeguards against the potential manipulation of the data within both IRI and PI systems are discussed With proper certification procedures for equipment and operators and a random verification program on the measurement of smoothness it is unlikely that the state DOT will encounter a problem with systematic alterations of inertial profiling data Sample specifications from Connecticut DOT Ohio DOT and Minnesota DOT are included in the report as they are good examples of specifications that MoDOT may wish to use as a pattern for their specification 17 Key Words International Roughness Index (IRI) Profile Index (PI) inertial measurements profilometer pavement smoothness pavement roughness blanking bands California profilometer
18 Distribution Statement No restrictions This document is available to the public through National Technical Information Center Springfield Virginia 22161
19 Security Classification (of this report) Unclassified
20 Security Classification (of this page) Unclassified
21 No of Pages
63 pages
22 Price
2
Executive Summary
A Pavement smoothness specification that allows either the International Roughness Index (IRI) or Profile Index (PI) to measure pavement smoothness would be advantageous to both industry and MoDOT This brief study provides for MoDOT an understanding of the relationship between IRI and PI an analysis comparing the two systems and a review of the current state of the practice Sample specifications from Connecticut DOT Ohio DOT and Minnesota DOT are included in the report as they are good examples of specifications that MoDOT may wish to use as a pattern for their specification
To assist MoDOT we drew from the recent research and provide smoothness adjustment tables for pay factors that would fit into Section 502153 of the Missouri DOT specifications For example
PI and IRI (inmi) Pay Factors
Pay Factors for roads with speed limit of gt45mph PI (inmi) IRI (inmi) Percent 0-10 0-40 105 101-15 401-54 103 151-25 541-80 100 251 + 801 + 100
Furthermore we held informal discussions with several IRI and PI users from several states concerning safeguards against the potential manipulation of the data within both IRI and PI systems As a result we report that with proper certification procedures for equipment and operators a random verification program on the measurement of smoothness stiff penalties for cheating regular calibration of the measuring equipment and both the data and the results provided to the state it is unlikely that the state DOT will encounter a problem with systematic alterations of inertial profiling or profilometer data
3
Table of Contents
Executive Summary 3
5
5
6
7
8
8
10
10
11
13
14
22
33
41
50
53
57
63
Introduction
Brief Description of Profilograph Performance Index
Brief Description of International Roughness Index (IRI)
IRI and Smoothness Specification
Pavement Smoothness Index Relationships
IRI Issues
Robustness of Pavement Smoothness Measurements
Security of PI and IRI data
Summary
References
Appendix A Database of State DOT Concrete Pavement Practices
Appendix B-1amp2 State Agency Smoothness Specifications for Asphalt Pavements
Appendix C IRI vs PI and PI to PI (Asphalt to Concrete) Relationships
Appendix D Pavement Smoothness Pay Factor
Appendix E Example Specifications from Connecticut DOT
Appendix F Example Specifications from Ohio DOT
Appendix G Example Specification from Minnesota DOT
Appendix H Collecting Smoothness Data for Pay Factors Flowchart
4
Introduction
This report describes the International Roughness Index (IRI) current users sample specifications current issues and its relationship with the Profile Index(PI) A suggested set of pay-factor tables are presented Missouri DOT has a specification addressing the requirements for use of California profilograph equipment and the computation of profile index to compute pay factor Multiple Appendices containing detailed information are provided for easy reference and may be used to support the preparation of a new set of specifications for inertial profiling and international roughness index The Appendices are
A ndash Database of State DOT Concrete Pavement Practices B ndash State agency smoothness specifications for asphalt pavements C ndash IRI vs PI and also PI (asphalt) to PI (concrete) Relationships D ndash Pavement Smoothness Pay Factor IncentiveDisincentive Specifications E ndash Example Specifications from Connecticut DOT (Inertial Profiler and IRI) F ndash Example Specifications from Ohio DOT (CA profilograph and IRI) G ndash Example Specifications from Minnesota DOT (Inertial Profiler and IRI)
H ndash Collecting Smoothness Data for Pay Factors Flowchart
Appendices A B-1 and B-2 are included for background information The others provide examples and substantive information for the preparation of inertial profiling and IRI-based specifications When necessary a description of the information is provided with the appendix Missourirsquos (wet ndash freeze and 00 blanking band) equations are highlighted for easy reference
Brief Description of Profilograph Performance Index (Please note the following description is taken from the American Concrete Pavement Association (ACPA) website wwwpavementcom)
A California profilograph is a rolling straight edge It measures vertical deviations from a moving 25-foot reference plane
A sensing or recording wheel located at the center of the frame moves freely in the vertical direction giving the machine the ability to record surface deviations The surface profile is logged into a computer or traced onto graph paper as the profilograph travels along the pavement The profile is termed a profile trace and shows the location and height of bumps and dips The profile trace of a pavement built perfectly smooth would be a straight line on graph paper
To meet the minimum smoothness requirements of the specification contractors use a diamond grinding machine to remove bumps in the surface which are identified on the profile trace The trace is also used to produce a profile index expressed in inches per mile (or millimeters per kilometer) When contractors and agency engineers talk about ride numbers or the ride they are referring to the profile index A lower profile index represents a smoother surface than a higher profile index Many states including Missouri also successfully use incentive and disincentive payments for the degree of smoothness as presented in Appendices A B-1 and B-2
5
Brief Description of International Roughness Index (IRI)
IRI measurements are used by some highway agencies to measure pavement smoothness and also to determine pay factors on new highway construction and highway rehabilitation projects The IRI (also referred to as inertial profile) estimates total vertical up and down movement of a quarter car simulation model in response to a stimulus input over a given distance IRI units are inchesmile or meterskilometer or millimeterskilometer The quarter car simulation model is composed of a body (sprung) mass suspension spring and damper axletire (unsprung) mass and tire spring with internationally defined parameters and with an assumed vehicle speed of 50 miles per hour The defined model parameters and quarter car model is often referred to as The Golden Car The stimulus input to the model is the vertical profile of the roadway See reference [1] for additional details on one-dimensional Inertial Profiling and IRI computations
The IRI quarter car simulation model is essentially a filter of the roadway vertical profile The quarter car model is primarily influenced by wavelengths ranging from 12 to 30 meters (39 to 984 feet) Maximum sensitivity is at wavelengths of 24 to 15 meters (79 to 492 feet) An accurate vertical profile that encompasses the entire range of wavelengths of interest is required as input to the IRI model To make full use of the IRI output the location of IRI values outside an acceptable ride quality value must be also known for identification of the cause of the problem and for remedial repairs This value is most off tied to the pay factor specification of ldquoxrdquo inmi
The profile estimation algorithm as typically used in Pavement Management System (PMS) vehicles assumes that the vehicle never stops and maintains a relatively stable speed preferably between 30 to 60 mph A portion of the recursion equation that generates the inertial profile has a term that includes the speed parameter squared in the denominator Low speed values can generate false peaking in the computed inertial profile and therefore create false spikes in the IRI parameter
The tables and figures in Appendix A showing which states are using IRI for measuring construction quality are taken from references that are four years old This is the latest national information as no entity keeps an up-to-date list of each of the states practices The use of IRI is increasing in popularity for a number of reasons presented below
One reason for using IRI is the concept of using the same pavement condition index from ldquocradle to graverdquo The IRI index is used by almost all states for monitoring the condition of pavements from year-to-year This is one of the pavement performance indices that states use for maintenance and rehabilitation scheduling It is also one of the indices that FHWA uses in monitoring the condition of the nations highways as part of the HPMS database
Another reason is that the profilograph is limited in the wavelengths it can measure due to its fixed length typically 25 feet Therefore it cannot record longer wavelengths that also effect ride-quality For example sag in string lines can occur in concrete pavement construction due to improper installation or due to an improperly adjusted feeler gauge on
6
the paver resulting in 50 foot (typical mount point intervals) peak-to-peak waves This construction problem if missed will result in a poor ride quality The mechanical design of the profilograph can result in inaccurate profile readings and PI values The IRI encompasses larger wavelengths missed by the profilograph that are influential on ride quality
Inertial profilers collect more accurate and detailed pavement profiles used in computing IRI When the profile information is collected and saved for later analysis the profile contains a wealth of information that can be extracted for diagnosing the causes of poor ride-quality Knowing the extracted road features that cause poor ride quality leads to improved construction practices and pavement design There are signal processing methods currently being evaluated that can decompose the profile into its constituent parts For example when this method was applied to a segment of I-80 (concrete construction) string line sag and slab warp and curl profiles were individually extracted from the profile What were left were the texture joints cracks and faults Since the IRI is a linearly additive measurement the IRI introduced by string line sag warp and curl and the other features can be computed for each of these extracted components Simply stated by using IRI the causes of poor ride quality can be ascertained and therefore corrective actions undertaken
These are several of the main reasons many states are considering moving to IRI for all pavement surface - ride measurements
IRI and Smoothness Specifications
Highway agencies specify both smoothness (profilograph-PI) and roughness (inertial profilers-IRI) measurement specifications in the construction of highway pavements The equipment and specifications can vary from state to state Appendix A contains tables generated from the American Concrete Pavement Associationrsquos website (wwwpavementcom) ldquoDatabase of State DOT Concrete Pavement Practicesrdquo These tables present 1) Smoothness Specification - Measurement Requirements 2) Smoothness Specification - Measuring Equipment Used and Roughness Index 3) Smoothness Specification - Pay Factors and Limits 4) Smoothness Specification - Blanking Band and Must-Grind Bump Requirement and 5) Tining Dimensions It should be noted that PI values are dependent on the size of the blanking band and that different states use different blanking band sizes in their specifications
The profilograph does have some limitations due to its physical design One of its problem areas is on horizontal curves with superelevation transitions and on the banked horizontal curves Scofield [2] reports on these profilograph limitations
An effort has been under way to have all highway agencies switch to the IRI (inertia profilers) measurement for QCQA A primary reason for this desired switch is that profilographs measures only wavelengths within the range of 03 to 23 m (1 to 75 feet) and because it amplifies wavelengths that are a factor of its length (ie 76 m [25 feet]) Also different states used different blanking band sizes (00 25 and 50 mm) causing a systematic inconsistency in the data from state to state
7
Pavement Smoothness Index Relationships
An FHWA report [3] ldquoPavement Smoothness Index Relationships Final Reportrdquo Publication FHWA-RD-02-57 attempts to provide answers to agencies wanting to switch from PI to IRI Previous small studies by a number of agencies and universities developed relationships between IRI and PI which did not compare well among these small studies
The FHWA study performed a more comprehensive analysis using the time history smoothness data collected for the Long-Term Pavement Performance (LTPP) program Both PI and IRI performance indices were computed from the surface profile data contained within the LTPP database Data was also categorized by pavement type (6) and climatic zone (4) and model type (6) PI values were computed with 00 25 and 5mm blanking bands Models of IRI vs PI00mm PI25mm PI50mm and models amongst the PIrsquos with the different blanking bands was desired
A single model of IRI vs PI contains too much variance in the data A model for each pavement type by climatic zone and blanking band would require a total of 144 models An analysis was performed to determine which factorial cells of the model matrix could be combined to reduce the number of models Fifteen models were developed for the PI-IRI relationship and 18 models were developed for the PI-PI relationships for Asphalt - Concrete For PCC-surfaced pavements 9 and 12 models were developed for the PI-IRI and PI-PI relationships respectively R-squared was typically above 70 percent with reasonable levels of error This is generally considered a good level of correlation
The state agency smoothness specifications for asphalt and concrete pavements are included in Appendices B-1 and B-2 These tables were used to develop models of recommended Initial IRI and PI00 Level for each of the states full-pay PI limits
IRI Issues
Though inertial profiling has been in use for more than twenty years a number of issues still exist and are being investigated
FHWA Accelerometer Study SEQS-21 and SEQS-48
In 2002 and 2003 FHWA conducted a study on accelerometer sensitivity requirements for inertial profiling [4 5] It was found that changing grades and cross slopes negatively impacted profile precision and accuracy on high-speed profilers operating at lower speeds This was reaffirmed in a following study with light-weight profilers at the same test site The acceleration errors introduced when the vertical axis accelerometers were not truly vertical on grades and cross slopes were found to be of approximately the same magnitude as the vertical profilersquos input to the accelerometer Small changes in speed (accelerations) of only a few miles per hour at slow speeds also introduced error At high speeds the effects of grades and cross slope on the vertical accelerometer measurements were minor The issue is how to best account for the grade cross slope and changes in speed at low operating speeds Use of lower speed profilers for construction smoothness testing aggravates this concern For construction measurements the use of high speed profilers run at a constant speed of 40mph is recommended
8
2005 ACPA Profiler Repeatability Tests UMTRI-2005-35
Karamihas [6] reported that IRI measurement of textured concrete pavements (longitudinal and transverse tining surface drag diamond ground) indicated that a problem of repeatability and reproducibility exists Currently this issue is being addressed by the development and use of displacement lasers that have either a larger dot size or use a line scan to basically average out the surface texturing The use of these lasers has shown significant improvements in profiler repeatability Good results were obtained on transversely tined pavement and a pavement with a drag texture One vendor obtained good results on a longitudinally tined pavement Pavement with smooth diamond ground surface was the most challenging surface type to measure and only one device demonstrated good repeatability
For longitudinally tined pavement and diamond ground pavement repeatability depended on the use of a large-footprint height sensor and consistent lateral tracking of the profiler
Ultra-Light Inertial Profiler
The FHWA TFHRC is developing a prototype Ultra-Light Inertial Profiler (ULIP) [7] based on equipping a Segway HT with sensors for inertial profiling and texture measurements Initial results showed a problem with profile repeatability in the longer wavelengths It was believed that pitch and roll of the Segway was a source of this error Using the longitudinally aligned accelerometer data an estimate of the pitch was computed The estimated pitch was used to adjust the vertical axis accelerometer measurement A significant improvement in profile repeatability was observed proving that pitch movement of a vehicle influences the vertical accelerometer data and that roll movement would also have an effect on inertial profile estimates A six degrees-of-freedom gyroscope has been added to the ULIP This research is in-progress
Filters
Longwave filters are applied to inertial profiles to eliminate wavelengths of a length greater than those that influence ride quality The filters are also used because profilers are unable to adequately record the longer wavelengths as their effect on vertical accelerometers are small relative to the wavelengths of interest Butterworth and moving average filters are the most common filters used with inertial profile roughness measurement Due to the nature of these filters and their implementation on equipment from different vendors the results need to be carefully assessed The resulting IRI numbers are generally comparable however the resulting profiles produced are not quite as comparable even if the same filter and parameters are applied This information means that the size of the ldquobumpsrdquo will be generally the same (so IRI number is comparable) but the location of the ldquobumpsrdquo (profile) may be within a somewhat larger range of several feet longitudinally along the pavement
Reference Profiler
Many highway construction and rehabilitation projects have incentivedisincentive pay factors related to pavement smoothnessroughness Inertial Profilers to be used in QCQA
9
therefore need to be accurate repeatable and reproducible Highway agencies require that inertial profilers be certified to meet specific standards Certification is performed at profile certification sites where the ldquotrue profilerdquo is known by the highway agency and to which the inertial profiler results are compared within the wavelengths of interest Establishing the true profile is a time consuming process What is desired is a reference profiling device which provides a measurement of profile as a standard for verifying the measurements of the other devices
A report entitled ldquoCritical Profiler Accuracy Requirementsrdquo by S Karamihas [8] specifies the requirements of a reference profiler and recommends a procedure for comparing the ldquoReference Profilerdquo with the output of the production profilers This new approach may have limitations and should be carefully reviewed
Robustness of Pavement Smoothness Measurements
With the progress made in the industry during the past five years on repeatability and accuracy of inertial profilers there is an increasing level of confidence in the technology Currently the Federal Highway Administrationrsquos contractor Starodub Inc is performing additional research on the topic of one-dimensional inertial profiling three-dimensional and six degrees-of-freedom inertial profiling This research project was awarded at the end of April 2006 and should be completed by the end of the year The primary objective of the study is to quantify the sources of error beyond the current knowledge base
Security of PI and IRI data (freedom from manipulation)
Informal discussions with several IRI and PI users from several states concerning safeguards against the potential manipulation of the data within both IRI and PI systems were held during the last few months As a result we learned that there is no way to guarantee a tamper proof system Several suggested that PI may be more vulnerable than IRI but with good procedures most concerns can be minimized for both PI and IRI With proper certification procedures for equipment and operators a random verification program on the measurement of smoothness stiff penalties for cheating regular calibration of the measuring equipment and both the data and the results provided to the state at the time of collection it is unlikely that the state DOT will encounter a problem with systematic alterations of inertial profiling or profilometer data
It is suggested that a random verification program on the measurement of smoothness be performed on about 10 of the projects by third parties If significant differences are found between results from two independent sources there now exist signal processing technologies that allow detailed comparisons of the data
If someone would try to falsify IRI data the most likely areas of falsification are in the filtering step on the measured inertial profiles and the distance ranging sensors If the specifications require that a copy of the inertial profile data is delivered with the IRI results the Missouri DOT can perform additional analysis if a doubt is raised on the integrity of the results The FHWA has developed a software package named PROVAL that can provide a starting evaluation step in the review of questionable profiles
10
In Appendix H we have provided a flowchart for improving the security when collecting smoothness data for pay factors
Summary
In this report we have discussed the relationship between IRI and PI and discussed the relative advantages and disadvantages of both systems In general we find that the trend (while slow) is toward the IRI inertial system The fact that it is already the system of choice for system wide smoothness roughness inventorying and with growing acceptance of the inertial measuring systems we see more and more states moving to IRI for project related measurements About seven State DOTs have integrated the inertial profiling and IRI technologies into their practice
Additional information on inertial profiling technology for certification and operations can be found in the following standard AASHTO specifications
A - Standard Equipment Specification for Inertial Profiler ndash AASHTO Designation MP 11-03
B - Standard Practice for Certification of Inertial Profiling Systems ndash AASHTO Designation PP 49-03
C- Standard Practice for Operating Inertial Profilers and Evaluating Pavement Profiles ndash AASHTO Designation PP 50-03 (Highlighted for Missouri)
D - Standard Practice for Pavement Ride Quality When Measured Using Inertial Profiling Systems ndash AASHTO Designation PP 51-03
There is not one state specification that can be called ldquothe bestrdquo as they are tied to the pavement types and technologies of each state However we have included the specifications from Connecticut Minnesota and Ohio as these are three types of specifications that can support the needs of Missouri These are included in the following Appendices
E ndash Example Specifications from Connecticut DOT (Inertial Profiler and IRI) F ndash Example Specifications from Ohio DOT (CA profilograph and IRI) G ndash Example Specifications from Minnesota DOT (Inertial Profiler and IRI)
The current Missouri Specifications in 5021532 Deductions includes two tables with Pay Factors for roads with speed limits greater than 45mph and less than 45mph We have used this information and the data from the FHWA-RD-02-057 study ldquoPavement Smoothness Index Relationshipsrdquo and developed the following set of tables that are appropriate for Missouri DOT Shown below are PI and IRI tables for gt 45mph and lt45mph (See Appendix C for supporting information found in FHWA-RD-02-057 study)
11
Current PI 0mm PI 0in Pay Factors
12
References
[1] Sayers M W and Karamihas S M ldquoThe Little Book of Profilingrdquo UMTRI (September 1998)
[2] Scofield L ldquoProfilograph Limitations Correlations and Calibration Criteria for Effective Performance Based Specificationsrdquo National Cooperative Highway Research Program Project 20-57 Task 53 (1992)
[3] Smith K L et al ldquoPavement Smoothness Index Relationshipsrdquo FHWA-RD-02-057 (October 2002)
[4] Gagarin N Mekemson JR and Lineman L ldquoEffect of Accelerometer Accuracy on Inertial Profile Measurements for Proposed Certification Procedurerdquo Task Order 21 Turner-Fairbank Highway Research Center Federal Highway Administration (November 2002 Revised September 2003)
[5] Gagarin N Mekemson JR and Lineman L ldquoAccelerometer Study Lightweight Experiment at Northern Virginia Sitesrdquo Final report Task Order SEQS-48 Turner-Fairbank Highway Research Center Federal Highway Administration (July 2003)
[6] Karamihas S M ldquo2005 ACPA Profiler Repeatability Testsrdquo UMTRI-2005-35 (November 2005)
[7] Gagarin N Mekemson J R and Crowley C B ldquoDevelopment of an Ultra-Light Inertial Profiler Prototyperdquo Task Order SEQS-49 Turner-Fairbank Highway Research Center Federal Highway Administration (March 2004)
[8] Karamihas S M ldquoCritical Profiler Accuracy Requirementsrdquo UMTRI-2005-24 (September 2005)
13
Appendix A Database of State DOT Concrete Pavement Practices
Smoothness Specification - Measurement Requirements
State
AL
AK
Profile measurement
location
Length of section
evaluated
How profile index calculated
Acceptance measurement by
AZ both wheel
paths 01 mile
by hand or computer
State
AR center of lane 01 mile by hand or computer
contractor State
CA both wheel
paths 01 mile
by hand or computer
contractor
CO both wheel
paths 01 mile
by hand or computer
State
CT both wheel
paths 1000 ft min by hand State
DE both wheel
paths 01 mile computer State
FL both wheel
paths 01 mile computer State
GA outer wheelpath 025 mile by hand contractor
HI both wheel
paths 01 mile by hand State
ID right wheel path 01 mile by hand computer contractor
IL center outer 01 mile digital scan State
contractor
IN outer wheel path 01 mile by hand contractor
IA center of lane 01 mile by hand
computer digital scan
contractor
KS both wheel
paths 01 mile
computer digital scan
contractor
KY both wheel
paths 15 km computer State
LA both wheel
paths depends on
lot 0 - 6 in mile lot State
14
ME
MD outer wheel path 01 mile computer contractor
MA
MI outer wheel path Mile by hand or computer
contractor
MN center of lane 01 mile computer digital
scan contractor
MS both wheel
paths 01 mile
by hand or computer
contractor
MO both wheel
paths 01 mile
by hand or computer
contractor State
MT outer wheel path 01 mile by hand or computer
State
NE outer wheel path 01 mile computer contractor
NV
NH
NJ center of lane State
NM both wheel
paths 01 mile
by hand or computer
contractor
NY both wheel
paths 025 mile by hand contractor
NC both wheel
paths 600 ft by hand contractor
ND outer wheel
paths 01 mile computer State
OH both wheel
paths 01 mile
by hand or computer
contractor
OK both wheel
paths 01 mile
computer digital scan
OR either wheelpath 01 mile by hand or computer
contractor
PA both wheel
paths 01 mile
by hand computer digital
scan contractor
PR outer wheel path 01 mile computer State
RI random random State
15
SC both wheel
paths 025 mile by hand State
SD both wheel
paths 01 mile computer contractor
TN both wheel
paths 01 mile by hand State
TX both wheel
paths 01 mile by hand
contractor State
UT outer wheel path 01 mile computer contractor
VT
VA
WA right wheel path all computer contractor
WV both wheel
paths 01 mile computer State
WI both wheel
paths 01 mile computer contractor
WY both wheel
paths 01 mile State
Source American Concrete Pavement Association
16
Smoothness Specification - Measuring Equipment Used and Roughness Index
State Smoothness Measuring Equipment Roughness Index
AL
AK
AZ CA profilograph Profile Index (inmile)
AR CA profilograph Profile Index (inmile)
CA CA profilograph Profile Index (inmile)
CO CA profilograph Profile Index (inmile)
CT CA profilograph Profile Index (inmile)
DE CA profilograph Profile Index (inmile)
FL CA profilograph Profile Index (inmile)
GA Rainhart profilograph Profile Index (inmile)
HI CA profilograph 12-ft straightedge Profile Index (inmile)
ID CA profilograph 10-ft straightedge Profile Index (in01 mile)
IL CA profilograph IRI
IN CA profilograph 10-ft straightedge Profile Index (in01 mile)
IA CA profilograph Profile Index (inmile)
KS CA profilograph others Profile Index (inmile)
KY noncontact profilometer IRI
LA CA profilograph Profile Index (inmile)
ME 10-ft straightedge
MD CA profilograph Profile Index (inmile)
MA
MI CA profilograph GM Profilometer Ride Quality Index
MN CA profilograph Profile Index (inmile)
MS CA profilograph Profile Index (inmile)
MO CA profilograph Profile Index (inmile)
MT CA profilograph Profile Index (inmile)
NE CA profilograph Profile Index (inmile)
17
NV CA profilograph
NH
NJ 10-ft straightedge none
NM CA profilograph Profile Index (inmile)
NY CA profilograph IRI
NC Rainhart profilograph Profile Index (inmile)
ND CA profilograph inch 010 mile
OH CA profilograph 10-ft straightedge Profile Index (inmile)
OK CA profilograph straightedge Profile Index (inmile)
OR CA profilograph Profile Index (inmile)
PA CA profilograph others Profile Index (inmile)
PR CA profilograph Profile Index (inmile)
RI 10-ft straightedge
SC Rainhart profilograph Profile Index (inmile)
SD CA profilograph Profile Index (inmile)
TN Rainhart profilograph Profile Index (inmile)
TX CA profilograph others Profile Index (inmile)
UT CA profilograph 10-ft straightedge Profile Index (inmile)
VT
VA
WA CA profilograph Profile Index (inmile) IRI
WV Mays Meter Mays ride number
WI CA profilograph Profile Index (inmile)
WY CA profilograph Profile Index (inmile)
Source American Concrete Pavement Association
18
Smoothness Specification - Pay Factors and Limits
State
AL
AK
Index range for 100 payment
Index for maximum incentive
Max incentive possible
Worst roughness
index allowable
Acceptance measurement by
7 - 9AZ
AR 6-7 inmile 2 inmile or
less 105 sq yd
price 7 inmile
CA 5 - 7
CO 7 - 12
CT 10 - 12 0 ndash 6 106 cy unit price
18 - 20 92 cy unit
price
DE lt 40 mm
km $150 m2
175 mm km
FL 103 sy unit price
7 inmile
GA 7 inmile
HI
ID
IL
7 - 10
425 - 10 lt 225 103 sy unit price
10
15
70 sy unit price
90 sy unit price
IN 30 mm 16 km
lt 13 mm 16 km
103 sm unit price
30 mm 16 km
IA 31 - 70 0 - 10 $200-650
per segment
101 $100-300 per
segment
KS 18 - 40 25
- 65 6 15
$1200 $1000 01
mile 25 45
$750 per 01 mile
KY 355 - 404 103 sy unit price
345 - 349 98 sy unit
price
LA 8 in mile
lot 95 sy unit
price
ME
19
MD 4 - 12 lt 2 105 sy unit price
90 sy unit price
MA
MI 4 - 10 0 100 sy unit price
10
MN 4 - 6 0 - 4 $sy
formula 6 - 8 $sy formula
MS lt 7
MO 181 -30 lt 10 107 sy unit price
30 95 sy unit
price
MT 6 - 10 lt 6 $050 sy 10 - 15 $100 sy
NE 7 - 10 0 - 2 105 sy unit price
15 90 sy unit
price
NV
NH
NJ 5 per lot
NM 4 - 7
NY 5 0-1 105 sy unit price
12 to be
determined
NC 4
ND 03 to 05
01 mile lt 03 inch
01 mile $050 sy
09 inch 01 mile
unit price - $400sy
OH 5 - 7 lt 3 105 sy unit price
12 90 sy unit
price
OK
OR 5 - 7 25 1015 sy unit price
7
PA lt 36 lt 18 107 sy unit price
36 100 sy unit
price
PR 20 - 30 formula formula
RI
SC 100 sy unit price
10
SD 25 - 35 lt 10 104 sy 40 98 sy unit
20
unit price price
TN lt 10 10 15
TX 4 - 6 lt 15 $90 per 01 mile section
12 $140 per 01 mile section
UT 7 $100 sy 60 sy unit
price
VT
VA
WA 7 lt 1 104 half
mile section 7
98 half mile section
WV lt 100 100
WI 191 - 32 lt 10 $100 per foot per
lane 45
$8300 per mile per lane
WY 6 - 7 7
Source American Concrete Pavement Association
21
Appendix B-1 State agency smoothness specifications for asphalt pavements ndash Table 14 of Publication FHWA-RD-02-057
State Testing Device Index Testing
Interval Bonus Range
Full Pay Range Penalty Range Correction
Range
AL California-type profilograph
PI5-mm
016 kma (01 mi)
lt32 mmkm (lt2 inches per mile)
32 - 63 mmkm (2 - 39 inches per mile)
64 - 160 mmkm (4 - 10 inches per mile)
gt160 mmkm (lt10 inches per mile)
AK -- -- -- -- -- -- --lt520 520 - 710 lt1578
AZ GM-type profiler MRN
016 kma (01 mi)
mmkma
(lt33 inches per
mmkma
(33 - 45 inches per
711 - 1578 mmkma (46 -100 inches per mile)
mmkma
(gt100 inches per
mile) mile) mile)
AR
California-type profilograph lightweight profiler
PI5-mm 02 km (01 mi)
lt= 45 mmkm (lt= 3 inches per mile)
46 - 75 mmkm (31 - 5 inches per mile)
76 - 110 mmkm (51 - 7 inches per mile)
gt110 mmkm (lt 7 inches per mile)
CA California-type profilograph
PI5-mm
016 km (01 mi)a
--
lt= 80 mmkm (lt= 5 inches per mile)a
--
gt80 mmkm (gt5 inches per mile)a
CO California-type profilograph
PI25-mm
015 km (0095 mi)
lt= 222 mmkm (lt= 14 inches per mile)
2221 -252 mmkm (141 - 16 inches per mile)
2521 - 378 mmkm (161 - 24 inches per mile)
gt378 mmkm (gt24 inches per mile)
gt950 950 - 1260 gt1894
CT ARAN inertial profiler
IRI 016 kma (01 mi)
mmkma
(lt60 inches per
mmkma
(60 - 80 inches per
1261 - 1894 mmkma (801 -120 inches per mile)
mmkma
(gt120 inches per
mile) mile) mile)
DE Rolling straightedge -- -- -- -- -- --
FL Rolling -- -- -- -- -- --
22
--
-- -- -- -- -- --
--
--
--
straightedge
GA Inertial profiler
HI --
ID California-type profilograph
IL California-type profilograph
IN California-type profilograph
IA California-type profilograph
KS California-type profilograph
KY Inertial profiler
LA California-type profilograph
Rolling 02 km ME dipstick IRI (012
profiler mi)
IRI
PI5-mm
PI5-mm
PI5-mm
PI5-mm
PI00
RI
PI5-mm
16 km(10 mi)
01 km (01 mi)
016 km (01 mi)
016 km (01 mi)
016 km (01 mi)
01 km (01 mi)
16 kma
(10 mi)
Lot
lt= 8 mmkm (lt= 05 inches per mile)b
lt= 48 mmkm (lt= 3 inches per mile) lt= 160 mmkm (lt= 10 inches per mile) RI gt= 405
lt= 945 mmkma
(lt= 60 inches per mile)
lt= 750 gt750 mmkm mmkm (lt= 475 -- (gt475 inches per inches per mile)a mile)a
lt= 8 gt8 mm01km -- mm01km (lt= 05 (gt05 in01mi) in01 mi) 9 - 160 mmkm (06 - 10 inches per mile) lt= 30 mm016 km (lt= 12 in01 mi) 49 - 110 mmkm (31 - 7 inches per mile) 161 - 475 mmkm (101 - 30 inches per mile) 370 lt= RI lt 405
lt= 47 mmkm (lt= 3 inches per mile) 946 - 1105 mmkma
(601 - 70 inches per mile)
161 - 235 mmkm (101 - 15 inches per mile)
31 - 38 mm016 km (121 - 15 in01 mi)
111 - 160 mmkm (71 - 10 inches per mile)
476 - 630 mmkm (301 - 40 inches per mile)c
345 lt= RI lt 370
48 - 95 mmkm (31 - 6 inches per mile)
1106 - 1260 mmkma (701 -80 inches per mile)
gt235 mmkm (gt15 inches per mile)
gt38 mm016 km (gt15 in01 mi)
gt160 mmkm (gt10 inches per mile) gt630 mmkm (gt40 inches per mile)
RI lt 345
gt95 mmkm (gt6 inches per mile)
gt1260 mmkma
(gt80 inches per mile)
23
MD
MA
MI
California-type profilograph
Inertial Profiler
California-type profilograph or GM-type inertial profiler
PI5-mm
016 kma (01 mi)
IRI 02 km (012 mi)a
PI5-
mmRQId
016 kma (01 mi)
lt= 63 mmkma
(lt= 40 inches per mile)
lt= 63 mmkma
(lt= 4 inches per mile)or RQI lt45
64 - 110 mmkma
(41 - 7 inches per mile)
64 - 158 mmkma
(41 - 10 inches per mile) or 45 lt= RQI lt= 53
111 - 190 mmkma (71 - 12 inches per mile)
--
gt191 mmkma
(gt12 inches per mile)
gt158 mmkma
(gt10 inches per mile)or RQI gt 53
MN
MS
MO
MT
California-type profilograph
California-type profilograph
California-type profilograph
--
PI5-mm
PI5-mm
PI00
--
01 km (01 mi)
016 kma (01 mi)
01 km (01 mi)
--
lt= 387 mmkm (lt= 24 inches per mile) lt= 79 mmkma
(lt= 5 inches per mile) lt= 284 mmkm (lt= 18 inches per mile)
--
388 - 789 mmkm (25 - 5 inches per mile) 80 - 110 mmkma
(51 - 7 inches per mile) 285 - 395 mmkm (181 - 25 inches per mile)
--
79 - 1183 mkm (51 - 75 inches per mile)
111 - 158 mkma (71 - 10 inches per mile)
396 - 711 mkm (251 - 45 inches per mile)
--
gt1183 mmkm (gt75 inches per mile) gt158 mmkma
(gt10 inches per mile) gt712 mmkm (gt45 inches per mile)
--
NE
NV
NH
California-type profilograph
California-type profilograph
GM-type
PI5-mm
PI5-mm
RN
02 km (01 mi)
01 km (01 mi)
016
lt= 75 mmkm (lt= 5 inches per mile)
--
76 - 110 mmkm (51 - 7 inches per mile) lt= 80 mmkm (lt= 5 inches per mile)
111 - 155 mmkm (71 - 10 inches per mile)
--
gt155 mmkm (gt10 inches per mile)
gt80 mmkm (gt5 inches per mile)
24
NJ
NM
NC
ND
inertial profiler Rolling straightedge
California-type profilograph
Hearne straightedge
--
--
PI5-mm
CSI
--
kma (01 mi)
01 km (01 mi)
lt= 65 mmkm (lt= 4 inches per mile)
66 - 80 mmkm (41 - 5 inches per mile)
81 - 160 mkm (51 - 10 inches per mile)
gt160 mmkm (gt10 inches per mile)
076 km (047 mi)
CSI=1020 CSI=3040 CSI=1121314150516061
-- -- -- -- --
--
-- -- -- -- --
OH
OK
OR
PA
PR
RI
California-type profilograph
California-type profilograph
California-type profilograph
California-type profilograph
California-type profilograph
--
PI5-mm
PI5-mm
PI5-mm
PI00
PI5-mm
--
016 kma (01 mi)
lt= 63 mmkma
(lt= 4 inches per mile)
016 kma (01 mi)
lt= 79 mmkma
(lt= 5 inches per mile)
016 kma
(01 mi)
lt= 80 mmkma
(lt= 5 inches per mile)
016 kma (01 mi)
lt= 442 mmkma
(lt= 28 inches per mile)
016 kma (01 mi)
lt= 110 mmkma
(lt= 7 inches per mile)
-- --
64 - 110 mmkma
(41 - 7 inches per mile) 80 - 110 mmkma
(51 - 7 inches per mile) 81 - 110 mmkma
(51 - 7 inches per mile) 443 - 536 mmkma
(281 - 34 inches per mile) 111 - 205 mmkma
(71 - 13 inches per mile)
--
111 - 190 mkma (71 - 12 inches per mile)
111 - 190 mkma (71 - 12 inches per mile)
111 - 155 mmkma (71 - 10 inches per mile)
537 - 726 mmkma (341 - 46 inches per mile)
-
--
gt190 mmkma
(gt12 inches per mile) gt190 mmkma
(gt12 inches per mile) gt155 mmkma
(gt10 inches per mile) gt726 mmkma
(gt46 inches per mile) gt205 mmkma
(gt13 inches per mile)
--
SC Maysmeter MRN 16 kma
(10 mi)
lt= 552 mmkma
(lt= 35
553 - 630 mmkma
(351 - 40
631 - 868 mmkma (401 - 55 inches per mile)
gt868 mmkma
(gt55
25
inches per inches per inches per mile) mile) mile)
SD Inertial profiler IRI
016 kma (01 mi)
lt= 868 a mmkm
(lt= 55 inches per mile)
869 - 1105 a mmkm
(551 - 70 inches per mile)
1106 - 1262 mmkma (701 -80 inches per mile)
gt1262 a mmkm
(gt80 inches per mile)
TN Maysmeter MRN16 kma
(10 mi)
lt= 315 mmkm a (lt= 20 inches per mile)
316 - 475 a mmkm
(201 - 30 inches per mile)
476 - 950 mmkma (301 - 60 inches per mile)
gt950 a mmkm
(gt60 inches per mile)
TX California-type profilograph
PI00
016 kma (01 mi)
lt= 237 a mmkm
(lt= 15 inches per mile)
238 - 315 a mmkm
(151 - 20 inches per mile)
316 - 630 mkma (201 - 40 inches per mile)
gt630 a mmkm
(gt40 inches per mile)
UT California-type profilograph
PI5-mm
02 km (012 mi) a
--
lt= 110 mmkm (lt=7 inches per mile) a
--
gt110 mmkm (gt7 inches per mile)a
VT Maysmeter IRI032 kma (02 mi)
lt950 a mmkm
(lt60 inches per mile)
950 - 1090 a mmkm
(60 - 69 inches per mile)
1091 - 1500 mmkma (70 -95 inches per mile)
gt1500 a mmkm
(gt95 inches per mile)
VA South Dakota-type profiler
IRI 016 kma (01 mi)
lt= 868 a mmkm
(lt= 55 inches per mile)
869 - 1105 a mmkm
(551 - 70 inches per mile)
1106 - 1578 kma (701 - 100 inches per mile)
gt1578 a mmkm
(gt100 inches per mile)
WAe Lightweight inertial profiler
IRI 01 km (01 mi)a
lt= 946 a mmkm
(lt= 60 inches per mile)
947 - 1500 a mmkm
(601 - 95 inches per mile)
1501 - 1815 mmkma (951 -115 inches per mile)
gt1815 a mmkm
(gt115 inches per mile)
WV Maysmeter or inertial profiler
MRN016 km (01 mi) --
lt= 1000 mmkm (lt= 65 inches per mile)
1001 - 1500 mmkm (66 - 975 inches per mile)
gt1500 mmkm (gt975 inches per mile)
WI California- PI5-mm 016 -- lt= 158 159 - 237 mkma (101 - 15 gt237
26
type profilograph
kma (01 mi)
mmkma
(lt= 10 inches per mile)
inches per mile) mmkma
(gt15 inches per mile)
WY Inertial profiler IRI
016 kma (01 mi)
Percent Within Limits Specification Upper Spec Limit = 1500 mkm (95 inches per mile) Percent Within Limits Specification Lower Spec Limit = RN = 41 Statistical Based Specification Full Pay approximately equal to 868-1105 mmkm (55-70 inches per mile) a Limits are a direct English-Metric conversion from counterpart limits Actual limits given by the Agency were not available b Based on average profile index for entire project c For PI between 476 mmkm (301 inches per mile) and 630 mmkm (40 inches per mile) must also grind to 475 mmkm (30 inches per mile) or belowd RQI Ride quality index e Draft specification
27
Appendix B-2 State agency smoothness specifications for concrete pavements ndash Table 15 of Publication FHWA-RD-02-057
State
AL
AK
Testing Device
California-type profilograph
--
Index
PI5-mm
--
Testing Interval
016 km (01 mi)
--
Bonus Range
lt45 mmkm (lt3 inches per mile)
--
Full Pay Range
45 -- 94 mmkm (3 -- 59 inches per mile)
--
Penalty Range
95 - 160 mmkm (6 - 10 inches per mile)
--
Correction Range
gt160 mmkm (gt10 inches per mile)
--
AZ
AR
CA
CO
CT
DE
FL
GA
California-type profilograph
California-type profilograph lightweight profiler
California-type profilograph
California-type profilograph
California-type profilograph
CA profilograph or rolling straightedge
California-type profilograph
Rainhart
PI5-mm
PI5-mm
PI5-mm
PI25-
mm
PI5-mm
PI5-mm
PI5-mm
PI25-
016 kma(01 mi)
02 km (01 mi)
01 km (006 mi)a
015 km (0095 mi)
015 km (01 mi)a
016 kma(01 mi)
01 km (01 mi)
04
lt110 mmkma(lt7 inches per mile) lt= 90 mmkm (lt= 6 inches per mile)
lt= 222 mmkma (lt= 14 inches per mile)
lt=160 mmkm (10 inches per mile)a
lt50 mmkma(lt32 inches per mile) lt= 80 mmkm (lt= 5 inches per mile)
--
--
110 -- 142 mmkma(7 -9 inches per mile) 91 - 110 mmkm (61 - 7 inches per mile) lt= 110 mmkm (lt= 7 inches per mile)a
2221 - 252 mmkma
(141 - 16 inches per mile) 161 - 190 mmkm (101 - 12 inches per mile)a
50 - 200 mmkma(32 - 127 inches per mile) 81 - 95 mmkm (51 - 6 inches per mile) lt= 110
--
--
--
2521 - 378 mmkma
(161 - 24 inches per mile) 191 - 315 mmkm (121 - 20 inches per mile)a
96 - 110 mmkm (61 - 7 inches per mile)
--
--
gt142 mmkma(gt9 inches per mile)
gt110 mmkm (gt7 inches per mile)
gt110 mmkm (gt7 inches per mile)a
gt378 mmkma
(gt24 inches per mile)
gt315 mmkm (gt20 inches per mile)a
gt200 mmkma(gt127 inches per mile)
gt110 mmkm (gt7 inches per mile)
gt110
28
profilograph mm kma(025 mmkma(lt= mmkma(gt7mi) 7 inches per inches per
mile) mile)
HI California-type profilograph PI5-mm
016kma(01mi)
--
lt= 157 mmkma(lt= 10 inches per mile)
158 - 236 mmkma(101 - 15 inches per mile)
gt236mmkma(gt15inches permile)
ID California-type profilograph PI5-mm
01 km (01 mi) --
lt= 8 mm01 km (lt= 05 in01mi)
--gt8 mm01 km (gt05in01mi)
IL California-type profilograph PI5-mm
016 km (01 mi)
lt= 67 mmkm (lt= 425 inches per mile) b
68 - 160 mmkm (426 - 10 inches per mile)
161 - 235mmkm (1001 - 15 inches per mile)
gt235 mmkm (gt15 inches per mile)
IN California-type profilograph PI5-mm
016 km (01 mi)
lt= 23mm016 km (lt= 09 in01mi)
23 - 25 mm016km(09 - 10 in01 mi)
--gt25 mm016 km (gt10 in01 mi)
IA California-type profilograph PI5-mm
016 km (01 mi)
lt= 48 mmkm (pound3 inches per mile)
49 - 110 mmkm (31 - 7 inches per mile)
111 - 160 mmkm (71 - 10 inches per mile)
gt160 mmkm (gt10 inches per mile)
KS California-type profilograph PI00
01 km (01 mi)
lt= 285 mmkm (lt= 18 inches per mile)
286 -- 475 mmkm (181 -- 30 inches per mile)
476 -- 630 mmkm (301 -- 40 inches per mile)c
gt630 mmkm (gt40 inches per mile)
KY Rainhart profilograph and inertial profiler
PI25-
mmRI
03 kma(019 mi)
RI gt= 405
lt=125 mmkma (lt= 8 inches per mile)
126 - 190 mmkma(81 - 12 inches per mile)
gt190mmkma(gt12inches permile)
LA California-type profilograph PI5-mm Lot -
pound94 mmkm (lt= 6 inches per mile)
95 - 126mmkm (61 - 8 inches per mile)
gt126 mmkm (gt8 inches per mile)
ME -- -- -- -- -- -- --
MD California-type profilograph PI5-mm
016kma(01mi)
lt= 63 mmkma (lt= 40 inches per mile)
64 - 110 mmkma(41 - 7 inches per mile)
111 - 190 mmkma(71 - 12 inches per mile)
gt191mmkma(gt12inches permile)
MA -- -- -- -- -- -- --MI California-type PI5- 016 lt= 63 64 - 158 -- gt158
29
MN
MS
MO
MT
NE
NV
NH
profilograph or GM-type inertial profiler
California-type profilograph
California-type profilograph
California-type profilograph
California-type profilograph
California-type profilograph
California-type profilograph
--
mmRQI d
kma(01 mi)
PI5-mm 016 km (01 mi)
PI5-mm
016 kma(01 mi)
PI00 01 km (01 mi)
PI5-mm
016 kma(01 mi)
PI5-mm 02 km (01 mi)
PI5-mm 01 km (01 mi)
-- --
mmkma (lt= 4 inches per mile)or RQI lt 45
lt= 63 mmkm (lt= 4 inches per mile)
lt= 284 mmkm (lt= 18 inches per mile) lt= 94 mmkma(pound6 inches per mile) lt= 75 mmkm (lt= 5 inches per mile)
--
--
--
mmkma (41 - 10 inches per mile)or 45 lt=RQI lt= 53
mmkma(gt10 inches per mile)or RQI gt 53
64 - 94 mmkm (41 - 6 inches per mile)
95 - 126 mkm (61 - 8 inches per mile)
gt126 mmkm (gt8 inches per mile)
lt= 110 mmkma(lt= 7 inches per mile)
111 - 190 mkma(71 -12 inches per mile)
gt190 mmkma(gt12 inches per mile)
285 - 395 mmkm (181 - 25 inches per mile)
396 - 711 mkm (251 - 45 inches per mile)
gt712 mmkm (gt45 inches per mile)
95 - 158 mmkma(61 - 10 inches per mile)
159 - 237 mkma (101 - 15 inches per mile)
gt237 mmkma(gt15 inches per mile)
76 - 155 mmkm (51 - 10 inches per mile)
156 - 230 mmkm (101 - 15 inches per mile)
gt230 mmkm (gt15 inches per mile)
lt= 80 mmkm (lt= 5 inches per mile)
gt80 mmkm (gt5 inches per mile)
--
-- -- --NJ
NM
NY
NC
Rolling straightedge
California-type profilograph
California-type profilograph
Rainhart profilograph
--
PI5-mm
PI5-mm
PI5-mm
-- --
01 km (01 mi)
lt= 80 mmkm (lt= 5 inches per mile)
016 km (01 mi)a
lt= 79 mmkma(lt= 5 inches per mile)
018 kma(011 mi)
--
-- --81 - 110 mmkm (51 - 7 inches per mile)
111 - 190 mkm (71 - 12 inches per mile)
80 - 190 mmkma(51 - 12 inches per mile) lt= 63 mmkma(lt= 4 inches per
--
--
--
gt190 mmkm (gt12 inches per mile)
gt190kma(gt12 inches per mile)
gt63 mmkma(gt4 inches per
30
mile) mile)
ND California-type profilograph PI5-mm
016 kma(01 mi)
lt8mm016 kma(lt03 in01mi)
8 - 13 mm016 kma(03 - 05 in01mi)
14 -- 23mm016kma(051 -09 in01mi)
gt23 mm016 kma(gt09in01mi)
OH California-type profilograph PI5-mm
016kma(01mi)
lt= 78 mmkma(lt= 5 inches per mile)
79 - 110 mmkma(51 - 7 inches per mile)
111 - 190 mkma(71 -12 inches per mile)
gt190mmkma(gt12inches permile)
OK California-type profilograph PI5-mm
016kma(01mi)
lt= 79 mmkma(lt= 5 inches per mile)
80 - 110 mmkma(51 - 7 inches per mile)
111 - 190 mkma(71 -12 inches per mile)
gt190mmkma(gt12inches permile)
OR California-type profilograph PI5-mm
02 km (01 mi)a
lt= 80 mmkm (lt= 5 inches per mile)a
81 - 110 mmkm (51 - 7 inches per mile)a
--gt110 mmkm (gt7 inches per mile)a
PA California-type profilograph PI00
016a(01 mi)
lt= 568 mmkma(lt= 36 inches per mile)
-- --
gt568 mmkma(gt36inches per mile)
PR California-type profilograph PI5-mm
016kma(01mi)
lt= 110 mmkma(lt= 7 inches per mile)
111 - 205 mmkma(71 - 13 inches per mile)
--
gt205mmkma(gt13inches permile)
RI -- -- -- -- -- -- --
SC Rainhart profilograph PI5-mm
04kma(025mi)
--
lt= 158 mmkma(lt= 10 inches per mile)
--
gt158mmkma(gt10inches permile)
SD California-type profilograph PI00
01 km (01 mi)
lt= 395 mmkm (lt= 25 inches per mile)
396 - 550 mmkm (251 - 35 inches per mile)
551 - 630 mmkm (351 - 40 inches per mile)
gt630 mmkm (gt40 inches per mile)
TN Rainhartprofilograph PI25-
mm
01 km (01 mi) --
lt= 160 mmkm (lt= 10 inches per mile)
161 - 235 mmkm (101 - 15 inchesper mile)
gt235 mmkm (gt15 inches per mile)
TX California-type profilograph PI00
016kma(01mi)
237 mmkma(lt= 15 inches per mile)
238 - 315 mmkma(151 - 20 inches per mile)
316 -- 630 mkma(201 -40 inches per mile)
gt630mmkma(gt40inches permile)
31
UT California-type profilograph PI5-mm
02 km (012 mi)a
--
lt= 110mmkm (lt= 7 inches permile)a
--gt110 mmkm (gt7 inches per mile) a
VT -- -- -- -- -- -- --
VA South Dakota-type profiler IRI 016 kma
(01 mi)
lt= 946 mmkma (lt= 60 inches per mile)
947 - 1262 a mmkm
(601 - 80 inches per mile)
1263 - 1578 km a(801 - 100 inches per mile)
gt1578 mmkma (gt100 inches per mile)
WA California-type profilograph
PI75-
mm
01 km (01 mi) a
lt= 60 mmkm (lt= 38 inches per mile)a
61 -- 100 mmkm (39 - 63 inches per mile) a
gt100 mmkm (gt63 inches per mile) ae
--
WV Maysmeter or inertial profiler MRN 016 km
(01 mi) --
lt= 1000 mmkm (lt= 65 inches per mile)
1001 - 1500 mmkm (66 - 975 inches per mile)
gt1500 mmkm (gt975 inches per mile)
WI California-type profilograph
PI01-
inch
016 kma
(01 mi)
lt= 400 mmkma (lt= 253 inches per mile)
401 - 700 a mmkm
(254 - 443 inches per mile)
701 - 800 mkma (444 - 507 inches per mile) f
gt800 mmkma
(gt507 inches per mile)
WY California-type profilograph PI5-mm
Perf Related Spec (PCC thickness strength smoothness) gt80 mmkm (gt50 inches per mile) a Limits are a direct English-Metric conversion from counterpart limits Actual limits given by the agency were not available b Based on average profile index for entire project c For PI between 476 mmkm (301 inches per mile) and 630 mmkm (40 inches per mile) must also grind to 475 mmkm (30 inches per mile) or below d RQI Ride quality index e For PI greater than 100 mmkm (63 inches per mile) must also grind to 100 mmkm (63 inches per mile) or lessf For PI greater than 700 mmkm (443 inches per mile) must also grind to 700 mmkm (443 inches per mile) or less
32
Appendix C IRI vs PI and PI to PI (Asphalt to Concrete) Relationships
In FHWA Report FHWA-RD-02-057 ldquoPavement Smoothness Index Relationships Final Reportrdquo equations where developed for converting from PI to IRI based on pavement type and climatic region using the LTPP profile data base Tables C1 C2 C3 and C4 summarize the conversion equations Information on PI to IRI relationships relevant to Missouri are highlighted in the tables and noted in the figure captions
Table C1 PI to IRI equations for Asphaltic Concrete PI to IRI for Asphaltic Concrete
Pavement Type Climatea
Blanking Band (mm)
Correlation Equation (IRI = mmkm PI = mmkm) N SEE R2
AC 1234 0 IRI = 266543PI00 + 21301 14170 2002 089 AC 1234 25 IRI = 297059PI25-mm + 63874 14160 2317 086 AC 1234 5 IRI = 378601PI5-mm + 88751 13775 2923 077
ACAC 1 0 IRI = 274599PI00 + 26542 1854 192 091 ACAC 1 25 IRI = 312622PI25-mm + 70856 1854 230 087 ACAC 1 5 IRI = 425316PI5-mm + 95780 1824 2882 079 ACAC 2 0 IRI = 268169PI00 + 27467 1494 1846 081 ACAC 2 25 IRI = 333564PI25-mm + 65567 1494 2466 066 ACAC 2 5 IRI = 439478PI5-mm + 88320 1345 3082 045 ACAC 34 0 IRI = 242295PI00 + 30190 5126 1788 084 ACAC 34 25 IRI = 268324PI25-mm + 66034 5126 217 076 ACAC 34 5 IRI = 342671PI5-mm + 87680 4906 2659 063
ACPCC 1234 0 IRI = 240300PI00 + 29293 4156 2056 079 ACPCC 1234 25 IRI = 278217PI25-mm + 71687 4156 2297 073 ACPCC 1234 5 IRI = 394665PI5-mm + 93922 4052 2596 065 Source FHWA-RD-02-057a Climatic zones 1=DF 2=DNF 3=WF 4=WNF
DF Dry-FreezeDNF Dry-Nonfreeze WF Wet-Freeze
WNF Wet-Nonfreeze
33
Table C2 PI to IRI for Portland Cement Concrete PI to IRI for Portland Cement Concrete
Pavement Type Climatea Blanking
Band (mm) Correlation Equation (IRI =
mmkm PI = mmkm) N SEE R2
PCC 13 0 IRI = 212173PI00 + 43976 12039 2596 08 PCC 13 25 IRI = 215316PI25-mm + 94705 12039 2787 08
PCC 13 5 IRI = 262558PI5-mm + 120573 11946 306 08
PCC 2 0 IRI = 258454PI00 + 42309 1448 1765 09
PCC 2 25 IRI = 25921PI25-mm + 102473 1448 2265 08
PCC 2 5 IRI = 351673PI5-mm + 122635 1364 2687 07
PCC 4 0 IRI = 23582PI00 + 31719 2888 2365 08
PCC 4 25 IRI = 240731PI25-mm + 88810 2888 2645 08
PCC 4 5 IRI = 287407PI5-mm + 122963 2885 2974 07 Source FHWA-RD-02-057a Climatic zones 1=DF 2=DNF 3=WF 4=WNF
DF Dry-FreezeDNF Dry-Nonfreeze WF Wet-Freeze
WNF Wet-Nonfreeze
34
Table C3 PI to PI for Asphaltic Concrete PI to PI for Asphaltic Concrete
Type Climatea FromTo Correlation Equation (PI = mmkm) N SEE R2
AC 13 PI25-mm to PI00-mm PI00 = 108722PI25-mm + 17442 5744 4773 096
AC 13 PI5-mm to PI00-mm PI00 = 135776PI5-mm + 27548 5684 8358 088
AC 13 PI5-mm to PI25-mm PI25-mm = 128213PI5-mm + 8779 5684 4662 095
AC 24 PI25-mm to PI00-mm PI00 = 112338PI25-mm + 15284 8418 4523 095
AC 24 PI5-mm to PI00-mm PI00 = 146417PI5-mm + 24009 8093 7173 086
AC 24 PI5-mm to PI25-mm PI25-mm = 134055PI5-mm + 7313 8093 3864 095
ACAC 1 PI25-mm to PI00-mm PI00 = 114153PI25-mm + 16070 1856 4341 096
ACAC 1 PI5-mm to PI00-mm PI00 = 156038PI5-mm + 25089 1826 7374 088
ACAC 1 PI5-mm to PI25-mm PI25-mm = 139462PI5-mm + 7555 1826 4047 095
ACAC 2 PI25-mm to PI00-mm PI00 = 128067PI25-mm + 13815 1496 5226 086
ACAC 2 PI5-mm to PI00-mm PI00 = 175837PI5-mm + 22284 1347 7932 066
ACAC 2 PI5-mm to PI25-mm PI25-mm = 152523PI5-mm + 5660 1347 3414 089
ACAC 34 PI25-mm to PI00-mm PI00 = 111926PI25-mm + 14585 5128 4486 093
ACAC 34 PI5-mm to PI00-mm PI00 = 145876PI5-mm + 23359 4908 7153 081
ACAC 34 PI5-mm to PI25-mm PI25-mm = 136739PI5-mm + 7117 4908 3812 093
ACPCC 1234 PI25-mm to PI00-mm PI00 = 115412PI25-mm + 17708 4158 4446 093
ACPCC 1234 PI5-mm to PI00-mm PI00 = 161123PI5-mm + 27111 4054 7107 081
ACPCC 1234 PI5-mm to PI25-mm PI25-mm = 144895PI5-mm + 7683 4054 3699 093 Source FHWA-RD-02-057 a Climatic zones 1=DF 2=DNF 3=WF 4=WNF
DF Dry-Freeze DNF Dry-Nonfreeze WF Wet-Freeze
WNF Wet-Nonfreeze
35
Table C4 PI to PI for Portland Cement Concrete PI to PI for Portland Cement Concrete
Type Climatea FromTo Correlation Equation (PI = mmkm) N SEE R2
PCC 1 PI25-mm to PI00-mm PI00 = 104364PI25-mm + 23813 2237 469 095
PCC 1 PI5-mm to PI00-mm PI00 = 139512PI5-mm + 34308 2182 712 087
PCC 1 PI5-mm to PI25-mm PI25-mm = 136458PI5-mm + 9646 2180 433 095
PCC 2 PI25-mm to PI00-mm PI00 = 102028PI25-mm + 22978 1448 443 094
PCC 2 PI5-mm to PI00-mm PI00 = 136715PI5-mm + 31325 1366 664 086
PCC 2 PI5-mm to PI25-mm PI25-mm = 138376PI5-mm + 7490 1364 398 095
PCC 3 PI25-mm to PI00-mm PI00 = 101255PI25-mm + 23865 9800 500 097
PCC 3 PI5-mm to PI00-mm PI00 = 120723PI5-mm + 36791 9764 867 091
PCC 3 PI5-mm to PI25-mm PI25-mm = 120990PI5-mm + 12395 9764 536 096
PCC 4 PI25-mm to PI00-mm PI00 = 101320PI25-mm + 24481 2888 569 094
PCC 4 PI5-mm to PI00-mm PI00 = 119909PI5-mm + 39049 2885 852 085
PCC 4 PI5-mm to PI25-mm PI25-mm = 1212677PI5-mm + 13843 2885 430 096
36
Source FHWA-RD-02-057 a Climatic zones 1=DF 2=DNF 3=WF 4=WNF
DF Dry-Freeze DNF Dry-Nonfreeze WF Wet-Freeze
WNF Wet-Nonfreeze
The figures on the following pages present the previous four tables or equations as a series of graphs
The PI to PI charts are for informational purposes only to indicate how the index varies with the different blanking bands applied PI indices are difficult to compare from state to state as different blanking bands give different results IRIs derived from inertial profilers are more comparable from state to state and thus are more useful in research studies The AASHTO specifications listed in the Conclusion section were establish to make the IRI a consistent measurement
PI to IRI Asphaltic Concrete All Climates by Blanking Band(inch) (Source FHWA-RD-02-057)
300
0 10 20 30 40 50PI (inmi)
PI(BB=00 in) PI(BB=01 in) PI(BB=02 in)
250
200
150
100
50
0
IRI (
inm
i)
Figure C1 PI to IRI for concrete all climates and blanking bands (Green line lower one] applicable to Missouri)
PI to IRI Asphaltic ConcreteAsphaltic Concrete by Climate and Blanking Band(inch)1=Dry-Freeze 2=Dry-Nonfreeze 3=Wet-Freeze 4=Wet-Nonfreeze
(Source FHWA-RD-02-057)300
PI(BB=00 in) 1 PI(BB=01 in) 1 PI(BB=02 in) 1 PI(BB=00 in) 2 PI(BB=01 in) 2 PI(BB=02 in) 2 PI(BB=00 in) 34 PI(BB=01 in) 34 PI(BB=02 in) 34
250
200
150
100
50
0
IRI (
inm
i)
000 1000 2000 3000 4000 5000
PI (inmi)
6000
60
Figure C2 PI to IRI Asphaltic ConcreteAsphaltic Concrete all climates all blanking bands (Thick solid green line [lowest one] applicable to Missouri)
37
PI to IRI Asphaltic ConcretePortland Cement Concrete All Climates by Blanking Band(inch)
300
250
200
150
100
50
0
PI(BB=00 in)
PI(BB=01 in)
PI(BB=02 in)
IRI (
inm
i)
000 1000 2000 3000 4000 5000 6000 PI (inmi)
Figure C3 PI to IRI Asphaltic ConcretePortland Cement Concrete all climates all blanking bands (Green line [lowest one] applicable to Missouri)
PI to IRI Asphaltic ConcreteAsphaltic Concrete by Climate and Blanking Band(inch)1=Dry-Freeze 2=Dry-Nonfreeze 3=Wet-Freeze 4=Wet-Nonfreeze
(Source FHWA-RD-02-057)400
IRI (
inm
i)
350
300
250
200
150
100
50
0
PI(BB=00 in) 13 PI(BB=01 in) 13 PI(BB=02 in) 13 PI(BB=00 in) 2 PI(BB=01 in) 2 PI(BB=02 in) 2 PI(BB=00 in) 4 PI(BB=01 in) 4 PI(BB=02 in) 4
0 10 20 30 40 50
PI (inmi)
6
Figure C4 PI to IRI for Portland Cement Concrete all climates all blanking bands (Thin solid green line [lowest one] applicable to Missouri)
0
38
PI to PI Asphaltic Concrete by Climate and Blanking Band(in) 1=Dry-Freeze 2=Dry-Nonfreeze 3=Wet-Freeze 4=Wet-Nonfreeze
(Source FHWA-RD-02-057)
0
20
40
60
80
100
120 PI
(in
mi)
PI01in to PI0in 13 PI02in to PI0in 13 PI02in to PI01in 13 PI01in to PI0in 24 PI02in to PI0in 24 PI02in to PI01in 24
00 100 200 300 400 500 600
PI (inmi)
Figure C5 PI to PI for Asphaltic Concrete
PI to PI Asphaltic ConcreteAsphaltic Concrete by Climate and Blanking Band(in)1=Dry-Freeze 2=Dry-Nonfreeze 3=Wet-Freeze 4=Wet-Nonfreeze
(Source FHWA-RD-02-057)
70 0
20
40
60
80
100
120
PI (i
nm
i)
PI01in to PI0in 1 PI02in to PI0in 1 PI02in to PI01in 1 PI01in to PI0in 2 PI02in to PI0in 2 PI02in to PI0in 2 PI02in to PI0in 34 PI02in to PI0in 34 PI02in to PI01 34
0 10 20 30 40 50 60
PI (inmi)
Figure C6 PI to PI for Asphaltic Concrete Asphaltic Concrete all climates all blanking bands
39
PI to PI Asphaltic ConcretePortland Cement ConcreteAll Climates by Blanking Band(in)
(Source FHWA-RD-02-057)
0
20
40
60
80
100
120
140
160
180
200
PI (i
nm
i)
PI01in to PI0in PI02in to PI0in PI02in to PI01in
0 10 20 30 40 50 60 70 80 90
PI (inmi)
100
70
PI (inmi)
Figure C7 PI to PI forAsphaltic Concrete Portland Cement Concrete all climates all blanking bands
PI to PI Portland Cement Concrete by Climate and Blanking Band(in) 1=Dry-Freeze 2=Dry-Nonfreeze 3=Wet-Freeze 4=Wet-Nonfreeze
(Source FHWA-RD-02-057) 120
PI (i
nm
i)
100
80
60
40
20
0
PI01in to PI0in 1 PI02in to PI0 1 PI02in to PI01in 1 PI02in to PI0in 2 PI02in to PI0in 2 PI02in to PI01in 2 PI01in to PI0in 3 PI02in to PI0in 3 PI02in to PI01in 3 PI01in to PI0in 4 PI02in to PI001n 4 PI02in to PI01in 4
0 10 20 30 40 50 60
Figure C8 PI to PI Portland Cement Concrete all climates all blanking bands
40
Appendix D Pavement Smoothness Pay Factor IncentiveDisincentive Specifications
In FHWA Report FHWA-RD-02-057 ldquoPavement Smoothness Index Relationships Final Reportrdquo two tables present a summary of Smoothness indices and IncentiveDisincentive threshold limits for Asphaltic and Portland Cement Concrete All figures and tables in this appendix are based on information taken from this FHWA report except for updates made for the states of Connecticut Ohio and Minnesota which specifications are presented in Appendices E F and G
Figure D1 presents the specification types and distribution for the states that provided information for the FHWA report
There are six specification models depending on the presence or absence of bonus pay penalties and corrective action The full specification with both bonus pay and penalties included is the most common specification for both Asphaltic concrete and Portland Cement concrete pavements
For the No Bonus and No Penalty specifications two sets of frequencies and percentages are provided For the No Bonus specification the upper numbers are for No Bonus pay (with penalties) occurrences The lower number is the combined No Bonus pay (with penalties) and the No Bonus pay (with no penalties) For the No Penalty specification the upper numbers are for No Penalties (with bonus pay) occurrences The lower number is the combined No Penalty (with bonus pay) and the No Penalty (with no bonus pay)
Figures D2 and D3 present the pavement smoothness indices and incentivedisincentive specification break down by state for Asphaltic and Portland Cement concrete for the information provided by the states for the FHWA report Summary statistics are also provided
The series of figures D4 through D10 show the state by state specifications and thresholds for the payment ranges for Asphaltic and Portland Cement concrete by smoothness index used by the individual states These figures include the updates made for the states of Connecticut Ohio and Minnesota For asphaltic pavements these three states use the IRI index and the full incentivedisincentive specification For Minnesota the IRI information is not shown in Figure D2 for Asphaltic concrete as Minnesota has three sets of specification (equations) depending on pavement design A separate figure D11 is provided later to show the three specification equations For concrete pavements only the updated Connecticut data applies
41
FullSpecification
NoPenalty (NP)
NoBonus (NB)
No Penaltyor Bonus
BonusOnly
NoCorrective (NC)
0 no B
0 no B
Thresholds Distribution Con- Asphalt Con-
Asphalt crete crete 0 Bonus BF Full Pay FP Penalty PC Corrective Action 28 24 737 545
0 Bonus BF F no P C Corrective Action 4 9 105 205 9 15 237 341
FP Penalty PC Corrective Action 1 3 26 68 6 9 158 205
Fno PC Corrective Action 5 6 132 136
0 Bonus B no F no P C Corrective Action 0 1 00 23
0 Bonus BF Full Pay FP Penalty P no C 0 1 00 23
Full Pay
Full Pay
Full Pay
Italic Underline all NP and all NB IRI or PI
B = Bonus Threshold F = Full Pay Threshold P = Penalty Threshold C = Corrective Threshold
Pay Factor Specification Types and Distribution
Figure D1 Pay Factor IncentiveDisincentive Specifications types and distribution
42
Asphalt PavementSmoothness Index by
Specification and StateIndex Spec State
IRI FS CT IRI FS ME IRI FS OH IRI FS SD IRI FS VA IRI FS VT IRI FS WA IRI NB NP GA
MRN FS AZ MRN FS SC MRN FS TN MRN NP WV
PI0mm FS KS PI0mm FS MO PI0mm FS PA PI0mm FS TX
PI25mm FS CA PI5mm FS AL PI5mm FS AR PI5mm FS IA PI5mm FS IL PI5mm FS MD PI5mm FS MN PI5mm FS MS PI5mm FS NE PI5mm FS NM PI5mm FS OH PI5mm FS OK PI5mm FS OR PI5mm NB WI PI5mm NB NP CA PI5mm NB NP ID PI5mm NB NP NV PI5mm NB NP UT PI5mm NP IN PI5mm NP LA PI5mm NP PR
RI FS KY
Asphalt PavementSpecification DistributionSpec Spec Spec
FS 28 737 NB 1 26
NB NP 5 132 NP 4 105
NB 6 158 NP 9 237
Asphalt PavementIndex Distribution
Index Index Index IRI 8 211
MRN 4 105 PI0mm 4 105
PI25mm 1 26 PI5mm 20 526
RI 1 26
Notes FS = Full Specification NB= No Bonus NB NP = No Bonus or Penalty NP = No Penealty
Figure D2 Asphalt pavement smoothness index and specification breakdown by state
43
Concrete PavementSmoothness Index by
Specification and StateIndex Spec State
IRI FS OH IRI FS VA
MRN NP WV PI0mm BO PA PI0mm FS KS PI0mm FS MO PI0mm FS SD PI0mm FS TX
PI25mm FS CO PI25mm FS KY PI25mm FS WI PI25mm NB TN PI25mm NB NP GA PI5mm FS AL PI5mm FS CT PI5mm FS FL PI5mm FS IA PI5mm FS IL PI5mm FS LA PI5mm FS MD PI5mm FS MN PI5mm FS MT PI5mm FS ND PI5mm FS NE PI5mm FS NM PI5mm FS OH PI5mm FS OK PI5mm FS UT PI5mm NB HI PI5mm NB MS PI5mm NB NP CA PI5mm NB NP ID PI5mm NB NP NC PI5mm NB NP NV PI5mm NB NP SC PI5mm NP AR PI5mm NP AZ PI5mm NP DE PI5mm NP IN PI5mm NP MI PI5mm NP NY PI5mm NP OR PI5mm NP PR
PI75mm NC WA
Concrete PavementSpecification DistributionSpec Spec Spec
FS 24 632 BO 1 26 NB 3 79
NB NP 6 158 NP 9 237 NC 1 26
All NB 9 237 All NP 15 395 States 44
Concrete PavementIndex Distribution
Index Index Index IRI 2 44
MRN 1 22 PI0mm 5 111
PI25mm 5 111 PI5mm 30 667
RI 1 22 States 44
Notes FS = Full Specification BO = Bonus Only NB= No Bonus NB NP = No Bonus or Penalty NP = No Penealty NC = No Corrective
Figure D3 Concrete pavement smoothness index and specification breakdown by state
44
Asphalt Pavements Bonus Pay Full Pay Penalty Corrective IRI Limits (inmile) (Source FHWA-RD-02-057 exception Ohio proposal notes)
140
120
100
80
60
40
20
0 CT OH GA ME SD VA VT WA
Penalty Full Pay Bonus
IRI (
inm
i)
Figure D4 Asphalt pavement bonus pay full pay penalty corrective IRI limits by state
Asphalt Pavements Bonus Pay Full Pay Penalty Corrective PI(02 in) Limits (inmi)(Source FHWA-RD-02-057)
16
PI(0
2 in
) (in
mi)
14
12
10
8
6
4
2
0 AL AR CA IA ID IL IN LA MD MN MS NE NM NV OH OK OR PR UT WI
Penalty Full Pay Bonus
Figure D5 Asphalt pavement bonus pay full pay penalty corrective PI(02 in) limits by state
46
Asphalt Pavements Bonus Pay Full Pay Penalty Corrective PI(00 in) Limits (inmi) (Source FHWA-RD-02-057)
0
5
10
15
20
25
30
35
40
45
50 PI
(00
in) (
inm
i)
Penalty Full Pay Bonus
KS MO PA TX
Figure D6 Asphalt pavement bonus pay full pay penalty corrective PI(01 in) limits by state
Concrete Pavement Bonus Pay Full Pay Penalty Corrective IRI Limits (inmi) (VA Source FHWA-RD-02-057 OH Source proposal notes )
0
20
40
60
80
100
120
IRI (
inm
i)
Penalty Full Pay Bonus
VA OH
Figure D7 Concrete pavement bonus pay full pay penalty corrective IRI limits by state
47
Concrete Pavements Bonus Pay Full Pay Penalty Corrective PI(0in) Limits (inmi) (Source FHWA-RD-02-057)
0
5
10
15
20
25
30
35
40
45
50
PI(0
in) (
inm
i)
Penalty Full Pay Bonus
KS MO PA SD TX
Figure D8 Concrete pavement bonus pay full pay penalty corrective PI(0 in) limits by state
Concrete Pavements Bonus Pay Full Pay Penalty Corrective PI(01in) Limits (inmi)
(Source FHWA-RD-02-057)
0
10
20
30
40
50
60
PI(0
1in
) (in
mi)
Penalty Full Pay Bonus
CO GA KY TN WI
Figure D9 Concrete pavement bonus pay full pay penalty corrective PI(01 in) limits by state
48
Concrete Pavements Bonus Pay Full Pay Penalty Corrective PI(02in) Limits (inmi) (Source FHWA-RD-02-057)
PI(0
02i
n) (i
nm
i)
25 Penalty Full Pay Bonus
20
15
10
5
0 AL AR AZ CA CT DE FL HI IA ID IL IN LA MD MI MN MS MT NC ND NE NM NV NY OH OK OR PR SC UT
Figure D10 Concrete pavement bonus pay full pay penalty corrective PI(02 in) limits by state
MNDOT Asphalt Pavement IncentiveDisincentive $01mi (Source 23602350 Combined Specification Dec 2005)
600
400
200
0
$ 0
1 m
i
-200
-400
-600
-800
-1000
0 10 20 30 40 50 60 70 80 90 100
IRI (inmi)
IncentiveDisincentive $01mile Eq A IncentiveDisincentive $01mile Eq B IncentiveDisincentive $01mile Eq C
Figure D11 Minnesota DOT asphalt pavement incentivedisincentive equations
49
Appendix E Example Specifications from Connecticut DOT
Connecticut DOT Special Provision for Pavement Smoothness
SECTION 406 - BITUMINOUS CONCRETE
Article 40603 - Construction Methods Subarticle 10 - Surface Test of Pavement is amended as follows After the last paragraph of the Subarticle add the following
(a) Pavement Smoothness (Rideability) The Engineer shall evaluate the final pavement surface for smoothness by testing in accordance with Section 406 and as stated herein This provision will apply to projects requiring a minimum of two (2) courses of Hot Mix Asphalt (HMA) in which the compacted depth of each is 15 inches (40 mm) or greater
Prior to the placement of the final course of pavement the Engineer will furnish the Contractor with an International Roughness Index (IRI) value that results from the Engineers evaluation of the material placed to date The actual time of this trial evaluation will be coordinated between the Engineer and the Contractor This evaluation will be limited to one (1) test in each direction of travel The IRI value will serve as a guide to the Contractor in evaluating his current level of conformance with the smoothness specification
The IRI value for the final course of pavement will be the basis for determining any payment adjustment(s) in accordance with Table 1 Schedule of Adjusted Payment of Section 40604 - Method of Measurement Subarticle 40604 - 7 Adjustment for Rideability
Evaluation Method - The final pavement surface shall be evaluated for smoothness using an Automated Road Analyzer vehicle or ARAN Computers aboard the ARAN contain software that simulates the traversing of a so-called quarter car over the adjusted profile and calculates an average IRI value as defined by the World Bank for each lane of travel over the project This ARAN is a Class II device as defined by the World Bank The IRI represents the vertical (upward and downward) displacement that a passenger would experience traveling at 48 MPH (77 kmhr) in a standard vehicle over the profile established by the device A zero IRI value would indicate a perfectly smooth pavement surface while increasing IRI values would correspond to an increasingly rough pavement surface The ARAN has the capability to measure longitudinal profile in each wheelpath simultaneously IRI values shall be calculated in inches (meters) of vertical displacement every 001 mile (16 meters) and normalized over one (1) mile in inchesmile or 16 km in mkm For example a 001-mile section yielding an actual vertical displacement of one (1) inch would be normalized to an IRI value of 100 inchesmile
The final pavement surface will be divided into 010 mile (160 meter) segments representing the total lane miles of the project The total lane miles are equal to the miles of resurfacing multiplied by the number of lanes being evaluated The final segment will include any remaining portion of a segment not equaling 010 miles (160 meters) [Example 152 miles of pavement would have 15 segments with the last one measuring 012 miles] The IRI calculated from each wheelpath for each 010 mile (160 meter) segment will be averaged to determine the IRI value for that segment
50
GENERALThe evaluation shall be subject to the following
l Only mainline travel lanes will be evaluated This shall include climbing lanes operational lanes and turning roadways that are 04 miles (644 meters) or greater in length
2 Smoothness data will not be computed for the following project sections
bull
bull bull bull
Climbing and operational lanes and turning roadways less than 04 miles (644 meters) in length
Acceleration and deceleration lanes Shoulders and gore areas Pavement on horizontal curves which have a 900 foot (27432 meters) or less
centerline radius of curvature and pavement within the superelevation transition of these curves
3 Bridge decks shall be included only if paved as part of the project If the bridge decks are not included in the project profile testing will be suspended two hundredths of a mile (002) [32 meters] prior to the first expansion joint and after the last expansion joint on the bridge decks
4 Ramps are specifically excluded from the requirements of this Section
5 Measurement will start two-hundredths of a mile (002) [32 meters] prior to and after the transverse joints at the project limits
6 Data will be collected within 30 days of completion of the entire final course of pavement or within 30 days of completion of any corrective work on the pavement If the entire final course of pavement can not be completed prior to December I (winter shutdown) then data will be collected for any portion of the roadway in which the final course of pavement has been placed These data will be saved and stored by the Department Once the remainder of the final course has been placed the data will be collected and combined with the data taken previously
If the Engineer determines that any pavement corrective work is required the Contractor will be notified in writing within five (5) working days after the completion of the final course of pavement The Contractor shall have thirty (30) days following such notification to make any repairs to the pavement before smoothness measurements are taken
7 No testing shall be conducted during rain or under other conditions deemed inclement by the Engineer During testing the roadway must be free of moisture and other deleterious materials which might affect the evaluation Any work associated with preparing the roadway for the evaluation such as but not limited to sweeping will not be measured for payment
51
GENERAL Article 40604 - Method of Measurernent
Add the following Subarticle
7 Adjustment for Rideability Payment to the Contractor shall be based on the IRI according to the following table The percent adjustment will be applied to payment(s) for the total quantity of HMA surface course excluding ramps complete-in-place and shall conform to the requirements of Section 406 and this provision
TABLE 1 SCHEDULE FOR PAYMENT IRI (inches per mile) IRI (meters per kilometer) PERCENT ADJUSTMENT
lt50 lt079 +10 51 ndash 60 0 80-0 95 +05 61 ndash 80 0 96- 1 26 0 81-100 1 27-1 58 -OS
101-110 1 59-1 74 - 10 111 ndash 120 1 75 - 1 89 - 25
gt 120 gt 1 89 - 50 NOTE All values in the English system will be rounded to the nearest whole number (Example 755 shall be rounded to 76)
All values in the metric system will be rounded to the nearest hundredth (Example 0826 shall be rounded to 083)
Article 40605 - Basis of Payment is amended as follows
Add the following at the end of the first sentence
except as noted herein An adjustment in payment shall apply to the quantity of HMA for the surface course excluding ramps furnished and placed in accordance with Section 406
Positive adjustments for rideability shall not be made for those areas reviewed and determined by the Engineer to be defective as stipulated in Subarticles 10511 and 10604 GENERAL
52
Appendix F Example Specifications from Ohio DOT
53
54
55
56
Appendix G Example Specification from Minnesota DOT
C Pavement Smoothness Specification ndash IRI (International Roughness Index)
C1 General
Pavement smoothness will be evaluated on the final mainline pavement surface using an Inertial Profiler (IP) and the International Roughness Index (IRI) Unless otherwise authorized by the Engineer all smoothness testing shall be performed in the presence of the Engineer The Engineer and the Contractor shall mutually agree upon scheduling of smoothness testing so that testing can be observed Any testing performed without the Engineerrsquos presence unless otherwise authorized may be ordered retested at the Contractorrsquos expenseThe following Table 23607-A (IRI) shows pavement surfaces that are excluded from smoothness testing but subject to 23607B surface requirements
Table 23607 ndash A (IRI) Testing Exclusions 50 feet either side of obstructions such as manholes water supply castings etc
Ramps Loops Climbing lanes Side Streets Side Connections
Turn Lanes Storage Lanes Crossovers Bypass Lanes Shoulders
Intersections constructed under traffic ndash Begin and end the exclusion 305m [100 feet] from the intersection radius Sections less than 1524m [50 ft] in length
Acceleration Deceleration Lanes Projects less than 300m [1000 feet] in length
Mainline paving where the normally posted regulatory speed is less than or equal to 70 kmhr [45 miles per hour] Begin the exclusion at the sign
Single lift overlays over concrete Mainline shall be included in profiling if obstructions are located in auxiliary or parking lanes
C1A Smoothness Requirements
Pavement smoothness requirements will be evaluated by the International Roughness Index (IRI) Equation A Equation B or Equation C The pavement smoothness Equation will be identified in the Special Provisions of the proposal Location of bumps andor dips and magnitude will be based on California Test Method 526
C2 Measurement
Smoothness will be measured with an IP which produces both an IRI value and a profilogram (profile trace of the surface tested) The IP shall conform to the Class 1 requirements of ASTM E950-94 and must be certified according to the most recent procedure on file in the Bituminous Office For pavement evaluation one pass will be made in each lane 274 m [9 feet] from centerline The IP shall be run in the direction the traffic will be moving Each lane will be tested and evaluated separately The Engineer will determine the length in kilometers [miles] for each mainline traffic lane The IP shall be operated at the optimum speed as defined by the manufacturer
C3 Smoothness testing
The Contractor shall furnish a properly calibrated documented and MnDOT certified IP The IP shall be equipped with automatic data reduction capabilities Computer programs used to calculate the IRI statistic from a longitudinal roadway profile shall follow the procedure developed by the World Bank for a quarter-car simulation as described in NCHRP report 228 MnDOT certification documentation shall be provided to the Engineer on the first day the IP is used on the project IP settings are on file in the Bituminous Office The Contractor shall furnish a competent operator trained in the operation of the IP and evaluation of both California Test Method 526 and the International Roughness Index
57
The Contractor shall remove all objects and foreign material on the pavement surface prior to surface evaluation by power brooming The pavement surface will be divided into sections which represent continuous placement A section will terminate 1524m [50 ft] before a bridge approach panel bridge surface manhole or similar interruption In the final pavement evaluation a days work joint will be included in the trace with no special consideration A section will be separated into segments of 01 km [01 mi] A segment will be in one traffic lane only
An IRI value shall be computed for each segment of 1524m [50 ft] or more The IRI value will include the 1524 m [50 ft] at the ends of the section only when the Contractor is responsible for the adjoining surface End of run areas not included in the IRI value and any sections of pavement less than 1524m [50 ft] in length shall be checked longitudinally with a 3028 m [10 ft] straight edge and the surface shall not deviate from a straight line by more than 6 mm in 3028 m [14 inch in 10 ft] Transverse joints shall be evaluated by centering the straightedge longitudinally across the transverse joint The Contractor shall submit the graphical trace a summary of the bump(s)dip(s) locations the magnitude of the bump(s)dip(s) and each segment IRI value on the same day as the profiling was conducted The Contractor shall submit a final spreadsheet summary of the smoothness data to the Engineer within five calendar days after all mainline pavement placement The summary shall be signed by the Contractor The spreadsheet summary shall be in tabular form with each 01 km [01 mile] segment occupying a row Each row shall include the beginning and ending station for the segment the length of the segment the final IRI value for the segment the IRI based incentivedisincentive in dollars for the segment and the deductions for bump(s)dip(s) in dollars for the segment Each continuous run will occupy a separate table and each table will have a header that includes the following the project number the roadway number or designation a lane designation the mix type of the final lift the PG binder of the final lift the date of the final smoothness runs and the beginning and ending station of the continuous run The following information shall be included at the bottom of each summary a subtotal for the IRI based incentivedisincentive a subtotal for the bump deductions and a total for incentivedisincentive for both IRI values and bumps Software to summarize the data is available from the MnDOT Bituminous Office at wwwmrrdotstatemnuspavementbituminousbituminousasp The Contractor will be responsible for all traffic control associated with the smoothness testing and any corrective action (when applicable) that is required of the final pavement surface
C3A Retesting
The Engineer may require any portion or the total project to be retested if the results are questioned This includes both IRI values and bumpdip locations The Engineer will decide whether MnDOT an independent testing firm (ITF) or the Contractor will retest the roadway surface If the retested IRI values differ by more than 10 from the original IRI values the retested values will be used as the basis for acceptance and any incentivedisincentive payments In addition bumpdip locations as shown by the retest will replace the original results If the Engineer directs the Contractor or an independent testing firm to perform retesting and the original results are found to be accurate the Department will pay the Contractor or the independent testing firm $6214 per lane km [$100 per lane mile] that is retested with a minimum charge of $50000 The Contractor will be responsible for any costs associated with retesting if the original values differ by more than 10 from the retested values
C4 IRI Values
The IP shall be equipped with automatic data reduction capabilities for determining the IRI values An IRI value shall be calculated for each segment of the final pavement surface The IRI values shall be determined by following NCHRP report 228 The IRI values shall be reported in units of m per km [inches per mile] Both m per km and inches per mile shall be reported with two digits right of the decimal Follow MnDOT rounding procedures per the Bituminous Manual section 5-693730 When there is a segment equal to or less than 762 m [250 ft] in length at the end of a lane of
58
paving the IRI value for that segment shall be mathematically weighted and added to and included in the evaluation of the adjacent segment Segments greater than 762 m [250 ft] in length will be evaluated individually
C4a Bumps and Dips ndash IRI Equation A and IRI Equation B
Bumpdip location will be determined in accordance with California Method 526 Bumps and dips equal to or exceeding 102 mm in a 762 m [04 inch in a 25 ft] span shall be identified separately When the profile trace shows a successive uninterrupted bump dip or dip bump combination (up to a maximum of 3 alternating trace deviations that relate to one bump or dip on the roadway) identify and evaluate these occurrences as one event The Contractor shall correct by diamond grinding all areas represented by bumps or dips of 102 mm [04 inch] or more as measured by California Test Method 526 However the Engineer may allow bumps or dips of 102 mm to 152 mm [04 inches to 06 inches] in a 762 m [25 foot] span to be left uncorrected and in such case the contractor will be assessed a price deduct as specified in section C6 (ldquoPaymentrdquo) of this special provision Corrected dips or bumps will be considered satisfactory when the profilogram shows the deviations are less than 102 mm in a 762 m [04 inch in a 25 foot] span
C4b Bumps and Dips ndash IRI Equation C
Bumpdip location will be determined in accordance with California Method 526 Bumps and dips equal to or exceeding 127 mm in a 762 m [05 inch in a 25 ft] span shall be identified separately When the profile trace shows a successive uninterrupted bump dip or dip bump combination (up to a maximum of 3 alternating trace deviations that relate to one bump or dip on the roadway) identify and evaluate these occurrences as one event The Contractor shall correct by diamond grinding all areas represented by bumps or dips of 127 mm [05 inch] or more as measured by California Test Method 526 However the Engineer may allow bumps or dips of 127 mm to 178 mm [05 inches to 07 inches] in a 762 m [25 foot] span to be left uncorrected and in such case the contractor will be assessed a price deduct as specified in section C6 (ldquoPaymentrdquo) of this special provision Corrected dips or bumps will be considered satisfactory when the profilogram shows the deviations are less than 127 mm in a 762 m [05 inch in a 25 foot] span
C5 Surface Correction
Unless otherwise approved by the Engineer corrective work shall be by diamond grinding Other methods may include overlaying the area or replacing the area by milling and inlaying The Engineer shall approve of the Contractorrsquos method of correcting segment(s) prior to the Contractor starting corrective work Any corrective actions by milling and inlay or overlay shall meet the specifications for ride quality over the entire length of the correction including the first and last 15 m [50 feet] Bumps or dips in excess of 102 mm [04 inches] where evaluation is by Equation A or B or bumps or dips in excess of 127 mm [05 inch] where evaluation is by Equation C that are located at transverse joints at areas of corrective actions utilizing overlay or milling and inlay shall be removed by diamond grinding The Contractor shall notify the Engineer prior to commencement of the corrective action If the surface is corrected by overlay inlay or replacement the surface correction shall begin and end with a transverse saw cut Surface corrections shall be made prior to placing permanent pavement markings In the event that permanent pavement marking are damaged or destroyed during surface correction activities they will be replaced at no cost to the Agency When pavement smoothness evaluation by Equation A is specified the Engineer may require that the Contractor at no expense to the Department correct segments with an IRI greater than 103 m per km [65 inchesmile] or the Engineer may assess a $560 per 01 km [$900 per 01 mile] penalty in lieu of requiring corrective work When pavement smoothness evaluation by Equation B is specified the Engineer may require that
59
the Contractor at no expense to the Department correct segments with an IRI greater than 118 m per km [75 inchesmile] or the Engineer may assess a $420 per 01 km [$675 per 01 mile] penalty in lieu of requiring corrective work When pavement smoothness evaluation by Equation C is specified the Engineer may require that the Contractor at no expense to the Department correct segments with an IRI greater than 134 m per km [85 inchesmile] or the Engineer may assess a $280 per 01 km [$280 per 01 mile] penalty in lieu of requiring corrective work Bump dip and smoothness correction work shall be for the entire traffic lane width Pavement cross slope shall be maintained through corrective areas All corrective work shall be subject to the approval of the Engineer After all required corrective work is completed a final segment(s) IRI value and bumpdip tabulation shall be determined and submitted to the Engineer Corrective work and re-evaluation shall be at the Contractorrsquos expense Segments requiring grinding will be re-profiled within two working days of completion of grinding Individual bumpsdips and segments requiring grinding shall be completed with 15 working days of notification
C6 Payment
The cost of traffic control for certified smoothness testing andor any corrective work is incidental to the cost of the Wear course mixture The Contractor may receive an incentive payment or be assessed a penalty based on the number of segments and the IRI value The total ride incentive shall not exceed 10 of the total mix price for pavement smoothness evaluated under IRI Equation A 5 of the total mix price for pavement smoothness evaluated under Equation B or 5 of the total mix price for pavement smoothness evaluated under Equation C Total mix shall be defined as all mixture placed on the project Pay adjustments for incentives will only be based on the segment IRI value before any corrective work has been performed Any segment that contains corrective action for IRI value or bumps is not eligible for incentive pay The Contractor will not receive a net incentive payment for ride if more than 25 of all density lots for the project fail to meet minimum density requirements For pavement smoothness evaluated under Equation A uncorrected bumps or dips greater than or equal to 102 mm [04 inches] in a 762 m [25 foot] span will be assessed a price deduction of $900 per event For pavement smoothness evaluated under Equation B uncorrected bumps or dips greater than or equal to 102 mm [04 inches] in a 762 m [25 foot] span will be assessed a price deduction of $675 per event For pavement smoothness evaluated under Equation C uncorrected deviations (bumps or dips) greater than or equal to 127 mm [05 inches] in a 762 m [25 foot] span will be assessed a price deduction of $450 per event Combinations of bumps and dips which arise from the same single bump or dip are considered to be one event and shall be counted only once for the purposes of calculating price deductions Typically bump-dipbump combinations or dip-bump-dip combinations that are confined to a 30 feet longitudinal segment are considered to be one event Bumps or dips resulting from a construction joint will be assessed a $900 penalty regardless of the IRI Equation used for evaluation or pavement smoothness Incentivedisincentive payments will be based on the IRI determined for each segment and will be based on the following equations and criteria
C6a IRI Equation A
IRI mkm [inchesmile] IncentiveDisincentive $01km [$01mile] lt 047 mkm [lt 30 inchesmile] $249 [$400] 047 mkm to 103 mkm [30 inchesmile to 65 inchesmile] $523 ndash (IRI x 584) [$850 ndash (IRI x 15)] 103 mkm [gt 65 inchesmile] -$560 [-$900] Typically 3-lift minimum construction
60
C6b IRI Equation B
IRI mkm [inchesmile] IncentiveDisincentive $01km [$01mile] lt 052 mkm [lt 33 inchesmile] $168 [$270] 052 mkm to 118 mkm [33 inchesmile to 75 inchesmile] $373 ndash (IRI x 395) [$600 ndash (IRI x 10)] 118 mkm [gt 75 inchesmile] -$420 [-$675] Typically 2-lift construction
C6c IRI Equation C
IRI mkm [inchesmile] IncentiveDisincentive $01km [$01mile] lt 057 mkm [lt 36 inchesmile] $112 [$180] 057 mkm to 134 mkm [36 inchesmile to 85 inchesmile] $258 ndash (IRI x 257) [$414 ndash (IRI x 65)] 134 mkm [gt 85 inchesmile] -$280 [-$450] Typically single lift construction
The current bituminous specification 2360 Combined 23602350 (GyratoryMarshall Design) requires pavement smoothness be measured by IRI (International Roughness Index) However the specification does not contain guidance for selecting the appropriate IRI equationrdquo for pavement smoothness evaluation Therefore the following guideline should be used to determine which equation is appropriate Also included in this memo are guidelines for selecting Percent Ride Improvement on 1-lift overlays The designer should use their judgement or consult the Bituminous Office for other construction types not covered in this memo For the following construction types use IRI Equation A bull New construction with a minimum of 3 lifts bull Overlay with a minimum of 3 lifts lift thicknesses of at least 40 mm (15) bull Construction with a minimum of 3 lifts with curb and gutter and at least 8 feet separating the traffic lane from the curb and gutter (shoulder at least 8 wide) For the following construction types use IRI Equation B bull New construction with 2 liftsbull Construction with curb and gutter adjacent to at least one driving lane and three lifts bull Two- lift overlays 40mm (15) minimum lift thicknessbull Winter carry-over - wearing course on two lifts bull Reclaim with 2 liftsbull Cold inplace recycled with 2 lifts bull Two lifts over concrete
For single lift overlay construction on bituminous the Designer can choose either IRI Equation C or Percent Ride Improvement See Note 1 below for single lift overlay on concrete The Percent Ride Improvement provision compares the IRI of the roadway before any construction activities have taken place to the IRI of the roadway after construction activities are finished Incentivedisincentive is determined by the percent ride improvement Percent ride improvement is intended to be used in situations where the existing roadway is in poor condition Data from pilot projects show that the rougher the road segment to begin with the greater the relative improvement possible For instance a road segment with a starting IRI of 150 inmile is more likely to be reduced to an IRI of 75 inmile than a road segment starting at 75 inmile is to be reduced to an IRI of 375 inmile Contact the Special Provisions Unit to insert the Percent Ride Improvement in a Contract For the following construction types use Percent Ride Improvement (1) bull Single lift bituminous over bituminous (BOB) overlays on a roadway surface with an overall PSR lt 28 (IRI greater than 120 inmi) For the following construction types use IRI Equation C (1) bull Single lift bituminous over bituminous (BOB) overlays on a roadway surface with an overall PSR gt 28 (IRI 120 inmi or less) This information is available in the Districtrsquos Pavement Management Condition Rating Reports
61
Note 1 The 2360 specification (Table 23607 ndash A) excludes IRI testing of single lift overlays on concrete However there may be unique situations on single lift BOC construction where a smoothness evaluation requirement is appropriate The designer should consult the Bituminous Office for guidance in those considerations
Because IRI is a new index for pavement smoothness measurement in the bituminous specification the following ldquotypicalrdquo IRI values and the equivalent PSR are given so that you have a perspective of various pavement smoothness numbers IRI PSR New pavement (3-lifts) ndash 37 inmile 41 New pavement (2-lifts) ndash 47 inmile 39 New pavement (1-lift) ndash 60 inmile 36 Aged pavement (10 yrs) ndash 110 inmile 29 Aged pavement (20 yrs) ndash 150 inmile 25 Table 23607 ndash A lists pavement surfaces that are excluded from smoothness testing but subject to 23607B (Surface Requirements) There may be other instances where you feel the ride specification is not appropriate on a Project In those instances make note in the Special Provisions that ride will be verified by 23607B
62
Appendix H Collecting Smoothness Data for Pay Factors Flowchart
Note The option to measure 10 of the length of each project is the least logical for the DOT as a crew is required to travel to each site This option is not very different from DOT measuring smoothness Still this option was presented because it is likely that different contractors will measure profiles on most of the sites To prevent one tampering incident from any one of the contractors it may be necessary to do all of these initially until all security initiatives are adopted An independent review of the practices and results of the DOT are recommended at the end of the first year
63
- OR06017 Assessing IRI vs PIpdf
- IRIvsPIpdf
-

ME
MD outer wheel path 01 mile computer contractor
MA
MI outer wheel path Mile by hand or computer
contractor
MN center of lane 01 mile computer digital
scan contractor
MS both wheel
paths 01 mile
by hand or computer
contractor
MO both wheel
paths 01 mile
by hand or computer
contractor State
MT outer wheel path 01 mile by hand or computer
State
NE outer wheel path 01 mile computer contractor
NV
NH
NJ center of lane State
NM both wheel
paths 01 mile
by hand or computer
contractor
NY both wheel
paths 025 mile by hand contractor
NC both wheel
paths 600 ft by hand contractor
ND outer wheel
paths 01 mile computer State
OH both wheel
paths 01 mile
by hand or computer
contractor
OK both wheel
paths 01 mile
computer digital scan
OR either wheelpath 01 mile by hand or computer
contractor
PA both wheel
paths 01 mile
by hand computer digital
scan contractor
PR outer wheel path 01 mile computer State
RI random random State
15
SC both wheel
paths 025 mile by hand State
SD both wheel
paths 01 mile computer contractor
TN both wheel
paths 01 mile by hand State
TX both wheel
paths 01 mile by hand
contractor State
UT outer wheel path 01 mile computer contractor
VT
VA
WA right wheel path all computer contractor
WV both wheel
paths 01 mile computer State
WI both wheel
paths 01 mile computer contractor
WY both wheel
paths 01 mile State
Source American Concrete Pavement Association
16
Smoothness Specification - Measuring Equipment Used and Roughness Index
State Smoothness Measuring Equipment Roughness Index
AL
AK
AZ CA profilograph Profile Index (inmile)
AR CA profilograph Profile Index (inmile)
CA CA profilograph Profile Index (inmile)
CO CA profilograph Profile Index (inmile)
CT CA profilograph Profile Index (inmile)
DE CA profilograph Profile Index (inmile)
FL CA profilograph Profile Index (inmile)
GA Rainhart profilograph Profile Index (inmile)
HI CA profilograph 12-ft straightedge Profile Index (inmile)
ID CA profilograph 10-ft straightedge Profile Index (in01 mile)
IL CA profilograph IRI
IN CA profilograph 10-ft straightedge Profile Index (in01 mile)
IA CA profilograph Profile Index (inmile)
KS CA profilograph others Profile Index (inmile)
KY noncontact profilometer IRI
LA CA profilograph Profile Index (inmile)
ME 10-ft straightedge
MD CA profilograph Profile Index (inmile)
MA
MI CA profilograph GM Profilometer Ride Quality Index
MN CA profilograph Profile Index (inmile)
MS CA profilograph Profile Index (inmile)
MO CA profilograph Profile Index (inmile)
MT CA profilograph Profile Index (inmile)
NE CA profilograph Profile Index (inmile)
17
NV CA profilograph
NH
NJ 10-ft straightedge none
NM CA profilograph Profile Index (inmile)
NY CA profilograph IRI
NC Rainhart profilograph Profile Index (inmile)
ND CA profilograph inch 010 mile
OH CA profilograph 10-ft straightedge Profile Index (inmile)
OK CA profilograph straightedge Profile Index (inmile)
OR CA profilograph Profile Index (inmile)
PA CA profilograph others Profile Index (inmile)
PR CA profilograph Profile Index (inmile)
RI 10-ft straightedge
SC Rainhart profilograph Profile Index (inmile)
SD CA profilograph Profile Index (inmile)
TN Rainhart profilograph Profile Index (inmile)
TX CA profilograph others Profile Index (inmile)
UT CA profilograph 10-ft straightedge Profile Index (inmile)
VT
VA
WA CA profilograph Profile Index (inmile) IRI
WV Mays Meter Mays ride number
WI CA profilograph Profile Index (inmile)
WY CA profilograph Profile Index (inmile)
Source American Concrete Pavement Association
18
Smoothness Specification - Pay Factors and Limits
State
AL
AK
Index range for 100 payment
Index for maximum incentive
Max incentive possible
Worst roughness
index allowable
Acceptance measurement by
7 - 9AZ
AR 6-7 inmile 2 inmile or
less 105 sq yd
price 7 inmile
CA 5 - 7
CO 7 - 12
CT 10 - 12 0 ndash 6 106 cy unit price
18 - 20 92 cy unit
price
DE lt 40 mm
km $150 m2
175 mm km
FL 103 sy unit price
7 inmile
GA 7 inmile
HI
ID
IL
7 - 10
425 - 10 lt 225 103 sy unit price
10
15
70 sy unit price
90 sy unit price
IN 30 mm 16 km
lt 13 mm 16 km
103 sm unit price
30 mm 16 km
IA 31 - 70 0 - 10 $200-650
per segment
101 $100-300 per
segment
KS 18 - 40 25
- 65 6 15
$1200 $1000 01
mile 25 45
$750 per 01 mile
KY 355 - 404 103 sy unit price
345 - 349 98 sy unit
price
LA 8 in mile
lot 95 sy unit
price
ME
19
MD 4 - 12 lt 2 105 sy unit price
90 sy unit price
MA
MI 4 - 10 0 100 sy unit price
10
MN 4 - 6 0 - 4 $sy
formula 6 - 8 $sy formula
MS lt 7
MO 181 -30 lt 10 107 sy unit price
30 95 sy unit
price
MT 6 - 10 lt 6 $050 sy 10 - 15 $100 sy
NE 7 - 10 0 - 2 105 sy unit price
15 90 sy unit
price
NV
NH
NJ 5 per lot
NM 4 - 7
NY 5 0-1 105 sy unit price
12 to be
determined
NC 4
ND 03 to 05
01 mile lt 03 inch
01 mile $050 sy
09 inch 01 mile
unit price - $400sy
OH 5 - 7 lt 3 105 sy unit price
12 90 sy unit
price
OK
OR 5 - 7 25 1015 sy unit price
7
PA lt 36 lt 18 107 sy unit price
36 100 sy unit
price
PR 20 - 30 formula formula
RI
SC 100 sy unit price
10
SD 25 - 35 lt 10 104 sy 40 98 sy unit
20
unit price price
TN lt 10 10 15
TX 4 - 6 lt 15 $90 per 01 mile section
12 $140 per 01 mile section
UT 7 $100 sy 60 sy unit
price
VT
VA
WA 7 lt 1 104 half
mile section 7
98 half mile section
WV lt 100 100
WI 191 - 32 lt 10 $100 per foot per
lane 45
$8300 per mile per lane
WY 6 - 7 7
Source American Concrete Pavement Association
21
Appendix B-1 State agency smoothness specifications for asphalt pavements ndash Table 14 of Publication FHWA-RD-02-057
State Testing Device Index Testing
Interval Bonus Range
Full Pay Range Penalty Range Correction
Range
AL California-type profilograph
PI5-mm
016 kma (01 mi)
lt32 mmkm (lt2 inches per mile)
32 - 63 mmkm (2 - 39 inches per mile)
64 - 160 mmkm (4 - 10 inches per mile)
gt160 mmkm (lt10 inches per mile)
AK -- -- -- -- -- -- --lt520 520 - 710 lt1578
AZ GM-type profiler MRN
016 kma (01 mi)
mmkma
(lt33 inches per
mmkma
(33 - 45 inches per
711 - 1578 mmkma (46 -100 inches per mile)
mmkma
(gt100 inches per
mile) mile) mile)
AR
California-type profilograph lightweight profiler
PI5-mm 02 km (01 mi)
lt= 45 mmkm (lt= 3 inches per mile)
46 - 75 mmkm (31 - 5 inches per mile)
76 - 110 mmkm (51 - 7 inches per mile)
gt110 mmkm (lt 7 inches per mile)
CA California-type profilograph
PI5-mm
016 km (01 mi)a
--
lt= 80 mmkm (lt= 5 inches per mile)a
--
gt80 mmkm (gt5 inches per mile)a
CO California-type profilograph
PI25-mm
015 km (0095 mi)
lt= 222 mmkm (lt= 14 inches per mile)
2221 -252 mmkm (141 - 16 inches per mile)
2521 - 378 mmkm (161 - 24 inches per mile)
gt378 mmkm (gt24 inches per mile)
gt950 950 - 1260 gt1894
CT ARAN inertial profiler
IRI 016 kma (01 mi)
mmkma
(lt60 inches per
mmkma
(60 - 80 inches per
1261 - 1894 mmkma (801 -120 inches per mile)
mmkma
(gt120 inches per
mile) mile) mile)
DE Rolling straightedge -- -- -- -- -- --
FL Rolling -- -- -- -- -- --
22
--
-- -- -- -- -- --
--
--
--
straightedge
GA Inertial profiler
HI --
ID California-type profilograph
IL California-type profilograph
IN California-type profilograph
IA California-type profilograph
KS California-type profilograph
KY Inertial profiler
LA California-type profilograph
Rolling 02 km ME dipstick IRI (012
profiler mi)
IRI
PI5-mm
PI5-mm
PI5-mm
PI5-mm
PI00
RI
PI5-mm
16 km(10 mi)
01 km (01 mi)
016 km (01 mi)
016 km (01 mi)
016 km (01 mi)
01 km (01 mi)
16 kma
(10 mi)
Lot
lt= 8 mmkm (lt= 05 inches per mile)b
lt= 48 mmkm (lt= 3 inches per mile) lt= 160 mmkm (lt= 10 inches per mile) RI gt= 405
lt= 945 mmkma
(lt= 60 inches per mile)
lt= 750 gt750 mmkm mmkm (lt= 475 -- (gt475 inches per inches per mile)a mile)a
lt= 8 gt8 mm01km -- mm01km (lt= 05 (gt05 in01mi) in01 mi) 9 - 160 mmkm (06 - 10 inches per mile) lt= 30 mm016 km (lt= 12 in01 mi) 49 - 110 mmkm (31 - 7 inches per mile) 161 - 475 mmkm (101 - 30 inches per mile) 370 lt= RI lt 405
lt= 47 mmkm (lt= 3 inches per mile) 946 - 1105 mmkma
(601 - 70 inches per mile)
161 - 235 mmkm (101 - 15 inches per mile)
31 - 38 mm016 km (121 - 15 in01 mi)
111 - 160 mmkm (71 - 10 inches per mile)
476 - 630 mmkm (301 - 40 inches per mile)c
345 lt= RI lt 370
48 - 95 mmkm (31 - 6 inches per mile)
1106 - 1260 mmkma (701 -80 inches per mile)
gt235 mmkm (gt15 inches per mile)
gt38 mm016 km (gt15 in01 mi)
gt160 mmkm (gt10 inches per mile) gt630 mmkm (gt40 inches per mile)
RI lt 345
gt95 mmkm (gt6 inches per mile)
gt1260 mmkma
(gt80 inches per mile)
23
MD
MA
MI
California-type profilograph
Inertial Profiler
California-type profilograph or GM-type inertial profiler
PI5-mm
016 kma (01 mi)
IRI 02 km (012 mi)a
PI5-
mmRQId
016 kma (01 mi)
lt= 63 mmkma
(lt= 40 inches per mile)
lt= 63 mmkma
(lt= 4 inches per mile)or RQI lt45
64 - 110 mmkma
(41 - 7 inches per mile)
64 - 158 mmkma
(41 - 10 inches per mile) or 45 lt= RQI lt= 53
111 - 190 mmkma (71 - 12 inches per mile)
--
gt191 mmkma
(gt12 inches per mile)
gt158 mmkma
(gt10 inches per mile)or RQI gt 53
MN
MS
MO
MT
California-type profilograph
California-type profilograph
California-type profilograph
--
PI5-mm
PI5-mm
PI00
--
01 km (01 mi)
016 kma (01 mi)
01 km (01 mi)
--
lt= 387 mmkm (lt= 24 inches per mile) lt= 79 mmkma
(lt= 5 inches per mile) lt= 284 mmkm (lt= 18 inches per mile)
--
388 - 789 mmkm (25 - 5 inches per mile) 80 - 110 mmkma
(51 - 7 inches per mile) 285 - 395 mmkm (181 - 25 inches per mile)
--
79 - 1183 mkm (51 - 75 inches per mile)
111 - 158 mkma (71 - 10 inches per mile)
396 - 711 mkm (251 - 45 inches per mile)
--
gt1183 mmkm (gt75 inches per mile) gt158 mmkma
(gt10 inches per mile) gt712 mmkm (gt45 inches per mile)
--
NE
NV
NH
California-type profilograph
California-type profilograph
GM-type
PI5-mm
PI5-mm
RN
02 km (01 mi)
01 km (01 mi)
016
lt= 75 mmkm (lt= 5 inches per mile)
--
76 - 110 mmkm (51 - 7 inches per mile) lt= 80 mmkm (lt= 5 inches per mile)
111 - 155 mmkm (71 - 10 inches per mile)
--
gt155 mmkm (gt10 inches per mile)
gt80 mmkm (gt5 inches per mile)
24
NJ
NM
NC
ND
inertial profiler Rolling straightedge
California-type profilograph
Hearne straightedge
--
--
PI5-mm
CSI
--
kma (01 mi)
01 km (01 mi)
lt= 65 mmkm (lt= 4 inches per mile)
66 - 80 mmkm (41 - 5 inches per mile)
81 - 160 mkm (51 - 10 inches per mile)
gt160 mmkm (gt10 inches per mile)
076 km (047 mi)
CSI=1020 CSI=3040 CSI=1121314150516061
-- -- -- -- --
--
-- -- -- -- --
OH
OK
OR
PA
PR
RI
California-type profilograph
California-type profilograph
California-type profilograph
California-type profilograph
California-type profilograph
--
PI5-mm
PI5-mm
PI5-mm
PI00
PI5-mm
--
016 kma (01 mi)
lt= 63 mmkma
(lt= 4 inches per mile)
016 kma (01 mi)
lt= 79 mmkma
(lt= 5 inches per mile)
016 kma
(01 mi)
lt= 80 mmkma
(lt= 5 inches per mile)
016 kma (01 mi)
lt= 442 mmkma
(lt= 28 inches per mile)
016 kma (01 mi)
lt= 110 mmkma
(lt= 7 inches per mile)
-- --
64 - 110 mmkma
(41 - 7 inches per mile) 80 - 110 mmkma
(51 - 7 inches per mile) 81 - 110 mmkma
(51 - 7 inches per mile) 443 - 536 mmkma
(281 - 34 inches per mile) 111 - 205 mmkma
(71 - 13 inches per mile)
--
111 - 190 mkma (71 - 12 inches per mile)
111 - 190 mkma (71 - 12 inches per mile)
111 - 155 mmkma (71 - 10 inches per mile)
537 - 726 mmkma (341 - 46 inches per mile)
-
--
gt190 mmkma
(gt12 inches per mile) gt190 mmkma
(gt12 inches per mile) gt155 mmkma
(gt10 inches per mile) gt726 mmkma
(gt46 inches per mile) gt205 mmkma
(gt13 inches per mile)
--
SC Maysmeter MRN 16 kma
(10 mi)
lt= 552 mmkma
(lt= 35
553 - 630 mmkma
(351 - 40
631 - 868 mmkma (401 - 55 inches per mile)
gt868 mmkma
(gt55
25
inches per inches per inches per mile) mile) mile)
SD Inertial profiler IRI
016 kma (01 mi)
lt= 868 a mmkm
(lt= 55 inches per mile)
869 - 1105 a mmkm
(551 - 70 inches per mile)
1106 - 1262 mmkma (701 -80 inches per mile)
gt1262 a mmkm
(gt80 inches per mile)
TN Maysmeter MRN16 kma
(10 mi)
lt= 315 mmkm a (lt= 20 inches per mile)
316 - 475 a mmkm
(201 - 30 inches per mile)
476 - 950 mmkma (301 - 60 inches per mile)
gt950 a mmkm
(gt60 inches per mile)
TX California-type profilograph
PI00
016 kma (01 mi)
lt= 237 a mmkm
(lt= 15 inches per mile)
238 - 315 a mmkm
(151 - 20 inches per mile)
316 - 630 mkma (201 - 40 inches per mile)
gt630 a mmkm
(gt40 inches per mile)
UT California-type profilograph
PI5-mm
02 km (012 mi) a
--
lt= 110 mmkm (lt=7 inches per mile) a
--
gt110 mmkm (gt7 inches per mile)a
VT Maysmeter IRI032 kma (02 mi)
lt950 a mmkm
(lt60 inches per mile)
950 - 1090 a mmkm
(60 - 69 inches per mile)
1091 - 1500 mmkma (70 -95 inches per mile)
gt1500 a mmkm
(gt95 inches per mile)
VA South Dakota-type profiler
IRI 016 kma (01 mi)
lt= 868 a mmkm
(lt= 55 inches per mile)
869 - 1105 a mmkm
(551 - 70 inches per mile)
1106 - 1578 kma (701 - 100 inches per mile)
gt1578 a mmkm
(gt100 inches per mile)
WAe Lightweight inertial profiler
IRI 01 km (01 mi)a
lt= 946 a mmkm
(lt= 60 inches per mile)
947 - 1500 a mmkm
(601 - 95 inches per mile)
1501 - 1815 mmkma (951 -115 inches per mile)
gt1815 a mmkm
(gt115 inches per mile)
WV Maysmeter or inertial profiler
MRN016 km (01 mi) --
lt= 1000 mmkm (lt= 65 inches per mile)
1001 - 1500 mmkm (66 - 975 inches per mile)
gt1500 mmkm (gt975 inches per mile)
WI California- PI5-mm 016 -- lt= 158 159 - 237 mkma (101 - 15 gt237
26
type profilograph
kma (01 mi)
mmkma
(lt= 10 inches per mile)
inches per mile) mmkma
(gt15 inches per mile)
WY Inertial profiler IRI
016 kma (01 mi)
Percent Within Limits Specification Upper Spec Limit = 1500 mkm (95 inches per mile) Percent Within Limits Specification Lower Spec Limit = RN = 41 Statistical Based Specification Full Pay approximately equal to 868-1105 mmkm (55-70 inches per mile) a Limits are a direct English-Metric conversion from counterpart limits Actual limits given by the Agency were not available b Based on average profile index for entire project c For PI between 476 mmkm (301 inches per mile) and 630 mmkm (40 inches per mile) must also grind to 475 mmkm (30 inches per mile) or belowd RQI Ride quality index e Draft specification
27
Appendix B-2 State agency smoothness specifications for concrete pavements ndash Table 15 of Publication FHWA-RD-02-057
State
AL
AK
Testing Device
California-type profilograph
--
Index
PI5-mm
--
Testing Interval
016 km (01 mi)
--
Bonus Range
lt45 mmkm (lt3 inches per mile)
--
Full Pay Range
45 -- 94 mmkm (3 -- 59 inches per mile)
--
Penalty Range
95 - 160 mmkm (6 - 10 inches per mile)
--
Correction Range
gt160 mmkm (gt10 inches per mile)
--
AZ
AR
CA
CO
CT
DE
FL
GA
California-type profilograph
California-type profilograph lightweight profiler
California-type profilograph
California-type profilograph
California-type profilograph
CA profilograph or rolling straightedge
California-type profilograph
Rainhart
PI5-mm
PI5-mm
PI5-mm
PI25-
mm
PI5-mm
PI5-mm
PI5-mm
PI25-
016 kma(01 mi)
02 km (01 mi)
01 km (006 mi)a
015 km (0095 mi)
015 km (01 mi)a
016 kma(01 mi)
01 km (01 mi)
04
lt110 mmkma(lt7 inches per mile) lt= 90 mmkm (lt= 6 inches per mile)
lt= 222 mmkma (lt= 14 inches per mile)
lt=160 mmkm (10 inches per mile)a
lt50 mmkma(lt32 inches per mile) lt= 80 mmkm (lt= 5 inches per mile)
--
--
110 -- 142 mmkma(7 -9 inches per mile) 91 - 110 mmkm (61 - 7 inches per mile) lt= 110 mmkm (lt= 7 inches per mile)a
2221 - 252 mmkma
(141 - 16 inches per mile) 161 - 190 mmkm (101 - 12 inches per mile)a
50 - 200 mmkma(32 - 127 inches per mile) 81 - 95 mmkm (51 - 6 inches per mile) lt= 110
--
--
--
2521 - 378 mmkma
(161 - 24 inches per mile) 191 - 315 mmkm (121 - 20 inches per mile)a
96 - 110 mmkm (61 - 7 inches per mile)
--
--
gt142 mmkma(gt9 inches per mile)
gt110 mmkm (gt7 inches per mile)
gt110 mmkm (gt7 inches per mile)a
gt378 mmkma
(gt24 inches per mile)
gt315 mmkm (gt20 inches per mile)a
gt200 mmkma(gt127 inches per mile)
gt110 mmkm (gt7 inches per mile)
gt110
28
profilograph mm kma(025 mmkma(lt= mmkma(gt7mi) 7 inches per inches per
mile) mile)
HI California-type profilograph PI5-mm
016kma(01mi)
--
lt= 157 mmkma(lt= 10 inches per mile)
158 - 236 mmkma(101 - 15 inches per mile)
gt236mmkma(gt15inches permile)
ID California-type profilograph PI5-mm
01 km (01 mi) --
lt= 8 mm01 km (lt= 05 in01mi)
--gt8 mm01 km (gt05in01mi)
IL California-type profilograph PI5-mm
016 km (01 mi)
lt= 67 mmkm (lt= 425 inches per mile) b
68 - 160 mmkm (426 - 10 inches per mile)
161 - 235mmkm (1001 - 15 inches per mile)
gt235 mmkm (gt15 inches per mile)
IN California-type profilograph PI5-mm
016 km (01 mi)
lt= 23mm016 km (lt= 09 in01mi)
23 - 25 mm016km(09 - 10 in01 mi)
--gt25 mm016 km (gt10 in01 mi)
IA California-type profilograph PI5-mm
016 km (01 mi)
lt= 48 mmkm (pound3 inches per mile)
49 - 110 mmkm (31 - 7 inches per mile)
111 - 160 mmkm (71 - 10 inches per mile)
gt160 mmkm (gt10 inches per mile)
KS California-type profilograph PI00
01 km (01 mi)
lt= 285 mmkm (lt= 18 inches per mile)
286 -- 475 mmkm (181 -- 30 inches per mile)
476 -- 630 mmkm (301 -- 40 inches per mile)c
gt630 mmkm (gt40 inches per mile)
KY Rainhart profilograph and inertial profiler
PI25-
mmRI
03 kma(019 mi)
RI gt= 405
lt=125 mmkma (lt= 8 inches per mile)
126 - 190 mmkma(81 - 12 inches per mile)
gt190mmkma(gt12inches permile)
LA California-type profilograph PI5-mm Lot -
pound94 mmkm (lt= 6 inches per mile)
95 - 126mmkm (61 - 8 inches per mile)
gt126 mmkm (gt8 inches per mile)
ME -- -- -- -- -- -- --
MD California-type profilograph PI5-mm
016kma(01mi)
lt= 63 mmkma (lt= 40 inches per mile)
64 - 110 mmkma(41 - 7 inches per mile)
111 - 190 mmkma(71 - 12 inches per mile)
gt191mmkma(gt12inches permile)
MA -- -- -- -- -- -- --MI California-type PI5- 016 lt= 63 64 - 158 -- gt158
29
MN
MS
MO
MT
NE
NV
NH
profilograph or GM-type inertial profiler
California-type profilograph
California-type profilograph
California-type profilograph
California-type profilograph
California-type profilograph
California-type profilograph
--
mmRQI d
kma(01 mi)
PI5-mm 016 km (01 mi)
PI5-mm
016 kma(01 mi)
PI00 01 km (01 mi)
PI5-mm
016 kma(01 mi)
PI5-mm 02 km (01 mi)
PI5-mm 01 km (01 mi)
-- --
mmkma (lt= 4 inches per mile)or RQI lt 45
lt= 63 mmkm (lt= 4 inches per mile)
lt= 284 mmkm (lt= 18 inches per mile) lt= 94 mmkma(pound6 inches per mile) lt= 75 mmkm (lt= 5 inches per mile)
--
--
--
mmkma (41 - 10 inches per mile)or 45 lt=RQI lt= 53
mmkma(gt10 inches per mile)or RQI gt 53
64 - 94 mmkm (41 - 6 inches per mile)
95 - 126 mkm (61 - 8 inches per mile)
gt126 mmkm (gt8 inches per mile)
lt= 110 mmkma(lt= 7 inches per mile)
111 - 190 mkma(71 -12 inches per mile)
gt190 mmkma(gt12 inches per mile)
285 - 395 mmkm (181 - 25 inches per mile)
396 - 711 mkm (251 - 45 inches per mile)
gt712 mmkm (gt45 inches per mile)
95 - 158 mmkma(61 - 10 inches per mile)
159 - 237 mkma (101 - 15 inches per mile)
gt237 mmkma(gt15 inches per mile)
76 - 155 mmkm (51 - 10 inches per mile)
156 - 230 mmkm (101 - 15 inches per mile)
gt230 mmkm (gt15 inches per mile)
lt= 80 mmkm (lt= 5 inches per mile)
gt80 mmkm (gt5 inches per mile)
--
-- -- --NJ
NM
NY
NC
Rolling straightedge
California-type profilograph
California-type profilograph
Rainhart profilograph
--
PI5-mm
PI5-mm
PI5-mm
-- --
01 km (01 mi)
lt= 80 mmkm (lt= 5 inches per mile)
016 km (01 mi)a
lt= 79 mmkma(lt= 5 inches per mile)
018 kma(011 mi)
--
-- --81 - 110 mmkm (51 - 7 inches per mile)
111 - 190 mkm (71 - 12 inches per mile)
80 - 190 mmkma(51 - 12 inches per mile) lt= 63 mmkma(lt= 4 inches per
--
--
--
gt190 mmkm (gt12 inches per mile)
gt190kma(gt12 inches per mile)
gt63 mmkma(gt4 inches per
30
mile) mile)
ND California-type profilograph PI5-mm
016 kma(01 mi)
lt8mm016 kma(lt03 in01mi)
8 - 13 mm016 kma(03 - 05 in01mi)
14 -- 23mm016kma(051 -09 in01mi)
gt23 mm016 kma(gt09in01mi)
OH California-type profilograph PI5-mm
016kma(01mi)
lt= 78 mmkma(lt= 5 inches per mile)
79 - 110 mmkma(51 - 7 inches per mile)
111 - 190 mkma(71 -12 inches per mile)
gt190mmkma(gt12inches permile)
OK California-type profilograph PI5-mm
016kma(01mi)
lt= 79 mmkma(lt= 5 inches per mile)
80 - 110 mmkma(51 - 7 inches per mile)
111 - 190 mkma(71 -12 inches per mile)
gt190mmkma(gt12inches permile)
OR California-type profilograph PI5-mm
02 km (01 mi)a
lt= 80 mmkm (lt= 5 inches per mile)a
81 - 110 mmkm (51 - 7 inches per mile)a
--gt110 mmkm (gt7 inches per mile)a
PA California-type profilograph PI00
016a(01 mi)
lt= 568 mmkma(lt= 36 inches per mile)
-- --
gt568 mmkma(gt36inches per mile)
PR California-type profilograph PI5-mm
016kma(01mi)
lt= 110 mmkma(lt= 7 inches per mile)
111 - 205 mmkma(71 - 13 inches per mile)
--
gt205mmkma(gt13inches permile)
RI -- -- -- -- -- -- --
SC Rainhart profilograph PI5-mm
04kma(025mi)
--
lt= 158 mmkma(lt= 10 inches per mile)
--
gt158mmkma(gt10inches permile)
SD California-type profilograph PI00
01 km (01 mi)
lt= 395 mmkm (lt= 25 inches per mile)
396 - 550 mmkm (251 - 35 inches per mile)
551 - 630 mmkm (351 - 40 inches per mile)
gt630 mmkm (gt40 inches per mile)
TN Rainhartprofilograph PI25-
mm
01 km (01 mi) --
lt= 160 mmkm (lt= 10 inches per mile)
161 - 235 mmkm (101 - 15 inchesper mile)
gt235 mmkm (gt15 inches per mile)
TX California-type profilograph PI00
016kma(01mi)
237 mmkma(lt= 15 inches per mile)
238 - 315 mmkma(151 - 20 inches per mile)
316 -- 630 mkma(201 -40 inches per mile)
gt630mmkma(gt40inches permile)
31
UT California-type profilograph PI5-mm
02 km (012 mi)a
--
lt= 110mmkm (lt= 7 inches permile)a
--gt110 mmkm (gt7 inches per mile) a
VT -- -- -- -- -- -- --
VA South Dakota-type profiler IRI 016 kma
(01 mi)
lt= 946 mmkma (lt= 60 inches per mile)
947 - 1262 a mmkm
(601 - 80 inches per mile)
1263 - 1578 km a(801 - 100 inches per mile)
gt1578 mmkma (gt100 inches per mile)
WA California-type profilograph
PI75-
mm
01 km (01 mi) a
lt= 60 mmkm (lt= 38 inches per mile)a
61 -- 100 mmkm (39 - 63 inches per mile) a
gt100 mmkm (gt63 inches per mile) ae
--
WV Maysmeter or inertial profiler MRN 016 km
(01 mi) --
lt= 1000 mmkm (lt= 65 inches per mile)
1001 - 1500 mmkm (66 - 975 inches per mile)
gt1500 mmkm (gt975 inches per mile)
WI California-type profilograph
PI01-
inch
016 kma
(01 mi)
lt= 400 mmkma (lt= 253 inches per mile)
401 - 700 a mmkm
(254 - 443 inches per mile)
701 - 800 mkma (444 - 507 inches per mile) f
gt800 mmkma
(gt507 inches per mile)
WY California-type profilograph PI5-mm
Perf Related Spec (PCC thickness strength smoothness) gt80 mmkm (gt50 inches per mile) a Limits are a direct English-Metric conversion from counterpart limits Actual limits given by the agency were not available b Based on average profile index for entire project c For PI between 476 mmkm (301 inches per mile) and 630 mmkm (40 inches per mile) must also grind to 475 mmkm (30 inches per mile) or below d RQI Ride quality index e For PI greater than 100 mmkm (63 inches per mile) must also grind to 100 mmkm (63 inches per mile) or lessf For PI greater than 700 mmkm (443 inches per mile) must also grind to 700 mmkm (443 inches per mile) or less
32
Appendix C IRI vs PI and PI to PI (Asphalt to Concrete) Relationships
In FHWA Report FHWA-RD-02-057 ldquoPavement Smoothness Index Relationships Final Reportrdquo equations where developed for converting from PI to IRI based on pavement type and climatic region using the LTPP profile data base Tables C1 C2 C3 and C4 summarize the conversion equations Information on PI to IRI relationships relevant to Missouri are highlighted in the tables and noted in the figure captions
Table C1 PI to IRI equations for Asphaltic Concrete PI to IRI for Asphaltic Concrete
Pavement Type Climatea
Blanking Band (mm)
Correlation Equation (IRI = mmkm PI = mmkm) N SEE R2
AC 1234 0 IRI = 266543PI00 + 21301 14170 2002 089 AC 1234 25 IRI = 297059PI25-mm + 63874 14160 2317 086 AC 1234 5 IRI = 378601PI5-mm + 88751 13775 2923 077
ACAC 1 0 IRI = 274599PI00 + 26542 1854 192 091 ACAC 1 25 IRI = 312622PI25-mm + 70856 1854 230 087 ACAC 1 5 IRI = 425316PI5-mm + 95780 1824 2882 079 ACAC 2 0 IRI = 268169PI00 + 27467 1494 1846 081 ACAC 2 25 IRI = 333564PI25-mm + 65567 1494 2466 066 ACAC 2 5 IRI = 439478PI5-mm + 88320 1345 3082 045 ACAC 34 0 IRI = 242295PI00 + 30190 5126 1788 084 ACAC 34 25 IRI = 268324PI25-mm + 66034 5126 217 076 ACAC 34 5 IRI = 342671PI5-mm + 87680 4906 2659 063
ACPCC 1234 0 IRI = 240300PI00 + 29293 4156 2056 079 ACPCC 1234 25 IRI = 278217PI25-mm + 71687 4156 2297 073 ACPCC 1234 5 IRI = 394665PI5-mm + 93922 4052 2596 065 Source FHWA-RD-02-057a Climatic zones 1=DF 2=DNF 3=WF 4=WNF
DF Dry-FreezeDNF Dry-Nonfreeze WF Wet-Freeze
WNF Wet-Nonfreeze
33
Table C2 PI to IRI for Portland Cement Concrete PI to IRI for Portland Cement Concrete
Pavement Type Climatea Blanking
Band (mm) Correlation Equation (IRI =
mmkm PI = mmkm) N SEE R2
PCC 13 0 IRI = 212173PI00 + 43976 12039 2596 08 PCC 13 25 IRI = 215316PI25-mm + 94705 12039 2787 08
PCC 13 5 IRI = 262558PI5-mm + 120573 11946 306 08
PCC 2 0 IRI = 258454PI00 + 42309 1448 1765 09
PCC 2 25 IRI = 25921PI25-mm + 102473 1448 2265 08
PCC 2 5 IRI = 351673PI5-mm + 122635 1364 2687 07
PCC 4 0 IRI = 23582PI00 + 31719 2888 2365 08
PCC 4 25 IRI = 240731PI25-mm + 88810 2888 2645 08
PCC 4 5 IRI = 287407PI5-mm + 122963 2885 2974 07 Source FHWA-RD-02-057a Climatic zones 1=DF 2=DNF 3=WF 4=WNF
DF Dry-FreezeDNF Dry-Nonfreeze WF Wet-Freeze
WNF Wet-Nonfreeze
34
Table C3 PI to PI for Asphaltic Concrete PI to PI for Asphaltic Concrete
Type Climatea FromTo Correlation Equation (PI = mmkm) N SEE R2
AC 13 PI25-mm to PI00-mm PI00 = 108722PI25-mm + 17442 5744 4773 096
AC 13 PI5-mm to PI00-mm PI00 = 135776PI5-mm + 27548 5684 8358 088
AC 13 PI5-mm to PI25-mm PI25-mm = 128213PI5-mm + 8779 5684 4662 095
AC 24 PI25-mm to PI00-mm PI00 = 112338PI25-mm + 15284 8418 4523 095
AC 24 PI5-mm to PI00-mm PI00 = 146417PI5-mm + 24009 8093 7173 086
AC 24 PI5-mm to PI25-mm PI25-mm = 134055PI5-mm + 7313 8093 3864 095
ACAC 1 PI25-mm to PI00-mm PI00 = 114153PI25-mm + 16070 1856 4341 096
ACAC 1 PI5-mm to PI00-mm PI00 = 156038PI5-mm + 25089 1826 7374 088
ACAC 1 PI5-mm to PI25-mm PI25-mm = 139462PI5-mm + 7555 1826 4047 095
ACAC 2 PI25-mm to PI00-mm PI00 = 128067PI25-mm + 13815 1496 5226 086
ACAC 2 PI5-mm to PI00-mm PI00 = 175837PI5-mm + 22284 1347 7932 066
ACAC 2 PI5-mm to PI25-mm PI25-mm = 152523PI5-mm + 5660 1347 3414 089
ACAC 34 PI25-mm to PI00-mm PI00 = 111926PI25-mm + 14585 5128 4486 093
ACAC 34 PI5-mm to PI00-mm PI00 = 145876PI5-mm + 23359 4908 7153 081
ACAC 34 PI5-mm to PI25-mm PI25-mm = 136739PI5-mm + 7117 4908 3812 093
ACPCC 1234 PI25-mm to PI00-mm PI00 = 115412PI25-mm + 17708 4158 4446 093
ACPCC 1234 PI5-mm to PI00-mm PI00 = 161123PI5-mm + 27111 4054 7107 081
ACPCC 1234 PI5-mm to PI25-mm PI25-mm = 144895PI5-mm + 7683 4054 3699 093 Source FHWA-RD-02-057 a Climatic zones 1=DF 2=DNF 3=WF 4=WNF
DF Dry-Freeze DNF Dry-Nonfreeze WF Wet-Freeze
WNF Wet-Nonfreeze
35
Table C4 PI to PI for Portland Cement Concrete PI to PI for Portland Cement Concrete
Type Climatea FromTo Correlation Equation (PI = mmkm) N SEE R2
PCC 1 PI25-mm to PI00-mm PI00 = 104364PI25-mm + 23813 2237 469 095
PCC 1 PI5-mm to PI00-mm PI00 = 139512PI5-mm + 34308 2182 712 087
PCC 1 PI5-mm to PI25-mm PI25-mm = 136458PI5-mm + 9646 2180 433 095
PCC 2 PI25-mm to PI00-mm PI00 = 102028PI25-mm + 22978 1448 443 094
PCC 2 PI5-mm to PI00-mm PI00 = 136715PI5-mm + 31325 1366 664 086
PCC 2 PI5-mm to PI25-mm PI25-mm = 138376PI5-mm + 7490 1364 398 095
PCC 3 PI25-mm to PI00-mm PI00 = 101255PI25-mm + 23865 9800 500 097
PCC 3 PI5-mm to PI00-mm PI00 = 120723PI5-mm + 36791 9764 867 091
PCC 3 PI5-mm to PI25-mm PI25-mm = 120990PI5-mm + 12395 9764 536 096
PCC 4 PI25-mm to PI00-mm PI00 = 101320PI25-mm + 24481 2888 569 094
PCC 4 PI5-mm to PI00-mm PI00 = 119909PI5-mm + 39049 2885 852 085
PCC 4 PI5-mm to PI25-mm PI25-mm = 1212677PI5-mm + 13843 2885 430 096
36
Source FHWA-RD-02-057 a Climatic zones 1=DF 2=DNF 3=WF 4=WNF
DF Dry-Freeze DNF Dry-Nonfreeze WF Wet-Freeze
WNF Wet-Nonfreeze
The figures on the following pages present the previous four tables or equations as a series of graphs
The PI to PI charts are for informational purposes only to indicate how the index varies with the different blanking bands applied PI indices are difficult to compare from state to state as different blanking bands give different results IRIs derived from inertial profilers are more comparable from state to state and thus are more useful in research studies The AASHTO specifications listed in the Conclusion section were establish to make the IRI a consistent measurement
PI to IRI Asphaltic Concrete All Climates by Blanking Band(inch) (Source FHWA-RD-02-057)
300
0 10 20 30 40 50PI (inmi)
PI(BB=00 in) PI(BB=01 in) PI(BB=02 in)
250
200
150
100
50
0
IRI (
inm
i)
Figure C1 PI to IRI for concrete all climates and blanking bands (Green line lower one] applicable to Missouri)
PI to IRI Asphaltic ConcreteAsphaltic Concrete by Climate and Blanking Band(inch)1=Dry-Freeze 2=Dry-Nonfreeze 3=Wet-Freeze 4=Wet-Nonfreeze
(Source FHWA-RD-02-057)300
PI(BB=00 in) 1 PI(BB=01 in) 1 PI(BB=02 in) 1 PI(BB=00 in) 2 PI(BB=01 in) 2 PI(BB=02 in) 2 PI(BB=00 in) 34 PI(BB=01 in) 34 PI(BB=02 in) 34
250
200
150
100
50
0
IRI (
inm
i)
000 1000 2000 3000 4000 5000
PI (inmi)
6000
60
Figure C2 PI to IRI Asphaltic ConcreteAsphaltic Concrete all climates all blanking bands (Thick solid green line [lowest one] applicable to Missouri)
37
PI to IRI Asphaltic ConcretePortland Cement Concrete All Climates by Blanking Band(inch)
300
250
200
150
100
50
0
PI(BB=00 in)
PI(BB=01 in)
PI(BB=02 in)
IRI (
inm
i)
000 1000 2000 3000 4000 5000 6000 PI (inmi)
Figure C3 PI to IRI Asphaltic ConcretePortland Cement Concrete all climates all blanking bands (Green line [lowest one] applicable to Missouri)
PI to IRI Asphaltic ConcreteAsphaltic Concrete by Climate and Blanking Band(inch)1=Dry-Freeze 2=Dry-Nonfreeze 3=Wet-Freeze 4=Wet-Nonfreeze
(Source FHWA-RD-02-057)400
IRI (
inm
i)
350
300
250
200
150
100
50
0
PI(BB=00 in) 13 PI(BB=01 in) 13 PI(BB=02 in) 13 PI(BB=00 in) 2 PI(BB=01 in) 2 PI(BB=02 in) 2 PI(BB=00 in) 4 PI(BB=01 in) 4 PI(BB=02 in) 4
0 10 20 30 40 50
PI (inmi)
6
Figure C4 PI to IRI for Portland Cement Concrete all climates all blanking bands (Thin solid green line [lowest one] applicable to Missouri)
0
38
PI to PI Asphaltic Concrete by Climate and Blanking Band(in) 1=Dry-Freeze 2=Dry-Nonfreeze 3=Wet-Freeze 4=Wet-Nonfreeze
(Source FHWA-RD-02-057)
0
20
40
60
80
100
120 PI
(in
mi)
PI01in to PI0in 13 PI02in to PI0in 13 PI02in to PI01in 13 PI01in to PI0in 24 PI02in to PI0in 24 PI02in to PI01in 24
00 100 200 300 400 500 600
PI (inmi)
Figure C5 PI to PI for Asphaltic Concrete
PI to PI Asphaltic ConcreteAsphaltic Concrete by Climate and Blanking Band(in)1=Dry-Freeze 2=Dry-Nonfreeze 3=Wet-Freeze 4=Wet-Nonfreeze
(Source FHWA-RD-02-057)
70 0
20
40
60
80
100
120
PI (i
nm
i)
PI01in to PI0in 1 PI02in to PI0in 1 PI02in to PI01in 1 PI01in to PI0in 2 PI02in to PI0in 2 PI02in to PI0in 2 PI02in to PI0in 34 PI02in to PI0in 34 PI02in to PI01 34
0 10 20 30 40 50 60
PI (inmi)
Figure C6 PI to PI for Asphaltic Concrete Asphaltic Concrete all climates all blanking bands
39
PI to PI Asphaltic ConcretePortland Cement ConcreteAll Climates by Blanking Band(in)
(Source FHWA-RD-02-057)
0
20
40
60
80
100
120
140
160
180
200
PI (i
nm
i)
PI01in to PI0in PI02in to PI0in PI02in to PI01in
0 10 20 30 40 50 60 70 80 90
PI (inmi)
100
70
PI (inmi)
Figure C7 PI to PI forAsphaltic Concrete Portland Cement Concrete all climates all blanking bands
PI to PI Portland Cement Concrete by Climate and Blanking Band(in) 1=Dry-Freeze 2=Dry-Nonfreeze 3=Wet-Freeze 4=Wet-Nonfreeze
(Source FHWA-RD-02-057) 120
PI (i
nm
i)
100
80
60
40
20
0
PI01in to PI0in 1 PI02in to PI0 1 PI02in to PI01in 1 PI02in to PI0in 2 PI02in to PI0in 2 PI02in to PI01in 2 PI01in to PI0in 3 PI02in to PI0in 3 PI02in to PI01in 3 PI01in to PI0in 4 PI02in to PI001n 4 PI02in to PI01in 4
0 10 20 30 40 50 60
Figure C8 PI to PI Portland Cement Concrete all climates all blanking bands
40
Appendix D Pavement Smoothness Pay Factor IncentiveDisincentive Specifications
In FHWA Report FHWA-RD-02-057 ldquoPavement Smoothness Index Relationships Final Reportrdquo two tables present a summary of Smoothness indices and IncentiveDisincentive threshold limits for Asphaltic and Portland Cement Concrete All figures and tables in this appendix are based on information taken from this FHWA report except for updates made for the states of Connecticut Ohio and Minnesota which specifications are presented in Appendices E F and G
Figure D1 presents the specification types and distribution for the states that provided information for the FHWA report
There are six specification models depending on the presence or absence of bonus pay penalties and corrective action The full specification with both bonus pay and penalties included is the most common specification for both Asphaltic concrete and Portland Cement concrete pavements
For the No Bonus and No Penalty specifications two sets of frequencies and percentages are provided For the No Bonus specification the upper numbers are for No Bonus pay (with penalties) occurrences The lower number is the combined No Bonus pay (with penalties) and the No Bonus pay (with no penalties) For the No Penalty specification the upper numbers are for No Penalties (with bonus pay) occurrences The lower number is the combined No Penalty (with bonus pay) and the No Penalty (with no bonus pay)
Figures D2 and D3 present the pavement smoothness indices and incentivedisincentive specification break down by state for Asphaltic and Portland Cement concrete for the information provided by the states for the FHWA report Summary statistics are also provided
The series of figures D4 through D10 show the state by state specifications and thresholds for the payment ranges for Asphaltic and Portland Cement concrete by smoothness index used by the individual states These figures include the updates made for the states of Connecticut Ohio and Minnesota For asphaltic pavements these three states use the IRI index and the full incentivedisincentive specification For Minnesota the IRI information is not shown in Figure D2 for Asphaltic concrete as Minnesota has three sets of specification (equations) depending on pavement design A separate figure D11 is provided later to show the three specification equations For concrete pavements only the updated Connecticut data applies
41
FullSpecification
NoPenalty (NP)
NoBonus (NB)
No Penaltyor Bonus
BonusOnly
NoCorrective (NC)
0 no B
0 no B
Thresholds Distribution Con- Asphalt Con-
Asphalt crete crete 0 Bonus BF Full Pay FP Penalty PC Corrective Action 28 24 737 545
0 Bonus BF F no P C Corrective Action 4 9 105 205 9 15 237 341
FP Penalty PC Corrective Action 1 3 26 68 6 9 158 205
Fno PC Corrective Action 5 6 132 136
0 Bonus B no F no P C Corrective Action 0 1 00 23
0 Bonus BF Full Pay FP Penalty P no C 0 1 00 23
Full Pay
Full Pay
Full Pay
Italic Underline all NP and all NB IRI or PI
B = Bonus Threshold F = Full Pay Threshold P = Penalty Threshold C = Corrective Threshold
Pay Factor Specification Types and Distribution
Figure D1 Pay Factor IncentiveDisincentive Specifications types and distribution
42
Asphalt PavementSmoothness Index by
Specification and StateIndex Spec State
IRI FS CT IRI FS ME IRI FS OH IRI FS SD IRI FS VA IRI FS VT IRI FS WA IRI NB NP GA
MRN FS AZ MRN FS SC MRN FS TN MRN NP WV
PI0mm FS KS PI0mm FS MO PI0mm FS PA PI0mm FS TX
PI25mm FS CA PI5mm FS AL PI5mm FS AR PI5mm FS IA PI5mm FS IL PI5mm FS MD PI5mm FS MN PI5mm FS MS PI5mm FS NE PI5mm FS NM PI5mm FS OH PI5mm FS OK PI5mm FS OR PI5mm NB WI PI5mm NB NP CA PI5mm NB NP ID PI5mm NB NP NV PI5mm NB NP UT PI5mm NP IN PI5mm NP LA PI5mm NP PR
RI FS KY
Asphalt PavementSpecification DistributionSpec Spec Spec
FS 28 737 NB 1 26
NB NP 5 132 NP 4 105
NB 6 158 NP 9 237
Asphalt PavementIndex Distribution
Index Index Index IRI 8 211
MRN 4 105 PI0mm 4 105
PI25mm 1 26 PI5mm 20 526
RI 1 26
Notes FS = Full Specification NB= No Bonus NB NP = No Bonus or Penalty NP = No Penealty
Figure D2 Asphalt pavement smoothness index and specification breakdown by state
43
Concrete PavementSmoothness Index by
Specification and StateIndex Spec State
IRI FS OH IRI FS VA
MRN NP WV PI0mm BO PA PI0mm FS KS PI0mm FS MO PI0mm FS SD PI0mm FS TX
PI25mm FS CO PI25mm FS KY PI25mm FS WI PI25mm NB TN PI25mm NB NP GA PI5mm FS AL PI5mm FS CT PI5mm FS FL PI5mm FS IA PI5mm FS IL PI5mm FS LA PI5mm FS MD PI5mm FS MN PI5mm FS MT PI5mm FS ND PI5mm FS NE PI5mm FS NM PI5mm FS OH PI5mm FS OK PI5mm FS UT PI5mm NB HI PI5mm NB MS PI5mm NB NP CA PI5mm NB NP ID PI5mm NB NP NC PI5mm NB NP NV PI5mm NB NP SC PI5mm NP AR PI5mm NP AZ PI5mm NP DE PI5mm NP IN PI5mm NP MI PI5mm NP NY PI5mm NP OR PI5mm NP PR
PI75mm NC WA
Concrete PavementSpecification DistributionSpec Spec Spec
FS 24 632 BO 1 26 NB 3 79
NB NP 6 158 NP 9 237 NC 1 26
All NB 9 237 All NP 15 395 States 44
Concrete PavementIndex Distribution
Index Index Index IRI 2 44
MRN 1 22 PI0mm 5 111
PI25mm 5 111 PI5mm 30 667
RI 1 22 States 44
Notes FS = Full Specification BO = Bonus Only NB= No Bonus NB NP = No Bonus or Penalty NP = No Penealty NC = No Corrective
Figure D3 Concrete pavement smoothness index and specification breakdown by state
44
Asphalt Pavements Bonus Pay Full Pay Penalty Corrective IRI Limits (inmile) (Source FHWA-RD-02-057 exception Ohio proposal notes)
140
120
100
80
60
40
20
0 CT OH GA ME SD VA VT WA
Penalty Full Pay Bonus
IRI (
inm
i)
Figure D4 Asphalt pavement bonus pay full pay penalty corrective IRI limits by state
Asphalt Pavements Bonus Pay Full Pay Penalty Corrective PI(02 in) Limits (inmi)(Source FHWA-RD-02-057)
16
PI(0
2 in
) (in
mi)
14
12
10
8
6
4
2
0 AL AR CA IA ID IL IN LA MD MN MS NE NM NV OH OK OR PR UT WI
Penalty Full Pay Bonus
Figure D5 Asphalt pavement bonus pay full pay penalty corrective PI(02 in) limits by state
46
Asphalt Pavements Bonus Pay Full Pay Penalty Corrective PI(00 in) Limits (inmi) (Source FHWA-RD-02-057)
0
5
10
15
20
25
30
35
40
45
50 PI
(00
in) (
inm
i)
Penalty Full Pay Bonus
KS MO PA TX
Figure D6 Asphalt pavement bonus pay full pay penalty corrective PI(01 in) limits by state
Concrete Pavement Bonus Pay Full Pay Penalty Corrective IRI Limits (inmi) (VA Source FHWA-RD-02-057 OH Source proposal notes )
0
20
40
60
80
100
120
IRI (
inm
i)
Penalty Full Pay Bonus
VA OH
Figure D7 Concrete pavement bonus pay full pay penalty corrective IRI limits by state
47
Concrete Pavements Bonus Pay Full Pay Penalty Corrective PI(0in) Limits (inmi) (Source FHWA-RD-02-057)
0
5
10
15
20
25
30
35
40
45
50
PI(0
in) (
inm
i)
Penalty Full Pay Bonus
KS MO PA SD TX
Figure D8 Concrete pavement bonus pay full pay penalty corrective PI(0 in) limits by state
Concrete Pavements Bonus Pay Full Pay Penalty Corrective PI(01in) Limits (inmi)
(Source FHWA-RD-02-057)
0
10
20
30
40
50
60
PI(0
1in
) (in
mi)
Penalty Full Pay Bonus
CO GA KY TN WI
Figure D9 Concrete pavement bonus pay full pay penalty corrective PI(01 in) limits by state
48
Concrete Pavements Bonus Pay Full Pay Penalty Corrective PI(02in) Limits (inmi) (Source FHWA-RD-02-057)
PI(0
02i
n) (i
nm
i)
25 Penalty Full Pay Bonus
20
15
10
5
0 AL AR AZ CA CT DE FL HI IA ID IL IN LA MD MI MN MS MT NC ND NE NM NV NY OH OK OR PR SC UT
Figure D10 Concrete pavement bonus pay full pay penalty corrective PI(02 in) limits by state
MNDOT Asphalt Pavement IncentiveDisincentive $01mi (Source 23602350 Combined Specification Dec 2005)
600
400
200
0
$ 0
1 m
i
-200
-400
-600
-800
-1000
0 10 20 30 40 50 60 70 80 90 100
IRI (inmi)
IncentiveDisincentive $01mile Eq A IncentiveDisincentive $01mile Eq B IncentiveDisincentive $01mile Eq C
Figure D11 Minnesota DOT asphalt pavement incentivedisincentive equations
49
Appendix E Example Specifications from Connecticut DOT
Connecticut DOT Special Provision for Pavement Smoothness
SECTION 406 - BITUMINOUS CONCRETE
Article 40603 - Construction Methods Subarticle 10 - Surface Test of Pavement is amended as follows After the last paragraph of the Subarticle add the following
(a) Pavement Smoothness (Rideability) The Engineer shall evaluate the final pavement surface for smoothness by testing in accordance with Section 406 and as stated herein This provision will apply to projects requiring a minimum of two (2) courses of Hot Mix Asphalt (HMA) in which the compacted depth of each is 15 inches (40 mm) or greater
Prior to the placement of the final course of pavement the Engineer will furnish the Contractor with an International Roughness Index (IRI) value that results from the Engineers evaluation of the material placed to date The actual time of this trial evaluation will be coordinated between the Engineer and the Contractor This evaluation will be limited to one (1) test in each direction of travel The IRI value will serve as a guide to the Contractor in evaluating his current level of conformance with the smoothness specification
The IRI value for the final course of pavement will be the basis for determining any payment adjustment(s) in accordance with Table 1 Schedule of Adjusted Payment of Section 40604 - Method of Measurement Subarticle 40604 - 7 Adjustment for Rideability
Evaluation Method - The final pavement surface shall be evaluated for smoothness using an Automated Road Analyzer vehicle or ARAN Computers aboard the ARAN contain software that simulates the traversing of a so-called quarter car over the adjusted profile and calculates an average IRI value as defined by the World Bank for each lane of travel over the project This ARAN is a Class II device as defined by the World Bank The IRI represents the vertical (upward and downward) displacement that a passenger would experience traveling at 48 MPH (77 kmhr) in a standard vehicle over the profile established by the device A zero IRI value would indicate a perfectly smooth pavement surface while increasing IRI values would correspond to an increasingly rough pavement surface The ARAN has the capability to measure longitudinal profile in each wheelpath simultaneously IRI values shall be calculated in inches (meters) of vertical displacement every 001 mile (16 meters) and normalized over one (1) mile in inchesmile or 16 km in mkm For example a 001-mile section yielding an actual vertical displacement of one (1) inch would be normalized to an IRI value of 100 inchesmile
The final pavement surface will be divided into 010 mile (160 meter) segments representing the total lane miles of the project The total lane miles are equal to the miles of resurfacing multiplied by the number of lanes being evaluated The final segment will include any remaining portion of a segment not equaling 010 miles (160 meters) [Example 152 miles of pavement would have 15 segments with the last one measuring 012 miles] The IRI calculated from each wheelpath for each 010 mile (160 meter) segment will be averaged to determine the IRI value for that segment
50
GENERALThe evaluation shall be subject to the following
l Only mainline travel lanes will be evaluated This shall include climbing lanes operational lanes and turning roadways that are 04 miles (644 meters) or greater in length
2 Smoothness data will not be computed for the following project sections
bull
bull bull bull
Climbing and operational lanes and turning roadways less than 04 miles (644 meters) in length
Acceleration and deceleration lanes Shoulders and gore areas Pavement on horizontal curves which have a 900 foot (27432 meters) or less
centerline radius of curvature and pavement within the superelevation transition of these curves
3 Bridge decks shall be included only if paved as part of the project If the bridge decks are not included in the project profile testing will be suspended two hundredths of a mile (002) [32 meters] prior to the first expansion joint and after the last expansion joint on the bridge decks
4 Ramps are specifically excluded from the requirements of this Section
5 Measurement will start two-hundredths of a mile (002) [32 meters] prior to and after the transverse joints at the project limits
6 Data will be collected within 30 days of completion of the entire final course of pavement or within 30 days of completion of any corrective work on the pavement If the entire final course of pavement can not be completed prior to December I (winter shutdown) then data will be collected for any portion of the roadway in which the final course of pavement has been placed These data will be saved and stored by the Department Once the remainder of the final course has been placed the data will be collected and combined with the data taken previously
If the Engineer determines that any pavement corrective work is required the Contractor will be notified in writing within five (5) working days after the completion of the final course of pavement The Contractor shall have thirty (30) days following such notification to make any repairs to the pavement before smoothness measurements are taken
7 No testing shall be conducted during rain or under other conditions deemed inclement by the Engineer During testing the roadway must be free of moisture and other deleterious materials which might affect the evaluation Any work associated with preparing the roadway for the evaluation such as but not limited to sweeping will not be measured for payment
51
GENERAL Article 40604 - Method of Measurernent
Add the following Subarticle
7 Adjustment for Rideability Payment to the Contractor shall be based on the IRI according to the following table The percent adjustment will be applied to payment(s) for the total quantity of HMA surface course excluding ramps complete-in-place and shall conform to the requirements of Section 406 and this provision
TABLE 1 SCHEDULE FOR PAYMENT IRI (inches per mile) IRI (meters per kilometer) PERCENT ADJUSTMENT
lt50 lt079 +10 51 ndash 60 0 80-0 95 +05 61 ndash 80 0 96- 1 26 0 81-100 1 27-1 58 -OS
101-110 1 59-1 74 - 10 111 ndash 120 1 75 - 1 89 - 25
gt 120 gt 1 89 - 50 NOTE All values in the English system will be rounded to the nearest whole number (Example 755 shall be rounded to 76)
All values in the metric system will be rounded to the nearest hundredth (Example 0826 shall be rounded to 083)
Article 40605 - Basis of Payment is amended as follows
Add the following at the end of the first sentence
except as noted herein An adjustment in payment shall apply to the quantity of HMA for the surface course excluding ramps furnished and placed in accordance with Section 406
Positive adjustments for rideability shall not be made for those areas reviewed and determined by the Engineer to be defective as stipulated in Subarticles 10511 and 10604 GENERAL
52
Appendix F Example Specifications from Ohio DOT
53
54
55
56
Appendix G Example Specification from Minnesota DOT
C Pavement Smoothness Specification ndash IRI (International Roughness Index)
C1 General
Pavement smoothness will be evaluated on the final mainline pavement surface using an Inertial Profiler (IP) and the International Roughness Index (IRI) Unless otherwise authorized by the Engineer all smoothness testing shall be performed in the presence of the Engineer The Engineer and the Contractor shall mutually agree upon scheduling of smoothness testing so that testing can be observed Any testing performed without the Engineerrsquos presence unless otherwise authorized may be ordered retested at the Contractorrsquos expenseThe following Table 23607-A (IRI) shows pavement surfaces that are excluded from smoothness testing but subject to 23607B surface requirements
Table 23607 ndash A (IRI) Testing Exclusions 50 feet either side of obstructions such as manholes water supply castings etc
Ramps Loops Climbing lanes Side Streets Side Connections
Turn Lanes Storage Lanes Crossovers Bypass Lanes Shoulders
Intersections constructed under traffic ndash Begin and end the exclusion 305m [100 feet] from the intersection radius Sections less than 1524m [50 ft] in length
Acceleration Deceleration Lanes Projects less than 300m [1000 feet] in length
Mainline paving where the normally posted regulatory speed is less than or equal to 70 kmhr [45 miles per hour] Begin the exclusion at the sign
Single lift overlays over concrete Mainline shall be included in profiling if obstructions are located in auxiliary or parking lanes
C1A Smoothness Requirements
Pavement smoothness requirements will be evaluated by the International Roughness Index (IRI) Equation A Equation B or Equation C The pavement smoothness Equation will be identified in the Special Provisions of the proposal Location of bumps andor dips and magnitude will be based on California Test Method 526
C2 Measurement
Smoothness will be measured with an IP which produces both an IRI value and a profilogram (profile trace of the surface tested) The IP shall conform to the Class 1 requirements of ASTM E950-94 and must be certified according to the most recent procedure on file in the Bituminous Office For pavement evaluation one pass will be made in each lane 274 m [9 feet] from centerline The IP shall be run in the direction the traffic will be moving Each lane will be tested and evaluated separately The Engineer will determine the length in kilometers [miles] for each mainline traffic lane The IP shall be operated at the optimum speed as defined by the manufacturer
C3 Smoothness testing
The Contractor shall furnish a properly calibrated documented and MnDOT certified IP The IP shall be equipped with automatic data reduction capabilities Computer programs used to calculate the IRI statistic from a longitudinal roadway profile shall follow the procedure developed by the World Bank for a quarter-car simulation as described in NCHRP report 228 MnDOT certification documentation shall be provided to the Engineer on the first day the IP is used on the project IP settings are on file in the Bituminous Office The Contractor shall furnish a competent operator trained in the operation of the IP and evaluation of both California Test Method 526 and the International Roughness Index
57
The Contractor shall remove all objects and foreign material on the pavement surface prior to surface evaluation by power brooming The pavement surface will be divided into sections which represent continuous placement A section will terminate 1524m [50 ft] before a bridge approach panel bridge surface manhole or similar interruption In the final pavement evaluation a days work joint will be included in the trace with no special consideration A section will be separated into segments of 01 km [01 mi] A segment will be in one traffic lane only
An IRI value shall be computed for each segment of 1524m [50 ft] or more The IRI value will include the 1524 m [50 ft] at the ends of the section only when the Contractor is responsible for the adjoining surface End of run areas not included in the IRI value and any sections of pavement less than 1524m [50 ft] in length shall be checked longitudinally with a 3028 m [10 ft] straight edge and the surface shall not deviate from a straight line by more than 6 mm in 3028 m [14 inch in 10 ft] Transverse joints shall be evaluated by centering the straightedge longitudinally across the transverse joint The Contractor shall submit the graphical trace a summary of the bump(s)dip(s) locations the magnitude of the bump(s)dip(s) and each segment IRI value on the same day as the profiling was conducted The Contractor shall submit a final spreadsheet summary of the smoothness data to the Engineer within five calendar days after all mainline pavement placement The summary shall be signed by the Contractor The spreadsheet summary shall be in tabular form with each 01 km [01 mile] segment occupying a row Each row shall include the beginning and ending station for the segment the length of the segment the final IRI value for the segment the IRI based incentivedisincentive in dollars for the segment and the deductions for bump(s)dip(s) in dollars for the segment Each continuous run will occupy a separate table and each table will have a header that includes the following the project number the roadway number or designation a lane designation the mix type of the final lift the PG binder of the final lift the date of the final smoothness runs and the beginning and ending station of the continuous run The following information shall be included at the bottom of each summary a subtotal for the IRI based incentivedisincentive a subtotal for the bump deductions and a total for incentivedisincentive for both IRI values and bumps Software to summarize the data is available from the MnDOT Bituminous Office at wwwmrrdotstatemnuspavementbituminousbituminousasp The Contractor will be responsible for all traffic control associated with the smoothness testing and any corrective action (when applicable) that is required of the final pavement surface
C3A Retesting
The Engineer may require any portion or the total project to be retested if the results are questioned This includes both IRI values and bumpdip locations The Engineer will decide whether MnDOT an independent testing firm (ITF) or the Contractor will retest the roadway surface If the retested IRI values differ by more than 10 from the original IRI values the retested values will be used as the basis for acceptance and any incentivedisincentive payments In addition bumpdip locations as shown by the retest will replace the original results If the Engineer directs the Contractor or an independent testing firm to perform retesting and the original results are found to be accurate the Department will pay the Contractor or the independent testing firm $6214 per lane km [$100 per lane mile] that is retested with a minimum charge of $50000 The Contractor will be responsible for any costs associated with retesting if the original values differ by more than 10 from the retested values
C4 IRI Values
The IP shall be equipped with automatic data reduction capabilities for determining the IRI values An IRI value shall be calculated for each segment of the final pavement surface The IRI values shall be determined by following NCHRP report 228 The IRI values shall be reported in units of m per km [inches per mile] Both m per km and inches per mile shall be reported with two digits right of the decimal Follow MnDOT rounding procedures per the Bituminous Manual section 5-693730 When there is a segment equal to or less than 762 m [250 ft] in length at the end of a lane of
58
paving the IRI value for that segment shall be mathematically weighted and added to and included in the evaluation of the adjacent segment Segments greater than 762 m [250 ft] in length will be evaluated individually
C4a Bumps and Dips ndash IRI Equation A and IRI Equation B
Bumpdip location will be determined in accordance with California Method 526 Bumps and dips equal to or exceeding 102 mm in a 762 m [04 inch in a 25 ft] span shall be identified separately When the profile trace shows a successive uninterrupted bump dip or dip bump combination (up to a maximum of 3 alternating trace deviations that relate to one bump or dip on the roadway) identify and evaluate these occurrences as one event The Contractor shall correct by diamond grinding all areas represented by bumps or dips of 102 mm [04 inch] or more as measured by California Test Method 526 However the Engineer may allow bumps or dips of 102 mm to 152 mm [04 inches to 06 inches] in a 762 m [25 foot] span to be left uncorrected and in such case the contractor will be assessed a price deduct as specified in section C6 (ldquoPaymentrdquo) of this special provision Corrected dips or bumps will be considered satisfactory when the profilogram shows the deviations are less than 102 mm in a 762 m [04 inch in a 25 foot] span
C4b Bumps and Dips ndash IRI Equation C
Bumpdip location will be determined in accordance with California Method 526 Bumps and dips equal to or exceeding 127 mm in a 762 m [05 inch in a 25 ft] span shall be identified separately When the profile trace shows a successive uninterrupted bump dip or dip bump combination (up to a maximum of 3 alternating trace deviations that relate to one bump or dip on the roadway) identify and evaluate these occurrences as one event The Contractor shall correct by diamond grinding all areas represented by bumps or dips of 127 mm [05 inch] or more as measured by California Test Method 526 However the Engineer may allow bumps or dips of 127 mm to 178 mm [05 inches to 07 inches] in a 762 m [25 foot] span to be left uncorrected and in such case the contractor will be assessed a price deduct as specified in section C6 (ldquoPaymentrdquo) of this special provision Corrected dips or bumps will be considered satisfactory when the profilogram shows the deviations are less than 127 mm in a 762 m [05 inch in a 25 foot] span
C5 Surface Correction
Unless otherwise approved by the Engineer corrective work shall be by diamond grinding Other methods may include overlaying the area or replacing the area by milling and inlaying The Engineer shall approve of the Contractorrsquos method of correcting segment(s) prior to the Contractor starting corrective work Any corrective actions by milling and inlay or overlay shall meet the specifications for ride quality over the entire length of the correction including the first and last 15 m [50 feet] Bumps or dips in excess of 102 mm [04 inches] where evaluation is by Equation A or B or bumps or dips in excess of 127 mm [05 inch] where evaluation is by Equation C that are located at transverse joints at areas of corrective actions utilizing overlay or milling and inlay shall be removed by diamond grinding The Contractor shall notify the Engineer prior to commencement of the corrective action If the surface is corrected by overlay inlay or replacement the surface correction shall begin and end with a transverse saw cut Surface corrections shall be made prior to placing permanent pavement markings In the event that permanent pavement marking are damaged or destroyed during surface correction activities they will be replaced at no cost to the Agency When pavement smoothness evaluation by Equation A is specified the Engineer may require that the Contractor at no expense to the Department correct segments with an IRI greater than 103 m per km [65 inchesmile] or the Engineer may assess a $560 per 01 km [$900 per 01 mile] penalty in lieu of requiring corrective work When pavement smoothness evaluation by Equation B is specified the Engineer may require that
59
the Contractor at no expense to the Department correct segments with an IRI greater than 118 m per km [75 inchesmile] or the Engineer may assess a $420 per 01 km [$675 per 01 mile] penalty in lieu of requiring corrective work When pavement smoothness evaluation by Equation C is specified the Engineer may require that the Contractor at no expense to the Department correct segments with an IRI greater than 134 m per km [85 inchesmile] or the Engineer may assess a $280 per 01 km [$280 per 01 mile] penalty in lieu of requiring corrective work Bump dip and smoothness correction work shall be for the entire traffic lane width Pavement cross slope shall be maintained through corrective areas All corrective work shall be subject to the approval of the Engineer After all required corrective work is completed a final segment(s) IRI value and bumpdip tabulation shall be determined and submitted to the Engineer Corrective work and re-evaluation shall be at the Contractorrsquos expense Segments requiring grinding will be re-profiled within two working days of completion of grinding Individual bumpsdips and segments requiring grinding shall be completed with 15 working days of notification
C6 Payment
The cost of traffic control for certified smoothness testing andor any corrective work is incidental to the cost of the Wear course mixture The Contractor may receive an incentive payment or be assessed a penalty based on the number of segments and the IRI value The total ride incentive shall not exceed 10 of the total mix price for pavement smoothness evaluated under IRI Equation A 5 of the total mix price for pavement smoothness evaluated under Equation B or 5 of the total mix price for pavement smoothness evaluated under Equation C Total mix shall be defined as all mixture placed on the project Pay adjustments for incentives will only be based on the segment IRI value before any corrective work has been performed Any segment that contains corrective action for IRI value or bumps is not eligible for incentive pay The Contractor will not receive a net incentive payment for ride if more than 25 of all density lots for the project fail to meet minimum density requirements For pavement smoothness evaluated under Equation A uncorrected bumps or dips greater than or equal to 102 mm [04 inches] in a 762 m [25 foot] span will be assessed a price deduction of $900 per event For pavement smoothness evaluated under Equation B uncorrected bumps or dips greater than or equal to 102 mm [04 inches] in a 762 m [25 foot] span will be assessed a price deduction of $675 per event For pavement smoothness evaluated under Equation C uncorrected deviations (bumps or dips) greater than or equal to 127 mm [05 inches] in a 762 m [25 foot] span will be assessed a price deduction of $450 per event Combinations of bumps and dips which arise from the same single bump or dip are considered to be one event and shall be counted only once for the purposes of calculating price deductions Typically bump-dipbump combinations or dip-bump-dip combinations that are confined to a 30 feet longitudinal segment are considered to be one event Bumps or dips resulting from a construction joint will be assessed a $900 penalty regardless of the IRI Equation used for evaluation or pavement smoothness Incentivedisincentive payments will be based on the IRI determined for each segment and will be based on the following equations and criteria
C6a IRI Equation A
IRI mkm [inchesmile] IncentiveDisincentive $01km [$01mile] lt 047 mkm [lt 30 inchesmile] $249 [$400] 047 mkm to 103 mkm [30 inchesmile to 65 inchesmile] $523 ndash (IRI x 584) [$850 ndash (IRI x 15)] 103 mkm [gt 65 inchesmile] -$560 [-$900] Typically 3-lift minimum construction
60
C6b IRI Equation B
IRI mkm [inchesmile] IncentiveDisincentive $01km [$01mile] lt 052 mkm [lt 33 inchesmile] $168 [$270] 052 mkm to 118 mkm [33 inchesmile to 75 inchesmile] $373 ndash (IRI x 395) [$600 ndash (IRI x 10)] 118 mkm [gt 75 inchesmile] -$420 [-$675] Typically 2-lift construction
C6c IRI Equation C
IRI mkm [inchesmile] IncentiveDisincentive $01km [$01mile] lt 057 mkm [lt 36 inchesmile] $112 [$180] 057 mkm to 134 mkm [36 inchesmile to 85 inchesmile] $258 ndash (IRI x 257) [$414 ndash (IRI x 65)] 134 mkm [gt 85 inchesmile] -$280 [-$450] Typically single lift construction
The current bituminous specification 2360 Combined 23602350 (GyratoryMarshall Design) requires pavement smoothness be measured by IRI (International Roughness Index) However the specification does not contain guidance for selecting the appropriate IRI equationrdquo for pavement smoothness evaluation Therefore the following guideline should be used to determine which equation is appropriate Also included in this memo are guidelines for selecting Percent Ride Improvement on 1-lift overlays The designer should use their judgement or consult the Bituminous Office for other construction types not covered in this memo For the following construction types use IRI Equation A bull New construction with a minimum of 3 lifts bull Overlay with a minimum of 3 lifts lift thicknesses of at least 40 mm (15) bull Construction with a minimum of 3 lifts with curb and gutter and at least 8 feet separating the traffic lane from the curb and gutter (shoulder at least 8 wide) For the following construction types use IRI Equation B bull New construction with 2 liftsbull Construction with curb and gutter adjacent to at least one driving lane and three lifts bull Two- lift overlays 40mm (15) minimum lift thicknessbull Winter carry-over - wearing course on two lifts bull Reclaim with 2 liftsbull Cold inplace recycled with 2 lifts bull Two lifts over concrete
For single lift overlay construction on bituminous the Designer can choose either IRI Equation C or Percent Ride Improvement See Note 1 below for single lift overlay on concrete The Percent Ride Improvement provision compares the IRI of the roadway before any construction activities have taken place to the IRI of the roadway after construction activities are finished Incentivedisincentive is determined by the percent ride improvement Percent ride improvement is intended to be used in situations where the existing roadway is in poor condition Data from pilot projects show that the rougher the road segment to begin with the greater the relative improvement possible For instance a road segment with a starting IRI of 150 inmile is more likely to be reduced to an IRI of 75 inmile than a road segment starting at 75 inmile is to be reduced to an IRI of 375 inmile Contact the Special Provisions Unit to insert the Percent Ride Improvement in a Contract For the following construction types use Percent Ride Improvement (1) bull Single lift bituminous over bituminous (BOB) overlays on a roadway surface with an overall PSR lt 28 (IRI greater than 120 inmi) For the following construction types use IRI Equation C (1) bull Single lift bituminous over bituminous (BOB) overlays on a roadway surface with an overall PSR gt 28 (IRI 120 inmi or less) This information is available in the Districtrsquos Pavement Management Condition Rating Reports
61
Note 1 The 2360 specification (Table 23607 ndash A) excludes IRI testing of single lift overlays on concrete However there may be unique situations on single lift BOC construction where a smoothness evaluation requirement is appropriate The designer should consult the Bituminous Office for guidance in those considerations
Because IRI is a new index for pavement smoothness measurement in the bituminous specification the following ldquotypicalrdquo IRI values and the equivalent PSR are given so that you have a perspective of various pavement smoothness numbers IRI PSR New pavement (3-lifts) ndash 37 inmile 41 New pavement (2-lifts) ndash 47 inmile 39 New pavement (1-lift) ndash 60 inmile 36 Aged pavement (10 yrs) ndash 110 inmile 29 Aged pavement (20 yrs) ndash 150 inmile 25 Table 23607 ndash A lists pavement surfaces that are excluded from smoothness testing but subject to 23607B (Surface Requirements) There may be other instances where you feel the ride specification is not appropriate on a Project In those instances make note in the Special Provisions that ride will be verified by 23607B
62
Appendix H Collecting Smoothness Data for Pay Factors Flowchart
Note The option to measure 10 of the length of each project is the least logical for the DOT as a crew is required to travel to each site This option is not very different from DOT measuring smoothness Still this option was presented because it is likely that different contractors will measure profiles on most of the sites To prevent one tampering incident from any one of the contractors it may be necessary to do all of these initially until all security initiatives are adopted An independent review of the practices and results of the DOT are recommended at the end of the first year
63
- OR06017 Assessing IRI vs PIpdf
- IRIvsPIpdf
-
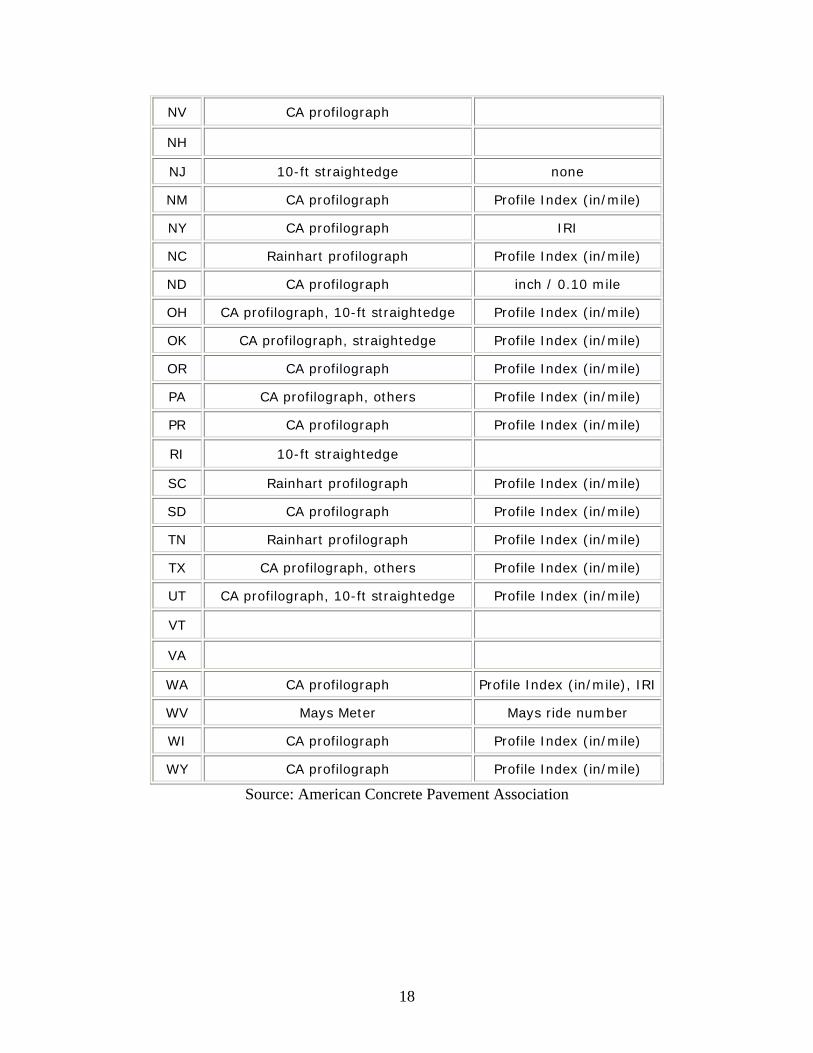

--
-- -- -- -- -- --
--
--
--
straightedge
GA Inertial profiler
HI --
ID California-type profilograph
IL California-type profilograph
IN California-type profilograph
IA California-type profilograph
KS California-type profilograph
KY Inertial profiler
LA California-type profilograph
Rolling 02 km ME dipstick IRI (012
profiler mi)
IRI
PI5-mm
PI5-mm
PI5-mm
PI5-mm
PI00
RI
PI5-mm
16 km(10 mi)
01 km (01 mi)
016 km (01 mi)
016 km (01 mi)
016 km (01 mi)
01 km (01 mi)
16 kma
(10 mi)
Lot
lt= 8 mmkm (lt= 05 inches per mile)b
lt= 48 mmkm (lt= 3 inches per mile) lt= 160 mmkm (lt= 10 inches per mile) RI gt= 405
lt= 945 mmkma
(lt= 60 inches per mile)
lt= 750 gt750 mmkm mmkm (lt= 475 -- (gt475 inches per inches per mile)a mile)a
lt= 8 gt8 mm01km -- mm01km (lt= 05 (gt05 in01mi) in01 mi) 9 - 160 mmkm (06 - 10 inches per mile) lt= 30 mm016 km (lt= 12 in01 mi) 49 - 110 mmkm (31 - 7 inches per mile) 161 - 475 mmkm (101 - 30 inches per mile) 370 lt= RI lt 405
lt= 47 mmkm (lt= 3 inches per mile) 946 - 1105 mmkma
(601 - 70 inches per mile)
161 - 235 mmkm (101 - 15 inches per mile)
31 - 38 mm016 km (121 - 15 in01 mi)
111 - 160 mmkm (71 - 10 inches per mile)
476 - 630 mmkm (301 - 40 inches per mile)c
345 lt= RI lt 370
48 - 95 mmkm (31 - 6 inches per mile)
1106 - 1260 mmkma (701 -80 inches per mile)
gt235 mmkm (gt15 inches per mile)
gt38 mm016 km (gt15 in01 mi)
gt160 mmkm (gt10 inches per mile) gt630 mmkm (gt40 inches per mile)
RI lt 345
gt95 mmkm (gt6 inches per mile)
gt1260 mmkma
(gt80 inches per mile)
23
MD
MA
MI
California-type profilograph
Inertial Profiler
California-type profilograph or GM-type inertial profiler
PI5-mm
016 kma (01 mi)
IRI 02 km (012 mi)a
PI5-
mmRQId
016 kma (01 mi)
lt= 63 mmkma
(lt= 40 inches per mile)
lt= 63 mmkma
(lt= 4 inches per mile)or RQI lt45
64 - 110 mmkma
(41 - 7 inches per mile)
64 - 158 mmkma
(41 - 10 inches per mile) or 45 lt= RQI lt= 53
111 - 190 mmkma (71 - 12 inches per mile)
--
gt191 mmkma
(gt12 inches per mile)
gt158 mmkma
(gt10 inches per mile)or RQI gt 53
MN
MS
MO
MT
California-type profilograph
California-type profilograph
California-type profilograph
--
PI5-mm
PI5-mm
PI00
--
01 km (01 mi)
016 kma (01 mi)
01 km (01 mi)
--
lt= 387 mmkm (lt= 24 inches per mile) lt= 79 mmkma
(lt= 5 inches per mile) lt= 284 mmkm (lt= 18 inches per mile)
--
388 - 789 mmkm (25 - 5 inches per mile) 80 - 110 mmkma
(51 - 7 inches per mile) 285 - 395 mmkm (181 - 25 inches per mile)
--
79 - 1183 mkm (51 - 75 inches per mile)
111 - 158 mkma (71 - 10 inches per mile)
396 - 711 mkm (251 - 45 inches per mile)
--
gt1183 mmkm (gt75 inches per mile) gt158 mmkma
(gt10 inches per mile) gt712 mmkm (gt45 inches per mile)
--
NE
NV
NH
California-type profilograph
California-type profilograph
GM-type
PI5-mm
PI5-mm
RN
02 km (01 mi)
01 km (01 mi)
016
lt= 75 mmkm (lt= 5 inches per mile)
--
76 - 110 mmkm (51 - 7 inches per mile) lt= 80 mmkm (lt= 5 inches per mile)
111 - 155 mmkm (71 - 10 inches per mile)
--
gt155 mmkm (gt10 inches per mile)
gt80 mmkm (gt5 inches per mile)
24
NJ
NM
NC
ND
inertial profiler Rolling straightedge
California-type profilograph
Hearne straightedge
--
--
PI5-mm
CSI
--
kma (01 mi)
01 km (01 mi)
lt= 65 mmkm (lt= 4 inches per mile)
66 - 80 mmkm (41 - 5 inches per mile)
81 - 160 mkm (51 - 10 inches per mile)
gt160 mmkm (gt10 inches per mile)
076 km (047 mi)
CSI=1020 CSI=3040 CSI=1121314150516061
-- -- -- -- --
--
-- -- -- -- --
OH
OK
OR
PA
PR
RI
California-type profilograph
California-type profilograph
California-type profilograph
California-type profilograph
California-type profilograph
--
PI5-mm
PI5-mm
PI5-mm
PI00
PI5-mm
--
016 kma (01 mi)
lt= 63 mmkma
(lt= 4 inches per mile)
016 kma (01 mi)
lt= 79 mmkma
(lt= 5 inches per mile)
016 kma
(01 mi)
lt= 80 mmkma
(lt= 5 inches per mile)
016 kma (01 mi)
lt= 442 mmkma
(lt= 28 inches per mile)
016 kma (01 mi)
lt= 110 mmkma
(lt= 7 inches per mile)
-- --
64 - 110 mmkma
(41 - 7 inches per mile) 80 - 110 mmkma
(51 - 7 inches per mile) 81 - 110 mmkma
(51 - 7 inches per mile) 443 - 536 mmkma
(281 - 34 inches per mile) 111 - 205 mmkma
(71 - 13 inches per mile)
--
111 - 190 mkma (71 - 12 inches per mile)
111 - 190 mkma (71 - 12 inches per mile)
111 - 155 mmkma (71 - 10 inches per mile)
537 - 726 mmkma (341 - 46 inches per mile)
-
--
gt190 mmkma
(gt12 inches per mile) gt190 mmkma
(gt12 inches per mile) gt155 mmkma
(gt10 inches per mile) gt726 mmkma
(gt46 inches per mile) gt205 mmkma
(gt13 inches per mile)
--
SC Maysmeter MRN 16 kma
(10 mi)
lt= 552 mmkma
(lt= 35
553 - 630 mmkma
(351 - 40
631 - 868 mmkma (401 - 55 inches per mile)
gt868 mmkma
(gt55
25
inches per inches per inches per mile) mile) mile)
SD Inertial profiler IRI
016 kma (01 mi)
lt= 868 a mmkm
(lt= 55 inches per mile)
869 - 1105 a mmkm
(551 - 70 inches per mile)
1106 - 1262 mmkma (701 -80 inches per mile)
gt1262 a mmkm
(gt80 inches per mile)
TN Maysmeter MRN16 kma
(10 mi)
lt= 315 mmkm a (lt= 20 inches per mile)
316 - 475 a mmkm
(201 - 30 inches per mile)
476 - 950 mmkma (301 - 60 inches per mile)
gt950 a mmkm
(gt60 inches per mile)
TX California-type profilograph
PI00
016 kma (01 mi)
lt= 237 a mmkm
(lt= 15 inches per mile)
238 - 315 a mmkm
(151 - 20 inches per mile)
316 - 630 mkma (201 - 40 inches per mile)
gt630 a mmkm
(gt40 inches per mile)
UT California-type profilograph
PI5-mm
02 km (012 mi) a
--
lt= 110 mmkm (lt=7 inches per mile) a
--
gt110 mmkm (gt7 inches per mile)a
VT Maysmeter IRI032 kma (02 mi)
lt950 a mmkm
(lt60 inches per mile)
950 - 1090 a mmkm
(60 - 69 inches per mile)
1091 - 1500 mmkma (70 -95 inches per mile)
gt1500 a mmkm
(gt95 inches per mile)
VA South Dakota-type profiler
IRI 016 kma (01 mi)
lt= 868 a mmkm
(lt= 55 inches per mile)
869 - 1105 a mmkm
(551 - 70 inches per mile)
1106 - 1578 kma (701 - 100 inches per mile)
gt1578 a mmkm
(gt100 inches per mile)
WAe Lightweight inertial profiler
IRI 01 km (01 mi)a
lt= 946 a mmkm
(lt= 60 inches per mile)
947 - 1500 a mmkm
(601 - 95 inches per mile)
1501 - 1815 mmkma (951 -115 inches per mile)
gt1815 a mmkm
(gt115 inches per mile)
WV Maysmeter or inertial profiler
MRN016 km (01 mi) --
lt= 1000 mmkm (lt= 65 inches per mile)
1001 - 1500 mmkm (66 - 975 inches per mile)
gt1500 mmkm (gt975 inches per mile)
WI California- PI5-mm 016 -- lt= 158 159 - 237 mkma (101 - 15 gt237
26
type profilograph
kma (01 mi)
mmkma
(lt= 10 inches per mile)
inches per mile) mmkma
(gt15 inches per mile)
WY Inertial profiler IRI
016 kma (01 mi)
Percent Within Limits Specification Upper Spec Limit = 1500 mkm (95 inches per mile) Percent Within Limits Specification Lower Spec Limit = RN = 41 Statistical Based Specification Full Pay approximately equal to 868-1105 mmkm (55-70 inches per mile) a Limits are a direct English-Metric conversion from counterpart limits Actual limits given by the Agency were not available b Based on average profile index for entire project c For PI between 476 mmkm (301 inches per mile) and 630 mmkm (40 inches per mile) must also grind to 475 mmkm (30 inches per mile) or belowd RQI Ride quality index e Draft specification
27
Appendix B-2 State agency smoothness specifications for concrete pavements ndash Table 15 of Publication FHWA-RD-02-057
State
AL
AK
Testing Device
California-type profilograph
--
Index
PI5-mm
--
Testing Interval
016 km (01 mi)
--
Bonus Range
lt45 mmkm (lt3 inches per mile)
--
Full Pay Range
45 -- 94 mmkm (3 -- 59 inches per mile)
--
Penalty Range
95 - 160 mmkm (6 - 10 inches per mile)
--
Correction Range
gt160 mmkm (gt10 inches per mile)
--
AZ
AR
CA
CO
CT
DE
FL
GA
California-type profilograph
California-type profilograph lightweight profiler
California-type profilograph
California-type profilograph
California-type profilograph
CA profilograph or rolling straightedge
California-type profilograph
Rainhart
PI5-mm
PI5-mm
PI5-mm
PI25-
mm
PI5-mm
PI5-mm
PI5-mm
PI25-
016 kma(01 mi)
02 km (01 mi)
01 km (006 mi)a
015 km (0095 mi)
015 km (01 mi)a
016 kma(01 mi)
01 km (01 mi)
04
lt110 mmkma(lt7 inches per mile) lt= 90 mmkm (lt= 6 inches per mile)
lt= 222 mmkma (lt= 14 inches per mile)
lt=160 mmkm (10 inches per mile)a
lt50 mmkma(lt32 inches per mile) lt= 80 mmkm (lt= 5 inches per mile)
--
--
110 -- 142 mmkma(7 -9 inches per mile) 91 - 110 mmkm (61 - 7 inches per mile) lt= 110 mmkm (lt= 7 inches per mile)a
2221 - 252 mmkma
(141 - 16 inches per mile) 161 - 190 mmkm (101 - 12 inches per mile)a
50 - 200 mmkma(32 - 127 inches per mile) 81 - 95 mmkm (51 - 6 inches per mile) lt= 110
--
--
--
2521 - 378 mmkma
(161 - 24 inches per mile) 191 - 315 mmkm (121 - 20 inches per mile)a
96 - 110 mmkm (61 - 7 inches per mile)
--
--
gt142 mmkma(gt9 inches per mile)
gt110 mmkm (gt7 inches per mile)
gt110 mmkm (gt7 inches per mile)a
gt378 mmkma
(gt24 inches per mile)
gt315 mmkm (gt20 inches per mile)a
gt200 mmkma(gt127 inches per mile)
gt110 mmkm (gt7 inches per mile)
gt110
28
profilograph mm kma(025 mmkma(lt= mmkma(gt7mi) 7 inches per inches per
mile) mile)
HI California-type profilograph PI5-mm
016kma(01mi)
--
lt= 157 mmkma(lt= 10 inches per mile)
158 - 236 mmkma(101 - 15 inches per mile)
gt236mmkma(gt15inches permile)
ID California-type profilograph PI5-mm
01 km (01 mi) --
lt= 8 mm01 km (lt= 05 in01mi)
--gt8 mm01 km (gt05in01mi)
IL California-type profilograph PI5-mm
016 km (01 mi)
lt= 67 mmkm (lt= 425 inches per mile) b
68 - 160 mmkm (426 - 10 inches per mile)
161 - 235mmkm (1001 - 15 inches per mile)
gt235 mmkm (gt15 inches per mile)
IN California-type profilograph PI5-mm
016 km (01 mi)
lt= 23mm016 km (lt= 09 in01mi)
23 - 25 mm016km(09 - 10 in01 mi)
--gt25 mm016 km (gt10 in01 mi)
IA California-type profilograph PI5-mm
016 km (01 mi)
lt= 48 mmkm (pound3 inches per mile)
49 - 110 mmkm (31 - 7 inches per mile)
111 - 160 mmkm (71 - 10 inches per mile)
gt160 mmkm (gt10 inches per mile)
KS California-type profilograph PI00
01 km (01 mi)
lt= 285 mmkm (lt= 18 inches per mile)
286 -- 475 mmkm (181 -- 30 inches per mile)
476 -- 630 mmkm (301 -- 40 inches per mile)c
gt630 mmkm (gt40 inches per mile)
KY Rainhart profilograph and inertial profiler
PI25-
mmRI
03 kma(019 mi)
RI gt= 405
lt=125 mmkma (lt= 8 inches per mile)
126 - 190 mmkma(81 - 12 inches per mile)
gt190mmkma(gt12inches permile)
LA California-type profilograph PI5-mm Lot -
pound94 mmkm (lt= 6 inches per mile)
95 - 126mmkm (61 - 8 inches per mile)
gt126 mmkm (gt8 inches per mile)
ME -- -- -- -- -- -- --
MD California-type profilograph PI5-mm
016kma(01mi)
lt= 63 mmkma (lt= 40 inches per mile)
64 - 110 mmkma(41 - 7 inches per mile)
111 - 190 mmkma(71 - 12 inches per mile)
gt191mmkma(gt12inches permile)
MA -- -- -- -- -- -- --MI California-type PI5- 016 lt= 63 64 - 158 -- gt158
29
MN
MS
MO
MT
NE
NV
NH
profilograph or GM-type inertial profiler
California-type profilograph
California-type profilograph
California-type profilograph
California-type profilograph
California-type profilograph
California-type profilograph
--
mmRQI d
kma(01 mi)
PI5-mm 016 km (01 mi)
PI5-mm
016 kma(01 mi)
PI00 01 km (01 mi)
PI5-mm
016 kma(01 mi)
PI5-mm 02 km (01 mi)
PI5-mm 01 km (01 mi)
-- --
mmkma (lt= 4 inches per mile)or RQI lt 45
lt= 63 mmkm (lt= 4 inches per mile)
lt= 284 mmkm (lt= 18 inches per mile) lt= 94 mmkma(pound6 inches per mile) lt= 75 mmkm (lt= 5 inches per mile)
--
--
--
mmkma (41 - 10 inches per mile)or 45 lt=RQI lt= 53
mmkma(gt10 inches per mile)or RQI gt 53
64 - 94 mmkm (41 - 6 inches per mile)
95 - 126 mkm (61 - 8 inches per mile)
gt126 mmkm (gt8 inches per mile)
lt= 110 mmkma(lt= 7 inches per mile)
111 - 190 mkma(71 -12 inches per mile)
gt190 mmkma(gt12 inches per mile)
285 - 395 mmkm (181 - 25 inches per mile)
396 - 711 mkm (251 - 45 inches per mile)
gt712 mmkm (gt45 inches per mile)
95 - 158 mmkma(61 - 10 inches per mile)
159 - 237 mkma (101 - 15 inches per mile)
gt237 mmkma(gt15 inches per mile)
76 - 155 mmkm (51 - 10 inches per mile)
156 - 230 mmkm (101 - 15 inches per mile)
gt230 mmkm (gt15 inches per mile)
lt= 80 mmkm (lt= 5 inches per mile)
gt80 mmkm (gt5 inches per mile)
--
-- -- --NJ
NM
NY
NC
Rolling straightedge
California-type profilograph
California-type profilograph
Rainhart profilograph
--
PI5-mm
PI5-mm
PI5-mm
-- --
01 km (01 mi)
lt= 80 mmkm (lt= 5 inches per mile)
016 km (01 mi)a
lt= 79 mmkma(lt= 5 inches per mile)
018 kma(011 mi)
--
-- --81 - 110 mmkm (51 - 7 inches per mile)
111 - 190 mkm (71 - 12 inches per mile)
80 - 190 mmkma(51 - 12 inches per mile) lt= 63 mmkma(lt= 4 inches per
--
--
--
gt190 mmkm (gt12 inches per mile)
gt190kma(gt12 inches per mile)
gt63 mmkma(gt4 inches per
30
mile) mile)
ND California-type profilograph PI5-mm
016 kma(01 mi)
lt8mm016 kma(lt03 in01mi)
8 - 13 mm016 kma(03 - 05 in01mi)
14 -- 23mm016kma(051 -09 in01mi)
gt23 mm016 kma(gt09in01mi)
OH California-type profilograph PI5-mm
016kma(01mi)
lt= 78 mmkma(lt= 5 inches per mile)
79 - 110 mmkma(51 - 7 inches per mile)
111 - 190 mkma(71 -12 inches per mile)
gt190mmkma(gt12inches permile)
OK California-type profilograph PI5-mm
016kma(01mi)
lt= 79 mmkma(lt= 5 inches per mile)
80 - 110 mmkma(51 - 7 inches per mile)
111 - 190 mkma(71 -12 inches per mile)
gt190mmkma(gt12inches permile)
OR California-type profilograph PI5-mm
02 km (01 mi)a
lt= 80 mmkm (lt= 5 inches per mile)a
81 - 110 mmkm (51 - 7 inches per mile)a
--gt110 mmkm (gt7 inches per mile)a
PA California-type profilograph PI00
016a(01 mi)
lt= 568 mmkma(lt= 36 inches per mile)
-- --
gt568 mmkma(gt36inches per mile)
PR California-type profilograph PI5-mm
016kma(01mi)
lt= 110 mmkma(lt= 7 inches per mile)
111 - 205 mmkma(71 - 13 inches per mile)
--
gt205mmkma(gt13inches permile)
RI -- -- -- -- -- -- --
SC Rainhart profilograph PI5-mm
04kma(025mi)
--
lt= 158 mmkma(lt= 10 inches per mile)
--
gt158mmkma(gt10inches permile)
SD California-type profilograph PI00
01 km (01 mi)
lt= 395 mmkm (lt= 25 inches per mile)
396 - 550 mmkm (251 - 35 inches per mile)
551 - 630 mmkm (351 - 40 inches per mile)
gt630 mmkm (gt40 inches per mile)
TN Rainhartprofilograph PI25-
mm
01 km (01 mi) --
lt= 160 mmkm (lt= 10 inches per mile)
161 - 235 mmkm (101 - 15 inchesper mile)
gt235 mmkm (gt15 inches per mile)
TX California-type profilograph PI00
016kma(01mi)
237 mmkma(lt= 15 inches per mile)
238 - 315 mmkma(151 - 20 inches per mile)
316 -- 630 mkma(201 -40 inches per mile)
gt630mmkma(gt40inches permile)
31
UT California-type profilograph PI5-mm
02 km (012 mi)a
--
lt= 110mmkm (lt= 7 inches permile)a
--gt110 mmkm (gt7 inches per mile) a
VT -- -- -- -- -- -- --
VA South Dakota-type profiler IRI 016 kma
(01 mi)
lt= 946 mmkma (lt= 60 inches per mile)
947 - 1262 a mmkm
(601 - 80 inches per mile)
1263 - 1578 km a(801 - 100 inches per mile)
gt1578 mmkma (gt100 inches per mile)
WA California-type profilograph
PI75-
mm
01 km (01 mi) a
lt= 60 mmkm (lt= 38 inches per mile)a
61 -- 100 mmkm (39 - 63 inches per mile) a
gt100 mmkm (gt63 inches per mile) ae
--
WV Maysmeter or inertial profiler MRN 016 km
(01 mi) --
lt= 1000 mmkm (lt= 65 inches per mile)
1001 - 1500 mmkm (66 - 975 inches per mile)
gt1500 mmkm (gt975 inches per mile)
WI California-type profilograph
PI01-
inch
016 kma
(01 mi)
lt= 400 mmkma (lt= 253 inches per mile)
401 - 700 a mmkm
(254 - 443 inches per mile)
701 - 800 mkma (444 - 507 inches per mile) f
gt800 mmkma
(gt507 inches per mile)
WY California-type profilograph PI5-mm
Perf Related Spec (PCC thickness strength smoothness) gt80 mmkm (gt50 inches per mile) a Limits are a direct English-Metric conversion from counterpart limits Actual limits given by the agency were not available b Based on average profile index for entire project c For PI between 476 mmkm (301 inches per mile) and 630 mmkm (40 inches per mile) must also grind to 475 mmkm (30 inches per mile) or below d RQI Ride quality index e For PI greater than 100 mmkm (63 inches per mile) must also grind to 100 mmkm (63 inches per mile) or lessf For PI greater than 700 mmkm (443 inches per mile) must also grind to 700 mmkm (443 inches per mile) or less
32
Appendix C IRI vs PI and PI to PI (Asphalt to Concrete) Relationships
In FHWA Report FHWA-RD-02-057 ldquoPavement Smoothness Index Relationships Final Reportrdquo equations where developed for converting from PI to IRI based on pavement type and climatic region using the LTPP profile data base Tables C1 C2 C3 and C4 summarize the conversion equations Information on PI to IRI relationships relevant to Missouri are highlighted in the tables and noted in the figure captions
Table C1 PI to IRI equations for Asphaltic Concrete PI to IRI for Asphaltic Concrete
Pavement Type Climatea
Blanking Band (mm)
Correlation Equation (IRI = mmkm PI = mmkm) N SEE R2
AC 1234 0 IRI = 266543PI00 + 21301 14170 2002 089 AC 1234 25 IRI = 297059PI25-mm + 63874 14160 2317 086 AC 1234 5 IRI = 378601PI5-mm + 88751 13775 2923 077
ACAC 1 0 IRI = 274599PI00 + 26542 1854 192 091 ACAC 1 25 IRI = 312622PI25-mm + 70856 1854 230 087 ACAC 1 5 IRI = 425316PI5-mm + 95780 1824 2882 079 ACAC 2 0 IRI = 268169PI00 + 27467 1494 1846 081 ACAC 2 25 IRI = 333564PI25-mm + 65567 1494 2466 066 ACAC 2 5 IRI = 439478PI5-mm + 88320 1345 3082 045 ACAC 34 0 IRI = 242295PI00 + 30190 5126 1788 084 ACAC 34 25 IRI = 268324PI25-mm + 66034 5126 217 076 ACAC 34 5 IRI = 342671PI5-mm + 87680 4906 2659 063
ACPCC 1234 0 IRI = 240300PI00 + 29293 4156 2056 079 ACPCC 1234 25 IRI = 278217PI25-mm + 71687 4156 2297 073 ACPCC 1234 5 IRI = 394665PI5-mm + 93922 4052 2596 065 Source FHWA-RD-02-057a Climatic zones 1=DF 2=DNF 3=WF 4=WNF
DF Dry-FreezeDNF Dry-Nonfreeze WF Wet-Freeze
WNF Wet-Nonfreeze
33
Table C2 PI to IRI for Portland Cement Concrete PI to IRI for Portland Cement Concrete
Pavement Type Climatea Blanking
Band (mm) Correlation Equation (IRI =
mmkm PI = mmkm) N SEE R2
PCC 13 0 IRI = 212173PI00 + 43976 12039 2596 08 PCC 13 25 IRI = 215316PI25-mm + 94705 12039 2787 08
PCC 13 5 IRI = 262558PI5-mm + 120573 11946 306 08
PCC 2 0 IRI = 258454PI00 + 42309 1448 1765 09
PCC 2 25 IRI = 25921PI25-mm + 102473 1448 2265 08
PCC 2 5 IRI = 351673PI5-mm + 122635 1364 2687 07
PCC 4 0 IRI = 23582PI00 + 31719 2888 2365 08
PCC 4 25 IRI = 240731PI25-mm + 88810 2888 2645 08
PCC 4 5 IRI = 287407PI5-mm + 122963 2885 2974 07 Source FHWA-RD-02-057a Climatic zones 1=DF 2=DNF 3=WF 4=WNF
DF Dry-FreezeDNF Dry-Nonfreeze WF Wet-Freeze
WNF Wet-Nonfreeze
34
Table C3 PI to PI for Asphaltic Concrete PI to PI for Asphaltic Concrete
Type Climatea FromTo Correlation Equation (PI = mmkm) N SEE R2
AC 13 PI25-mm to PI00-mm PI00 = 108722PI25-mm + 17442 5744 4773 096
AC 13 PI5-mm to PI00-mm PI00 = 135776PI5-mm + 27548 5684 8358 088
AC 13 PI5-mm to PI25-mm PI25-mm = 128213PI5-mm + 8779 5684 4662 095
AC 24 PI25-mm to PI00-mm PI00 = 112338PI25-mm + 15284 8418 4523 095
AC 24 PI5-mm to PI00-mm PI00 = 146417PI5-mm + 24009 8093 7173 086
AC 24 PI5-mm to PI25-mm PI25-mm = 134055PI5-mm + 7313 8093 3864 095
ACAC 1 PI25-mm to PI00-mm PI00 = 114153PI25-mm + 16070 1856 4341 096
ACAC 1 PI5-mm to PI00-mm PI00 = 156038PI5-mm + 25089 1826 7374 088
ACAC 1 PI5-mm to PI25-mm PI25-mm = 139462PI5-mm + 7555 1826 4047 095
ACAC 2 PI25-mm to PI00-mm PI00 = 128067PI25-mm + 13815 1496 5226 086
ACAC 2 PI5-mm to PI00-mm PI00 = 175837PI5-mm + 22284 1347 7932 066
ACAC 2 PI5-mm to PI25-mm PI25-mm = 152523PI5-mm + 5660 1347 3414 089
ACAC 34 PI25-mm to PI00-mm PI00 = 111926PI25-mm + 14585 5128 4486 093
ACAC 34 PI5-mm to PI00-mm PI00 = 145876PI5-mm + 23359 4908 7153 081
ACAC 34 PI5-mm to PI25-mm PI25-mm = 136739PI5-mm + 7117 4908 3812 093
ACPCC 1234 PI25-mm to PI00-mm PI00 = 115412PI25-mm + 17708 4158 4446 093
ACPCC 1234 PI5-mm to PI00-mm PI00 = 161123PI5-mm + 27111 4054 7107 081
ACPCC 1234 PI5-mm to PI25-mm PI25-mm = 144895PI5-mm + 7683 4054 3699 093 Source FHWA-RD-02-057 a Climatic zones 1=DF 2=DNF 3=WF 4=WNF
DF Dry-Freeze DNF Dry-Nonfreeze WF Wet-Freeze
WNF Wet-Nonfreeze
35
Table C4 PI to PI for Portland Cement Concrete PI to PI for Portland Cement Concrete
Type Climatea FromTo Correlation Equation (PI = mmkm) N SEE R2
PCC 1 PI25-mm to PI00-mm PI00 = 104364PI25-mm + 23813 2237 469 095
PCC 1 PI5-mm to PI00-mm PI00 = 139512PI5-mm + 34308 2182 712 087
PCC 1 PI5-mm to PI25-mm PI25-mm = 136458PI5-mm + 9646 2180 433 095
PCC 2 PI25-mm to PI00-mm PI00 = 102028PI25-mm + 22978 1448 443 094
PCC 2 PI5-mm to PI00-mm PI00 = 136715PI5-mm + 31325 1366 664 086
PCC 2 PI5-mm to PI25-mm PI25-mm = 138376PI5-mm + 7490 1364 398 095
PCC 3 PI25-mm to PI00-mm PI00 = 101255PI25-mm + 23865 9800 500 097
PCC 3 PI5-mm to PI00-mm PI00 = 120723PI5-mm + 36791 9764 867 091
PCC 3 PI5-mm to PI25-mm PI25-mm = 120990PI5-mm + 12395 9764 536 096
PCC 4 PI25-mm to PI00-mm PI00 = 101320PI25-mm + 24481 2888 569 094
PCC 4 PI5-mm to PI00-mm PI00 = 119909PI5-mm + 39049 2885 852 085
PCC 4 PI5-mm to PI25-mm PI25-mm = 1212677PI5-mm + 13843 2885 430 096
36
Source FHWA-RD-02-057 a Climatic zones 1=DF 2=DNF 3=WF 4=WNF
DF Dry-Freeze DNF Dry-Nonfreeze WF Wet-Freeze
WNF Wet-Nonfreeze
The figures on the following pages present the previous four tables or equations as a series of graphs
The PI to PI charts are for informational purposes only to indicate how the index varies with the different blanking bands applied PI indices are difficult to compare from state to state as different blanking bands give different results IRIs derived from inertial profilers are more comparable from state to state and thus are more useful in research studies The AASHTO specifications listed in the Conclusion section were establish to make the IRI a consistent measurement
PI to IRI Asphaltic Concrete All Climates by Blanking Band(inch) (Source FHWA-RD-02-057)
300
0 10 20 30 40 50PI (inmi)
PI(BB=00 in) PI(BB=01 in) PI(BB=02 in)
250
200
150
100
50
0
IRI (
inm
i)
Figure C1 PI to IRI for concrete all climates and blanking bands (Green line lower one] applicable to Missouri)
PI to IRI Asphaltic ConcreteAsphaltic Concrete by Climate and Blanking Band(inch)1=Dry-Freeze 2=Dry-Nonfreeze 3=Wet-Freeze 4=Wet-Nonfreeze
(Source FHWA-RD-02-057)300
PI(BB=00 in) 1 PI(BB=01 in) 1 PI(BB=02 in) 1 PI(BB=00 in) 2 PI(BB=01 in) 2 PI(BB=02 in) 2 PI(BB=00 in) 34 PI(BB=01 in) 34 PI(BB=02 in) 34
250
200
150
100
50
0
IRI (
inm
i)
000 1000 2000 3000 4000 5000
PI (inmi)
6000
60
Figure C2 PI to IRI Asphaltic ConcreteAsphaltic Concrete all climates all blanking bands (Thick solid green line [lowest one] applicable to Missouri)
37
PI to IRI Asphaltic ConcretePortland Cement Concrete All Climates by Blanking Band(inch)
300
250
200
150
100
50
0
PI(BB=00 in)
PI(BB=01 in)
PI(BB=02 in)
IRI (
inm
i)
000 1000 2000 3000 4000 5000 6000 PI (inmi)
Figure C3 PI to IRI Asphaltic ConcretePortland Cement Concrete all climates all blanking bands (Green line [lowest one] applicable to Missouri)
PI to IRI Asphaltic ConcreteAsphaltic Concrete by Climate and Blanking Band(inch)1=Dry-Freeze 2=Dry-Nonfreeze 3=Wet-Freeze 4=Wet-Nonfreeze
(Source FHWA-RD-02-057)400
IRI (
inm
i)
350
300
250
200
150
100
50
0
PI(BB=00 in) 13 PI(BB=01 in) 13 PI(BB=02 in) 13 PI(BB=00 in) 2 PI(BB=01 in) 2 PI(BB=02 in) 2 PI(BB=00 in) 4 PI(BB=01 in) 4 PI(BB=02 in) 4
0 10 20 30 40 50
PI (inmi)
6
Figure C4 PI to IRI for Portland Cement Concrete all climates all blanking bands (Thin solid green line [lowest one] applicable to Missouri)
0
38
PI to PI Asphaltic Concrete by Climate and Blanking Band(in) 1=Dry-Freeze 2=Dry-Nonfreeze 3=Wet-Freeze 4=Wet-Nonfreeze
(Source FHWA-RD-02-057)
0
20
40
60
80
100
120 PI
(in
mi)
PI01in to PI0in 13 PI02in to PI0in 13 PI02in to PI01in 13 PI01in to PI0in 24 PI02in to PI0in 24 PI02in to PI01in 24
00 100 200 300 400 500 600
PI (inmi)
Figure C5 PI to PI for Asphaltic Concrete
PI to PI Asphaltic ConcreteAsphaltic Concrete by Climate and Blanking Band(in)1=Dry-Freeze 2=Dry-Nonfreeze 3=Wet-Freeze 4=Wet-Nonfreeze
(Source FHWA-RD-02-057)
70 0
20
40
60
80
100
120
PI (i
nm
i)
PI01in to PI0in 1 PI02in to PI0in 1 PI02in to PI01in 1 PI01in to PI0in 2 PI02in to PI0in 2 PI02in to PI0in 2 PI02in to PI0in 34 PI02in to PI0in 34 PI02in to PI01 34
0 10 20 30 40 50 60
PI (inmi)
Figure C6 PI to PI for Asphaltic Concrete Asphaltic Concrete all climates all blanking bands
39
PI to PI Asphaltic ConcretePortland Cement ConcreteAll Climates by Blanking Band(in)
(Source FHWA-RD-02-057)
0
20
40
60
80
100
120
140
160
180
200
PI (i
nm
i)
PI01in to PI0in PI02in to PI0in PI02in to PI01in
0 10 20 30 40 50 60 70 80 90
PI (inmi)
100
70
PI (inmi)
Figure C7 PI to PI forAsphaltic Concrete Portland Cement Concrete all climates all blanking bands
PI to PI Portland Cement Concrete by Climate and Blanking Band(in) 1=Dry-Freeze 2=Dry-Nonfreeze 3=Wet-Freeze 4=Wet-Nonfreeze
(Source FHWA-RD-02-057) 120
PI (i
nm
i)
100
80
60
40
20
0
PI01in to PI0in 1 PI02in to PI0 1 PI02in to PI01in 1 PI02in to PI0in 2 PI02in to PI0in 2 PI02in to PI01in 2 PI01in to PI0in 3 PI02in to PI0in 3 PI02in to PI01in 3 PI01in to PI0in 4 PI02in to PI001n 4 PI02in to PI01in 4
0 10 20 30 40 50 60
Figure C8 PI to PI Portland Cement Concrete all climates all blanking bands
40
Appendix D Pavement Smoothness Pay Factor IncentiveDisincentive Specifications
In FHWA Report FHWA-RD-02-057 ldquoPavement Smoothness Index Relationships Final Reportrdquo two tables present a summary of Smoothness indices and IncentiveDisincentive threshold limits for Asphaltic and Portland Cement Concrete All figures and tables in this appendix are based on information taken from this FHWA report except for updates made for the states of Connecticut Ohio and Minnesota which specifications are presented in Appendices E F and G
Figure D1 presents the specification types and distribution for the states that provided information for the FHWA report
There are six specification models depending on the presence or absence of bonus pay penalties and corrective action The full specification with both bonus pay and penalties included is the most common specification for both Asphaltic concrete and Portland Cement concrete pavements
For the No Bonus and No Penalty specifications two sets of frequencies and percentages are provided For the No Bonus specification the upper numbers are for No Bonus pay (with penalties) occurrences The lower number is the combined No Bonus pay (with penalties) and the No Bonus pay (with no penalties) For the No Penalty specification the upper numbers are for No Penalties (with bonus pay) occurrences The lower number is the combined No Penalty (with bonus pay) and the No Penalty (with no bonus pay)
Figures D2 and D3 present the pavement smoothness indices and incentivedisincentive specification break down by state for Asphaltic and Portland Cement concrete for the information provided by the states for the FHWA report Summary statistics are also provided
The series of figures D4 through D10 show the state by state specifications and thresholds for the payment ranges for Asphaltic and Portland Cement concrete by smoothness index used by the individual states These figures include the updates made for the states of Connecticut Ohio and Minnesota For asphaltic pavements these three states use the IRI index and the full incentivedisincentive specification For Minnesota the IRI information is not shown in Figure D2 for Asphaltic concrete as Minnesota has three sets of specification (equations) depending on pavement design A separate figure D11 is provided later to show the three specification equations For concrete pavements only the updated Connecticut data applies
41
FullSpecification
NoPenalty (NP)
NoBonus (NB)
No Penaltyor Bonus
BonusOnly
NoCorrective (NC)
0 no B
0 no B
Thresholds Distribution Con- Asphalt Con-
Asphalt crete crete 0 Bonus BF Full Pay FP Penalty PC Corrective Action 28 24 737 545
0 Bonus BF F no P C Corrective Action 4 9 105 205 9 15 237 341
FP Penalty PC Corrective Action 1 3 26 68 6 9 158 205
Fno PC Corrective Action 5 6 132 136
0 Bonus B no F no P C Corrective Action 0 1 00 23
0 Bonus BF Full Pay FP Penalty P no C 0 1 00 23
Full Pay
Full Pay
Full Pay
Italic Underline all NP and all NB IRI or PI
B = Bonus Threshold F = Full Pay Threshold P = Penalty Threshold C = Corrective Threshold
Pay Factor Specification Types and Distribution
Figure D1 Pay Factor IncentiveDisincentive Specifications types and distribution
42
Asphalt PavementSmoothness Index by
Specification and StateIndex Spec State
IRI FS CT IRI FS ME IRI FS OH IRI FS SD IRI FS VA IRI FS VT IRI FS WA IRI NB NP GA
MRN FS AZ MRN FS SC MRN FS TN MRN NP WV
PI0mm FS KS PI0mm FS MO PI0mm FS PA PI0mm FS TX
PI25mm FS CA PI5mm FS AL PI5mm FS AR PI5mm FS IA PI5mm FS IL PI5mm FS MD PI5mm FS MN PI5mm FS MS PI5mm FS NE PI5mm FS NM PI5mm FS OH PI5mm FS OK PI5mm FS OR PI5mm NB WI PI5mm NB NP CA PI5mm NB NP ID PI5mm NB NP NV PI5mm NB NP UT PI5mm NP IN PI5mm NP LA PI5mm NP PR
RI FS KY
Asphalt PavementSpecification DistributionSpec Spec Spec
FS 28 737 NB 1 26
NB NP 5 132 NP 4 105
NB 6 158 NP 9 237
Asphalt PavementIndex Distribution
Index Index Index IRI 8 211
MRN 4 105 PI0mm 4 105
PI25mm 1 26 PI5mm 20 526
RI 1 26
Notes FS = Full Specification NB= No Bonus NB NP = No Bonus or Penalty NP = No Penealty
Figure D2 Asphalt pavement smoothness index and specification breakdown by state
43
Concrete PavementSmoothness Index by
Specification and StateIndex Spec State
IRI FS OH IRI FS VA
MRN NP WV PI0mm BO PA PI0mm FS KS PI0mm FS MO PI0mm FS SD PI0mm FS TX
PI25mm FS CO PI25mm FS KY PI25mm FS WI PI25mm NB TN PI25mm NB NP GA PI5mm FS AL PI5mm FS CT PI5mm FS FL PI5mm FS IA PI5mm FS IL PI5mm FS LA PI5mm FS MD PI5mm FS MN PI5mm FS MT PI5mm FS ND PI5mm FS NE PI5mm FS NM PI5mm FS OH PI5mm FS OK PI5mm FS UT PI5mm NB HI PI5mm NB MS PI5mm NB NP CA PI5mm NB NP ID PI5mm NB NP NC PI5mm NB NP NV PI5mm NB NP SC PI5mm NP AR PI5mm NP AZ PI5mm NP DE PI5mm NP IN PI5mm NP MI PI5mm NP NY PI5mm NP OR PI5mm NP PR
PI75mm NC WA
Concrete PavementSpecification DistributionSpec Spec Spec
FS 24 632 BO 1 26 NB 3 79
NB NP 6 158 NP 9 237 NC 1 26
All NB 9 237 All NP 15 395 States 44
Concrete PavementIndex Distribution
Index Index Index IRI 2 44
MRN 1 22 PI0mm 5 111
PI25mm 5 111 PI5mm 30 667
RI 1 22 States 44
Notes FS = Full Specification BO = Bonus Only NB= No Bonus NB NP = No Bonus or Penalty NP = No Penealty NC = No Corrective
Figure D3 Concrete pavement smoothness index and specification breakdown by state
44
Asphalt Pavements Bonus Pay Full Pay Penalty Corrective IRI Limits (inmile) (Source FHWA-RD-02-057 exception Ohio proposal notes)
140
120
100
80
60
40
20
0 CT OH GA ME SD VA VT WA
Penalty Full Pay Bonus
IRI (
inm
i)
Figure D4 Asphalt pavement bonus pay full pay penalty corrective IRI limits by state
Asphalt Pavements Bonus Pay Full Pay Penalty Corrective PI(02 in) Limits (inmi)(Source FHWA-RD-02-057)
16
PI(0
2 in
) (in
mi)
14
12
10
8
6
4
2
0 AL AR CA IA ID IL IN LA MD MN MS NE NM NV OH OK OR PR UT WI
Penalty Full Pay Bonus
Figure D5 Asphalt pavement bonus pay full pay penalty corrective PI(02 in) limits by state
46
Asphalt Pavements Bonus Pay Full Pay Penalty Corrective PI(00 in) Limits (inmi) (Source FHWA-RD-02-057)
0
5
10
15
20
25
30
35
40
45
50 PI
(00
in) (
inm
i)
Penalty Full Pay Bonus
KS MO PA TX
Figure D6 Asphalt pavement bonus pay full pay penalty corrective PI(01 in) limits by state
Concrete Pavement Bonus Pay Full Pay Penalty Corrective IRI Limits (inmi) (VA Source FHWA-RD-02-057 OH Source proposal notes )
0
20
40
60
80
100
120
IRI (
inm
i)
Penalty Full Pay Bonus
VA OH
Figure D7 Concrete pavement bonus pay full pay penalty corrective IRI limits by state
47
Concrete Pavements Bonus Pay Full Pay Penalty Corrective PI(0in) Limits (inmi) (Source FHWA-RD-02-057)
0
5
10
15
20
25
30
35
40
45
50
PI(0
in) (
inm
i)
Penalty Full Pay Bonus
KS MO PA SD TX
Figure D8 Concrete pavement bonus pay full pay penalty corrective PI(0 in) limits by state
Concrete Pavements Bonus Pay Full Pay Penalty Corrective PI(01in) Limits (inmi)
(Source FHWA-RD-02-057)
0
10
20
30
40
50
60
PI(0
1in
) (in
mi)
Penalty Full Pay Bonus
CO GA KY TN WI
Figure D9 Concrete pavement bonus pay full pay penalty corrective PI(01 in) limits by state
48
Concrete Pavements Bonus Pay Full Pay Penalty Corrective PI(02in) Limits (inmi) (Source FHWA-RD-02-057)
PI(0
02i
n) (i
nm
i)
25 Penalty Full Pay Bonus
20
15
10
5
0 AL AR AZ CA CT DE FL HI IA ID IL IN LA MD MI MN MS MT NC ND NE NM NV NY OH OK OR PR SC UT
Figure D10 Concrete pavement bonus pay full pay penalty corrective PI(02 in) limits by state
MNDOT Asphalt Pavement IncentiveDisincentive $01mi (Source 23602350 Combined Specification Dec 2005)
600
400
200
0
$ 0
1 m
i
-200
-400
-600
-800
-1000
0 10 20 30 40 50 60 70 80 90 100
IRI (inmi)
IncentiveDisincentive $01mile Eq A IncentiveDisincentive $01mile Eq B IncentiveDisincentive $01mile Eq C
Figure D11 Minnesota DOT asphalt pavement incentivedisincentive equations
49
Appendix E Example Specifications from Connecticut DOT
Connecticut DOT Special Provision for Pavement Smoothness
SECTION 406 - BITUMINOUS CONCRETE
Article 40603 - Construction Methods Subarticle 10 - Surface Test of Pavement is amended as follows After the last paragraph of the Subarticle add the following
(a) Pavement Smoothness (Rideability) The Engineer shall evaluate the final pavement surface for smoothness by testing in accordance with Section 406 and as stated herein This provision will apply to projects requiring a minimum of two (2) courses of Hot Mix Asphalt (HMA) in which the compacted depth of each is 15 inches (40 mm) or greater
Prior to the placement of the final course of pavement the Engineer will furnish the Contractor with an International Roughness Index (IRI) value that results from the Engineers evaluation of the material placed to date The actual time of this trial evaluation will be coordinated between the Engineer and the Contractor This evaluation will be limited to one (1) test in each direction of travel The IRI value will serve as a guide to the Contractor in evaluating his current level of conformance with the smoothness specification
The IRI value for the final course of pavement will be the basis for determining any payment adjustment(s) in accordance with Table 1 Schedule of Adjusted Payment of Section 40604 - Method of Measurement Subarticle 40604 - 7 Adjustment for Rideability
Evaluation Method - The final pavement surface shall be evaluated for smoothness using an Automated Road Analyzer vehicle or ARAN Computers aboard the ARAN contain software that simulates the traversing of a so-called quarter car over the adjusted profile and calculates an average IRI value as defined by the World Bank for each lane of travel over the project This ARAN is a Class II device as defined by the World Bank The IRI represents the vertical (upward and downward) displacement that a passenger would experience traveling at 48 MPH (77 kmhr) in a standard vehicle over the profile established by the device A zero IRI value would indicate a perfectly smooth pavement surface while increasing IRI values would correspond to an increasingly rough pavement surface The ARAN has the capability to measure longitudinal profile in each wheelpath simultaneously IRI values shall be calculated in inches (meters) of vertical displacement every 001 mile (16 meters) and normalized over one (1) mile in inchesmile or 16 km in mkm For example a 001-mile section yielding an actual vertical displacement of one (1) inch would be normalized to an IRI value of 100 inchesmile
The final pavement surface will be divided into 010 mile (160 meter) segments representing the total lane miles of the project The total lane miles are equal to the miles of resurfacing multiplied by the number of lanes being evaluated The final segment will include any remaining portion of a segment not equaling 010 miles (160 meters) [Example 152 miles of pavement would have 15 segments with the last one measuring 012 miles] The IRI calculated from each wheelpath for each 010 mile (160 meter) segment will be averaged to determine the IRI value for that segment
50
GENERALThe evaluation shall be subject to the following
l Only mainline travel lanes will be evaluated This shall include climbing lanes operational lanes and turning roadways that are 04 miles (644 meters) or greater in length
2 Smoothness data will not be computed for the following project sections
bull
bull bull bull
Climbing and operational lanes and turning roadways less than 04 miles (644 meters) in length
Acceleration and deceleration lanes Shoulders and gore areas Pavement on horizontal curves which have a 900 foot (27432 meters) or less
centerline radius of curvature and pavement within the superelevation transition of these curves
3 Bridge decks shall be included only if paved as part of the project If the bridge decks are not included in the project profile testing will be suspended two hundredths of a mile (002) [32 meters] prior to the first expansion joint and after the last expansion joint on the bridge decks
4 Ramps are specifically excluded from the requirements of this Section
5 Measurement will start two-hundredths of a mile (002) [32 meters] prior to and after the transverse joints at the project limits
6 Data will be collected within 30 days of completion of the entire final course of pavement or within 30 days of completion of any corrective work on the pavement If the entire final course of pavement can not be completed prior to December I (winter shutdown) then data will be collected for any portion of the roadway in which the final course of pavement has been placed These data will be saved and stored by the Department Once the remainder of the final course has been placed the data will be collected and combined with the data taken previously
If the Engineer determines that any pavement corrective work is required the Contractor will be notified in writing within five (5) working days after the completion of the final course of pavement The Contractor shall have thirty (30) days following such notification to make any repairs to the pavement before smoothness measurements are taken
7 No testing shall be conducted during rain or under other conditions deemed inclement by the Engineer During testing the roadway must be free of moisture and other deleterious materials which might affect the evaluation Any work associated with preparing the roadway for the evaluation such as but not limited to sweeping will not be measured for payment
51
GENERAL Article 40604 - Method of Measurernent
Add the following Subarticle
7 Adjustment for Rideability Payment to the Contractor shall be based on the IRI according to the following table The percent adjustment will be applied to payment(s) for the total quantity of HMA surface course excluding ramps complete-in-place and shall conform to the requirements of Section 406 and this provision
TABLE 1 SCHEDULE FOR PAYMENT IRI (inches per mile) IRI (meters per kilometer) PERCENT ADJUSTMENT
lt50 lt079 +10 51 ndash 60 0 80-0 95 +05 61 ndash 80 0 96- 1 26 0 81-100 1 27-1 58 -OS
101-110 1 59-1 74 - 10 111 ndash 120 1 75 - 1 89 - 25
gt 120 gt 1 89 - 50 NOTE All values in the English system will be rounded to the nearest whole number (Example 755 shall be rounded to 76)
All values in the metric system will be rounded to the nearest hundredth (Example 0826 shall be rounded to 083)
Article 40605 - Basis of Payment is amended as follows
Add the following at the end of the first sentence
except as noted herein An adjustment in payment shall apply to the quantity of HMA for the surface course excluding ramps furnished and placed in accordance with Section 406
Positive adjustments for rideability shall not be made for those areas reviewed and determined by the Engineer to be defective as stipulated in Subarticles 10511 and 10604 GENERAL
52
Appendix F Example Specifications from Ohio DOT
53
54
55
56
Appendix G Example Specification from Minnesota DOT
C Pavement Smoothness Specification ndash IRI (International Roughness Index)
C1 General
Pavement smoothness will be evaluated on the final mainline pavement surface using an Inertial Profiler (IP) and the International Roughness Index (IRI) Unless otherwise authorized by the Engineer all smoothness testing shall be performed in the presence of the Engineer The Engineer and the Contractor shall mutually agree upon scheduling of smoothness testing so that testing can be observed Any testing performed without the Engineerrsquos presence unless otherwise authorized may be ordered retested at the Contractorrsquos expenseThe following Table 23607-A (IRI) shows pavement surfaces that are excluded from smoothness testing but subject to 23607B surface requirements
Table 23607 ndash A (IRI) Testing Exclusions 50 feet either side of obstructions such as manholes water supply castings etc
Ramps Loops Climbing lanes Side Streets Side Connections
Turn Lanes Storage Lanes Crossovers Bypass Lanes Shoulders
Intersections constructed under traffic ndash Begin and end the exclusion 305m [100 feet] from the intersection radius Sections less than 1524m [50 ft] in length
Acceleration Deceleration Lanes Projects less than 300m [1000 feet] in length
Mainline paving where the normally posted regulatory speed is less than or equal to 70 kmhr [45 miles per hour] Begin the exclusion at the sign
Single lift overlays over concrete Mainline shall be included in profiling if obstructions are located in auxiliary or parking lanes
C1A Smoothness Requirements
Pavement smoothness requirements will be evaluated by the International Roughness Index (IRI) Equation A Equation B or Equation C The pavement smoothness Equation will be identified in the Special Provisions of the proposal Location of bumps andor dips and magnitude will be based on California Test Method 526
C2 Measurement
Smoothness will be measured with an IP which produces both an IRI value and a profilogram (profile trace of the surface tested) The IP shall conform to the Class 1 requirements of ASTM E950-94 and must be certified according to the most recent procedure on file in the Bituminous Office For pavement evaluation one pass will be made in each lane 274 m [9 feet] from centerline The IP shall be run in the direction the traffic will be moving Each lane will be tested and evaluated separately The Engineer will determine the length in kilometers [miles] for each mainline traffic lane The IP shall be operated at the optimum speed as defined by the manufacturer
C3 Smoothness testing
The Contractor shall furnish a properly calibrated documented and MnDOT certified IP The IP shall be equipped with automatic data reduction capabilities Computer programs used to calculate the IRI statistic from a longitudinal roadway profile shall follow the procedure developed by the World Bank for a quarter-car simulation as described in NCHRP report 228 MnDOT certification documentation shall be provided to the Engineer on the first day the IP is used on the project IP settings are on file in the Bituminous Office The Contractor shall furnish a competent operator trained in the operation of the IP and evaluation of both California Test Method 526 and the International Roughness Index
57
The Contractor shall remove all objects and foreign material on the pavement surface prior to surface evaluation by power brooming The pavement surface will be divided into sections which represent continuous placement A section will terminate 1524m [50 ft] before a bridge approach panel bridge surface manhole or similar interruption In the final pavement evaluation a days work joint will be included in the trace with no special consideration A section will be separated into segments of 01 km [01 mi] A segment will be in one traffic lane only
An IRI value shall be computed for each segment of 1524m [50 ft] or more The IRI value will include the 1524 m [50 ft] at the ends of the section only when the Contractor is responsible for the adjoining surface End of run areas not included in the IRI value and any sections of pavement less than 1524m [50 ft] in length shall be checked longitudinally with a 3028 m [10 ft] straight edge and the surface shall not deviate from a straight line by more than 6 mm in 3028 m [14 inch in 10 ft] Transverse joints shall be evaluated by centering the straightedge longitudinally across the transverse joint The Contractor shall submit the graphical trace a summary of the bump(s)dip(s) locations the magnitude of the bump(s)dip(s) and each segment IRI value on the same day as the profiling was conducted The Contractor shall submit a final spreadsheet summary of the smoothness data to the Engineer within five calendar days after all mainline pavement placement The summary shall be signed by the Contractor The spreadsheet summary shall be in tabular form with each 01 km [01 mile] segment occupying a row Each row shall include the beginning and ending station for the segment the length of the segment the final IRI value for the segment the IRI based incentivedisincentive in dollars for the segment and the deductions for bump(s)dip(s) in dollars for the segment Each continuous run will occupy a separate table and each table will have a header that includes the following the project number the roadway number or designation a lane designation the mix type of the final lift the PG binder of the final lift the date of the final smoothness runs and the beginning and ending station of the continuous run The following information shall be included at the bottom of each summary a subtotal for the IRI based incentivedisincentive a subtotal for the bump deductions and a total for incentivedisincentive for both IRI values and bumps Software to summarize the data is available from the MnDOT Bituminous Office at wwwmrrdotstatemnuspavementbituminousbituminousasp The Contractor will be responsible for all traffic control associated with the smoothness testing and any corrective action (when applicable) that is required of the final pavement surface
C3A Retesting
The Engineer may require any portion or the total project to be retested if the results are questioned This includes both IRI values and bumpdip locations The Engineer will decide whether MnDOT an independent testing firm (ITF) or the Contractor will retest the roadway surface If the retested IRI values differ by more than 10 from the original IRI values the retested values will be used as the basis for acceptance and any incentivedisincentive payments In addition bumpdip locations as shown by the retest will replace the original results If the Engineer directs the Contractor or an independent testing firm to perform retesting and the original results are found to be accurate the Department will pay the Contractor or the independent testing firm $6214 per lane km [$100 per lane mile] that is retested with a minimum charge of $50000 The Contractor will be responsible for any costs associated with retesting if the original values differ by more than 10 from the retested values
C4 IRI Values
The IP shall be equipped with automatic data reduction capabilities for determining the IRI values An IRI value shall be calculated for each segment of the final pavement surface The IRI values shall be determined by following NCHRP report 228 The IRI values shall be reported in units of m per km [inches per mile] Both m per km and inches per mile shall be reported with two digits right of the decimal Follow MnDOT rounding procedures per the Bituminous Manual section 5-693730 When there is a segment equal to or less than 762 m [250 ft] in length at the end of a lane of
58
paving the IRI value for that segment shall be mathematically weighted and added to and included in the evaluation of the adjacent segment Segments greater than 762 m [250 ft] in length will be evaluated individually
C4a Bumps and Dips ndash IRI Equation A and IRI Equation B
Bumpdip location will be determined in accordance with California Method 526 Bumps and dips equal to or exceeding 102 mm in a 762 m [04 inch in a 25 ft] span shall be identified separately When the profile trace shows a successive uninterrupted bump dip or dip bump combination (up to a maximum of 3 alternating trace deviations that relate to one bump or dip on the roadway) identify and evaluate these occurrences as one event The Contractor shall correct by diamond grinding all areas represented by bumps or dips of 102 mm [04 inch] or more as measured by California Test Method 526 However the Engineer may allow bumps or dips of 102 mm to 152 mm [04 inches to 06 inches] in a 762 m [25 foot] span to be left uncorrected and in such case the contractor will be assessed a price deduct as specified in section C6 (ldquoPaymentrdquo) of this special provision Corrected dips or bumps will be considered satisfactory when the profilogram shows the deviations are less than 102 mm in a 762 m [04 inch in a 25 foot] span
C4b Bumps and Dips ndash IRI Equation C
Bumpdip location will be determined in accordance with California Method 526 Bumps and dips equal to or exceeding 127 mm in a 762 m [05 inch in a 25 ft] span shall be identified separately When the profile trace shows a successive uninterrupted bump dip or dip bump combination (up to a maximum of 3 alternating trace deviations that relate to one bump or dip on the roadway) identify and evaluate these occurrences as one event The Contractor shall correct by diamond grinding all areas represented by bumps or dips of 127 mm [05 inch] or more as measured by California Test Method 526 However the Engineer may allow bumps or dips of 127 mm to 178 mm [05 inches to 07 inches] in a 762 m [25 foot] span to be left uncorrected and in such case the contractor will be assessed a price deduct as specified in section C6 (ldquoPaymentrdquo) of this special provision Corrected dips or bumps will be considered satisfactory when the profilogram shows the deviations are less than 127 mm in a 762 m [05 inch in a 25 foot] span
C5 Surface Correction
Unless otherwise approved by the Engineer corrective work shall be by diamond grinding Other methods may include overlaying the area or replacing the area by milling and inlaying The Engineer shall approve of the Contractorrsquos method of correcting segment(s) prior to the Contractor starting corrective work Any corrective actions by milling and inlay or overlay shall meet the specifications for ride quality over the entire length of the correction including the first and last 15 m [50 feet] Bumps or dips in excess of 102 mm [04 inches] where evaluation is by Equation A or B or bumps or dips in excess of 127 mm [05 inch] where evaluation is by Equation C that are located at transverse joints at areas of corrective actions utilizing overlay or milling and inlay shall be removed by diamond grinding The Contractor shall notify the Engineer prior to commencement of the corrective action If the surface is corrected by overlay inlay or replacement the surface correction shall begin and end with a transverse saw cut Surface corrections shall be made prior to placing permanent pavement markings In the event that permanent pavement marking are damaged or destroyed during surface correction activities they will be replaced at no cost to the Agency When pavement smoothness evaluation by Equation A is specified the Engineer may require that the Contractor at no expense to the Department correct segments with an IRI greater than 103 m per km [65 inchesmile] or the Engineer may assess a $560 per 01 km [$900 per 01 mile] penalty in lieu of requiring corrective work When pavement smoothness evaluation by Equation B is specified the Engineer may require that
59
the Contractor at no expense to the Department correct segments with an IRI greater than 118 m per km [75 inchesmile] or the Engineer may assess a $420 per 01 km [$675 per 01 mile] penalty in lieu of requiring corrective work When pavement smoothness evaluation by Equation C is specified the Engineer may require that the Contractor at no expense to the Department correct segments with an IRI greater than 134 m per km [85 inchesmile] or the Engineer may assess a $280 per 01 km [$280 per 01 mile] penalty in lieu of requiring corrective work Bump dip and smoothness correction work shall be for the entire traffic lane width Pavement cross slope shall be maintained through corrective areas All corrective work shall be subject to the approval of the Engineer After all required corrective work is completed a final segment(s) IRI value and bumpdip tabulation shall be determined and submitted to the Engineer Corrective work and re-evaluation shall be at the Contractorrsquos expense Segments requiring grinding will be re-profiled within two working days of completion of grinding Individual bumpsdips and segments requiring grinding shall be completed with 15 working days of notification
C6 Payment
The cost of traffic control for certified smoothness testing andor any corrective work is incidental to the cost of the Wear course mixture The Contractor may receive an incentive payment or be assessed a penalty based on the number of segments and the IRI value The total ride incentive shall not exceed 10 of the total mix price for pavement smoothness evaluated under IRI Equation A 5 of the total mix price for pavement smoothness evaluated under Equation B or 5 of the total mix price for pavement smoothness evaluated under Equation C Total mix shall be defined as all mixture placed on the project Pay adjustments for incentives will only be based on the segment IRI value before any corrective work has been performed Any segment that contains corrective action for IRI value or bumps is not eligible for incentive pay The Contractor will not receive a net incentive payment for ride if more than 25 of all density lots for the project fail to meet minimum density requirements For pavement smoothness evaluated under Equation A uncorrected bumps or dips greater than or equal to 102 mm [04 inches] in a 762 m [25 foot] span will be assessed a price deduction of $900 per event For pavement smoothness evaluated under Equation B uncorrected bumps or dips greater than or equal to 102 mm [04 inches] in a 762 m [25 foot] span will be assessed a price deduction of $675 per event For pavement smoothness evaluated under Equation C uncorrected deviations (bumps or dips) greater than or equal to 127 mm [05 inches] in a 762 m [25 foot] span will be assessed a price deduction of $450 per event Combinations of bumps and dips which arise from the same single bump or dip are considered to be one event and shall be counted only once for the purposes of calculating price deductions Typically bump-dipbump combinations or dip-bump-dip combinations that are confined to a 30 feet longitudinal segment are considered to be one event Bumps or dips resulting from a construction joint will be assessed a $900 penalty regardless of the IRI Equation used for evaluation or pavement smoothness Incentivedisincentive payments will be based on the IRI determined for each segment and will be based on the following equations and criteria
C6a IRI Equation A
IRI mkm [inchesmile] IncentiveDisincentive $01km [$01mile] lt 047 mkm [lt 30 inchesmile] $249 [$400] 047 mkm to 103 mkm [30 inchesmile to 65 inchesmile] $523 ndash (IRI x 584) [$850 ndash (IRI x 15)] 103 mkm [gt 65 inchesmile] -$560 [-$900] Typically 3-lift minimum construction
60
C6b IRI Equation B
IRI mkm [inchesmile] IncentiveDisincentive $01km [$01mile] lt 052 mkm [lt 33 inchesmile] $168 [$270] 052 mkm to 118 mkm [33 inchesmile to 75 inchesmile] $373 ndash (IRI x 395) [$600 ndash (IRI x 10)] 118 mkm [gt 75 inchesmile] -$420 [-$675] Typically 2-lift construction
C6c IRI Equation C
IRI mkm [inchesmile] IncentiveDisincentive $01km [$01mile] lt 057 mkm [lt 36 inchesmile] $112 [$180] 057 mkm to 134 mkm [36 inchesmile to 85 inchesmile] $258 ndash (IRI x 257) [$414 ndash (IRI x 65)] 134 mkm [gt 85 inchesmile] -$280 [-$450] Typically single lift construction
The current bituminous specification 2360 Combined 23602350 (GyratoryMarshall Design) requires pavement smoothness be measured by IRI (International Roughness Index) However the specification does not contain guidance for selecting the appropriate IRI equationrdquo for pavement smoothness evaluation Therefore the following guideline should be used to determine which equation is appropriate Also included in this memo are guidelines for selecting Percent Ride Improvement on 1-lift overlays The designer should use their judgement or consult the Bituminous Office for other construction types not covered in this memo For the following construction types use IRI Equation A bull New construction with a minimum of 3 lifts bull Overlay with a minimum of 3 lifts lift thicknesses of at least 40 mm (15) bull Construction with a minimum of 3 lifts with curb and gutter and at least 8 feet separating the traffic lane from the curb and gutter (shoulder at least 8 wide) For the following construction types use IRI Equation B bull New construction with 2 liftsbull Construction with curb and gutter adjacent to at least one driving lane and three lifts bull Two- lift overlays 40mm (15) minimum lift thicknessbull Winter carry-over - wearing course on two lifts bull Reclaim with 2 liftsbull Cold inplace recycled with 2 lifts bull Two lifts over concrete
For single lift overlay construction on bituminous the Designer can choose either IRI Equation C or Percent Ride Improvement See Note 1 below for single lift overlay on concrete The Percent Ride Improvement provision compares the IRI of the roadway before any construction activities have taken place to the IRI of the roadway after construction activities are finished Incentivedisincentive is determined by the percent ride improvement Percent ride improvement is intended to be used in situations where the existing roadway is in poor condition Data from pilot projects show that the rougher the road segment to begin with the greater the relative improvement possible For instance a road segment with a starting IRI of 150 inmile is more likely to be reduced to an IRI of 75 inmile than a road segment starting at 75 inmile is to be reduced to an IRI of 375 inmile Contact the Special Provisions Unit to insert the Percent Ride Improvement in a Contract For the following construction types use Percent Ride Improvement (1) bull Single lift bituminous over bituminous (BOB) overlays on a roadway surface with an overall PSR lt 28 (IRI greater than 120 inmi) For the following construction types use IRI Equation C (1) bull Single lift bituminous over bituminous (BOB) overlays on a roadway surface with an overall PSR gt 28 (IRI 120 inmi or less) This information is available in the Districtrsquos Pavement Management Condition Rating Reports
61
Note 1 The 2360 specification (Table 23607 ndash A) excludes IRI testing of single lift overlays on concrete However there may be unique situations on single lift BOC construction where a smoothness evaluation requirement is appropriate The designer should consult the Bituminous Office for guidance in those considerations
Because IRI is a new index for pavement smoothness measurement in the bituminous specification the following ldquotypicalrdquo IRI values and the equivalent PSR are given so that you have a perspective of various pavement smoothness numbers IRI PSR New pavement (3-lifts) ndash 37 inmile 41 New pavement (2-lifts) ndash 47 inmile 39 New pavement (1-lift) ndash 60 inmile 36 Aged pavement (10 yrs) ndash 110 inmile 29 Aged pavement (20 yrs) ndash 150 inmile 25 Table 23607 ndash A lists pavement surfaces that are excluded from smoothness testing but subject to 23607B (Surface Requirements) There may be other instances where you feel the ride specification is not appropriate on a Project In those instances make note in the Special Provisions that ride will be verified by 23607B
62
Appendix H Collecting Smoothness Data for Pay Factors Flowchart
Note The option to measure 10 of the length of each project is the least logical for the DOT as a crew is required to travel to each site This option is not very different from DOT measuring smoothness Still this option was presented because it is likely that different contractors will measure profiles on most of the sites To prevent one tampering incident from any one of the contractors it may be necessary to do all of these initially until all security initiatives are adopted An independent review of the practices and results of the DOT are recommended at the end of the first year
63
- OR06017 Assessing IRI vs PIpdf
- IRIvsPIpdf
-
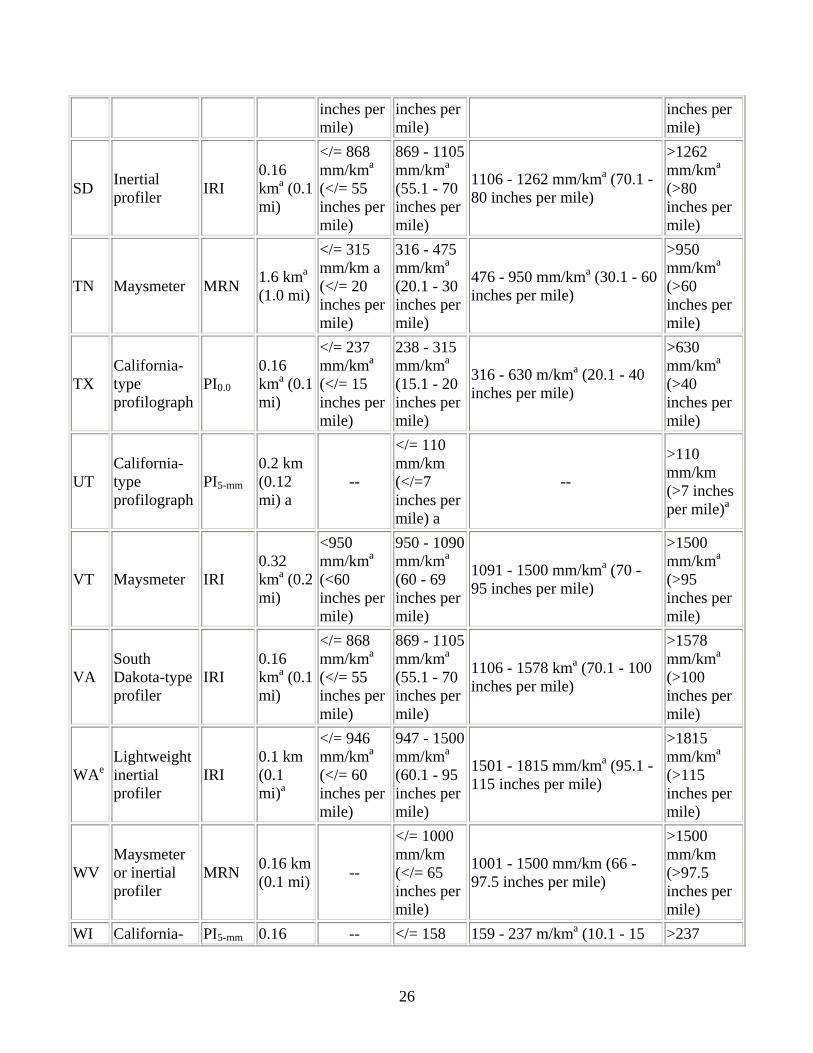
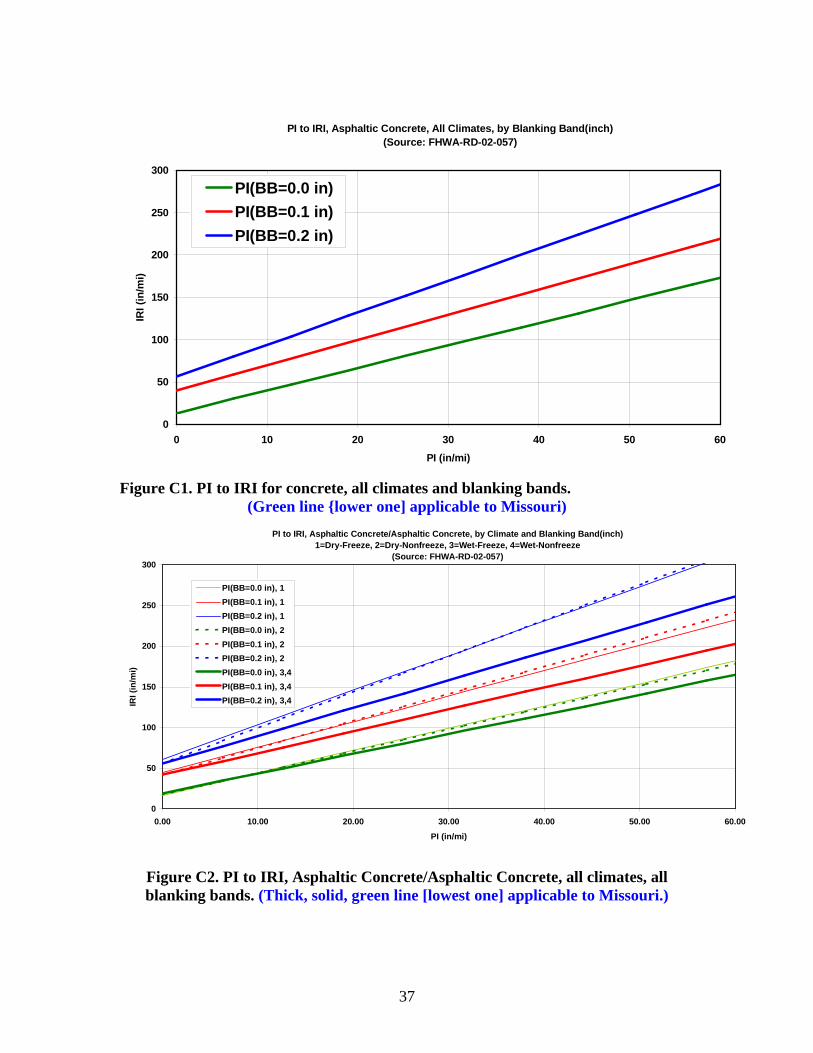
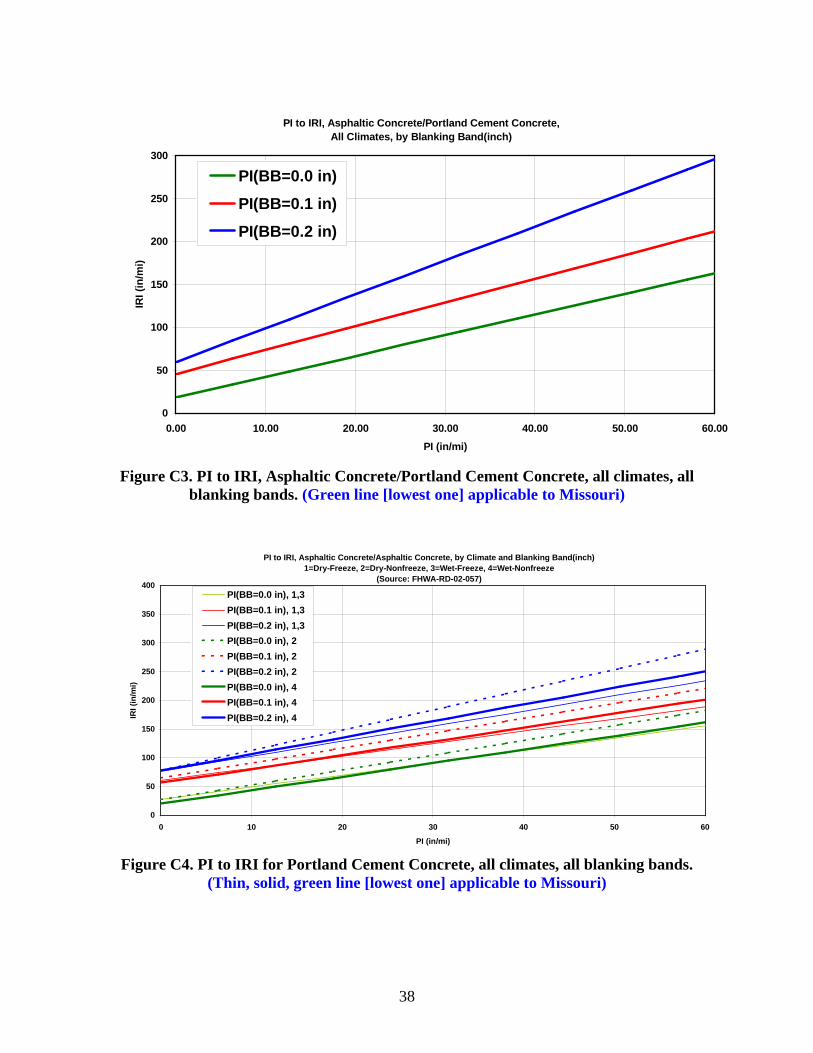
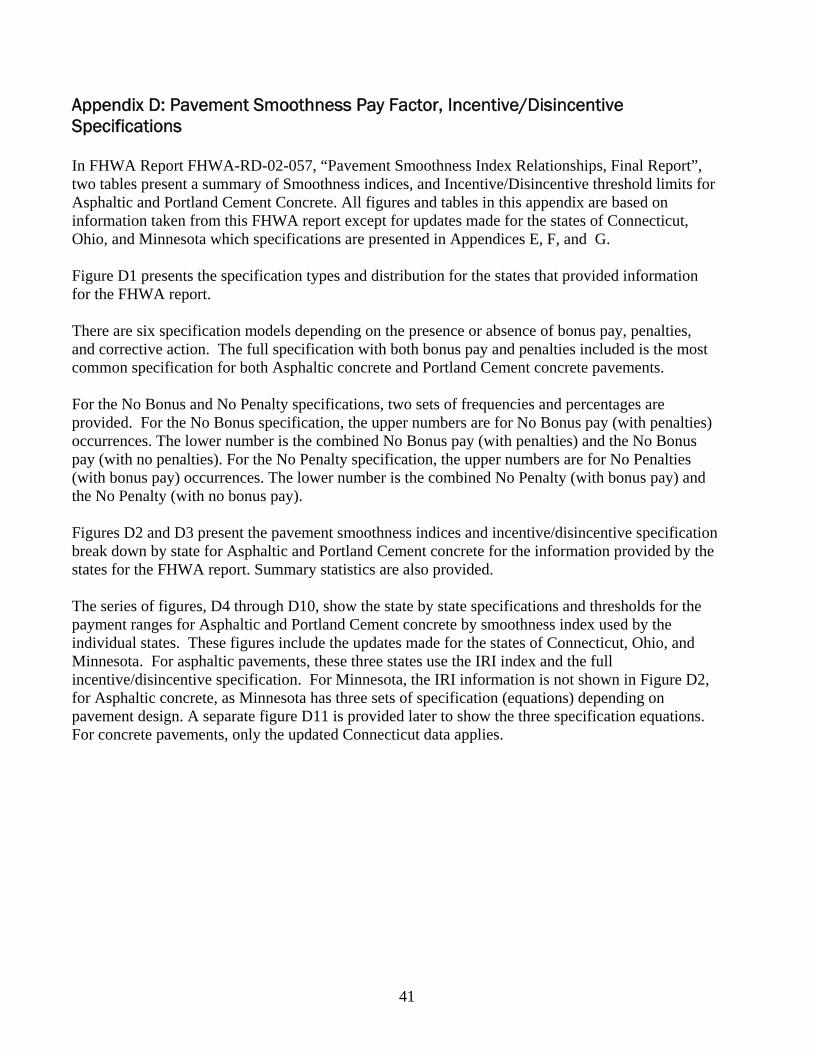
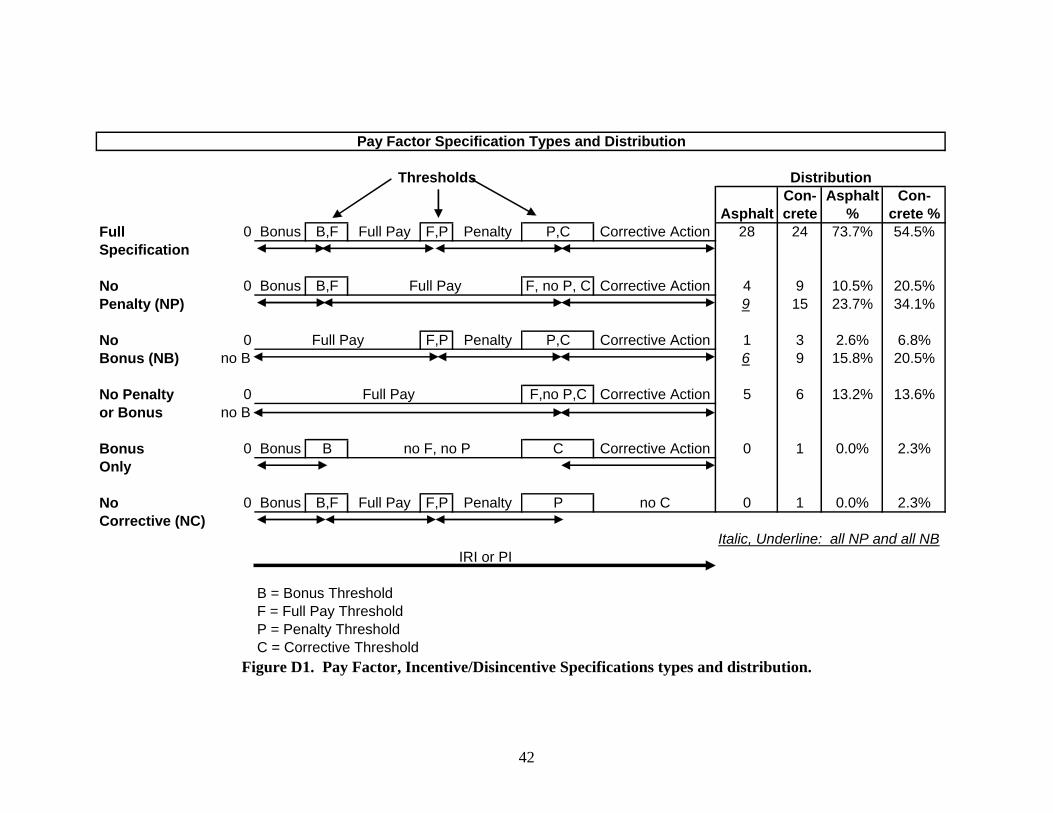