effects of management on biodiversity and productivity of
TRANSCRIPT

Effects of management on
biodiversity and productivity
of grazed grassland
Dissertation
zur Erlangung des mathematisch-naturwissenschaftlichen Doktorgrades
"Doctor rerum naturalium"
der Georg-August-Universität Göttingen
im Promotionsprogramm Agrarwissenschaften
der Georg-August University School of Science (GAUSS)
vorgelegt von
Jana Sabrina Jerrentrup
aus Bielefeld
Göttingen, im Oktober 2013

2
Betreuungsausschuss
Prof. Dr. Johannes Isselstein
(Graslandwissenschaft, Georg-August-Universität Göttingen)
Prof. Dr. Nicole Wrage-Mönnig
(Graslandökologie, Hochschule Rhein-Waal)
Mitglieder der Prüfungskommission
Referent/in: Prof. Dr. Johannes Isselstein
(Graslandwissenschaft, Georg-August-Universität Göttingen)
Korreferent/in: Prof. Dr. Teja Tscharntke
(Agrarökologie, Georg-August-Universität Göttingen)
Weitere Mitglieder der Prüfungskommission:
Prof. Dr. Dr. Matthias Gauly
(Produktionssysteme der Nutztiere, Georg-August-Universität Göttingen)
Prof. Dr. Nicole Wrage-Mönnig
(Graslandökologie, Fakultät Life Sciences, Hochschule Rhein-Waal)
Prof. Dr. Christoph Leuschner
(Pflanzenökologie und Ökosystemforschung, Georg-August-Universität Göttingen)
Prof. Dr. Eva Schlecht
(Tierhaltung in den Tropen und Subtropen, Georg-August-Universität Göttingen)
Tag der mündlichen Prüfung: 19.11.2013

3
“No single process or theory can explain a phenomenon as complex as biological diversity.”
Michael Alan Huston, 1994

4
CONTENT
GENERAL INTRODUCTION ...................................................................................... 5
References ............................................................................................................................ 10
Grazing intensity affects insect diversity via sward structure and heterogeneity in a long-term experiment ...................................................... 13
Summary .............................................................................................................................. 14
Introduction .......................................................................................................................... 15
Material & Methods ............................................................................................................. 17
Results .................................................................................................................................. 22
Discussion ............................................................................................................................. 27
Acknowledgements .............................................................................................................. 31
Supporting Information ........................................................................................................ 32
References ............................................................................................................................ 33
Vegetation composition and diversity of different sward types is mainly unaffected after five years of rotationally grazing by cattle and/or sheep ..... 37
Abstract ................................................................................................................................ 38
Introduction .......................................................................................................................... 39
Material and Methods.......................................................................................................... 42
Results .................................................................................................................................. 46
Discussion ............................................................................................................................. 53
References ............................................................................................................................ 57
Phytodiversity and mixed grazing of cattle and sheep for an improved productivity .................................................................................................. 60
Abstract ................................................................................................................................ 61
Introduction .......................................................................................................................... 62
Material & Methods ............................................................................................................. 64
Results .................................................................................................................................. 70
Discussion ............................................................................................................................. 75
References ............................................................................................................................ 80
GENERAL DISCUSSION ......................................................................................... 84
References ............................................................................................................................ 90
SUMMARY ........................................................................................................ 93
ZUSAMMENFASSUNG .......................................................................................... 95
ACKNOWLEDGEMENTS ......................................................................................... 97

GENERAL INTRODUCTION
5
GENERAL INTRODUCTION

GENERAL INTRODUCTION
6
Permanent grasslands cover one third of the agricultural used area in Europe (Smit et al.
2008). Besides playing a major role in providing livestock with forage, they also represent an
important resource for biodiversity (Hopkins & Wilkins 2006; O'Mara 2012). In the past,
traditionally low-intensive managed grasslands hosted many species, but in the last century
intensification of agricultural practice led to severe losses of biodiversity. However,
grasslands have developed in relation to management and a frequent utilization of these
anthropogenic ecosystems is mandatory to maintain biodiversity (Dierschke & Briemle 2002;
Tscharntke et al. 2005; Wrage et al. 2011).
Grasslands are vital for protection from erosion, for CO2-sequestration, water quality
and local recreation, and thereby serve ecological and socio-economic functions (Hampicke
2013; Hopkins & Holz 2006; O'Mara 2012). In the last years, ways to improve the
multifunctionality of grasslands have been in the focus of interest. Above all, the benefits of
biodiversity for ecosystem services have been underlined (Hopkins & Holz 2006; Isbell et al.
2011; Isselstein et al. 2005; Loreau et al. 2002; Weigelt et al. 2009). The advances made on
this research area also have implications for agriculture as they can potentially be used to
enhance sustainable production (Hopkins & Holz 2006). For instance, Weigelt et al. (2009)
found low-input high-diversity grasslands to be as productive as high-input low-diversity
plots. Other studies have shown that biodiversity can increase yield stability (Tilman et al.
2006) and benefit primary production in dry years (Sanderson et al. 2005), which is of high
relevance in times of climate change. Nonetheless, the positive impact of biodiversity – in
this case phytodiversity – on permanent grassland productivity is still unclear, and results are
inconsistent (Isselstein et al. 2005; Kahmen et al. 2005; Petersen et al. 2013; Seither 2011;
Rose et al. 2012).
Grazing is seen as one of the most promising tools to increase grassland biodiversity
(Metera et al. 2010; Rook et al. 2004; Wrage et al. 2011). Above all, grazing intensity is
known to affect agricultural output and conservation value. In contrast to mowing, grazing is
a non-uniform process and livestock alters the sward via selective defoliation, trampling and
excreta deposition (Dierschke & Briemle 2002; Metera et al. 2010; Rook et al. 2004; Wrage
et al. 2011). When enough forage is available, cattle are known to perform patch-grazing
(Adler et al. 2001). In this way grazing intensity not only determines mean sward height but
also increases sward heterogeneity (Metera et al. 2010; Rook et al. 2004). Heterogeneous
GENERAL INTRODUCTION
7
swards in turn offer several ecological niches beneficial for biodiversity (Metera et al. 2010;
Rook et al. 2004).
Extensification has been found to benefit plant diversity (Marriott et al. 2009). In
addition, structurally diverse swards have the potential to host varying vegetation
composition within one site (Correll et al. 2003; Marion et al. 2010). This increased
phytodiversity can proceed through trophic levels (Haddad et al. 2009; Scherber et al. 2010),
but sward structural modifications mediated by grazing also affect directly structure-
sensitive insects (Dennis et al. 1998; Morris 2000). Insects play essential roles in ecosystem
functioning such as food source, dung burial, pest control and pollination (Losey & Vaughan
2006), and therefore are a valuable component of biodiversity.
So far, many studies have related insect diversity to grazing intensity. However, besides
an ungrazed control, often only two grazing intensities were compared and long-term data
from grazing experiments are very rare ({Kruess & Tscharntke 2002; Sjödin et al. 2008;
WallisDeVries et al. 2007). In order to fill this gap of knowledge, data from a long-term
experiment (Fig. 1, upper part, “FORBIOBEN”) with three cattle grazing intensities were
analyzed within the present study (chapter I). Species richness and abundance of
grasshoppers (Orthoptera) and butterflies (Lepidoptera) were associated with grazing
intensity-treatments and with further vegetational and structural variables influenced by
grazing.
Besides grazing intensity, the choice of livestock has been proposed to alter vegetation
(Rook et al. 2004; Wrage et al. 2011). Livestock such as cattle (Bos taurus) and sheep (Ovis
aries) differ with regard to their grazing characteristics according to their nutritive
requirements, body size and muzzle configuration. While cattle are known to graze patchily,
sheep are able to select single plants and plant parts (Illius & Gordon 1987; Rook et al. 2004).
Consequently, swards with differing vegetation composition, diversity and sward structure
might develop. Biodiversity has also been suggested to benefit from mixed grazing of
livestock (Cuchillo Hilario 2012; Loucougaray et al. 2004; Wrage et al. 2011). This type of
grazing system might also result in a more even utilization of swards (Forbes & Hodgson
1985; Seither 2011).
However, in grazing experiments different types of livestock vegetation composition and
diversity have rarely been compared, and if so, the used swards were very simple (Abaye et
al. 1997; Nolan et al. 2001; Wright et al. 2006). In the present study, we therefore analyzed

GENERAL INTRODUCTION
8
vegetation development in response to type of grazer on a more complex permanent
grassland (chapter II). Because selectivity depends on phytodiversity (Cuchillo Hilario 2012)
we manipulated one half of experimental plots to create two levels of vegetation
composition and diversity (Fig. 1, lower part, “BIOMIX”).
Plant diversity itself, as already mentioned, can probably be used to improve agricultural
productivity. Besides herbage quantity, phytodiversity may affect herbage quality; however,
research on this aspect has delivered contradictory results so far (Bullock et al. 2001;
Hopkins & Holz 2006; Seip et al. 2012). In principle, higher yield proportion of leafy forbs and
legumes may provide a better quality throughout the season (Hofmann & Isselstein 2005;
Hopkins & Holz 2006; Petersen et al. 2013).
Biodiversity would even have wider implications for agriculture, if the positive impact
via increased herbage productivity and quality would convert into an enhanced livestock
performance (Soder et al. 2007). Besides, biodiverse swards offer a wide choice for selective
feeding (Metera et al. 2010; Soder et al. 2009) and livestock might be able to better fulfill
nutritional requirements.
To elucidate this relationship, on the same experiment as described for chapter II (Fig. 1,
lower part, “BIOMIX”), the effect of phytodiversity on primary productivity, herbage
nutritive value and livestock performance was studied (chapter III). As mixed stocking of
cattle and sheep can lead to a better utilization of swards via complementary grazing, we
also analyzed, whether this grazing system could improve livestock production.
Experimental site
This study aims to contribute to the relationship of grazing management, biodiversity
and productivity and evaluates results gained from two low-input grazing experiments. Both
experiments were situated in Relliehausen on an experimental farm of the University of
Goettingen. Relliehausen is located in the Solling Uplands which belong to the lower
mountain range of south Lower Saxony, Germany. Both experiments lay side-by-side (Fig. 1)
on a bedrock of Triassic Bunter Sandstone (Ebrecht 2005). Soil type is a pelosol; the
vegetation association can be described as Lolio-Cynosuretum, moderately species-rich
(Seither 2011; Wrage et al. 2012).

GENERAL INTRODUCTION
9
Fig. 1. Arrangement of the two experiments in Relliehausen, Germany (51°46’55’’ N, 9°42’13’’ E). In the upper part of the picture the FORBIOBEN experiment with three cattle grazing intensities is shown which was used in chapter I. The lower part of the picture shows the two-factorial BIOMIX-experiment used in chapters II and III. Here only the two sward types are shown, treatments according to grazers are indicated by different numbers (see legend). This map was created with ESRI ArcGIS 10.0.

GENERAL INTRODUCTION
10
References
Abaye, A.O., Allen, V.G. & Fontenot, J.P. (1997) Grazing sheep and cattle together or separately: effect on soils and plants. Agronomy Journal, 89, 380.
Adler, P., Raff, D. & Lauenroth, W. (2001) The effect of grazing on the spatial heterogeneity of vegetation. Oecologia, 128, 465–479.
Bullock, J.M., Pywell, R.F., Burke, M.J. & Walker, K.J. (2001) Restoration of biodiversity enhances agricultural production. Ecology Letters, 4, 185–189.
Correll, O., Isselstein, J. & Pavlu, V. (2003) Studying spatial and temporal dynamics of sward structure at low stocking densities: the use of an extended rising-plate-meter method. Grass and Forage Science, 58, 450–454.
Cuchillo Hilario, M. (2012) Grazing behavior and forage selectivity of cattle and sheep grazing alone or together on swards differing in plant species diversity. Cuvillier, Göttingen.
Dennis, P., Young, M.R. & Gordon, I.J. (1998) Distribution and abundance of small insects and arachnids in relation to structural heterogeneity of grazed, indigenous grasslands. Ecological Entomology, 23, 253–264.
Dierschke, H. & Briemle, G. (2002) Kulturgrasland. Ulmer, Stuttgart.
Ebrecht, L. (2005) Vegetation, Standortverhältnisse und Ausbreitungsbiologie von Pflanzen auf Rückegassen und Waldwegen im Göttinger Wald und im Solling. Cuvillier, Göttingen.
Forbes, T.D.A. & Hodgson, J. (1985) The reaction of grazing sheep and cattle to the presence of dung from the same or the other species. Grass and Forage Science, 40, 177–182.
Haddad, N.M., Crutsinger, G.M., Gross, K., Haarstad, J., Knops, J.M. & Tilman, D. (2009) Plant species loss decreases arthropod diversity and shifts trophic structure. Ecology Letters, 12, 1029–1039.
Hampicke, U. (2013) Kulturlandschaft und Naturschutz: Probleme-Konzepte-Ökonomie. Springer Spektrum, Wiesbaden.
Hofmann, M. & Isselstein, J. (2005) Species enrichment in an agriculturally improved grassland and its effects on botanical composition, yield and forage quality. Grass and Forage Science, 60, 136–145.
Hopkins, A. & Holz, B. (2006) Grassland for agriculture and nature conservation: production, quality and multi-functionality. Agronomy Research, 4, 3–20.
Hopkins, A. & Wilkins, R.J. (2006) Temperate grassland: key developments in the last century and future perspectives. The Journal of Agricultural Science, 144, 503.
Illius, A. & Gordon, I. (1987) The allometry of food intake in grazing ruminants. Journal of Animal Ecology, 56, 989–999.
Isbell, F., Calcagno, V., Hector, A., Connolly, J., Harpole, W.S., Reich, P.B., Scherer-Lorenzen, M., Schmid, B., Tilman, D., van Ruijven, J., Weigelt, A., Wilsey, B.J., Zavaleta, E.S. & Loreau, M. (2011) High plant diversity is needed to maintain ecosystem services. Nature, 477, 199–202.
Isselstein, J., Jeangros, B. & Pavlů, V. (2005) Agronomic aspects of biodiversity targeted management of temperate grasslands in Europe – A review. Agronomy Research, 3, 139–151.
Kahmen, A., Perner, J., Audorff, V., Weisser, W. & Buchmann, N. (2005) Effects of plant diversity, community composition and environmental parameters on productivity in montane European grasslands. Oecologia, 142, 606–615.
Kruess, A. & Tscharntke, T. (2002) Grazing intensity and the diversity of grasshoppers, butterflies, and trap-nesting bees and wasps. Conservation Biology, 16, 1570–1580.

GENERAL INTRODUCTION
11
Loreau, M., Naeem, S. & Inchausti, P. (2002) Biodiversity and ecosystem functioning: Synthesis and perspectives. Oxford University Press, Oxford, New York.
Losey, J.E. & Vaughan, M. (2006) The economic value of ecological services provided by insects. BioScience, 56, 311.
Loucougaray, G., Bonis, A. & Bouzillé, J.-B. (2004) Effects of grazing by horses and/or cattle on the diversity of coastal grasslands in western France. Biological Conservation, 116, 59–71.
Marion, B., Bonis, A. & Bouzillé, J.-B. (2010) How much does grazing-induced heterogeneity impact plant diversity in wet grasslands? Ecoscience, 17, 229–239.
Marriott, C., Hood, K., Fisher, J. & Pakeman, R. (2009) Long-term impacts of extensive grazing and abandonment on the species composition, richness, diversity and productivity of agricultural grassland. Agriculture, Ecosystems & Environment, 134, 190–200.
Metera, E., Sakowski, T., Słoniewski, K. & Romanowicz, B. (2010) Grazing as a tool to maintain biodiversity of grassland – a review. Animal Science Papers and Reports, 28, 315–334.
Morris, M. (2000) The effects of structure and its dynamics on the ecology and conservation of arthropods in British grasslands. Biological Conservation, 95, 129–142.
Nolan, T., Conolly, J. & Wachendorf, M. (2001) Mixed grazing and climatic determinants of white clover (Trifolium repens L.) content in a permanent pasture. Annals of Botany, 88, 713–724.
O'Mara, F.P. (2012) The role of grasslands in food security and climate change. Annals of Botany, 110, 1263–1270.
Petersen, U., Wrage-Mönnig, N. & Isselstein, J. (2013) Effects of herbicide application to control sward composition in different management variants. International Journal of Biodiversity Science, Ecosystem Services & Management, 9, 155–165.
Rook, A., Dumont, B., Isselstein, J., Osoro, K., WallisDeVries, M., Parente, G. & Mills, J. (2004) Matching type of livestock to desired biodiversity outcomes in pastures – a review. Biological Conservation, 119, 137–150.
Rose, L., Hertel, D. & Leuschner, C. (2012) Livestock-type effects on biomass and nitrogen partitioning in temperate pastures with different functional-group abundance. Grass and Forage Science, n/a.
Sanderson, M.A., Soder, K.J., Muller, L.D., Klement, K.D., Skinner, R.H. & Goslee, S.C. (2005) Forage mixture productivity and botanical composition in pastures grazed by dairy cattle. Agronomy Journal, 97, 1465.
Scherber, C., Eisenhauer, N., Weisser, W.W., Schmid, B., Voigt, W., Fischer, M., Schulze, E.-D., Roscher, C., Weigelt, A., Allan, E., Beßler, H., Bonkowski, M., Buchmann, N., Buscot, F., Clement, L.W., Ebeling, A., Engels, C., Halle, S., Kertscher, I., Klein, A.-M., Koller, R., König, S., Kowalski, E., Kummer, V., Kuu, A., Lange, M., Lauterbach, D., Middelhoff, C., Migunova, V.D., Milcu, A., Müller, R., Partsch, S., Petermann, J.S., Renker, C., Rottstock, T., Sabais, A., Scheu, S., Schumacher, J., Temperton, V.M. & Tscharntke, T. (2010) Bottom-up effects of plant diversity on multitrophic interactions in a biodiversity experiment. Nature, 468, 553–556.
Seip, K., Breves, G., Isselstein, J., Daş, G. & Abel, H. (2012) Ruminal fermentation characteristics and microbial nitrogen assimilation in sheep fed differently composed grass silages. Archives of Animal Nutrition, 66, 215–226.
Seither, M. (2011) The effect of grassland botanical composition and (co-) grazing cattle and sheep on herbage production and sward nutrient utilisation. PhD-thesis, Georg-August-Universität Göttingen.
Sjödin, N.E., Bengtsson, J. & Ekbom, B. (2008) The influence of grazing intensity and landscape composition on the diversity and abundance of flower-visiting insects. Journal of Applied Ecology, 45, 763–772.

GENERAL INTRODUCTION
12
Smit, H., Metzger, M. & Ewert, F. (2008) Spatial distribution of grassland productivity and land use in Europe. Agricultural Systems, 98, 208–219.
Soder, K.J., Gregorini, P., Scaglia, G. & Rook, A.J. (2009) Dietary selection by domestic grazing ruminants in temperate pastures: current state of knowledge, methodologies, and future direction. Rangeland Ecology & Management, 62, 389–398.
Soder, K.J., Rook, A.J., Sanderson, M.A. & Goslee, S.C. (2007) Interaction of plant species diversity on grazing behavior and performance of livestock grazing temperate region pastures. Crop Science, 47, 416-425.
Tilman, D., Reich, P.B. & Knops, J.M.H. (2006) Biodiversity and ecosystem stability in a decade-long grassland experiment. Nature, 441, 629–632.
Tscharntke, T., Klein, A.M., Kruess, A., Steffan-Dewenter, I. & Thies, C. (2005) Landscape perspectives on agricultural intensification and biodiversity - ecosystem service management. Ecology Letters, 8, 857–874.
WallisDeVries, M.F., Parkinson, A.E., Dulphy, J.P., Sayer, M. & Diana, E. (2007) Effects of livestock breed and grazing intensity on biodiversity and production in grazing systems. 4. Effects on animal diversity. Grass and Forage Science, 62, 185–197.
Weigelt, A., Weisser, W.W., Buchmann, N. & Scherer-Lorenzen, M. (2009) Biodiversity for multifunctional grasslands: equal productivity in high-diversity low-input and low-diversity high-input systems. Biogeosciences, 6, 1695–1706.
Wrage, N., Şahin Demirbağ, N., Hofmann, M. & Isselstein, J. (2012) Vegetation height of patch more important for phytodiversity than that of paddock. Agriculture, Ecosystems & Environment, 155, 111–116.
Wrage, N., Strodthoff, J., Cuchillo, H.M., Isselstein, J. & Kayser, M. (2011) Phytodiversity of temperate permanent grasslands: ecosystem services for agriculture and livestock management for diversity conservation. Biodiversity and Conservation, 20, 3317–3339.
Wright, I.A., Jones, J.R., Davies, D.A., Davidson, G.R. & Vale, J.E. (2006) The effect of sward surface height on the response to mixed grazing by cattle and sheep. Animal Science, 82.

CHAPTER I
13
CHAPTER I
Grazing intensity affects insect diversity via sward
structure and heterogeneity in a long-term
experiment
Jerrentrup, Jana Sabrina; Wrage-Mönnig, Nicole; Röver, Klaus-Ulrich;
Isselstein, Johannes
Published in the Journal of Applied Ecology
doi: 10.1111/1365-2664.12244

CHAPTER I
14
Summary
1. In the past, insect diversity in grasslands showed a severe decline due to management
intensification or abandonment. In this study, we investigate the long-term influence of
grazing and the potential for spatial patterns created by different grazing intensities to
enhance insect diversity.
2. In a long-term experiment (2002–2011), three grazing intensities were applied to 1-ha
paddocks in a triplicate block design: moderate grazing (MC), lenient grazing (LC) and very
lenient grazing (VLC, since 2005). The experiment was conducted in a moderately species-
rich grassland at the edge of the Solling Uplands in Lower Saxony, Germany. Orthoptera
(grasshoppers) and Lepidoptera (butterflies) on three 50-m transects per paddock were
counted in 2002–2004 and again in 2010 and 2011. Statistics were performed using linear
mixed modelling.
3. Grasshopper diversity measures (species richness and abundance) were significantly
affected by grazing intensity; abundance increased from 2002 to 2011 more strongly in the
LC than in the MC treatment. Butterfly species richness response to grazing intensity varied
among years. Data from 2010 and 2011 did not reveal any advantage of the lowest grazing
intensity (VLC) compared to the intermediate grazing intensity treatment (LC) in either insect
group.
4. Multiple regressions were used to investigate diversity patterns. Along with
compressed sward height, spatial patchiness was important for grasshopper species richness
and abundance as well as for butterfly species numbers. Butterfly abundance was mainly
influenced by vertical sward height heterogeneity in addition to the significant effects of
thistle abundance and number of nectar plant species.
5. Synthesis and applications. Cattle grazing intensity affects the proportions and spatial
heterogeneity of short and tall sward patches on pastures. The less mobile grasshoppers
particularly benefitted from the structural modifications created by cattle at lenient grazing
levels (stocking rate 1.14 SLU ha-1, standard livestock unit (SLU = 500 kg). In the final study
years, areas with intermediate grazing intensity revealed high diversity indices and the most
distinct patchiness, therefore a further reduction in grazing intensity is not recommended.
This indicates that commercial livestock production may be compatible with conservation
targets.

CHAPTER I
15
Introduction
European grasslands hold a broad diversity of plants and insects and their conservation
is considered as a major challenge for land management and nature conservation
(Littlewood et al. 2012). Against the background of decreased biodiversity in the past
(Vickery et al. 2001; Stoate et al. 2009), appropriate management of remaining grassland
sites is required to maintain biodiversity. Grazing appears to have a high potential for
combining these targets with the growing social demands for animal welfare (Van den Pol-
van Dasselaar et al. 2008). However, the main function of pastures for farmers is to meet
agronomic and financial interests. Therefore, the identification of a threshold grazing
intensity that fulfils both environmental and livestock production objectives is essential. It is
well known that high stocking rates combined with intensive grassland management
contribute to the deterioration of insect diversity (Vickery et al. 2001; Stoate et al. 2009). On
the other hand, terminating agricultural activity also leads to a decrease in diversity during
succession to woodland (Erhardt 1985; Stoate et al. 2009). However, it is still uncertain what
level of grazing intensity is appropriate to conserve insects and by which mechanisms grazing
intensity affects insect diversity. Main predictors of explanatory value could include plant
diversity (Haddad et al. 2009), sward height (Lawton 1983; Kruess and Tscharntke 2002) and
sward structure (Rook et al. 2004; WallisDeVries et al. 2007). As extensive grazing is
supposed to enhance phytodiversity (Marriott et al. 2009; Marion et al. 2010), this should in
turn promote species richness of higher trophic levels (Siemann 1998). Furthermore, low
grazing intensities result in taller swards (Isselstein et al. 2007), providing more forage and
shelter for herbivorous insects (Gardiner et al. 2002). When enough forage is available, a
heterogeneous sward structure with short and tall patches (defined by Adler et al. 2001)
emerges (Milchunas et al. 1988; Correll et al. 2003; Dumont et al. 2007), offering different
ecological niches for many insect species (WallisDeVries et al. 2007).
Butterflies and grasshoppers are often used as biodiversity indicators, for example in the
European Grassland Butterfly indicator, which is one of the standard European indicators on
biodiversity (Van Sway et al. 2013). Butterflies are well studied (e.g. Ebert 1991), easy to
identify and react to changing environmental conditions quickly (Erhardt 1985). As Thomas
(2005) stated, they serve as indicators for many insect groups. Grasshoppers have also
become one of the most important invertebrate indicators for agricultural management and

CHAPTER I
16
disturbance (Weiss et al. 2012). Compared to butterflies, they are less dependent on specific
host plants, but are sensitive to changes in vegetation structure (Wettstein & Schmid 1999;
Gardiner et al. 2002; Weiss et al. 2012). Due to their inferior mobility compared to
butterflies (Wettstein & Schmid 1999), they depend more on good quality habitats on a
smaller scale (e.g. Weyer et al. 2012).
Previous studies investigating the effect of grazing intensities on insect diversity often
only compared two stocking rates (Kruess & Tscharntke 2002; WallisDeVries et al. 2007;
Sjödin et al. 2008), and the spatial heterogeneity of pastures is rarely considered. In
addition, data from long-term grazing studies on controlled experiments are very rare and
even less frequent in combination with insect recordings.
The aim of this study was to investigate the impact of grazing intensity on the diversity
of grasshoppers and butterflies as indicators for faunistic diversity and to elucidate the
underlying factors modified by grazing. To this end, a long-term field experiment was carried
out with three grazing intensities. The following hypotheses were addressed: I) insect
diversity (grasshopper and butterfly species richness and abundance) is driven by grazing
intensity. II) This relationship is mediated by a) phytodiversity, b) sward height or c) sward
heterogeneity. III) Owing to the formation of stable patches, insect abundance can increase
in the long term on the more extensive grazing treatment.

CHAPTER I
17
Material & Methods
Experimental site
The study area is situated in Relliehausen (51°46’55” N, 9°42’13”E, 250 m a.s.l.), Lower
Saxony, Germany. The soil type is a brown earth/pelosol and the vegetation association a
moderately species-rich Lolio Cynosuretum. No fertilizers were used on this site. For more
details see Isselstein et al. (2007) and Wrage et al. (2012).
The grazing experiment, previously part of the EU project FORBIOBEN (Isselstein et al.
2007), consisted of three grazing intensity treatments. Grazing intensity modifies average
sward height (Isselstein et al. 2007), and so target sward heights were used as a proxy for
grazing intensity [moderate stocking (MC): 6 cm, lenient stocking (LC): 12 cm, both set up in
2002 and very lenient stocking (VLC): 18 cm, set up in 2005] and achieved by using a put and
take system with adjusted numbers of Simmental cattle. To monitor grazing intensity,
compressed sward height (CSH) was measured biweekly (50 measurements per paddock)
with a rising plate meter (Castle 1976). The study was conducted in a randomized block
design with three replicates each on 1-ha paddocks. For stocking details please see Table 1.
Weather data are summarized in Wrage et al. (2012).
Table 1 Overview of stocking data (means ± sd) per ha according to grazing intensity-treatments (T, MC: moderate grazing, LC: lenient grazing, VLC: very lenient grazing) and years used in this investigation. The number (no.) of animals refers to times when paddocks were actually grazed. SLU: standard livestock unit = 500 kg.
T
2002 2003 2004 2010 2011 mean
Grazing days MC
134 ± 0 90 ± 0 154 ± 14 75 ± 0 98 ± 2 110 ± 3
LC
134 ± 0 64 ± 0 125 ± 0 70 ± 0 55 ± 0 90 ± 0
VLC*
52 ± 0 55 ± 0 54 ± 0
No. of animals MC
5.9 ± 0.7 2.8 ± 0.3 4.3 ± 0.8 3.6 ± 0.0 4.1 ± 0.1 4.1 ± 0.4
LC
3.4 ± 0.1 1.1 ± 0.0 2.2 ± 0.0 2.8 ± 0.0 3.0 ± 0.0 2.5 ± 0.0
VLC*
2.0 ± 0.0 2.0 ± 0.0 2.0 ± 0.0
SLU-grazing days MC
551 ± 71 330 ± 53 523 ± 124 368 ± 17 437 ± 24 442 ± 58
LC
353 ± 85 131 ± 7 292 ± 3 268 ± 7 228 ± 9 255 ± 22
VLC*
148 ± 6 161 ± 2 155 ± 4
Stocking rate (SLU ha-1
)† MC
2.59 ± 0.33 1.55 ± 0.25 2.48 ± 0.58 1.73 ± 0.08 2.05 ± 0.11 2.08 ± 0.27
LC
1.37 ± 0.06 0.62 ± 0.04 1.40 ± 0.01 1.26 ± 0.03 1.07 ± 0.04 1.14 ± 0.04
VLC*
0.70 ± 0.03 0.76 ± 0.01 0.73 ± 0.02
* Treatment VLC was introduced in 2005. Between 2002 and 2004 paddocks were managed like the LC-treatment, but with a traditional cattle breed (German Angus), see Isselstein et al. (2007)
† Stocking rates refer to a stocking season from 1st April to 31th October each year

CHAPTER I
18
Insect recordings
Three permanent 50-m transects per paddock were set up for observation of
grasshoppers and butterflies. Transects were monitored in 2002–2004 (see WallisDeVries et
al. 2007) and revisited in 2010 and 2011.
Butterfly censuses followed the method of Pollard (1977), in which a 5-m corridor
around the monitored transect is imagined (butterfly transect method). Butterflies were
recorded biweekly between July and September and identified visually to species level,
except for the whites (Pieris brassica, P. napi, P. rapae), which were combined. The whites
are widespread generalists that seek crucifers for oviposition and use open flowery areas
(Ebert 1991). If individuals were not identified during the census, specimens were net-
captured for identification. Butterfly observations were only carried out at appropriate
weather conditions (see WallisDeVries et al. 2007). Missing data points due to bad weather
were estimated according to the method by Hall (1981).
Grasshoppers were counted using the sweep-net method with one sweep every 2 m (for
details see WallisDeVries et al. 2007). Specimen were counted and identified to species level,
except for the species hard to distinguish, that is, Chorthippus biguttulus, C. brunneus, und
C. mollis, which were pooled. While C. biguttulus is abundant in Germany and can be found
on moderately dry habitats, C. brunneus and C. mollis prefer drier areas like dry grasslands
(Bellmann 2006) and are therefore not expected to be present frequently in this experiment.
Grasshopper recordings were conducted once per month between July and September on
dry and more or less sunny days.
Vegetation & sward structure
Vegetation was analysed from 2002 to 2011 on 10 permanent quadrats (1 m2 each) per
paddock twice per year (spring and autumn). For more information see Wrage et al. (2012).
Here, data from 2010 and 2011 are used. Plant species richness and evenness (Magurran
2004) as well as the proportions of functional groups (grasses, forbs and legumes) were
calculated for each year. Nectar plant species of the recorded butterfly species as well as
host plants were identified using the ‘British butterfly host-plant and nectar source’ data
base (http://pbh-butterflies.yolasite.com/hostplants-and-nectar.php, last accessed 01
November 2012). For this measurement, all permanent quadrats per paddock were pooled.

CHAPTER I
19
Every 50 cm along the middle transect line, sward surface height was measured with a
sward stick (Bircham 1981). The average of these recordings was used as the sward surface
height of each paddock. Furthermore, sward height classes (eight classes, in steps of 5 cm
each) were counted to gain information about the distribution of microclimates. The
evenness (Magurran 2004) of this measure was calculated on the basis of the eight height
classes. Openness of the sward was assessed as percentage of bare soil cover in a 15 cm
radius around the transect points. Flowering thistles (Cirsium arvense and C. vulgare) were
counted continuously along the butterfly transect-corridor around the middle transects due
to their importance as nectar resources (e.g. WallisDeVries et al. 2012). Despite a positive
effect on butterflies, from an agronomic point of view, thistles are undesirable and known to
spread into gaps created by intensive cattle grazing (Silvertown & Smith 1989).
Spatial heterogeneity
Proportions of short and tall sward patches were calculated based on aerial
photographs (Geobasisdaten der Nieders€achsischen Vermessungs- und Katasterverwaltung
2010). The photograph was taken in early spring 2010, when senescent plant material of tall
patches and young plant growth of short patches made the spatial heterogeneity clearly
visible as colour differences. The image was split into colour channels, and the average grey
value (red channel) of the whole experimental area was determined as the threshold
distinguishing between patch types. On the basis of this value, proportions of tall patches
were calculated for each paddock (Fig. 2).
As heterogeneous pastures often display a bimodal sward height distribution (Gibb &
Ridout 1988; Parsons & Dumont 2003), histograms of grey values for each paddock were
evaluated to be uni- or bimodal (Fig. 2). These spatial analyses were performed with IMAGEJ
(version 1.44p; Abramoff et al. 2004).

CHAPTER I
20
The coordinates of the transects were connected to the orthophoto in ArcMap (version
10.0, ESRI, Redlands, CA, USA). Patches (short or tall) were then digitalized within buffers
around each transect analogous to the size of butterfly transect-corridors. The sum of
patches of the three transects per paddock was taken as a measure of patchiness. As sward
patches are relatively stable under constant grazing management (Marion et al. 2010;
Rossignol et al. 2011; Dumont et al. 2012), we used the values of the 2010 spatial analysis
for 2011 as well.
Statistical analysis
In order to account for the additional VLC-treatment set-up in 2005, we focused in the
statistical analysis separately on the long-term data set (treatments MC and LC, years 2002–
2004, 2010, 2011) or on the three treatments data set (treatments MC, LC, VLC; years 2010 +
2011), respectively. For hypothesis I, butterfly and grasshopper data were analysed in
response to grazing intensities concerning both data sets. Species and abundance data of
insect censuses were pooled per transect annually, leading to three annual values per
paddock. For both response variables, mixed ANOVA models were built for the long-term
data set with the factors grazing intensity and year as fixed terms. The random term
accounted for the nesting structure of the experimental design (transects nested in
paddocks nested in blocks) and for the repeated measures over years. As adding random
slopes did not improve models as measured by Akaike Information Criterion (AIC, Akaike
Fig. 2. Image processing for the determination of short and tall patch proportions on an LC-paddock using ImageJ. Top panel: orthophoto (red channel). Bottom panel; the assessment of short (black) and tall (white) patches. In addition, the bimodal sward height distribution reflected in grey values is shown.

CHAPTER I
21
1973), random intercept models were used. In the same way, an autocorrelation structure
(corAR1) was tested in each model to account for similarities between adjacent years, but
proved to be an adequate adjustment only in the butterfly abundance model. In order to
test all three grazing intensities, data of 2010 + 2011 were considered in mixed ANOVA
models (structure as above). All analyses were carried out for grasshoppers and butterflies
separately.
Concerning years 2010 and 2011, separate ANOVA s were performed to test the effect
of treatment on the measured sward variables. These variables with the addition of
bimodality of sward height distribution were correlated with species richness and
abundance of grasshoppers and butterflies in separate linear models. Host plant availability
for butterflies in 2011 was analysed in an ANOVA with treatments as predictor variable.
For hypotheses II, multiple regressions based on mixed models (random structure as
above) were performed for eligible sward variables and models simplified by stepAIC
procedure. The proportion of tall patches was not integrated due to the high correlation
with CSH.
For hypothesis III, long-term data set models were used analogously to the models for
hypothesis I, but the fixed term year was taken as a numerical variable. In addition, two
species with conservation value were chosen to reflect abundance over the long term: the
Water-meadow Grasshopper Chorthippus montanus is an endangered grasshopper in many
European countries (Bellmann 2006), and the Marbled White Melanargia galathea is an
appropriate butterfly indicator species for traditionally managed grassland (Hampicke 2013).
Therefore, abundance data were pooled over transects per paddock. Mixed models
accounting for repeated measurements over years were performed with treatments and
years (numerical) as fixed terms. The M. galathea model was optimized by an
autocorrelation structure (corAR1).
All models were visually checked for meeting model assumptions and transformations
as well as variance modelling applied where necessary (adjustments are mentioned in the
respective tables).
Analyses were performed in R (R Development Core Team 2012), for mixed models in
connection with package nlme (Pinheiro et al. 2012).

CHAPTER I
22
Results
In total, 3384 grasshoppers across nine species and 2323 individual butterflies of 20
species were counted. The dominant species within each group were the Lesser Marsh
Grasshopper Chorthippus albomarginatus (58%) and the Meadow Brown butterfly Maniola
jurtina (47%; see Tables S1 and S2, Supporting Information).
In the long-term data set, significantly more grasshopper species were found on LC than
on MC (Fig. 3a, Table 2). Species richness differed among years, but no interaction of the
main terms was found. For butterflies, the significant interaction between treatments and
years (Fig. 3b, Table 2) suggested that the difference of species richness among treatments
varied among years.
Fig. 3. Mean species richness (species number) per transect of a) grasshoppers and b) butterflies as well as abundance (number of individuals) per transect of c) grasshoppers and d) butterflies between 2002 and 2011. Error bars show standard errors. Colours of bars refer to treatments: light grey for MC (moderate grazing), medium grey for LC (lenient grazing) and dark grey for VLC (very lenient grazing). Different letters indicate significant treatment effects within years 2010 + 2011 (Tukey’s HSD post-hoc test). For further statistical results see Table 2.

CHAPTER I
23
Table 2 Results of mixed effects models for butterfly and grasshopper species numbers and abundance in the long-term dataset (2002–2011) with grazing intensities MC (moderate grazing) and LC (lenient grazing) and in the three grazing intensities dataset including treatments MC, LC and VLC (very lenient grazing) in years 2010 and 2011 (NumDF = numerator degrees of freedom, DenDF = denominator degrees of freedom)
Grasshoppers Butterflies
NumDF DenDF F P NumDF DenDF F P
Long term dataset (2002-2011, two grazing intensities MC, LC)
Species numbers
Treatment 1 2 42.376 0.0228 1* 2 2.303 0.2684
Year 4 64 4.303 0.0038 4 64 63.348 < .0001
Treatment x Year 4 64 1.534 0.2031 4 64 7.012 0.0001
Abundance
Treatment 1†‡ 2 76.871 0.0128 1†‡¶ 2 9.244 0.0933
Year 4 64 23.298 < .0001 4 64 41.361 < .0001
Treatment x Year 4 64 3.310 0.0158 4 64 1.317 0.2734
Three grazing intensities-dataset (2010+2011, grazing intensities MC, LC, VLC)
Species numbers
Treatment 2§ 4 15.081 0.0137 2 4 14.822 0.0141
Year 1 24 10.051 0.0041 1 24 38.531 < .0001
Treatment x Year 2 24 0.421 0.6609 2 24 0.135 0.8747
Abundance
Treatment 2† 4 16.810 0.0113 2 4 10.006 0.0277
Year 1 24 35.142 < .0001 1 24 69.778 < .0001
Treatment x Year 2 24 1.565 0.2296 2 24 1.396 0.2669
* The variance structure varPower was implemented in the model (using the fitted values in the structure) † Data were square root transformed pre-analysis ‡ The variance structure varIdent was used in the model (allowing for differing variances each year) ¶ The autocorrelation structure CorAR1 was implemented in the model (accounting for similar values in adjacent years) § The variance structure varIdent was used in the model (allowing for differing variances for each treatment)
Abundance analysis of grasshoppers in the long-term data set showed a highly positive
effect of LC compared with MC (Fig. 3c, Table 2). Furthermore, the increase in abundance
over years was significantly steeper on LC than on MC (years taken as numerical, treatment:
P = 0.0128, year: P < 0.0001, interaction treatment x year: P = 0.0059). Butterflies showed a
similar, but non-significant trend: there were generally more butterflies counted on LC than
on MC (Fig. 3d, Table 2). Slopes of butterfly abundance over time did not significantly differ
between treatments MC and LC (years taken as numerical, treatment: P = 0.0913, year:
P < 0.0001, interaction treatment x year: P = 0.9911). The long-term consideration of the
species C. montanus and M. galathea showed a significantly stronger increase in abundance
over years on the LC compared with the MC treatment in both cases (Fig. 4).

CHAPTER I
24
Regarding the three treatments in 2010 and 2011, the lowest grazing intensity
treatment VLC had more species and more individuals than MC but not more than LC for all
grasshoppers and butterflies (Fig. 3 and Table 2). In all diversity analyses, the dependence of
diversity measures on year was confirmed (Table 2).
Treatments differed significantly in CSH as well as several other botanical and structural
variables (Table 3). Height class evenness did not significantly differ among treatments but
tended to be higher on LC and VLC than on MC (P = 0.0573). Likewise, openness of the soil
differed by trend among grazing intensities (P = 0.0831) and was smaller on LC and VLC than
on MC. Considering the proportion of tall patches and sward surface height, treatment
effects were found to be highly significant. Patchiness was significantly larger on LC than on
MC, with VLC being intermediate. The cover of legumes was significantly smaller in VLC than
in MC, with LC being intermediate. Host plant availability in 2011 did not differ among
treatments (P = 0.978). Grey value histograms of the aerial image showed a bimodal
distribution in all LC paddocks and two of three VLC paddocks (an example is shown in Fig.
2). The remaining paddocks were unimodal.
Fig. 4. Abundance of a) Chorthippus montanus and b) Melanargia galathea (transect data per paddock were pooled) on MC (moderate grazing, light grey quadrats), LC (lenient grazing, medium grey triangles) and VLC (very lenient grazing, dark grey dots, only 2010+2011). Regression lines refer to MC (light grey line) and LC (dashed medium grey line) and indicate significant interactions between treatment and years (C. montanus: P=0.0067, M. galathea: P< 0.0001) in mixed models. In both models, years (C. montanus: P=0.0017, M. galathea: P< 0.0001) and treatments (C. montanus: P=0.0144, M. galathea: P=0.0198) were significant. In the model of M. galathea the integration of a variance structure (varIdent) accounted for different variances per treatment.

CHAPTER I
25
Table 3 Results of response variables measured in 2010 and 2011 in relation to grazing intensity (mean ± SE) and ANOVA levels of significance for treatment (T, MC: moderate grazing, LC: lenient grazing, VLC: very lenient grazing), year (Y) and their interaction (NS: not significant, (*) P< 0.10, * P< 0.05, ** P< 0.01, *** P< 0.001). Different letters show significant differences between treatments (post-hoc Tukey HSD test). CSH = compressed sward height, SSH = sward surface height, PlantSpR= plant species richness, PlantE = plant evenness, NectarN = number of nectar plant species, Thistles = number of thistles, HN = number of surface height classes, HE = evenness of surface height classes.
Response MC LC VLC Level of significance
T Y T x Y
CSH(cm) 6.17 ± 0.29c 9.59 ± 0.32
b 11.70 ± 0.28
a *** NS NS
Tall patches (%)‡ 14.83 ± 6.24b 61.15 ± 3.10
a 75.35 ± 1.22
a ***
SSH† (cm) 6.62 ± 1.22b 14.11 ± 1.18
a 20.66 ± 2.38
a *** NS NS
PlantSpR (m-2
) 10.58 ± 0.50 10.30 ± 0.49 9.93 ± 0.60 NS NS NS
PlantE (m-2
) 73.19 ± 0.90 72.83 ± 1.47 71.87 ± 2.06 NS NS NS
Grasses (cover %) 64.33 ± 3.37 65.13 ± 5.17 64.16 ± 4.45 NS NS NS
Forbs (cover %) 16.88 ± 3.35 18.88 ± 3.77 17.00 ± 3.38 NS NS NS
Legumes (cover %) 7.93 ± 1.18a 5.70 ± 1.11
ab 3.09 ± 0.55
b ** NS NS
Openness (%)† 6.17 ± 0.87 4.08 ± 0.42 3.92 ± 0.57 (*) NS NS
NectarN (10 m-2
) 13.17 ± 1.09 14.17 ± 1.72 16.08 ± 0.76 NS NS NS
Thistles (750 m-2
) 11.00 ± 5.88 16.17 ± 4.30 4.83 ± 2.39 NS NS NS
HN (50 m-1
) 5.17 ± 0.95 6.67 ± 0.49 6.83 ± 0.48 NS NS NS
HE (50 m-1
) 0.50 ± 0.10 0.73 ± 0.04 0.76 ± 0.05 (*) NS NS
Patchiness‡ (750 m-2
) 6.00 ± 0.58b 13.33 ± 1.20
a 8.33 ± 1.76
ab *
† The response variable was log-transformed prior to analysis ‡ Analysis refers to the aerial image of 2010 and was only tested for treatment effects
In separate models of structural variables, the proportion of tall patches and bimodality
correlated significantly with all insect diversity measures (Table 4).
Table 4 Results of separate mixed effects models for butterfly and grasshopper species numbers and abundance in relation to sward structure variables. Shown are the estimates (Est.) of remaining variables and corresponding P-values. CSH = compressed sward height, PlantSpR= plant species richness, NectarN = number of nectar plant species, Thistles = number of thistles, HE = evenness of surface height classes.
Grasshoppers Butterflies
Variable Species Richness Abundance* Species Richness Abundance
Est. P Est. P Est. P Est. P
CSH 0.494† < 0.0001 0.759‡ < 0.0001 0.197 0.2480 1.497 0.0240
PlantSpR 0.262† 0.2302 0.777‡ 0.0285 -0.561 0.1628 -2.091 0.2962
Openness -0.106† 0.0671 -0.231‡ 0.0246 -0.136 0.4347 -0.346 0.7161
NectarN 0.121† 0.2950 0.280‡ 0.0921 0.181 0.2013 1.193 0.0513
Thistles -0.019¶ 0.0612 -0.044‡ 0.0090 0.075 0.0107 0.430¶ 0.0003
Tall patches 0.042‡ 0.0009 0.061§ 0.0007 0.038 0.0329 0.168 0.0273
HE 3.218 0.0651 6.435§ 0.0029 3.697 0.1205 22.622 0.0279
Patchiness 0.224¶ 0.0767 0.335§ 0.0684 0.269 0.0481 0.932 0.1569
Bimodality 2.308§ 0.0052 3.009§ 0.0113 2.425 0.0043 10.683 0.0126
* Data were square root-transformed pre-analysis † The variance structure varPower was implemented in the model (using the fitted values in the structure) ‡ The variance structure varExp was implemented in the model (using the fitted values in the structure) ¶ The variance structure varIdent was used in the model (allowing for differing variances for each treatment) § The variance structure varIdent was used in the model (allowing for differing variances for each year)

CHAPTER I
26
Botanical species richness showed a significant positive correlation only to grasshopper
abundance. Height class evenness was positively associated with number of insect
individuals and with grasshopper species richness by trend. Butterfly species richness was
related to patchiness, as were grasshopper measures by trend. Variables that were included
in multiple regression models are listed in Table 5.
Table 5 Results of simplified multiple regression models for butterfly and grasshopper species numbers (F-statistic) (NumDF = numerator degrees of freedom, DenDF = denominator degrees of freedom). CSH = compressed sward height, HE = evenness of surface height classes, PlantSpR= plant species richness, NectarN = number of nectar plant species, Thistles = number of thistles.
Species Richness Abundance
NumDF DenDF F P NumDF DenDF F P
Grasshoppers
CSH 1* 24 90.740 < 0.0001 1†‡ 24 118.889 < 0.0001
HE 1 24 0.440 0.5132 1 24 4.550 0.0433
Patchiness 1 5 7.039 0.0453 1 5 4.346 0.0479
Openness -¶ - - - 1 24 6.817 0.0476
PlantSpR 1 24 2.828 0.1056 - - - -
Butterflies
CSH 1 25 9.909 0.0042 -§ - - -
HE - - - - 1 24 18.427 0.0003
Patchiness 1 5 13.319 0.0148 - - - -
NectarN - - - - 1 24 7.500 0.0114
Thistles 1 25 10.993 0.0028 1 24 39.613 < 0.0001
* The variance structure varPower was implemented in the model (using the fitted values in the structure) † Grasshopper abundance was square root-transformed pre-analysis ‡ The variance structure varExp was implemented in the model (using the fitted values in the structure) ¶ ’-‘Terms were eliminated during model simplification § The variance structure varIdent was used in the model (allowing for differing variances for each treatment)
As bimodality correlated strongly with patchiness and tall patches with CSH, these terms
were left out of the analysis. The multiple regression of grasshopper species richness
revealed the importance of CSH in addition to a significant effect of patchiness. Grasshopper
abundance was also mainly affected by CSH, although height class evenness, sward
openness and patchiness were also significant. The abundance of thistles and CSH were the
best predictors for butterfly species richness. Furthermore, patchiness affected species
numbers significantly. In addition to an effect of nectar species numbers, the incidence of
thistles and height class evenness had a clear impact on butterfly abundance.
CHAPTER I
27
Discussion
The present study clearly confirms the detrimental effects of intensive grazing on
butterfly and grasshopper diversity (Kruess & Tscharntke 2002; WallisDeVries et al. 2007;
Eschen et al. 2012). Interestingly, the species richness and abundance of insects did not
significantly differ and showed even higher values on LC than on VLC in most cases. In the
following subsections, we are going to consider the differing possibilities proposed to
influence grasshopper and butterfly species richness and abundance.
Phytodiversity
Plant diversity was investigated as a potential predictor as it is presumed to have a
bottom-up effect on insect diversity, that is, the more plant species, the higher the insect
diversity (Siemann 1998; Haddad et al. 2009). However, our data did not show a clear effect
of grazing intensity on plant species richness (Table 3), an observation also found by other
studies (Kruess & Tscharntke 2002; Eschen et al. 2012). Likewise, botanical species richness
did not consistently affect insect indices (Tables 4 and 5).
One exception was butterfly abundance, which was positively influenced by nectar
resources due to the butterflies’ dependence on nectar (e.g. Clausen et al. 2001;
WallisDeVries et al. 2012). Moreover, Zhu et al. (2012) stated that the positive relationship
between plant and insect diversity can be altered fundamentally by grazing.
Although in this investigation only adult insects were recorded, we analysed host plant
availability for caterpillars in 2011 but found no difference between treatments.
Sward height
Resource-productivity (Siemann 1998) and resource-diversity hypotheses (Lawton 1983)
both suggest that taller swards enhance herbivore diversity by providing more biomass
(resource-productivity hypothesis) or more microclimate and feeding niches (resource-
diversity hypothesis). In the latter hypothesis, the distribution of sward height classes in this
study indicated that the tallest sward did not provide significantly more niches than the
intermediate treatment. Thus, although taller swards can potentially provide more diverse
microclimates (Dennis et al. 1998), the proportion of tall patches at an intermediate grazing

CHAPTER I
28
intensity of ~10 cm CSH seems to be adequate to cover the whole array of required vertical
sward heterogeneity.
The intermediate-disturbance hypothesis, which predicts the largest diversity at a
medium level of disturbance (Connell 1978), seems to provide a better explanation of our
data. In line with this hypothesis, Pöyry et al. (2006) showed that butterfly diversity peaked
at an intermediate sward height, which was taken as an indicator of grazing intensity.
Likewise, the grasshopper species Chorthippus albomarginatus, C. parallelus and C. brunneus
were found to prefer an intermediate CSH of 10–20 cm (Gardiner et al. 2002), which is in line
with the highest diversity values we found on LC and VLC with CSH values of 10 and 12 cm,
respectively (Table 3).
Spatial heterogeneity
The spatial heterogeneity of the sward was found to be a key feature for insect diversity,
which is consistent with many other studies of cattle grazing, particularly under continuous
grazing (Gibb et al. 1997; Cid & Brizuela 1998; Dumont et al. 2007). Nevertheless, in most
studies with reference to insect diversity, sward heterogeneity was determined using
measures such as variance, standard deviation, standard error or coefficient of variation (as
seen e.g. in Morris et al. 1999; Correll et al. 2003; Cole et al. 2010; Eschen et al. 2012). Even
though these measures can describe vertical heterogeneity, they cannot be used sufficiently
for the characterization of the spatial arrangement of sward heights in terms of patches.
Indeed, these terms are not necessarily connected; for example, Guo et al. (2004) reported
that spatial and vertical heterogeneity can be influenced differently by grazing: whereas
ungrazed plots showed a higher vertical heterogeneity, grazed plots were spatially more
heterogeneous. Instead of using a relative measure like the coefficient of variation, we
regarded sward height class evenness as an adequate measure for vertical sward
heterogeneity in terms of an even distribution of different microclimates. In addition, we
assessed spatial heterogeneity via ArcGIS. In our study, this spatial patchiness was clearly
enhanced by the more extensive treatments, in particular by the intermediate grazing
intensity. This is not only reflected by the number of patches recorded but also by the
bimodal sward height distribution seen in the aerial photograph.
As insect species have different habitat requirements (Guido & Gianelle 2001; Potts et
al. 2009), heterogeneous swards can offer adequate conditions for a large array of species

CHAPTER I
29
(habitat heterogeneity hypothesis, Dennis et al. 1998), both applying for butterflies (Clausen
et al. 2001) and grasshoppers (Gardiner & Hill 2004). Tall areas experience smaller
fluctuations in temperature, but offer more forage and shelter (Gardiner et al. 2002).
Managing pastures extensively resulting in a patchy structure would therefore not only
favour insect herbivores of short or tall grassland but also species benefitting from both
structural forms (Gardiner et al. 2002; WallisDeVries et al. 2007; Cole et al. 2010; Weiss et al.
2012). For these reasons, the creation of a heterogeneous sward is regarded as one of the
key issues for preserving biodiversity of grasslands (Clausen et al. 2001; Benton 2003; Rook
& Tallowin 2003; Dumont et al. 2009), which can be clearly confirmed in this study.
Long-term development
Our results showed an enhanced long-term development of grasshopper abundance on
LC plots. This could be due to the higher patch stability over years on LC in contrast to MC.
On intensive pastures, tall patches occur exclusively around dung pats and are, as a result,
ephemeral (Gibb & Ridout 1988). Though these areas can act as refugia for arthropods, they
are isolated islets (Helden et al. 2010) not habitat networks. On the contrary, tall patches on
extensive pastures are mainly maintained due to lower forage quality (Adler et al. 2001;
Dumont et al. 2007) and are thus more stable and persistent across years (Marion et al.
2010; Rossignol et al. 2011; Dumont et al. 2012). Consequently, there is a larger probability
that oviposition sites are not destroyed and offer forage and shelter for the next
generations. Furthermore, individuals living on these more or less stable patches do not
suffer from habitat fragmentation and changing conditions mediated by intensive grazing or
altered management. This would be detrimental in particular for the endangered
grasshopper C. montanus, the second most-dominant species in our experiment, which is
strongly dependent on its local habitat and not able to cross large distances (Weyer et al.
2012). Our data strongly support the advantage of continued long-term management on this
species and also for the butterfly M. galathea (Fig. 4). Additionally, stable patches offer
different conditions for plant survival and establishment, thereby enabling the development
of distinguishable patch-dependent vegetation compositions (Correll et al. 2003; Marion et
al. 2010; Wrage et al. 2012). This could further enhance diverse insect assemblages and
would thus constitute an added effect of patchiness on biodiversity on top of the more
structural differences.

CHAPTER I
30
Management suggestions
Pasture management should aim for a heterogeneous sward structure with a slight
emphasis on tall patches, which can be achieved at intermediate grazing intensity (stocking
rate: ~ 1 SLU ha-1 under the conditions of this study). This management regime provides
diverse microhabitats for grasshoppers and butterflies, which, in turn, should also enhance
higher trophic levels of biodiversity (Vickery et al. 2001). In order to meet these aims, further
reduction in stocking rates is not required, as our results have shown and therefore a
sustainable combination of conservation issues and agronomic targets can be achieved.
However, larger pastures and animal herd sizes can produce results that differ from those of
this study. Here, we used relatively small paddocks with only a few grazing individuals, and
social interactions across fences were likely. Nonetheless, paddocks of 1-ha in size are not
unusual in the study region, where grassland plots are smaller than 2 ha on average (e.g.
Klimek et al. 2008). Continuous extensive grazing systems should be managed in the same
way across years. This management regime can be very valuable for the long-term insect
population development by providing secure habitat networks for less mobile, structure-
sensitive insects such as grasshoppers.

CHAPTER I
31
Acknowledgements
The research leading to these results has received funding from the European
Community’s Seventh Framework Programme (FP7/2007-2013) under the Grant Agreement
No. FP7-244983 (MULTISWARD). The field experiment was initiated and first results from
2002 to 2004 obtained within the EU project QLK5-2001-00130 ‘Integrating foraging
attributes of domestic livestock breeds into sustainable systems for grassland biodiversity
and wider countryside benefits (FORBIOBEN). We gratefully acknowledge our technician
Barbara Hohlmann and our partners at the experimental farm Relliehausen, especially Arne
Oppermann and Knut Salzmann. We are very grateful to Michael Sayer (deceased) for his
great effort in insect species identification in the earlier years of this study. Furthermore, we
thank Christoph Scherber for statistical advice.

CHAPTER I
32
Supporting Information
Table S1 Proportion (%) of species to grasshopper composition. Distribution of each species is shown for the long term data set including treatments MC (moderate grazing) and LC (lenient grazing) and for all treatments (MC, LC, VLC: very lenient grazing) in years 2010 and 2011.
2002-2011
2010-2011
Species MC LC
MC LC VLC
Chorthippus albomarginatus 15.52 43.51
9.74 25.03 25.03
Chorthippus biguttulus* 0.86 2.02
0.29 1.16 2.45
Chorthippus dorsatus 0.13 0.26
0 0 0
Chorthippus montanus 4.17 25.28
1.62 13.63 12.31
Chorthippus parallelus 0.21 2.79
0.17 1.91 1.91
Chorthippus sp. (escaped) 0.30 0.69
0.08 0.41 0.41
Metrioptera roeselii 0.34 3.22
0.21 1.41 1.28
Omocestus viridulus 0 0.52
0 0.46 0.37
Tettigonia cantans 0 0.04
0 0.04 0.04
Tettigonia viridissima 0.04 0.09
0 0 0.04
* Including C. biguttulus, C. brunneus and C. mollis, which were not distinguished in the field.
Table S2 Proportion (%) of species to butterfly composition. Distribution of each species is shown for the long term data set including treatments MC (moderate grazing) and LC (lenient grazing) and for all treatments (MC, LC, VLC: very lenient grazing) in years 2010 and 2011.
2002-2011
2010-2011
Species MC LC
MC LC VLC
Aglais urticae 5.32 3.93
3.38 3.25 3.95
Aphantopus hyperantus 0.16 0.80
0.26 0.91 2.82
Araschnia levana 0.08 0.00
0 0 0
Argynnis paphia 1.15 0.96
0.09 0.69 0.22
Coenonympha pamphilus 0.56 1.58
0.65 2.12 1.78
Colias croceus 0.00 0.05
0 0.09 0.09
Colias hyale 0.35 0.32
0.13 0.35 0.09
Gonepteryx rhamni 0.11 0.37
0.09 0.35 0.09
Inachis io 2.49 0.94
0.17 0.26 0
Lycaena phlaeas 0.08 0.00
0 0 0
Maniola jurtina 21.20 30.37
7.46 11.19 10.10
Melanargia galathea 0.67 2.65
1.08 4.21 4.25
Nymphalis c-album 0 0
0 0 0.09
Papilio machaon 0.00 0.05
0 0.09 0
Pieris spp.* 3.93 3.61
2.30 3.17 3.43
Polyommatus icarus 4.54 6.60
4.94 7.24 7.46
Polyommatus cf. thersites 0.00 0.08
0 0.13 0
Thymelicus sylvestris 0.80 2.57
1.30 3.73 4.77
Vanessa atalanta 0.35 0.56
0.35 0.56 0
Vanessa cardui 1.26 1.52
0 0.22 0.13
* Including P. brassicae, P. napi and P.rapae, which were not distinguished in the field.
CHAPTER I
33
References
Abramoff, M., Magalhaes, P. & Ram, S. (2004) Image processing with ImageJ. Biophotonics International, 11, 36–42.
Adler, P., Raff, D. & Lauenroth, W. (2001) The effect of grazing on the spatial heterogeneity of vegetation. Oecologia, 128, 465–479.
Akaike, H. (1973) Information theory and an extension of the maximum likelihood principle. Second International Symposium on Information Theory (eds B.N. Petrov & F. Csaki), pp. 267–281. Akademiai Kiado, Budapest, Hungary.
Bellmann, H. (2006) Der Kosmos-Heuschreckenführer. Kosmos, Stuttgart.
Benton, T. (2003) Farmland biodiversity: is habitat heterogeneity the key? Trends in Ecology & Evolution, 18, 182–188.
Bircham, J.S. (1981) Herbage growth and utilization under continuous stocking management. Ph.D. thesis, University of Edinburgh.
Castle, M.E. (1976) A simple disc instrument for estimating herbage yield. Grass and Forage Science, 31, 37–40.
Cid, M. & Brizuela, M. (1998) Heterogeneity in tall fescue pastures created and sustained by cattle grazing. Journal of Range Management, 51, 644–649.
Clausen, H., Holbeck, H. & Reddersen, J. (2001) Factors influencing abundance of butterflies and burnet moths in the uncultivated habitats of an organic farm in Denmark. Biological Conservation, 98, 167–178.
Cole, L.J., Pollock, M.L., Robertson, D., Holland, J.P., McCracken, D.I. & Harrison, W. (2010) The influence of fine-scale habitat heterogeneity on invertebrate assemblage structure in upland semi-natural grassland. Agriculture, Ecosystems & Environment, 136, 69–80.
Connell, J.H. (1978) Diversity in tropical rain forests and coral reefs. Science, 199, 1302–1310.
Correll, O., Isselstein, J. & Pavlu, V. (2003) Studying spatial and temporal dynamics of sward structure at low stocking densities: the use of an extended rising-plate-meter method. Grass and Forage Science, 58, 450–454.
Dennis, P., Young, M.R. & Gordon, I.J. (1998) Distribution and abundance of small insects and arachnids in relation to structural heterogeneity of grazed, indigenous grasslands. Ecological Entomology, 23, 253–264.
Dumont, B., Farruggia, A., Garel, J.-P., Bachelard, P., Boitier, E. & Frain, M. (2009) How does grazing intensity influence the diversity of plants and insects in a species-rich upland grassland on basalt soils? Grass and Forage Science, 64, 92–105.
Dumont, B., Garel, J.P., Ginane, C., Decuq, F., Farruggia, A., Pradel, P., Rigolot, C. & Petit, M. (2007) Effect of cattle grazing a species-rich mountain pasture under different stocking rates on the dynamics of diet selection and sward structure. Animal, 1, 1042.
Dumont, B., Rossignol, N., Loucougaray, G., Carrère, P., Chadoeuf, J., Fleurance, G., Bonis, A., Farruggia, A., Gaucherand, S., Ginane, C., Louault, F., Marion, B., Mesléard, F. & Yavercovski, N. (2012) When does grazing generate stable vegetation patterns in temperate pastures? Agriculture, Ecosystems & Environment, 153, 50–56.
Ebert, G. (1991) Die Schmetterlinge Baden-Württembergs: Band 2 Tagfalter II. Ulmer, Stuttgart (Hohenheim).
Erhardt, A. (1985) Diurnal Lepidoptera: Sensitive indicators of cultivated and abandoned grassland. Journal of Applied Ecology, 22, 849–861.

CHAPTER I
34
Eschen, R., Brook, A.J., Maczey, N., Bradbury, A., Mayo, A., Watts, P., Buckingham, D., Wheeler, K. & Peach, W.J. (2012) Effects of reduced grazing intensity on pasture vegetation and invertebrates. Agriculture, Ecosystems & Environment, 151, 53–60.
Gardiner, T. & Hill, J. (2004) Directional dispersal patterns of Chorthippus parallelus (Orthoptera: Acrididae) in patches of grazed pastures. Journal of Orthoptera Research, 13, 135–141.
Gardiner, T., Pye, M., Field, R. & Hill, J. (2002) The influence of sward height and vegetation composition in determining the habitat preferences of three Chorthippus species (Orthoptera: Acrididae) in Chelmsford, Essex, UK. Journal of Orthoptera Research, 11, 207–213.
Gibb, M.J., Huckle, C.A., Nuthall, R. & Rook, A.J. (1997) Effect of sward surface height on intake and grazing behaviour by lactating Holstein Friesian cows. Grass and Forage Science, 52, 309–321.
Gibb, M.J. & Ridout, M.S. (1988) Application of double normal frequency distributions fitted to measurements of sward height. Grass and Forage Science, 43, 131–136.
Guido, M. & Gianelle, D. (2001) Distribution patterns of four Orthoptera species in relation to microhabitat heterogeneity in an ecotonal area. Acta Oecologica, 22, 175–185.
Guo, X., Wilmshurst, J.F., McCanny, S., Fargey, P. & Richard, P. (2004) Measuring spatial and vertical heterogeneity of grasslands using remote sensing techniques. Journal of Environmental Informatics, 3, 24–32.
Haddad, N.M., Crutsinger, G.M., Gross, K., Haarstad, J., Knops, J.M. & Tilman, D. (2009) Plant species loss decreases arthropod diversity and shifts trophic structure. Ecology Letters, 12, 1029–1039.
Hall, M. (1981) Butterfly monitoring scheme: Instructions for independent recorders. Institute of Terrestrial Ecology, Cambridge.
Hampicke, U. (2013) Kulturlandschaft und Naturschutz: Probleme-Konzepte-Ökonomie. Springer Spektrum, Wiesbaden.
Helden, A.J., Anderson, A., Sheridan, H. & Purvis, G. (2010) The role of grassland sward islets in the distribution of arthropods in cattle pastures. Insect Conservation and Diversity, 3, 291–301.
Isselstein, J., Griffith, B.A., Pradel, P. & Venerus, S. (2007) Effects of livestock breed and grazing intensity on biodiversity and production in grazing systems. 1. Nutritive value of herbage and livestock performance. Grass and Forage Science, 62, 145–158.
Jerrentrup, J.S., Wrage-Mönnig, N., Röver, K.-U. & Isselstein, J. (2014) Data from: Grazing intensity affects insect diversity via sward structure and heterogeneity in a long-term experiment. Dryad Digital Repository, doi: 10.5061/dryad.d9q57.
Kruess, A. & Tscharntke, T. (2002b) Grazing intensity and the diversity of grasshoppers, butterflies, and trap-nesting bees and wasps. Conservation Biology, 16, 1570–1580.
Lawton, J.H. (1983) Plant architecture and the diversity of phytophagous insects. Annual Review of Entomology, 28, 23–39.
Littlewood, N.A., Steward, A.J.A. & Woodcock, B.A. (2012) Science into practice - how can fundamental science contribute to better management of grasslands for invertebrates? Insect Conservation and Diversity, 5, 1–8.
Magurran, A.E. (2004) Measuring biological diversity. Blackwell, Oxford.
Marion, B., Bonis, A. & Bouzillé, J.-B. (2010) How much does grazing-induced heterogeneity impact plant diversity in wet grasslands? Ecoscience, 17, 229–239.
Marriott, C., Hood, K., Fisher, J. & Pakeman, R. (2009) Long-term impacts of extensive grazing and abandonment on the species composition, richness, diversity and productivity of agricultural grassland. Agriculture, Ecosystems & Environment, 134, 190–200.
Milchunas, D.G., Sala, O.E. & Lauenroth, W.K. (1988) A generalized model of the effects of grazing by large herbivores on grassland community structure. The American Naturalist, 132, 87–106.

CHAPTER I
35
Morris, C., Derry, J. & Hardy, M. (1999) Effect of cattle and sheep grazing on the structure of Highland Sourveld swards in South Africa. Tropical Grasslands, 33, 111–121.
Parsons, A.J. & Dumont, B. (2003) Spatial heterogeneity and grazing processes. Animal Research, 52, 161–179.
Pinheiro, J., Bates, D., DebRoy, S., Sarkar, D. & R Development Core Team (2012) nlme: Linear and nonlinear mixed effects Models. R package version 3.1-103.
Pollard, E. (1977) A method for assessing changes in the abundance of butterflies. Biological Conservation, 12, 115–134.
Potts, S.G., Woodcock, B.A., Roberts, S.P.M., Tscheulin, T., Pilgrim, E.S., Brown, V.K. & Tallowin, J.R. (2009) Enhancing pollinator biodiversity in intensive grasslands. Journal of Applied Ecology, 46, 369–379.
Pöyry, J., Luoto, M., Paukkunen, J., Pykälä, J., Raatikainen, K. & Kuussaari, M. (2006) Different responses of plants and herbivore insects to a gradient of vegetation height: an indicator of the vertebrate grazing intensity and successional age. Oikos, 115, 401–412.
R Development Core Team (2012) R. R Foundation for Statistical Computing, Vienna, Austria.
Rook, A., Dumont, B., Isselstein, J., Osoro, K., WallisDeVries, M., Parente, G. & Mills, J. (2004) Matching type of livestock to desired biodiversity outcomes in pastures – a review. Biological Conservation, 119, 137–150.
Rook, A.J. & Tallowin, J.R. (2003) Grazing and pasture management for biodiversity benefit. Animal Research, 52, 181–189.
Rossignol, N., Chadoeuf, J., Carrère, P. & Dumont, B. (2011) A hierarchical model for analysing the stability of vegetation patterns created by grazing in temperate pastures. Applied Vegetation Science, 14, 189–199.
Siemann, E. (1998) Experimental tests of effects of plant productivity and diversity on grassland arthropod diversity. Ecology, 79, 2057–2070.
Silvertown, J. & Smith, B. (1989) Germination and population structure of spear thistle Cirsium vulgare in relation to experimentally controlled sheep grazing. Oecologia, 81, 369–373.
Sjödin, N.E., Bengtsson, J. & Ekbom, B. (2008) The influence of grazing intensity and landscape composition on the diversity and abundance of flower-visiting insects. Journal of Applied Ecology, 45, 763–772.
Stoate, C., Báldi, A., Beja, P., Boatman, N., Herzon, I., van Doorn, A., Snoo, G. de, Rakosy, L. & Ramwell, C. (2009) Ecological impacts of early 21st century agricultural change in Europe – A review. Journal of Environmental Management, 91, 22–46.
Thomas, J.A. (2005) Monitoring change in the abundance and distribution of insects using butterflies and other indicator groups. Philosophical Transactions of the Royal Society B: Biological Sciences, 360, 339–357.
Van den Pol-van Dasselaar, A., Vellinga, T., Johansen, A. & Kennedy, E. (2008) To graze or not to graze, that's the question. Grassland Science in Europe, 13, 706–716.
Van Sway, C.A.M., van Strien, A., Harpke, A. & Fontaine, B. (2013) The European Grassland Butterfly Indicator: 1990–2011. EEA technical report.
Vickery, J., Tallowin, J., Feber, R., Asteraki, E., Atkinson, P., Fuller, R. & Brown, V. (2001) The management of lowland neutral grasslands in Britain: effects of agricultural practices on birds and their food resources. Journal of Applied Ecology, 38, 647–664.
WallisDeVries, M.F., Parkinson, A.E., Dulphy, J.P., Sayer, M. & Diana, E. (2007) Effects of livestock breed and grazing intensity on biodiversity and production in grazing systems. 4. Effects on animal diversity. Grass and Forage Science, 62, 185–197.

CHAPTER I
36
WallisDeVries, M.F., Van Swaay, C.A.M. & Plate, C.L. (2012) Changes in nectar supply: A possible cause of widespread butterfly decline. Current Zoology, 58, 384–391.
Weiss, N., Zucchi, H. & Hochkirch, A. (2012) The effects of grassland management and aspect on Orthoptera diversity and abundance: site conditions are as important as management. Biodiversity and Conservation, 22, 2167–2178.
Wettstein, W. & Schmid, B. (1999) Conservation of arthropod diversity in montane wetlands: effect of altitude, habitat quality and habitat fragmentation on butterflies and grasshoppers. Journal of Applied Ecology, 36, 363–373.
Weyer, J., Weinberger, J. & Hochkirch, A. (2012) Mobility and microhabitat utilization in a flightless wetland grasshopper, Chorthippus montanus (Charpentier, 1825). Journal of Insect Conservation, 16, 379–390.
Wrage, N., Şahin Demirbağ, N., Hofmann, M. & Isselstein, J. (2012) Vegetation height of patch more important for phytodiversity than that of paddock. Agriculture, Ecosystems & Environment, 155, 111–116.
Zhu, H., Wang, D., Wang, L., Bai, Y., Fang, J. & Liu, J. (2012) The effects of large herbivore grazing on meadow steppe plant and insect diversity. Journal of Applied Ecology, 49, 1075–1083.

CHAPTER II
37
CHAPTER II
Vegetation composition and diversity of different
sward types is mainly unaffected after five years of
rotationally grazing by cattle and/or sheep
Jerrentrup, Jana Sabrina; Seither, Melanie; Petersen, Ute; Isselstein, Johannes
Submitted to Agriculture, Ecosystems & Environment

CHAPTER II
38
Abstract
To maintain and enhance phytodiversity of complex permanent swards, the choice of
livestock is still debated. In this study, vegetation composition, diversity and sward structure
of permanent grassland were investigated in response to cattle, sheep or mixed grazing on
two sward types differing in composition. The study was conducted in the Solling Uplands in
Lower Saxony, Germany, in a triplicate randomized block design. The experimental site
belongs to the plant association Lolio-Cynosuretum and is moderately species-rich. One half
of the paddocks was treated with herbicides to achieve grass-dominated, species-poor
swards (2007: 6.9 ± 1.5 species m-2, means ± sd) in contrast to the diverse controls (10.3 ±
2.9 species m-2). Paddocks were grazed rotationally in three grazing cycles per year from
2007-2011; the vegetation was analyzed from 2007-2012. Vegetation composition showed a
clear effect of herbicide-treatment, but was not significantly influenced by grazers within or
after five years of grazing. Effects of complementary grazing of cattle and sheep in mixed
stocking could not be confirmed. The study revealed only minor effects of grazers that were
not consistently found: sward structure measured as coefficient of variation of sward height
was more heterogeneous in the second grazing cycle 2011 under cattle grazing in contrast to
sheep grazing. In addition, the cattle-grazed diverse swards contained more species than the
sheep-grazed ones in 2012. These results point towards a slight advantage of cattle grazing
for the diversity of European grasslands in common agricultural practice.

CHAPTER II
39
Introduction
Grasslands belong to the most biodiverse agroecosystems in Europe (Rook et al. 2004).
Management affects grassland diversity (Wrage et al. 2011) and in the past species richness
declined due to agricultural intensification on the one hand or abandonment on the other
(Henle et al. 2008). For the maintainance and restoration of diversity, an appropriate
management aiming at the sustainable use while also fulfilling farmer’s interests, is
mandatory (Watkinson & Ormerod 2001).
As management option, grazing is seen as one of the most important tools promoting
grassland diversity (Rook et al. 2004; Vickery et al. 2001; Wrage et al. 2011) and can enhance
vegetation dynamics and (re-) establishment of plant species more than other management
practices (Kahmen et al. 2002). Livestock influences pastures in several ways, in particular by
selective defoliation, treading and excreta deposition (Wrage et al. 2011). Selective foraging
exerts a local control on competitive plant species enabling subordinate species to coexist
(Grime & Mackey 2002), whereas treading and subsequent small-scale soil disturbances can
be beneficial by creating niches for gap-colonising species (Hofmann & Isselstein 2004).
Cattle and sheep differ in their selectivity and forage quality requirements and can thereby
influence vegetation composition and diversity (Fraser et al. 2011; Rook et al. 2004; Wrage
et al. 2011). Sheep bite with their incisors and are therefore able to graze close to the
ground and to select single plants or even preferable plant parts of high quality and
palatability. In contrast cattle wrap forage with their tongue. Due to their body size and
demand of a larger forage quantity, they cannot display this scale and degree of selectivity,
but are in return able to cope with forage of a lower quality (Illius & Gordon 1987; Rook et
al. 2004). Compared to cattle, grazing with sheep may lead to an increase in grasses
(Dumont et al. 2011; Sebastià et al. 2008), while forbs and legumes decrease (Nolan et al.
2001) due to higher selectivity of sheep for these plants. As a result of selective grazing,
sheep might utilize vegetation more uneven and consequently lead to a lower plant
diversity. In this context Sebastià et al. (2008) found sheep to decrease vegetation
heterogeneity but to facilitate the presence of plant species with conservation value.
However, selectivity is also affected by the abundance of preferred plants and at low
occurrences foraging costs might be too high (Dumont et al. 2002). The increase of sward
heterogeneity usually created by cattle grazing is seen as a key issue in preserving grasslands

CHAPTER II
40
biodiversity (Rook et al. 2004). Cattle avoid foraging around their dung pats (Forbes &
Hodgson 1985) and perform patch grazing (Adler et al. 2001) thereby creating different
habitat types and subsequently promoting the coexistence of different plant compositions
(Marion et al. 2010).
Utilization of pastures might be maximized when livestock species are combined in
mixed grazing, which was investigated in many studies (e.g. Abaye et al. 1997; Critchley et al.
2008; Fraser et al. 2013; Loucougaray et al. 2004; Nolan et al. 2001; Murphy et al. 1995).
Complementary grazing of cattle and sheep could be beneficial from an agronomic point of
view: sheep are indeed more selective, but graze closer to cattle dung pats than cattle do
(Forbes & Hodgson 1985). This complementarity should allow a better utilization of pastures
resulting in a structurally more homogeneous, uniform sward (Forbes & Hodgson 1985).
Grazer effects on diversity were often found in observational studies (Sebastià et al.
2008; Socher et al. 2013) and compositional changes detected on sown or relatively species-
poor swards (Abaye et al. 1997; Nolan et al. 2001; White & Knight 2007; Wright et al. 2006).
There is only little knowledge about these effects in relation to controlled, replicated
experiments, in particular considering complex permanent swards (Stewart & Pullin 2008).
This study aims to fill this gap and compares the effect of cattle and sheep grazing alone or
together over five years on permanent grassland swards differing in diversity and
composition. To achieve different sward types, one half of the paddocks was treated with
herbicides to remove dicotyledonous plants (forbs and legumes) thereby creating swards of
poor species richness and composition comparable to intensive grasslands. As suggested by
Petersen et al. (2012) this method is recommended to create swards differing in diversity, as
there are little disturbances of the natural sward composition in the years after treatment.
The sprayed sward is therefore comparable to an intensified part of the diverse sward but
still representative for agriculturally used grasslands in Europe (Petersen et al. 2012).
We addressed the following hypotheses:
Species composition differs between sheep- and cattle-grazed paddocks. This effect
is more severe on diverse paddocks since selectivity is a function of the abundance of
preferred plant species.
Sheep paddocks are as a result of the high selectivity of sheep expected to display a
lower diversity and evenness, particularly on diverse paddocks.

CHAPTER II
41
Due to stronger dung avoidance and patch grazing of cattle, the beta diversity
supposed to be higher on cattle than on sheep paddocks
The sward structure on both sward types is expected to be more uniform with mixed
grazing indicating complementary grazing. Cattle create structurally more
heterogeneous swards.

CHAPTER II
42
Material and Methods
The experimental site, 9 ha in total, is a moderately species rich Lolio-Cynosuretum,
located in the Solling Uplands, Germany (51°46´4” N, 9°42´11” E; the altitude of the total
area ranges from 184 to 209 m above sea level). The site had been managed as a mown
pasture with varying proportions of cattle and sheep for more than 16 years before the start
of the experiment. Light manure was applied regularly to the total area; however, not all
parts of the site were completely accessible for mowing or application of manure. Swards
were dominated by Dactylis glomerata (22%), Lolium perenne (15%) and Taraxacum sect.
Ruderale (13%). The soil type is a pelosol with a texture of silty / clay loam. The average
annual precipitation is 879 mm and the average temperature 8.2°C (1961-1990, Deutscher
Wetterdienst, DWD, Location: Dassel – 3 km from the experimental site). To characterize
initial soil conditions, composite soil samples (consisting of eight subsamples) were taken
around five randomly distributed permanent plots per paddock (also used for vegetation
relevés) to a depth of 10 cm (P, K, Mg; July 2007) and 30 cm (mineral N analysis; October
2007). The pH of the soil (in CaCl2 suspension) as well as the availability of P, K (extracted
with calcium acetate lactate, continuous flow analyser [CFA]), Mg (CaCl2 extraction, CFA) and
mineral N (KCl extraction, CFA) showed the large variability typical for pastures (pH: 6.8 ±
0.3; in mg 100 g-1 dry matter: P: 7.9 ± 3.2, K: 17.4 ± 4.9, Mg: 35.8 ± 8.4, NO3-: 0.5 ± 0.1, NH4
+:
0.2 ± 0.01, means ± standard deviation, sd).
Two factors were introduced: the botanical composition and the species of grazer. The
initial composition of the sward was manipulated in summer 2006, prior to the start of the
experiment, by the use of a herbicide against dicotyledonous plants (Starane Ranger and
Duplosan KV, active components Fluroxypyr/Triclopyr and Mecoprop-P) resulting in a grass-
dominated (gd) sward (2007: 6.9 ± 1.5 species m-2, means ± sd) compared to the untreated
diverse (div) sward (10.3 ± 2.9 species m-2) (referred to as ‘sward types’ in the following). In
autumn 2009 gd-swards were treated again with herbicides to maintain sward
differentiation.
Both diversity treatments were either grazed by sheep (S), cattle (C) or both (CS)
(referred to as ‘grazers’ in the following) in years 2007-2011, starting each year in May.
Grazing cattle were suckler cows and calves of the breed German Simmental. Ewes with
lambs were Blackheaded and Leine sheep in comparable proportions. The combination of

CHAPTER II
43
both experimental factors resulted in six treatments (gdC, gdS, gdCS, divC, divS, divCS)
replicated three times in blocks that were rotationally grazed three times per year. Animals
were assigned to 0.5 ha paddocks on a live weight basis using 3000 kg each (12 LU ha-1,
LU=livestock units: 500 kg) for the first grazing cycle. For mixed grazed paddocks, sheep and
cattle were used in equal weight proportions. Grazing was continued with the same livestock
in the second grazing cycle and reduced to 2000 kg (8 LU ha-1) in the third grazing cycle to
adapt to slower vegetation growth. The grazing period typically lasted from beginning of
May to September/October with a break in between after the second grazing cycle for
animal mating varying yearly between 5 and 11 weeks. The grazing time in each rotation
cycle depended on the herbage on offer (Table 6).
Table 6 Grazing days of livestock for each year and grazing cycle (means ± sd). Mixed paddocks were stocked with sheep and cattle accordingly.
Grazing cycle 1 Grazing cycle 2 Grazing cycle 3
Year Sheep Cattle Sheep Cattle Sheep Cattle
2007 9.7 ± 1.9 10.3 ± 2.5 8.3 ± 2.1 8.7 ± 1.7 12.3 ± 0.5 12.7 ± 0.5
2008 8.7 ± 2.4 8.0 ± 2.2 5.0 ± 2.2 5.3 ± 2.4 13.3 ± 0.5 13.0 ± 0.8
2009 11.3 ± 1.2 11.7 ± 1.2 2.7 ± 2.1 2.7 ± 2.1 11.3 ± 1.7 11.0 ± 1.6
2010 7.0 ± 0.8 6.7 ± 0.9 5.0 ± 1.4 5.3 ± 1.7 10.7 ± 2.1 11.3 ± 1.2
2011 7.0 ± 0.0 7.7 ± 0.5 6.0 ± 0.8 6.3 ± 1.2 13.3 ± 0.5 13.0 ± 0.8
Compressed sward heights were measured 50 times using a Rising plate meter (Castle
1976) in a zigzag-walk on each paddock before and after each grazing cycle. Based on these
measurements the coefficient of variation of sward heights (CV) was calculated as a measure
of sward structure (Zhu et al. 2012) resulting in one CV for each paddock and grazing cycle.
Five permanent subplots per paddock were established for vegetation analysis and soil
sampling following the generation of randomly distributed points with the program Hawth’s
Analysis Tool for ArcGIS 9.1. Vegetation composition was monitored in May/June from 2007
to 2012 (grazing ended in 2011) by means of vegetation relevés of 1 m² and 9 m²
surrounding the permanent points. Plant species and yield estimates (Klapp & Stählin 1936)
were recorded in the 1 m² relevés and additionally occurring species noted in the
surrounding 8 m². For the baseline data of 2007, yield estimates were performed on
functional group level (grasses, herbs, legumes), from 2008 onwards on plant species level.
The plant species Agrostis gigantea and Agrostis stolonifera were hard to differentiate in

CHAPTER II
44
their vegetative state; observations were, therefore, combined to the species consortium
‘Agrostis spec.’.
Vegetation data were analysed in terms of multivariate ordination techniques using the
software Canoco (ter Braak & Šmilauer 1997-2004). In all analyses, species data of each
paddock were log-transformed and blocks considered as covariables. Detrended
correspondence analysis (DCA) resulted in gradient lengths (length of the first axis) smaller
than three, therefore linear methods were used for further analysis (Lepš & Šmilauer 2003).
An RDA for the last year of floristic observation (2012) was conducted with the main factors
sward type and grazer as well as their interactions (resembling the different treatments).
Slopes of paddocks were integrated as covariables. After checking for significance of the first
axis, significant variables were selected manually (using the Monte Carlo permutation test
implemented in canoco with 499 permutations in a reduced model). Development of species
composition over years was investigated by Principal Response Curves (PRC). PRCs can be
used to illustrate direction and extent of vegetation development assignable to experimental
treatments along a time-axis in reference to a control treatment (Lepš & Šmilauer 2003). In
particular, responses of individual species can be extracted from this multivariate technique.
The PRC as well as the underlying RDA were conducted following the description in Lepš and
Smilauer (2003). The divC-treatment was chosen as reference level.
Further statistical analyses were carried out with R (2.14.2, R Development Core Team
2012). Univariate analyses were performed using linear mixed effects models, accounting for
repeated measures over years and the spatial nesting of (sub-)plots. For baseline testing of
initial differences between paddocks, data of 2007 (after herbicide application, before
grazing started) were analysed for effect of sward type and grazer plus their interaction
considering plant species richness and functional group composition. We were interested in
the differing vegetation development of grazing stock and used years (continuous) and type
of grazer as fixed factors. On gd-swards we decided to perform separate analyses before and
after the severe effect of the second herbicide treatment (autumn 2009). For the div-swards
this separation was not necessary, so all analyses were performed within sward types. As
dependent variables functional yield estimates (grasses, forbs, legumes), species richness,
Shannon-Diversity, (Shannon-)Evenness and Whittaker’s beta diversity (for further
information about indices see Magurran 2004) as well as trampling and grazing tolerance
were used. Species richness and beta diversity refer to 9 m2 vegetation relevés, all other

CHAPTER II
45
indices were calculated on 1 m2-basis. The grassland utilization indicators trampling and
pasture tolerance (Briemle et al. 2002) were extracted from the BiolFlor-database (Klotz et
al. 2002).
All response variables were also tested for grazer effects within each experimental year
for each sward type. To evaluate if terms and interactions are significant, F-statistics were
used. Significant differences of single treatments compared to cattle-grazing in each sward
were deduced from t-statistics. In all models proportions were transformed (arcsine square
root) and variance modelling applied where necessary.
The sward structure was analysed in two-way ANCOVAs for each grazing cycle in years
2010 and 2011. The CV after grazing was taken as response variable, block and the CV before
grazing as covariates and sward type plus grazer as well as their interaction as predictors.

CHAPTER II
46
Results
In total 79 plant species were found on the experimental area across all years. On
average grasses dominated the site (78%), legumes accounted for 3% and the remainder was
composed by forbs.
Herbicide application before the start of grazing treatments resulted in reduced species
richness and forb as well as legume abundance on gd-paddocks in 2007 (Table 7). Grass
abundance was accordingly higher on these plots. Paddocks assigned to different grazers
showed no baseline differences in functional group composition.
Table 7 Effect of herbicide treatment on plant species richness and yield proportions of functional groups before the start of grazing treatments in 2007 (numdf = numerator degrees of freedom, dendf = denominator degrees of freedom). Significant values (P< 0.05) are indicated by bold characters.
Sward type (St) Grazer (G) St x G
Fnumdf, dendf P Fnumdf, dendf P Fnumdf, dendf P
Species richness 94.45 1,10 < .001 0.23 2,10 0.797 1.64 2,10 0.241
%grasses 120.32 1,10 < .001 0.82 2,10 0.466 1.97 2,10 0.191
%forbs 98.25 1,10 < .001 2.31 2,10 0.150 2.45 2,10 0.136
%legumes 56.13 1,10 < .001 0.43 2,10 0.660 0.76 2,10 0.493
Just the first axis of the RDA (using all data from 2008-2012) explained a significant
proportion of the total variance (P=0.006). Consequently, the PRCs (Fig. 5) used to evaluate
vegetation dynamics and development of single species over time in each of the six
treatments, were based on this axis. Treatments within each sward type were of similar
vegetation composition. Besides a separation of sward types due to different initial
composition there was no clear separation of treatments in response to grazer type along
time observable. In particular Taraxacum sect. Ruderalia, but also other dicot species
showed a clear reduction on gd-treatments compared to the control treatment (divC)
(species score > 0). On the contrary, grass species as Dactylis glomerata, Elymus repens and
Alopecurus pratensis showed a negative species score and were therefore more abundant
on gd-swards. Repeated herbicide application in autumn 2009 was clearly reflected in sward
composition of gd-swards in contrast to the diverse control.

CHAPTER II
47
Fig. 5. Principal response curves of treatments compared to the divC-treatment. PRCs belong to the first corresponding RDA-axis. Species scores are shown right to the diagram (zero of species scores is not at the same level as in the diagram for optical reasons). Species numbers were reduced to those well fitted by setting lower axis minimum fit to 7.
For the last year of vegetation analysis (2012), after five years of grazing, a separate RDA
was performed (Fig. 6). The severe impact of herbicide application and accordingly the
contrasting sward types can be seen on the first axis (P=0.004 in manual selection). Even
though the second axis is linked to grazers (in particular cattle-grazing (correlation -0.535),
neither grazing treatments nor their interaction with sward types were significant in manual
selection when sward types were considered first. T- value biplots (implemented in Canoco)
were performed to find species with significant (P< 0.05) responses to the main factor. The
dicot species Taraxacum sect. Ruderalia and Galium mollugo were negatively associated
with gd, whereas the orchard grass Dactylis glomerata was positively linked to this factor.
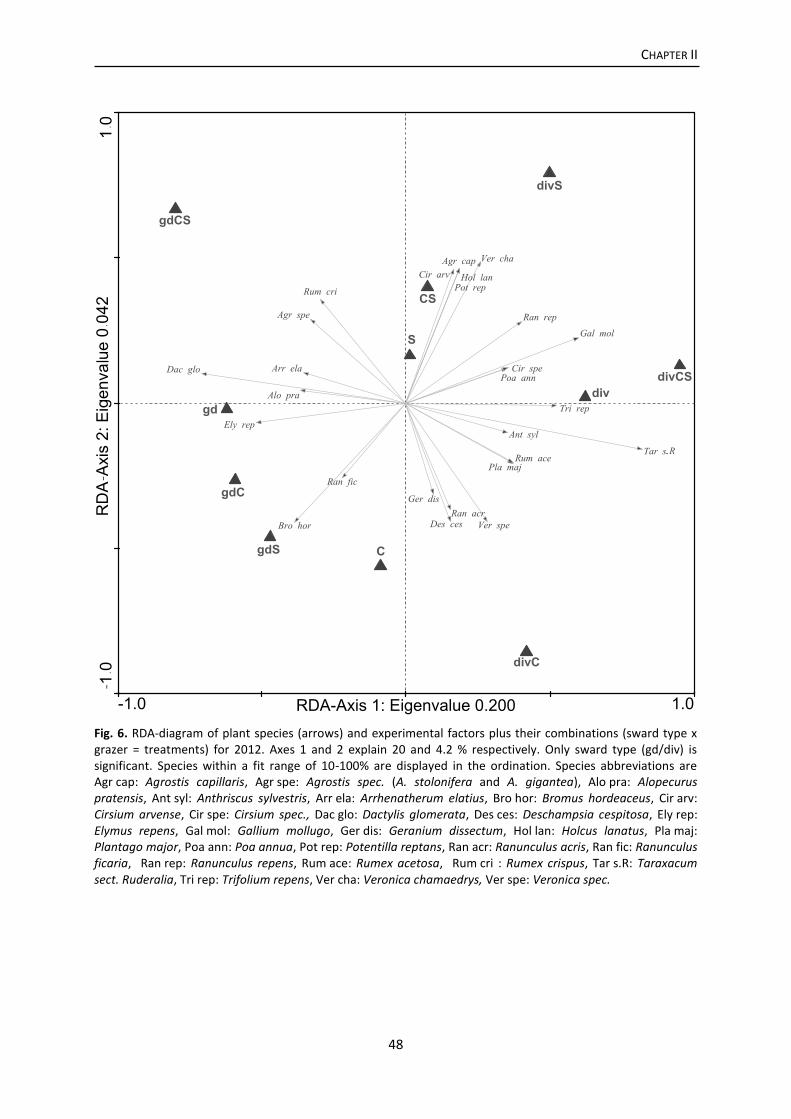
CHAPTER II
48
Fig. 6. RDA-diagram of plant species (arrows) and experimental factors plus their combinations (sward type x grazer = treatments) for 2012. Axes 1 and 2 explain 20 and 4.2 % respectively. Only sward type (gd/div) is significant. Species within a fit range of 10-100% are displayed in the ordination. Species abbreviations are Agr cap: Agrostis capillaris, Agr spe: Agrostis spec. (A. stolonifera and A. gigantea), Alo pra: Alopecurus pratensis, Ant syl: Anthriscus sylvestris, Arr ela: Arrhenatherum elatius, Bro hor: Bromus hordeaceus, Cir arv: Cirsium arvense, Cir spe: Cirsium spec., Dac glo: Dactylis glomerata, Des ces: Deschampsia cespitosa, Ely rep: Elymus repens, Gal mol: Gallium mollugo, Ger dis: Geranium dissectum, Hol lan: Holcus lanatus, Pla maj: Plantago major, Poa ann: Poa annua, Pot rep: Potentilla reptans, Ran acr: Ranunculus acris, Ran fic: Ranunculus ficaria, Ran rep: Ranunculus repens, Rum ace: Rumex acetosa, Rum cri : Rumex crispus, Tar s.R: Taraxacum sect. Ruderalia, Tri rep: Trifolium repens, Ver cha: Veronica chamaedrys, Ver spe: Veronica spec.
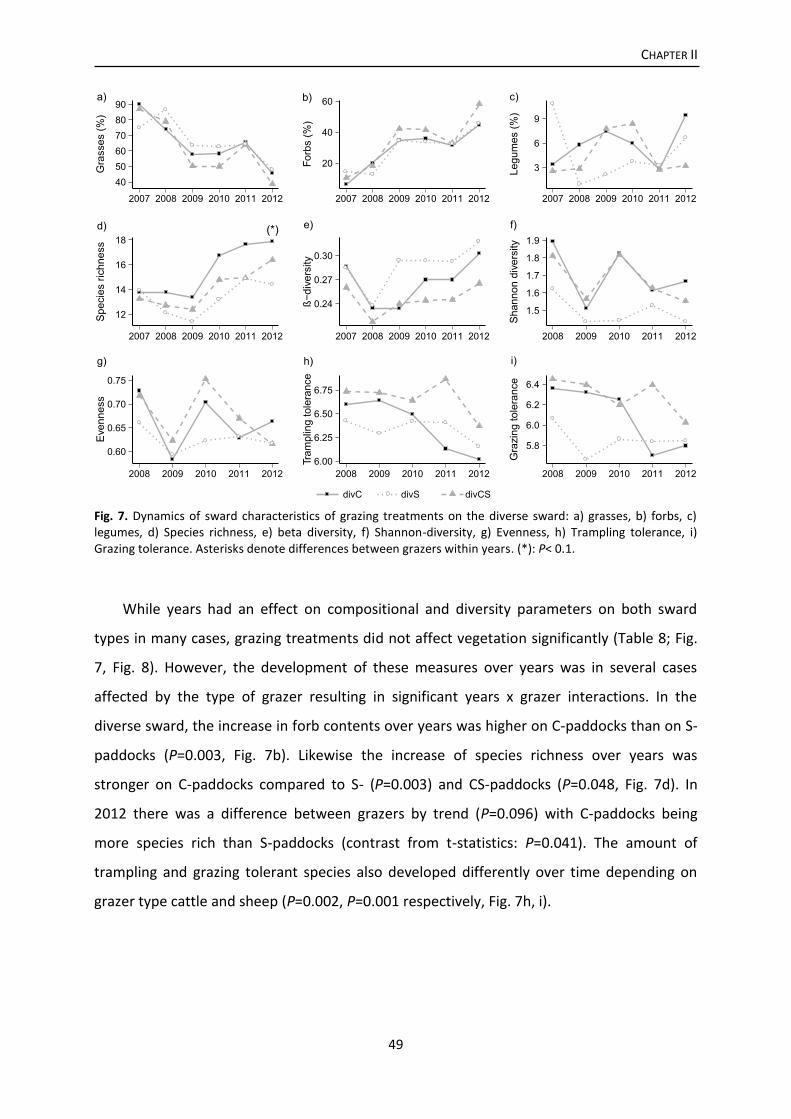
CHAPTER II
49
Fig. 7. Dynamics of sward characteristics of grazing treatments on the diverse sward: a) grasses, b) forbs, c) legumes, d) Species richness, e) beta diversity, f) Shannon-diversity, g) Evenness, h) Trampling tolerance, i) Grazing tolerance. Asterisks denote differences between grazers within years. (*): P< 0.1.
While years had an effect on compositional and diversity parameters on both sward
types in many cases, grazing treatments did not affect vegetation significantly (Table 8; Fig.
7, Fig. 8). However, the development of these measures over years was in several cases
affected by the type of grazer resulting in significant years x grazer interactions. In the
diverse sward, the increase in forb contents over years was higher on C-paddocks than on S-
paddocks (P=0.003, Fig. 7b). Likewise the increase of species richness over years was
stronger on C-paddocks compared to S- (P=0.003) and CS-paddocks (P=0.048, Fig. 7d). In
2012 there was a difference between grazers by trend (P=0.096) with C-paddocks being
more species rich than S-paddocks (contrast from t-statistics: P=0.041). The amount of
trampling and grazing tolerant species also developed differently over time depending on
grazer type cattle and sheep (P=0.002, P=0.001 respectively, Fig. 7h, i).

CHAPTER II
50
Fig. 8. Dynamics of sward characteristics of grazing treatments on the grass-dominated sward: a) grasses, b) forbs, c) legumes, d) Species richness, e) beta diversity, f) Shannon-diversity, g) Evenness, h) Trampling tolerance, i) Grazing tolerance. The missing connection of treatment lines between 2009 and 2010 accounts for the second herbicide application in autumn 2009. Asterisks denote statistical differences between grazers within years. (*): P< 0.1, *: P< 0.05.
On grass-dominated swards grass yield shares decreased with time after each herbicide
application, with a difference in the reaction of S-and CS-paddocks (Fig. 8a, Table 8). In
contrast, forbs and legumes increased (Fig. 8b, c). For species richness between 2007 and
2009 on gd-swards, the increase over years was slightly faster on C- than on CS-paddocks
(P=0.025, Fig. 8d). Beta and Shannon-diversity as well as Evenness (Fig. 8e, f, g) developed
differently over years within the grazing treatments of the gd-swards from 2010 to 2012.
Beta diversity increased more on C- than on S-paddocks (P=0.040) over years and in 2011
and 2012 grazers affected beta diversity by trend (2011: P=0.061, 2012: P=0.080, Fig. 8e).
The slopes of both Shannon-diversity and Evenness were dependent on grazing treatments
(P=.033, P=0.016). This resulted in a significant grazer effect in 2012 on the gd-sward
(Shannon: P=0.025, Fig. 8f; Evenness: P=0.046, Fig. 8g). In both cases sheep paddocks
displayed the highest values of Shannon diversity and Evenness, while mixed paddocks had
the lowest values.
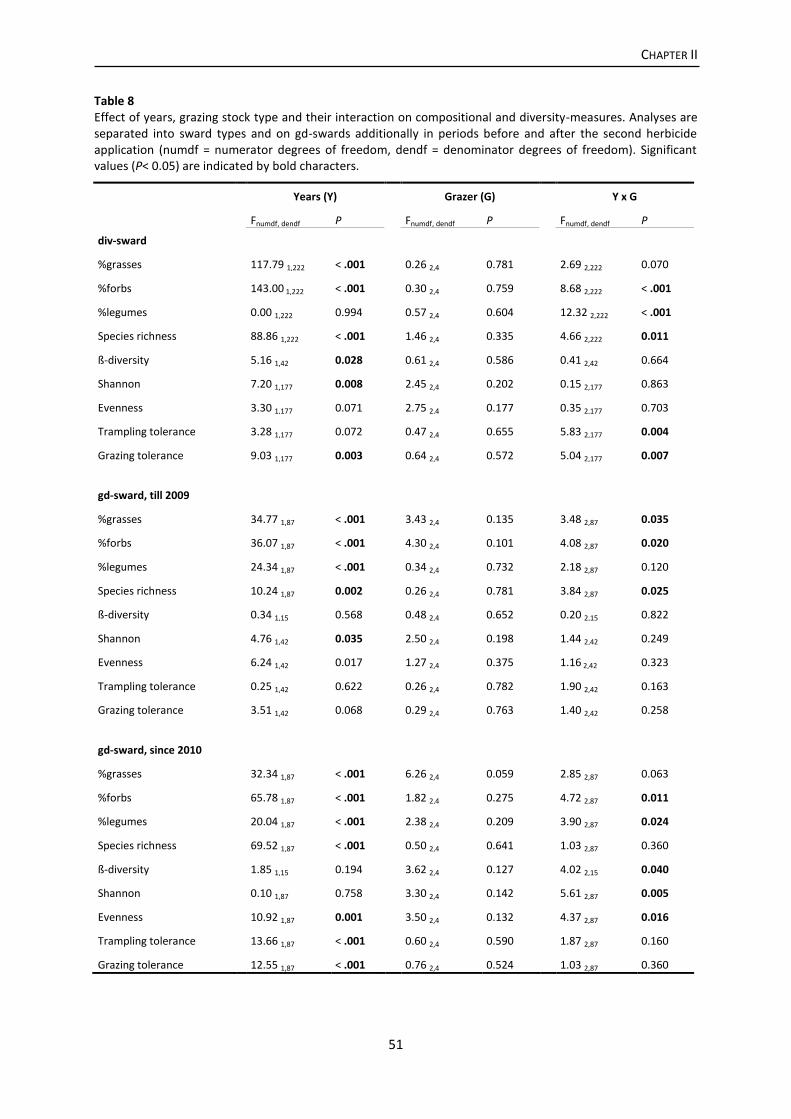
CHAPTER II
51
Table 8 Effect of years, grazing stock type and their interaction on compositional and diversity-measures. Analyses are separated into sward types and on gd-swards additionally in periods before and after the second herbicide application (numdf = numerator degrees of freedom, dendf = denominator degrees of freedom). Significant values (P< 0.05) are indicated by bold characters.
Years (Y) Grazer (G) Y x G
Fnumdf, dendf P Fnumdf, dendf P Fnumdf, dendf P
div-sward
%grasses 117.79 1,222 < .001 0.26 2,4 0.781 2.69 2,222 0.070
%forbs 143.00 1,222 < .001 0.30 2,4 0.759 8.68 2,222 < .001
%legumes 0.00 1,222 0.994 0.57 2,4 0.604 12.32 2,222 < .001
Species richness 88.86 1,222 < .001 1.46 2,4 0.335 4.66 2,222 0.011
ß-diversity 5.16 1,42 0.028 0.61 2,4 0.586 0.41 2,42 0.664
Shannon 7.20 1,177 0.008 2.45 2,4 0.202 0.15 2,177 0.863
Evenness 3.30 1,177 0.071 2.75 2,4 0.177 0.35 2,177 0.703
Trampling tolerance 3.28 1,177 0.072 0.47 2,4 0.655 5.83 2,177 0.004
Grazing tolerance 9.03 1,177 0.003 0.64 2,4 0.572 5.04 2,177 0.007
gd-sward, till 2009
%grasses 34.77 1,87 < .001 3.43 2,4 0.135 3.48 2,87 0.035
%forbs 36.07 1,87 < .001 4.30 2,4 0.101 4.08 2,87 0.020
%legumes 24.34 1,87 < .001 0.34 2,4 0.732 2.18 2,87 0.120
Species richness 10.24 1,87 0.002 0.26 2,4 0.781 3.84 2,87 0.025
ß-diversity 0.34 1,15 0.568 0.48 2,4 0.652 0.20 2,15 0.822
Shannon 4.76 1,42 0.035 2.50 2,4 0.198 1.44 2,42 0.249
Evenness 6.24 1,42 0.017 1.27 2,4 0.375 1.16 2,42 0.323
Trampling tolerance 0.25 1,42 0.622 0.26 2,4 0.782 1.90 2,42 0.163
Grazing tolerance 3.51 1,42 0.068 0.29 2,4 0.763 1.40 2,42 0.258
gd-sward, since 2010
%grasses 32.34 1,87 < .001 6.26 2,4 0.059 2.85 2,87 0.063
%forbs 65.78 1,87 < .001 1.82 2,4 0.275 4.72 2,87 0.011
%legumes 20.04 1,87 < .001 2.38 2,4 0.209 3.90 2,87 0.024
Species richness 69.52 1,87 < .001 0.50 2,4 0.641 1.03 2,87 0.360
ß-diversity 1.85 1,15 0.194 3.62 2,4 0.127 4.02 2,15 0.040
Shannon 0.10 1,87 0.758 3.30 2,4 0.142 5.61 2,87 0.005
Evenness 10.92 1,87 0.001 3.50 2,4 0.132 4.37 2,87 0.016
Trampling tolerance 13.66 1,87 < .001 0.60 2,4 0.590 1.87 2,87 0.160
Grazing tolerance 12.55 1,87 < .001 0.76 2,4 0.524 1.03 2,87 0.360

CHAPTER II
52
The sward structure, measured as CV of sward heights after grazing, was 2010 more
heterogeneous on div- than on gd-swards in grazing cycle 2 (P=0.018, Fig. 9). At the second
grazing cycle in 2011 cattle grazing led to a higher CV than sheep grazing across both sward
types (P=0.037). With respect to the other grazing cycles no significant effects of sward type,
grazer or their interaction were found.
Fig. 9. Coefficient of variation of sward height (means ± se) after each grazing cycle (1, 2, 3) for years 2010 and 2011 in response to sward types and grazing treatments (C=cattle, S=sheep, CS=mixed cattle and sheep). Sward types are displayed by dark grey (gd-swards) and light grey bars (div-swards). Different letters indicate significant differences (P< 0.05) within factors (grazer effect: Tukey post-hoc HSD). No significant interactions between sward type and grazer were found.

CHAPTER II
53
Discussion
In the present study, the effect of mono and mixed grazing of the most important
grazing livestock species on vegetation composition of two sward types was investigated.
Within all treatments of the experiment, some general phenomena occurred: grasses
decreased and forbs increased over years and correspondingly species richness was
positively correlated with time. These effects can likely be attributed to management change
in relation to site history, as manure application ceased with the start of the experiment (e.g.
Hrevušová et al. 2009).
The use of herbicides against dicotyledonous plants was effective and reduced amount
and species numbers of forbs and legumes as expected (Fuhlendorf et al. 2009; Petersen et
al. 2012). Herbicidal effects were even visible in the third year after application and
accounted for 20% of the variation in vegetation composition (Fig. 6). However, forbs and
legumes became more abundant with increasing temporal distance to the last herbicide
treatment, indicating a vegetational recovery from spraying (resilience).
Vegetation composition
Sward composition did not prove to be significantly influenced by grazers. This
contradicts the study of Sebastià et al. (2008), who found many species significantly linked to
cattle or sheep grazing in an observational study in the Pyrenees.
Likewise PRCs indicated no opposing trends in vegetation development over years in
response to grazing treatments. Contrary to our hypothesis sheep had no stronger effect on
the vegetation development of the diverse sward. Our results correspond to the study of
Fraser et al. (2013), who also investigated grazing cattle and/or sheep over four years on
permanent grassland and found no grazer effects on vegetation. Dietary overlap between
cattle and sheep is comparatively high with both livestock preferring legumes and forbs
(Dumont et al. 2011). The selectivity of sheep, however, is supposed to be stronger (Dumont
et al. 2011) and most authors report a reduction of legumes, in particular Trifolium repens,
by sheep due to their preference for this species (Abaye et al. 1997; Murphy et al. 1995;
Nolan et al. 2001; White & Knight 2007). Nearly all of these studies were made on sown
and/or species-poor swards, where animals had a limited choice in terms of selectivity but at

CHAPTER II
54
the same time a higher probability to find legumes in the sward. In an experiment with a
more diverse composition, legumes were only affected by trend in the sixth year of the
investigation (Dumont et al. 2011). Coinciding with these results, we found a lower increase
of legumes over years under sheep- compared to cattle-grazing on the diverse sward.
Plant diversity
More species could establish over years on subplots of cattle- than on sheep- grazed or
mixed paddocks (e.g. Plantago major, Ranunculus repens). Furthermore, the significant
difference of species richness between cattle and sheep paddocks in 2012 on the diverse
sward indicated that cattle-grazing might enhance phytodiversity over the long term. Cattle
are supposed to create more trampling damage than sheep, thereby creating small patches
of bare soil, which can be beneficial for seedling establishment (Mitchell et al. 2008). In
sheep-grazed paddocks preferred plants are likely to decrease while unpalatable ones gain
abundance as a result of a higher chance to flower and propagate. However, the advantage
of cattle-grazing for species richness was not confirmed on the grass-dominated swards.
Moreover, other studies even reported that sheep pastures were species-richer than cattle-
grazed ones (Sebastià et al. 2008; Socher et al. 2013). Notwithstanding, these results were
made on observational studies. In controlled experiments on grasslands with higher
agronomic relevance, results might diverge from these findings. Supporting this assumption,
Dumont et al. (2011) could not detect any effect on species richness within six years after
introduction of cattle and sheep grazing on permanent grassland.
Vegetational heterogeneity
Vegetational heterogeneity between subplots, measured as beta diversity, was not
influenced by grazers in the diverse swards, but in 2012 beta diversity was by trend higher
on cattle than on sheep grass-dominated-pastures. Sebastià et al. (2008) also found sheep to
decrease vegetation heterogeneity. Even though cattle are less selective considering single
plants, they avoid foraging around dung pats (Forbes & Hodgson 1985; Murphy et al. 1995).
Thus islets emerge with a deviating composition (MacDiarmid & Watkin 1971) and this
difference could be reflected in higher beta diversity on cattle pastures. In addition, cattle
CHAPTER II
55
patch grazing (Adler et al. 2001) can also lead to vegetational heterogeneity as found by
Marion et al. (2010).
With respect to phytodiversity, it has to be considered that pastures were grazed
rotationally. Under continuous grazing at low stocking rates, animals can more readily
behave selective than under rotational management, where animals stay on pastures till
available forage is more or less completely consumed.
Sward structure
Sward heterogeneity in general, has to be looked at from different perspectives: even
though uniform swards are seen as more valuable from an agronomic point of view since
they indicate a better utilization of pastures (Forbes & Hodgson 1985), heterogeneous
structures can provide ecological niches promoting biodiversity (Rook et al. 2004; Vickery et
al. 2001). Considering our hypothesis, sheep grazing produced indeed more homogeneous
swards than cattle in one grazing cycle 2011 as predicted by Forbes and Hodgson (1985).
Nonetheless, selectivity of sheep might be strong and lead to heterogeneity at a smaller
scale (Sebastià et al. 2008). Small-scale sensitive measurements of sward surface height as
performed by Barthram et al. (2005) would be more appropriate to confirm this assumption.
Mixed grazing
In contrast to our hypothesis, mixed grazing of cattle and sheep did not lead to lower
coefficient of variation indicating a more even sward utilization as suggested by Forbes and
Hodgson (1985) and Wrage et al. (2011). Likewise, mixed grazing showed no effects on
vegetation composition development. Shannon-diversity and Evenness were even lowest in
the mixed paddocks on the grass-dominated swards in the last year of this investigation.
Furthermore, the increase of forbs and legumes was lower under mixed grazing compared
with the mono grazing treatments of the grass-dominated sward. Nonetheless, mixed
grazing might be beneficial for other aspects of biodiversity (e.g. enhancing voles: Evans et
al. 2006).
CHAPTER II
56
Temporal aspects
In vegetation studies in particular long term observations are needed (Bullock et al.
2001; Hrevušová et al. 2009) before reliable conclusions can be drawn. In agreement with
other studies (e.g. Bullock et al. 2001; Fuhlendorf et al. 2009; Hrevušová et al. 2009) we
found sward characteristics to change dynamically over years. Against this backdrop and
grasslands resistance to disturbance, effects of grazer species are hard to detect and have to
superimpose temporal fluctuations. In our study, first grazing effects occurred mainly in the
last years indicating that there might be a diverging effect, when treatments observations
are continued. However, since consistent effects are missing, we are not able to fully confirm
our hypotheses that sward composition and diversity are altered fundamentally by livestock
type.
Conclusions
The present investigation revealed only minor differences between cattle, sheep and
mixed grazing on vegetation composition, diversity and sward structure. Even though the
management change in general led to severe modulations in particular of the grass and forbs
fractions, these were not varying between grazing treatments. However, the temporal
development of some sward characteristics differed between grazers, so that there seems to
be potential that livestock types change vegetation dynamics differently over the long term.
Our findings suggest that cattle might be superior to sheep in terms of species richness and
beta diversity. However, these findings were not found consistently in both swards. On
grasslands dominated by single undesirable species, cattle-grazing seems more appropriate
due to their less selective foraging behavior. On the other hand, it should not be questioned
that sheep are often the best choice to manage marginal sites of conservation interest. But
with focus on the phytodiversity of European grasslands in common agricultural practice, our
results suggest only very minor advantages of cattle in comparison to sheep and mixed
grazing in the case of rotational management.

CHAPTER II
57
References
Abaye, A.O., Allen, V.G. & Fontenot, J.P. (1997) Grazing sheep and cattle together or separately: effect on soils and plants. Agronomy Journal, 89, 380.
Adler, P., Raff, D. & Lauenroth, W. (2001) The effect of grazing on the spatial heterogeneity of vegetation. Oecologia, 128, 465–479.
Barthram, G.T., Duff, E.I., Elston, D.A., Griffiths, J.H., Common, T.G. & Marriott, C.A. (2005) Frequency distributions of sward height under sheep grazing. Grass and Forage Science, 60, 4–16.
Briemle, G., Nitsche, S. & Nitsche, L. (2002) Nutzungswertzahlen für Gefäßpflanzen des Grünlandes. Schriftenreihe für Vegetationskunde, 38, 203–225.
Bullock, J. M., Franklin, J., Stevenson, M.J., Silvertown, J., Coulson, S.J., Gregory, S.J. & Tofts, R. (2001) A plant trait analysis of responses to grazing in a long-term experiment. Journal of Applied Ecology, 38, 253–267.
Castle, M.E. (1976) A simple disc instrument for estimating herbage yield. Grass and Forage Science, 31, 37–40.
Critchley, C., Adamson, H., McLean, B. & Davies, O. (2008) Vegetation dynamics and livestock performance in system-scale studies of sheep and cattle grazing on degraded upland wet heath. Agriculture, Ecosystems & Environment, 128, 59–67.
Dumont, B., Carrère, P. & D'Hour, P. (2002) Foraging in patchy grasslands: diet selection by sheep and cattle is affected by the abundance and spatial distribution of preferred species. Animal Research, 51, 367–381.
Dumont, B., Carrère, P., Ginane, C., Farruggia, A., Lanore, L., Tardif, A., Decuq, F., Darsonville, O. & Louault, F. (2011) Plant–herbivore interactions affect the initial direction of community changes in an ecosystem manipulation experiment. Basic and Applied Ecology, 12, 187–194.
Evans, D.M., Redpath, S.M., Elston, D.A., Evan, S.A., Mitchell, R.J. & Dennis, P. (2006) To graze or not to graze? Sheep, voles, forestry and nature conservation in the British uplands. Journal of Applied Ecology, 43, 499–505.
Forbes, T.D.A. & Hodgson, J. (1985) The reaction of grazing sheep and cattle to the presence of dung from the same or the other species. Grass and Forage Science, 40, 177–182.
Fraser, M., Theobald, V., Dhanoa, M. & Davies, O. (2011) Impact on sward composition and stock performance of grazing Molinia-dominant grassland. Agriculture, Ecosystems & Environment, 144, 102–106.
Fraser, M., Vale, J. & Dhanoa, M. (2013) Alternative upland grazing systems: Impacts on livestock performance and sward characteristics. Agriculture, Ecosystems & Environment, 175, 8–20.
Fuhlendorf, S.D., Engle, D.M., O’Meilia, C.M., Weir, J.R. & Cummings, D.C. (2009) Does herbicide weed control increase livestock production on non-equilibrium rangeland? Agriculture, Ecosystems & Environment, 132, 1–6.
Grime, J. & Mackey, J. (2002) The role of plasticity in resource capture by plants. Evolutionary Ecology, 16, 299–307.
Henle, K., Alard, D., Clitherow, J., Cobb, P., Firbank, L., Kull, T., McCracken, D., Moritz, R.F., Niemelä, J., Rebane, M., Wascher, D., Watt, A. & Young, J. (2008) Identifying and managing the conflicts between agriculture and biodiversity conservation in Europe–A review. Agriculture, Ecosystems & Environment, 124, 60–71.
Hofmann, M. & Isselstein, J. (2004) Seedling recruitment on agriculturally improved mesic grassland: the influence of disturbance and management schemes. Applied Vegetation Science, 7, 193–200.

CHAPTER II
58
Hrevušová, Z., Hejcman, M., Pavlů, V.V., Hakl, J., Klaudisová, M. & Mrkvička, J. (2009) Long-term dynamics of biomass production, soil chemical properties and plant species composition of alluvial grassland after the cessation of fertilizer application in the Czech Republic. Agriculture, Ecosystems & Environment, 130, 123–130.
Illius, A. & Gordon, I. (1987) The allometry of food intake in grazing ruminants. Journal of Animal Ecology, 56, 989–999.
Kahmen, S., Poschlod, P. & Schreiber, K.-F. (2002) Conservation management of calcareous grasslands. Changes in plant species composition and response of functional traits during 25 years. Biological Conservation, 104, 319–328.
Klapp, E. & Stählin, A. (1936) Standorte, Pflanzengesellschaften und Leistung des Grünlandes. Ulmer, Stuttgart.
Klotz, S., Kühn, I. & Durka, W. (2002) BIOLFLOR: Eine Datenbank mit biologisch-ökologischen Merkmalen zur Flora von Deutschland. Bundesamt for Naturschutz, Bonn.
Lepš, J. & Šmilauer, P. (2003) Multivariate analysis of ecological data using CANOCO. Cambridge University Press, Cambridge.
Loucougaray, G., Bonis, A. & Bouzillé, J.-B. (2004) Effects of grazing by horses and/or cattle on the diversity of coastal grasslands in western France. Biological Conservation, 116, 59–71.
MacDiarmid, B.N. & Watkin, B.R. (1971) The cattle dung patch. 1. Effect of dung patches on yield and botanical composition of surrounding and underlying pasture. Grass and Forage Science, 26, 239–246.
Magurran, A.E. (2004) Measuring biological diversity. Blackwell, Oxford.
Marion, B., Bonis, A. & Bouzillé, J.-B. (2010) How much does grazing-induced heterogeneity impact plant diversity in wet grasslands? Ecoscience, 17, 229–239.
Mitchell, R.J., Rose, R.J. & Palmer, S.C. (2008) Restoration of Calluna vulgaris on grass-dominated moorlands: The importance of disturbance, grazing and seeding. Biological Conservation, 141, 2100–2111.
Murphy, W., Mena Barreto, A., Silman & J.P. (1995) Sward dynamics of a smooth-stalked meadowgrass dominantwhite clover sward rotationally grazed by cattle and/or sheep. Grass and Forage Science, 50, 183–190.
Nolan, T., Conolly, J. & Wachendorf, M. (2001) Mixed grazing and climatic determinants of white clover (Trifolium repens L.) content in a permanent pasture. Annals of Botany, 88, 713–724.
Petersen, U., Wrage, N., Köhler, L., Leuschner, C. & Isselstein, J. (2012) Manipulating the species composition of permanent grasslands—A new approach to biodiversity experiments. Basic and Applied Ecology, 13, 1–9.
R Development Core Team (2012) R. R Foundation for Statistical Computing, Vienna; Austria.
Rook, A., Dumont, B., Isselstein, J., Osoro, K., WallisDeVries, M., Parente, G. & Mills, J. (2004) Matching type of livestock to desired biodiversity outcomes in pastures – a review. Biological Conservation, 119, 137–150.
Sebastià, M.-T., Bello, F. de, Puig, L. & Taull, M. (2008) Grazing as a factor structuring grasslands in the Pyrenees. Applied Vegetation Science, 11, 215–222.
Socher, S.A., Prati, D., Boch, S., Müller, J., Baumbach, H., Gockel, S., Hemp, A., Schöning, I., Wells, K., Buscot, F., Kalko, E.K., Linsenmair, K.E., Schulze, E.-D., Weisser, W.W. & Fischer, M. (2013) Interacting effects of fertilization, mowing and grazing on plant species diversity of 1500 grasslands in Germany differ between regions. Basic and Applied Ecology, 14, 126–136.

CHAPTER II
59
Stewart, G.B. & Pullin, A.S. (2008) The relative importance of grazing stock type and grazing intensity for conservation of mesotrophic ‘old meadow’ pasture. Journal for Nature Conservation, 16, 175–185.
ter Braak, C.J.F. & Šmilauer, P. (1997-2004) Canoco for Windows. Biometris - Plant Research International, Wageningen.
Vickery, J., Tallowin, J., Feber, R., Asteraki, E., Atkinson, P., Fuller, R. & Brown, V. (2001) The management of lowland neutral grasslands in Britain: effects of agricultural practices on birds and their food resources. Journal of Applied Ecology, 38, 647–664.
Watkinson, A. & Ormerod, S. (2001) Grasslands, grazing and biodiversity: editors' introduction. Journal of Applied Ecology, 38, 233–237.
White, T.A. & Knight, T.L. (2007) Pasture yield and composition under different land uses in North Otago Rolling Downlands. Proceedings of the New Zealand Grassland Association, 69, 65–71.
Wrage, N., Strodthoff, J., Cuchillo, H.M., Isselstein, J. & Kayser, M. (2011) Phytodiversity of temperate permanent grasslands: ecosystem services for agriculture and livestock management for diversity conservation. Biodiversity and Conservation, 20, 3317–3339.
Wright, I.A., Jones, J.R., Davies, D.A., Davidson, G.R. & Vale, J.E. (2006) The effect of sward surface height on the response to mixed grazing by cattle and sheep. Animal Science, 82.
Zhu, H., Wang, D., Wang, L., Bai, Y., Fang, J. & Liu, J. (2012) The effects of large herbivore grazing on meadow steppe plant and insect diversity. Journal of Applied Ecology, 49, 1075–1083.

CHAPTER III
60
CHAPTER III
Phytodiversity and mixed grazing of cattle and sheep
for an improved productivity
Jerrentrup, Jana Sabrina; Seither, Melanie; Cuchillo Hilario, Mario;
Wrage-Mönnig, Nicole; Isselstein, Johannes

CHAPTER III
61
Abstract
A positive effect of phytodiversity on primary productivity of grasslands has often been
claimed in recent years. However, the conversion of this advantage into secondary
production, the performance of grazing livestock, remains an open question. Animal
production of cattle and sheep can be enhanced by mixed grazing, but this effect has to our
knowledge never been studied in relation to phytodiversity. A rotational grazing experiment
was conducted over five years (2007-2011) using sheep and cattle in mono or mixed grazing
of swards differing in diversity. Herbicides against dicotyledonous plants were used on
permanent grassland in Germany to create different sward types: grass-dominated, species-
poor swards in contrast to the untreated ‘diverse’ control swards. We found no differences
in herbage production, but diverse swards showed a higher crude protein content and a
smaller ADF value of the herbage compared to the grass-dominated swards. Lamb
production was slightly enhanced on the diverse swards (P< 0.05), while calf performance
was unaffected by sward type. Mixed grazing benefited daily live weight gains of suckler
cows (P<0.05) as well as secondary production per area (daily live weight gains per ha, total
live weight gains per ha) (P<0.001, for both), thereby displaying the advantage of combining
livestock species due to complementary pasture use. We suggest that mixed rotational
grazing of cattle and sheep on phytodiverse agricultural swards is particularly appropriate to
enhance lamb production (+17% in mixed vs. mono grazing; +12% on diverse vs. grass-
dominated swards; mean difference across swards or grazer system, respectively) without
having any disadvantages for calf performance.

CHAPTER III
62
Introduction
Grasslands in temperate regions of the world are an important basis of livestock feeding
(O'Mara 2012). Fertilization has been widely applied to optimize primary (herbage mass) and
secondary (livestock performance) productivity of pastures, but resulted in a subsequent
decline of biodiversity (Hopkins & Wilkins 2006). Therefore, attention needs to be drawn to
other grassland management options in order to integrate environmental and conservation
objectives into agricultural systems (Isselstein et al. 2005). There is an on-going controversial
debate on how plant diversity can affect ecosystem services like grassland productivity (e.g.
Wrage et al. 2011; Petersen et al. 2013; Seither et al. 2012). Many experiments in sown
grassland indicate a positive relationship of species richness (e.g. Bullock et al. 2001; Hector
et al. 1999; Tilman et al. 2001) or evenness (Kirwan et al. 2007) on herbage yield. This might
not only apply to meadows but also to grazed grasslands (Isbell & Wilsey 2011; Sanderson et
al. 2005). In contrast, other authors could not confirm species richness to be used as a
predictor of primary production, neither on mown (Kahmen et al. 2005) nor on grazed sites
(Rusch & Oesterheld 1997; Tracy & Faulkner 2006).
Phytodiversity was shown to affect forage quality; however, reports are not consistent
(Bullock et al. 2001; Tracy & Faulkner 2006). White et al. (2004) found a negative effect,
while other studies (Petersen et al. 2013; Hofmann & Isselstein 2005; Seip et al. 2012)
suggest that more diverse swards produce forage with higher crude protein content,
particularly in late season.
It would be of high agronomic interest to see whether the suggested increase in primary
production at higher phytodiversity levels translates into improved performance of grazing
livestock. When Totty et al. (2013) investigated dairy milk production from sown mixtures
differing in diversity they found the more complex five-species mixture to increase the total
but not the solid milk yield when compared with ryegrass-white clover swards. In a similar
experiment, Soder et al. (2006) found no increase in solid milk production as well, and Tracy
et al. (2006) report that also cow-calf performance was not influenced by the complexity of
sown grassland mixtures (Tracy & Faulkner 2006).
The choice of the grazing system in terms of mixed vs. mono-grazing can affect the
agronomic output as well. Mixed grazing of cattle and sheep has been found to enhance
animal performance (Abaye et al. 1994; Fraser et al. 2007, 2013; Marley et al. 2006; Nolan &

CHAPTER III
63
Conolly 1989). Herbivore species differ in their way of defoliation, excreta deposition and
trampling (Rook et al. 2004; Wrage et al. 2011) and can thereby affect pasture productivity
(Boswell 1977; White & Knight 2007) and quality (Abaye et al. 1994). Sheep graze selectively
for preferred plants, but excreta are assumed to be more evenly distributed than with cattle
(Abaye et al. 1997; Monteath et al. 1977; Seither et al. 2012). Cattle, in turn, avoid grazing
around their dung patches and consequently a considerable pasture residual remains with
direct implications on grazing efficiency (Murphy et al. 1995; Nolan & Conolly 1989). As a
result, complementary mixed grazing of cattle and sheep could lead to a more even
utilization of pastures, as sheep graze closer to cattle dung patches (Forbes & Hodgson
1985), while cattle are in turn less selective at the single plant-scale and also graze more
mature forage that is avoided by sheep (Dumont et al. 1995). The positive effects of
complementary grazing might be most distinct in more diverse swards offering the greatest
opportunities to utilize dietary differences among livestock species and thus, lower the
competition for vegetation resources (Forbes & Hodgson 1985; Fraser et al. 2007).
Generally, mixed grazing was found to have a positive effect on sheep, particularly on lamb
performance (Abaye et al. 1994; Fraser et al. 2007, 2013; Marley et al. 2006; Wright et al.
2006). Cattle reacted to mixed as opposed to mono grazing as well (Nolan & Conolly 1989),
but in general seem to benefit less from this type of grazing system (Abaye et al. 1994;
Kitessa & Nicol 2001; Wright et al. 2006).
So far, only few studies exist on how sward diversity and composition influence
secondary production in grassland, and these are often limited in scope as they compare
simple sown mixtures (see review by Soder et al. 2007). To our knowledge, the relation of
phytodiversity and mixed grazing on permanent grassland has not yet been studied.
Therefore, we designed a two-factorial experiment with two different sward types (‘diverse’
and ‘grass-dominated’) and three grazing treatments (cattle and sheep in mono and mixed
grazing).
The underlying hypotheses of this study were
Swards of a higher diversity produce more forage
More diverse swards also offer a higher forage quality
Higher phytodiversity results in higher live weight gains of grazing animals.
Mixed-grazing is beneficial for livestock performance, particularly for that of sheep

CHAPTER III
64
Material & Methods
The experimental site is situated in the Solling Uplands of Lower Saxony, Germany
(51°46'47” N, 9°42'11” E; altitude 184-209 m.a.s.l.). Soil type is a pelosol with a texture of
silty / clay loam; the vegetation belongs to the plant association Lolio-Cynosuretum and is
moderately species-rich. Dactylis glomerata (22%), Lolium perenne (15%) and Taraxacum
sect. Ruderale (13%) were the most abundant species. Before the experiment started, the
site was used as mown pasture with varying proportions of cattle and sheep and with light
manuring. Weather data can be found in Table 9.
Table 9 Daily mean temperatures and precipitation for grazing seasons between 2007 and 2011. Data were recorded by the weather station of Germany’s National Meteorological Service (Deutscher Wetterdienst) at Moringen-Lutterbeck (approximately 10 km from the field site, at comparable elevation), if nothing else is denoted. Daily mean temperatures are denoted as monthly means between April and October and yearly mean, precipitation as sums accordingly to months and yearly sum.
Apr May Jun Jul Aug Sep Oct
yearly mean / sum
Temperature (°C) 2007 10.7 13.4 16.7 16.5 15.8 12.2 7.8 9.4
2008 7.1 13.9 16.4 17.5 16.7 11.8 8.4 9.0
2009 11.5 13.0 14.1 17.3 17.3 13.8 7.5 8.6
2010 8.3 9.7 15.8 19.6 16.1 12.0 7.8 7.3
2011 11.2 12.7 15.8 15.5 17.1 14.1 8.8 9.1 Precipitation (mm)
2007 4.5 166.9 123.4 139.3 68.8 154.0 31.9 1226.8
2008 55.9 16.2 52.4 113.9 71.9 53.7 52.8 773.8
2009 18.8 68.3 45.6 104.2 37.4 57.5 76.2 782.3
2010 16.2 93.8 24.2 44.2 104.9 78.9 23.7 785.0
2011* 43.6 23.5 76.2 54.0 108.3 41.5 50.0 728.6
* Precipitation in 2011 refers to data of the weather station in Dassel (approximately 3 km from the field site), 183 m a.s.l.
The experiment was divided in 18 paddocks of 0.5 ha each and designed as a
randomized block system (3 blocks). Each paddock in one block was attributed to a
combination of two experimental factors: sward type and grazer. To achieve different sward
types, the vegetation composition of one half of the paddocks was manipulated using
herbicides against dicotyledonous plants (Starane Ranger and Duplosan KV, active
components Fluroxypyr/Triclopyr and Mecoprop-P). Thereby relatively species-poor, grass-
dominated (‘gd’) swards were created in contrast to the more diverse (‘div’) control with
higher abundances of forbs and legumes (Table 10). Herbicide application was done before

CHAPTER III
65
the start of the experiment (2006) and repeated in autumn 2009 to maintain sward
differentiation. This method has been recommended by Petersen et al. (2012). The idea is to
create a link between more observational studies and artificially sown biodiversity
experiments (D az et al. 2003). Paddocks were grazed by cattle (C) and sheep (S) in mono- or
mixed grazing (CS). Cows with calves were of the breed German Simmental and ewes with
lambs were German Blackheaded Mutton and Leine sheep in comparable proportions.
Animals were assigned to paddocks on a live weight basis, blocks were grazed sequentially.
In total, three grazing cycles were performed per year (rotational grazing). Grazing started in
May and paddocks were stocked with around 3000 kg (= 12 LUs ha-1, LU=livestock unit: 500
kg) per paddock (Table 11). The second grazing cycle was performed in June without
changing livestock herds, followed by a break for animal mating. In August/September,
animals were assigned to paddocks on a reduced live weight basis to account for slower
vegetation growth (2000 kg, 8 LUs ha-1, see Table 11). In this third grazing cycle, no lambs
were used.
Table 10 Plant functional composition and species richness of treatments over years (means ± sd). Data were recorded each year (spring) on five permanent 1 m
2-subplots per paddock.
Sward type gd div
System mono mixed mono mixed
Livestock C S CS C S CS
Grasses (%) 97.3 ± 8.7 94.9 ± 12 99.4 ± 1.2 69.2 ± 23.8 70.3 ± 27.3 66.1 ± 24.2
Forbs (%) 0.8 ± 2.2 3.5 ± 8.0 0.4 ± 0.8 25.8 ± 21.9 25.5 ± 24.4 29.1 ± 22.1
Legumes (%) 1.9 ± 8.3 1.7 ± 5.4 0.2 ± 0.8 5.1 ± 5.1 4.2 ± 7.2 4.9 ± 6.7
Species richness (m-2
) 8.3 ± 2.1 9.7 ± 3.6 8.8 ± 2.0 12.9 ± 3.3 11.3 ± 3.6 11.6 ± 2.4
Livestock grazed paddocks between 2007 and 2011. For the study presented here we
used herbage mass and forage quality data from 2010 and 2011. For information on sward
productivity and forage quality from 2007 to 2009, see Seither et al. (2012).

CHAPTER III
66
Table 11 Livestock characteristics (sum of live-weights (LW), numbers and initial live-weights (IW) of dams and offspring) in reference to grazer species, grazing system and sward type (means ± sd). Sum of live-weights and number of dams and offspring are presented over years separated into gracing cycles (GC). Initial weights of dams and offspring (weights before the start of grazing each season) are shown for each year.
Livestock C S
System mono mixed mono mixed
Sward type gd div gd div gd div gd div
Sum LW (kg)
GC 1 2976 ± 144
3102 ± 205
1515 ± 68
1523 ± 150
3001 ± 15
3013 ± 12
1507 ± 25
1504 ± 63
GC 2 3195 ± 207
3402 ± 149
1631 ± 49
1658 ± 123
3128 ± 116
3197 ± 97
1612 ± 53
1600 ± 99
GC 3 2037 ± 120
2089 ± 112
890 ± 27
967 ± 145
2007 ± 62
2021 ± 58
1002 ± 11
1013 ± 29
No. dams
GC 1+2 4 ± 0 5 ± 0 2 ± 0 2 ± 0 30 ± 6 31 ± 6 15 ± 3 15 ± 3
GC 3 3 ± 0 3 ± 0 1 ± 0 1 ± 0 27 ± 2 27 ± 3 13 ± 1 13 ± 1
No. offspring
GC 1+2 4 ± 1 4 ± 1 2 ± 0 2 ± 0 26 ± 4 27 ± 6 14 ± 2 12 ± 1
GC 3 3 ± 0 3 ± 0 1 ± 0 1 ± 0 - - - -
IW dams (kg)
2007 582 ± 34 631 ± 37 767 ± 71 534 ± 44 61 ± 10 61 ± 9 64 ± 11 64 ± 11
2008 624 ± 155 554 ± 41 670 ± 79 591 ± 64 68 ± 13 70 ± 12 64 ± 12 73 ± 15
2009 680 ± 85 564 ± 37 677 ± 41 692 ± 62 75 ± 11 76 ± 11 79 ± 13 75 ± 10
2010 533 ± 38 662 ± 80 652 ± 37 667 ± 7 74 ± 11 76 ± 14 74 ± 17 76 ± 15
2011 674 ± 110 539 ± 36 685 ± 33 686 ± 37 78 ± 13 71 ± 8 72 ± 8 74 ± 12
IW offspring (kg)
2007 55 ± 10 70 ± 7 57 ± 6 64 ± 6 27 ± 9 24 ± 9 24 ± 6 22 ± 5
2008 60 ± 11 66 ± 10 80 ± 11 77 ± 0 31 ± 7 31 ± 12 32 ± 4 34 ± 7
2009 66 ± 4 50 ± 15 66 ± 13 63 ± 15 36 ± 6 35 ± 11 38 ± 9 37 ± 7
2010 65 ± 8 78 ± 7 71 ± 3 69 ± 4 35 ± 6 36 ± 14 36 ± 6 36 ± 7
2011 59 ± 11 63 ± 10 64 ± 18 64 ± 7 35 ± 6 30 ± 8 32 ± 6 33 ± 8
Sward measurements
Before (pregraze) and after (postgraze) each grazing event, compressed sward heights
(CSH) of paddocks were measured using a Rising Plate Meter (Castle 1976). Measurements
consisted of 50 single recordings per paddock performed in a zig-zag walk. Four herbage
samples with known CSH were cut (Ø 30 cm) from each paddock, oven dried (60°C, 48 h) and
weighted. Calibrations between CSH and biomass were calculated for each paddock and year

CHAPTER III
67
(2010, 2011) to determine herbage mass (HM) of paddocks (coefficient of determination:
0.77 ± 0.11). Productivity was estimated by the formula:
Annual herbage accumulation = (pregraze HM1 – postgraze HM1) + (pregraze HM2 –
postgraze HM2) + pregraze HM3
Subscript numbers indicate the grazing cycle (length in grazing days: 1: 26.4 ± 5.2, 2:
16.6 ± 5.6, 3: 36.6 ± 2.9). Vegetation regrowth during the stocking period was not assessed in
this study. Vegetation analysis was performed on five permanent 1m2-subplots per paddock
each year in spring. Functional group (grasses, forbs, legumes) proportions and single species
yield estimates were recorded. On this basis, species richness and evenness (see Magurran
2004) were calculated.
Forage quality
Forage quality from pregraze samples was estimated by near infrared spectroscopy
(NIRS). Spectra were evaluated using a calibration dataset of samples from differing
grasslands by the VDLUFA Qualitätssicherung NIRS GmbH (Tillmann 2010). Mean H-values
(Mahalanobis distances) of 1.79 ± 0.68 showed that the samples were well covered by the
calibration set. Data with H-values above three were removed from the analysis (Petersen et
al. 2013). For quality analysis the parameters crude protein (CP) and acid detergent fiber
(ADF) were used. Crude ash content (CA) was determined by burning subsamples in a muffle
furnace (550°C, 12 h). Metabolizable energy (ME) was calculated on the basis of NIRS-results
and crude ash concentration:
ME (MJ kg–1) = 7.81 + 0.07559 Gb - 0.00384 CA + 0.00565 CP + 0.01898 CL - 0.00831 ADF
with Gb: gas formation and CL: crude lipid concentration (GfE, Ausschuss für Bedarfsnormen
der Gesellschaft für Ernährungsphysiologie, 2008).
Animal performance
Between 2007 and 2011, livestock weights of calves and lambs were recorded before
and after each grazing cycle. In addition, in the first grazing cycle animals were weighed after
grazing of each block. On the basis of these measurements, average daily live weight gains
(ADG) were calculated. Owing to reduced livestock numbers for the third grazing cycle, only

CHAPTER III
68
the first two cycles were analyzed. Therefore, final weights refer to weights after the second
grazing cycle. For individual performance, ADGs of sheep were calculated for the first grazing
cycle, as sheep weights in this grazing cycle were weighted with a more precise scale. Cattle
ADGs were based on grazing cycles 1+2. In 2009, animals were not weighed after the second
cycle, therefore only data of 2007 + 2008 and 2010 + 2011 are presented here.
With respect to livestock, it has to be considered that animals within treatment and year
were belonging to one herd grazing all paddock replications consecutively. True replications
were therefore only obtained by temporal replicating.
Animal performance per area was calculated by means of total gains during both grazing
cycles for each livestock species. For ADGs per ha these gains were divided by the number of
grazing days.
Statistical analysis
Primary productivity, forage quality parameters and animal output per area were
analyzed for effects of sward type and grazer (cattle, sheep, cattle and sheep in mixed
grazing). Individual livestock performance was evaluated for effects of sward type and
regarding mono vs. mixed grazing (‘grazing system’) within one livestock species.
Productivity was analyzed in ANCOVAs with sward type, grazer and their interaction.
Blocks were included as a categorical covariate and models were performed separately for
2010 and 2011. For the postgrazing sward height and the quality parameters CP, ADF and
ME mixed models were build separately for each year with sward type, grazer and their
interaction. The pregrazing sward height was used as covariate in the postgrazing sward
height-model, while the grazing cycle was included as covariate in quality-models. The
random structure accounted for repeated measurements of paddocks nested within blocks.
For correlations of productivity and quality data (years 2010 and 2011) with species richness,
evenness and legume percentage mixed models were used (year, predictor and interaction
of year x predictor as fixed effects, blocks and repeated temporal measurements were
included in the random term). Replications of quality parameters within paddocks were
pooled.
ADG of lambs was analyzed in a mixed model using year, sward type and system (‘mono’
or ‘mixed’-grazing) and their interactions as main effects. The repeatedly measured ADG of

CHAPTER III
69
individual animals was included within the random structure and grazing cycle was used as
covariate. Additionally, separate analyses of ADG were performed for single years using the
same structures as above, but omitting year. Across all years, an analogous model was built
with year as additional factor. Live weight gains of calves were analyzed accordingly.
For analysis of total live weight gains per area as well as ADG per area, mixed models
were built accounting for similarities within years in the random term. Models were checked
for effects of sward type, grazer system and the interaction of both factors.
Model assumptions were checked visually. Transformations and variance modeling was
performed where necessary (indicated in the results-part of this paper). Concerning all
ANOVA-models, treatment means of significant factors were tested for significant
differences with post-hoc Tukey HSD tests. All statistical tests were performed using R,
version 2.14.2 (R Development Core Team 2012).

CHAPTER III
70
Results
Primary productivity and forage quality
Primary productivity was neither in 2010 nor in 2011 influenced by sward type or grazer
(Table 12). Postgrazing compressed sward height (Table 12) was not affected by both factors
in 2010. In 2011 sward height did not differ significantly between grazers, but div-swards
were grazed down to a lower height than gd-swards (P=0.027). In contrast, the crude protein
content (Table 12) was significantly higher on div-swards than on gd-swards (2010: P=0.002,
2011: P=0.011). ADF (Table 12) was likewise affected by sward type in 2011 with slightly
smaller values for div-swards (2011: P=0.040). In 2010, the same sward type-effect (P=0.044)
was superimposed by an interaction between sward type and grazer (P=0.039), meaning
that ADF-values were influenced differently by sward type depending on type of grazer. The
same was true for ME (Table 12) in 2010 (interaction sward type x grazer: P=0.033). ME in
2011 was not affected by sward type or grazer.
Table 12 Primary productivity, PGCSH (postgrazing compressed sward height) and forage quality parameters CP (crude protein), ADF (acid detergent fiber) and energy content (ME: metabolizable energy) in relation to sward type (gd: grass-dominated, div: diverse) and type of grazer (C: cattle, S: sheep, CS: mixed grazing). Shown are means ± se. Data are analyzed in response to sward type (St) and grazer (G); ns: not significant, (*): P<0.1, *: P <0.05, **: P <0.01, ***: P <0.001.
Sward type gd div Significance of F-value System mono mixed mono mixed
Livestock C S CS C S CS St G St x G
Productivity (t ha-1
)
2010 4.3 ± 1.0 4.6 ± 0.3 3.8 ± 0.2 4.3 ± 0.3 4.5 ± 1.0 3.7 ± 0.1 ns ns ns
2011 6.1 ± 1.1 5.4 ± 1.5 6.5 ± 0.8 4.6 ± 1.3 6.1 ± 0.9 5.4 ± 0.7 ns ns ns
PGCSH (cm)
2010 6.2 ± 0.6 4.5 ± 0.5 5.6 ± 0.6 6.2 ± 0.6 5.4 ± 0.5 5.9 ± 0.6 ns ns ns
2011 6.3 ± 0.4 5.4 ± 0.5 6.4 ± 0.6 4.8 ± 0.2 4.7 ± 0.5 5.5 ± 0.4 * ns ns
CP (% DM)*
2010 12.7 ± 2.0 13.9 ± 3.0 13.0 ± 2.6 15.0 ± 2.5 14.0 ± 2.8 15.3 ± 2.3 ** ns (*)
2011† 11.0 ± 2.1 10.8 ± 2.0 10.4 ± 1.8 12.2 ± 1.9 12.1 ± 2.4 11.0 ± 1.7 * (*) ns
ADF (% DM)
2010 27.9 ± 3.3 26.3 ± 2.4 27.8 ± 2.1 26.0 ± 3.3 27.4 ± 2.3 25.7 ± 2.5 * ns *
2011 29.2 ± 4.0 28.4 ± 3.7 29.7 ± 4.2 28.0 ± 3.3 28.2 ± 3.2 27.6 ± 3.2 * ns ns
ME (MJ (kg-1
DM))
2010† 10.7 ± 0.7 11.1 ± 0.6 10.8 ± 0.5 11.1 ± 0.7 10.8 ± 0.5 11.2 ± 0.7 (*) ns *
2011† 10.4 ± 0.9 10.6 ± 0.7 10.4 ± 0.9 10.6 ± 0.8 10.5 ± 0.7 10.8 ± 0.8 ns ns ns
* statistical results refer to log-transformed CP-variable † the variance structure varIdent was used in the model to allow for different variances per grazing cycle

CHAPTER III
71
Species richness was by trend negatively correlated to productivity (P=0.092, Fig. 10a)
and ADF (P=0.071, Fig. 10g). With increasing species richness CP values increased
significantly (P<0.001, Fig. 10d), while ME did not respond (P=0.119, Fig. 10j). Evenness could
not be associated with productivity, CP, ADF and ME (Fig. 10b, e, h, k). The legume
percentage in swards did not influence productivity (Fig. 10c), but was positively correlated
to CP (P=0.008, Fig. 10f) and ME (P=0.007, Fig. 10l), and negatively to ADF (P=0.004, Fig. 10i).
Fig. 10. Correlation of a) productivity, d) CP (crude protein), g) ADF (acid detergent fiber) and j) ME (metabolizable energy) to species richness; b) productivity, e) CP, h) ADF and k) ME to evenness and c) productivity, f) CP, i) ADF and l) ME to legume percentage. Black dots: year 2010, grey dots: year 2011. Solid lines indicate a significant relation (P <0.05) and dashed lines a trend (P <0.1). Interactions between year and predictor were in no case significant.

CHAPTER III
72
Animal performance
In 2007, there was a significant effect of the interaction sward type and grazing system
on the ADGs of calves (P=0.021, Fig. 11). In 2010, ADGs were significantly larger for calves
grazing on div-swards than on gd-swards (P<0.001). Across all years, ADGs of calves differed
significantly among years (P=0.007).
Fig. 11. Average daily gains (ADG) of calves and lambs (means ± se) in relation to year, sward type (St, dark grey bars: grass-dominated, light grey bars: diverse) and grazing system (S, mono or mixed grazing). In statistical analyses of lamb ADGs the varIdent-structure was used to model heterogeneous variances within treatments (2008), grazing cycles and sward type (2010) or years (all years-model). ns: not significant, (*): P<0.1, *: P<0.05, **: P<0.01, ***: P<0.001.
In single years, lambs were not affected by sward type and grazing system except in year
2008 (sward type: P<0.001). In this year, sward type and grazing system interacted (P=0.003)
related withhigher lamb growth rate in the mixed, diverse treatment. In the all years-model
the effect of the grazing system on ADGs was year-dependent (P<0.001). Owing to this
interaction the effect of grazing system (P=0.002) and year (P<0.001) cannot be interpreted
separately. Altogether growth rates were shown to be higher on div- than on gd-swards
(P=0.043). Considering all years were together, mixed grazing increased lamb live weight
gains more (by 17%) than mono grazing. Div-swards produced by 12% higher lamb ADGs
than gd-swards.

CHAPTER III
73
Sward type had no effect on ADGs of suckler cows (Fig. 12) in single years. The choice of
the grazing system had no influence on suckler cow ADGs in 2007 and 2008 but led to larger
ADGs for mixed grazing in 2010 (P=0.032) and 2011 (P=0.010). In the model considering all
years, ADGs of suckler cows differed among years (P<0.001) and ADGs were larger for mixed
grazing compared to mono grazing (P=0.040).
In 2007 and 2010, ADGs of ewes (Fig. 12) were differently affected by the grazing system
depending on the sward type (sward type x grazing system effects: 2007: P<0.001, 2010:
P=0.016). Therefore, the effects of sward type (2007: P= 0.032, 2010: P<0.001) and grazing
system (2007: P=0.046) cannot be interpreted separately. Larger ewe ADGs occurred under
mixed grazing in 2011 (P=0.049). The model concerning all years showed a significant
threefold interaction between year, sward type and grazing system (P<0.001) and significant
twofold interactions of year and grazing system (P=0.029) and year and sward type (P<0.001)
prohibiting the separate interpretation of sward type (P<0.001) and year (P<0.001) effects.
Fig. 12. Average daily gains (ADG) of suckler cows and ewes (means ± se) in relation to year, sward type (St, dark grey bars: grass-dominated, light grey bars: diverse) and grazing system (S, mono or mixed grazing). In statistical analyses of suckler cow ADGs the varIdent-structure was used to model heterogeneous variances between sward types (2007, 2010) or years (all years-model). Concerning ewes the same variance modeling was used to accord for differing variances between grazing cycle (2011) and years (all years-model). ns: not significant, (*): P<0.1, *: P<0.05, **: P<0.01, ***: P<0.001.

CHAPTER III
74
Both, total gains and ADGs per area (Table 13) were affected by the type of grazing
animal (P=0.001, P<0.001, respectively) but not by sward type (P=0.184, P=0.147,
respectively). There was no interaction of sward type and grazer (P=0.120, P=0.120,
respectively). Compared to cattle grazing, mixed- and sheep only-grazed paddocks produced
higher total gains per ha (P<0.001, P=0.019, respectively) and larger ADGs per ha (P<0.001,
P=0.013, respectively). There was no significant difference between mixed- and sheep-
grazed treatments (total gain per ha: P=0.173, ADG per ha: P=0.129).
Table 13 Total gains per area and total live weight gains per area per day (means ± se) in relation to sward type (gd: grass-dominated, div: diverse) and type of grazer (C: cattle, S: sheep, CS: mixed grazing). Data are analyzed in response to sward type (St) and grazer (G); ns: not significant, **: P <0.01, ***: P <0.001.
Sward type gd
div Significance of F-value
System mono
mixed
mono
mixed
Livestock C
S
CS
C
S
CS St G StxG
Total gain (kg ha-1
) 190 ± 32 187 ± 37 229 ± 41 171 ± 38 224 ± 34 260 ± 59 ns ** ns
ADG/ha (kg ha-1
d-1
) 4.6 ± 1.0 4.7 ± 1.1 5.6 ± 1.2 4.1 ± 1.0 5.6 ± 1.1 6.5 ± 1.7 ns *** ns

CHAPTER III
75
Discussion
Effect of phytodiversity on primary productivity
Traditionally, biodiversity has been seen as response variable and not as predictor of
productivity (Kahmen et al. 2005). In recent years, sown biodiversity-experiments have
provided new insights in this research area and productivity has been found to respond
positively to increasing species richness (e.g. Hector et al. 1999; Tilman et al. 2001). This
relationship has mainly been attributed to niche complementarity due to interspecific
differences in resource use (Yachi & Loreau 2007). Our results were not in line with this
hypothesis as sward type (diverse versus grass-dominated) did not influence productivity. On
the contrary, we found that species richness and primary productivity were by trend
negatively correlated, and that diverse swards were grazed down to a lower height. Our
findings support an observational study by Kahmen et al. (2005) investigating semi-natural
grasslands in central Germany where species richness and productivity were not related. In
that study, species composition was a better predictor of productivity than species richness.
Species richness effects on productivity were in other experiments usually most pronounced
when only a few plant species were involved (Roy 2001; Wrage et al. 2011). Permanent
grasslands consist typically of a species range higher than this level of about five species
(Wrage et al. 2011) and this applies also to the swards used in this study. It has therefore
been suggested that even species-poor permanent grasslands might have sufficient species
for complementary resource use, so that the species richness - productivity relationship
might not be apparent in these ecosystems (Petersen et al. 2013; Wrage et al. 2011).
Besides species richness, evenness has been proposed to be an appropriate index of
biodiversity for predicting productivity (e.g. Kirwan et al. 2007), but our results disagree with
this assumption as well. However, in our experiment phytodiversity and abundance of forbs
and legumes were confounded per se and effects of species richness and occurrence of
dicotyledonous plants cannot strictly be disentangled. Nonetheless, removal experiments
like ours are an important link between controlled experiments with an artificially created
vegetation composition and observational studies of natural sites that are subject to less
controllable conditions (D az et al. 2003).
In this experiment, herbicides were used to manipulate species richness and abundance
of dicotyledonous plants. In agricultural practice, farmers use herbicides to remove less

CHAPTER III
76
valuable plants in order to improve production of grasses, forage quality and consequently
livestock productivity (Fuhlendorf et al. 2009; Petersen et al. 2013). However, Petersen et al.
(2013) found no consistent effect of herbicide application on herbage yield in a mown
experiment conducted on permanent grassland of a similar vegetation association as in the
present experiment. Likewise in the initial years of the experiment presented here, there
was no difference in primary productivity between control and plots with herbicide
application (Seither et al. 2012) and this was also confirmed with regard to below-ground
productivity (Rose et al. 2013).
Effect of phytodiversity on forage quality
Phytodiversity may also affect forage quality (Petersen et al. 2013; Seip et al. 2012;
Seither et al. 2012; White et al. 2004). Legumes and forbs particularly contribute to an
increased herbage quality due to their slower rate of maturation compared to grasses and
higher digestibility throughout the year (Bruinenberg et al. 2002; Petersen et al. 2013). In
addition, crude protein contents are potentially enhanced (Hofmann & Isselstein 2005; Seip
et al. 2012; Seither et al. 2012). Our results agree with these assumptions: forage quality was
higher on the diverse swards, e.g. crude protein increased with increasing species richness
(Fig. 10d). Digestibility was likewise slightly enhanced on species-rich swards indicated by a
negative correlation of species richness and ADF by trend (Fig. 10). Even though our results
indicate an improved nutritive value with increasing phytodiversity, particularly the identity
and agricultural value of additional forbs might influence forage quality (Hopkins & Holz
2006). Owing to the clear link between legumes and phytodiversity levels in this experiment,
the positive effects of species richness might also be attributable to a legume or functional
groups effect. However, since the significance of the relationship between crude protein and
species richness was stronger than that with legume percentage, and legume abundance in
the diverse sward was relatively low (Table 10), our results suggest that this effect was not
caused by legumes alone.
Effect of phytodiversity on livestock live weight gains
In our study sward type did not affect lamb performance in single years, but lamb
growth rates were slightly larger on the diverse sward type when all years were considered.

CHAPTER III
77
Owing to many interactions the interpretation of sward type on ewe daily gains seems
difficult, even though div-swards led to higher values than gd-swards (Fig. 3) when all years
were considered. In particular sheep can profit from swards that offer a wide array of plant
species. Sheep display a high degree of selectivity and can precisely select single plants
ensuring their dietary requirements (Illius & Gordon 1987; Rook et al. 2004). Especially
legumes and forbs have the potential to increase sheep performance, which could well
explain the differences found between sward types. For instance, Hutton et al. (2011) found
increased live weights of ewes and lambs on a pasture mix containing chicory (Cichorium
intybus), plantain (Plantago lanceolata) and white (Trifolium repens) and red clover
(Trifolium pratense) compared to a sward dominated by ryegrass (Lolium perenne). In
addition, certain herbs contribute to animal health and consequently to livestock
performance. Common yarrow (Achillea millefolium), for instance, is known to reduce
parasitic infections of sheep (Tariq et al. 2008).
Calf weight gains were in the range of Simmental calves grazing in suckler cow
husbandry in Germany (2007), but were in general not affected by sward type. Only in 2010
calves grew faster on the diverse sward. This year-effect might be related to larger crude
protein (P< 0.01) and metabolizable energy (P< 0.001) values provided to ruminants on
diverse than on grass-dominated swards. Live weight gains of suckler cows were smallest in
2007, likely an effect of the very wet season in that year, but were as well unaffected by
sward type.
In total, herbicide application and the resulting decreased phytodiversity of the grass-
dominated sward did not lead to an enhanced animal production by, as has been argued,
improving primary productivity and nutritive value of herbage. Quite in contrast, the
removal of forbs and legumes lowered the nutritive value of herbicide-treated swards and
decreased lamb performance. Our findings therefore support the study of Fuhlendorf et al.
(2009) who found no advantage in using herbicides to enhance grazing cattle daily live
weight gains.
Effect of grazer species on primary productivity & forage quality
Proportions of cattle and sheep were comparable indicated by similar postgrazing sward
heights across grazing treatments. Primary production was previously found to be more

CHAPTER III
78
enhanced by sheep compared to cattle grazing (Boswell 1977; Murphy et al. 1995; White &
Knight 2007). Our results, however, do not indicate an advantage of sheep over cattle
regarding herbage mass, but confirm earlier observations of Seither et al. (Seither et al.
2012) who found no difference in primary productivity between cattle and sheep grazed
paddocks.
Abaye et al. (1994) reported that forage quality can be affected by livestock species.
Seither et al. (2012) found no relationship between pregrazing forage samples and type of
grazer, but a difference between pre- and postgrazing quality in terms of crude protein and
ADF reflecting the higher quality requirements of sheep. In our study, pregrazing crude
protein, ADF and metabolizable energy contents were likewise not affected by type of grazer
which is in agreement with earlier findings on the same experiment(Seither et al. 2012).
Livestock live weight gains in mono- vs. mixed grazing
Many authors, though not all (Critchley et al. 2008), have reported a positive reaction of
sheep live weight gains to mixed grazing (Abaye et al. 1994; Fraser et al. 2007, 2013, 2014;
Marley et al. 2006; Wright et al. 2006) which was confirmed in a recent meta-analysis
including nine papers about mixed grazing (d'Alexis et al. 2013). When all experimental years
were considered together, our results concur with these observations, as lamb growth
profited from mixed grazing. As reasons for improved sheep performance under mixed
grazing a better utilization of pastures (Esmail 1991; Forbes & Hodgson 1985) or a reduction
of intestinal parasite burdens (Esmail 1991; Fraser et al. 2013; Marley et al. 2006) were
suggested. Cattle avoid grazing around their dung patches and so do not utilize these areas
resulting in herbage wastage (Forbes & Hodgson 1985). However, dung patches receive
relatively high nutrient concentrations and growth around dung is usually enhanced
(MacDiarmid & Watkin 1971). The pasture residual left after cattle grazing can reach values
up to 40%. This proportion can be reduced by mixed grazing with sheep (Murphy et al.
1995). Sheep are willing to graze relatively close to cattle dung patches and can therefore
benefit from residual forage (Forbes & Hodgson 1985).
In contrast to sheep, an enhanced performance of cattle in mixed grazing is rare (see
review by d'Alexis et al. 2013), even negative effects on animal weights have been reported
(Kitessa & Nicol 2001; Olson et al. 1999). However, cattle might also profit from mixed

CHAPTER III
79
(Nolan & Conolly 1989). Even though dietary overlap between cattle and sheep is relatively
high (Celaya et al. 2008), cattle diets usually contain more reproductive vegetation (Dumont
et al. 1995) and even dead herbage (Armstrong et al. 1997). Thus, by their ability to digest
forage of a lower quality cattle utilize forage which is left by sheep (Illius & Gordon 1987). On
the diverse sward type, our results confirm a slightly positive impact of mixed grazing on
overall performance of suckler cows and in two single years (2010, 2011). However, calf
growth rates were not affected by mixed grazing. Calves are more selective and prefer
forage of higher digestibility than older cattle (Cazcarra & Petit 1995). Consequently, calves
may have a larger dietary overlap with sheep and compete with them in mixed grazing for
the better quality fodder.
Mixed grazing was not only beneficial for individual lamb and suckler cow live weight
gains but also produced higher outputs per area, that is higher daily live weight gains and
total weight gains per ha. Results of total production per ha in our study confirm findings of
Olson et al. (1999) and Frazer et al. (2014). Live-weight gains per area of the grass-
dominated sward are in the range reported in d’Alexis et al. (2013), while on the diverse
sward values were even slightly higher (up to 6.5 kg d-1 ha-1). However, based on both output
parameters per area, diverse swards did not indicate a significant advantage above the less
diverse grass-dominated swards in our study.
Conclusions
In this study more phytodiverse swards did not produce forage of a higher quantity, but
of a higher quality by featuring larger crude protein contents and smaller ADF values. This
advantage of the diverse sward type was also reflected in a slightly increased lamb growth
rate when all experimental years were considered together. Calf weight gains, however,
were unaffected. Mixed grazing increased suckler cow daily live weight gains and produced
larger total output per ha compared with mono-grazed cattle-treatments. Therefore, mixed
grazing of cattle and sheep seems promising. In order to optimize lamb production, we
suggest the use of diverse swards containing legumes and forbs. Such diverse swards have
the potential to feature an increased nutritive value and give further scope for selective
feeding to fulfill the high quality requirements of sheep.

CHAPTER III
80
References
Abaye, A., Allen, V. & Fontenot, J. (1994) Influence of grazing cattle and sheep together and separately on animal performance and forage quality. Journal of Animal Science, 72, 1013–1022.
Abaye, A.O., Allen, V.G. & Fontenot, J.P. (1997) Grazing sheep and cattle together or separately: effect on soils and plants. Agronomy Journal, 89, 380.
Armstrong, R.H., Grant, S., Common, T.G. & Beattie, M.M. (1997) Controlled grazing studies on Nardus grassland: effects of between-tussock sward height and species of grazer on diet selection and intake. Grass and Forage Science, 52, 219–231.
Boswell, C.C. (1977) Comparisons of cattle grazing and sheep grazing. Proceedings of the New Zealand Grassland Association, 38, 56–65.
Bruinenberg, M.H., Valk, H., Korevaar, H. & Struik, P.C. (2002) Factors affecting digestibility of temperate forages from seminatural grasslands: a review. Grass and Forage Science, 57, 292–301.
Bullock, J.M., Pywell, R.F., Burke, M.J. & Walker, K.J. (2001) Restoration of biodiversity enhances agricultural production. Ecology Letters, 4, 185–189.
Castle, M.E. (1976) A simple disc instrument for estimating herbage yield. Grass and Forage Science, 31, 37–40.
Cazcarra, R.F. & Petit, M. (1995) The influence of animal age and sward height on the herbage intake and grazing behaviour of Charolais cattle. Animal Science, 61, 497–506.
Celaya, R., Benavides, R., García, U., Ferreira, L.M.M., Ferre, I., Martínez, A., Ortega-Mora, L.M. & Osoro, K. (2008) Grazing behaviour and performance of lactating suckler cows, ewes and goats on partially improved heathlands. animal, 2, 1818.
Critchley, C., Adamson, H., McLean, B. & Davies, O. (2008) Vegetation dynamics and livestock performance in system-scale studies of sheep and cattle grazing on degraded upland wet heath. Agriculture, Ecosystems & Environment, 128, 59–67.
d'Alexis, S., Sauvant, D. & Boval, M. (2013) Mixed grazing systems of sheep and cattle to improve liveweight gain: a quantitative review. The Journal of Agricultural Science, 1–12.
D az, S., Symstad, A.J., Stuart Chapin, F., Wardle, D.A. & Huenneke, L.F. (2003) Functional diversity revealed by removal experiments. Trends in Ecology & Evolution, 18, 140–146.
Dumont, B., Petit, M. & D'hour, P. (1995) Choice of sheep and cattle between vegetative and reproductive cocksfoot patches. Applied Animal Behaviour Science, 43, 1–15.
Esmail, S. (1991) Multispecies grazing by cattle and sheep. Rangelands, 13, 35–37.
Forbes, T.D.A. & Hodgson, J. (1985) The reaction of grazing sheep and cattle to the presence of dung from the same or the other species. Grass and Forage Science, 40, 177–182.
Fraser, M., Davies, D., Vale, J., Hirst, W. & Wright, I. (2007) Effects on animal performance and sward composition of mixed and sequential grazing of permanent pasture by cattle and sheep. Livestock Science, 110, 251–266.
Fraser, M., Moorby, J. M., Vale, J. E., Evans, D. M.; Kaltenboeck, B. (2014) Mixed grazing systems benefit both upland biodiversity and livestock production. PLoS ONE, 9, e89054, doi: 10.1371/journal.pone.0089054
Fraser, M., Vale, J. & Dhanoa, M. (2013) Alternative upland grazing systems: Impacts on livestock performance and sward characteristics. Agriculture, Ecosystems & Environment, 175, 8–20.
Fuhlendorf, S.D., Engle, D.M., O’Meilia, C.M., Weir, J.R. & Cummings, D.C. (2009) Does herbicide weed control increase livestock production on non-equilibrium rangeland? Agriculture, Ecosystems & Environment, 132, 1–6.
CHAPTER III
81
Giebelhausen, H., Priebe, R., Lepetit, D. & Richter, K. (2007) Untersuchungen zur Entwicklung der Pflanzenbestände sowie der Lebendmasse von Kälbern auf Mutterkuhweiden. Mitteilungen der Arbeitsgemeinschaft Grünland und Futterbau, 8, 237–241.
Hector, A., Schmid, B., Beierkuhnlein, C., Caldeira, M.C., Diemer, M., Dimitrakopoulos, P.G., Finn, J.A., Freitas, H., Giller, P.S., Good, J., Harris, R., Högberg, P., Huss-Danell, K., Joshi, J., Jumpponen, A., Körner, C., Leadley, P.W., Loreau, M., Minns, A., Mulder, C.P.H., O‘Donovan, G., Otway, S.J., Pereira, J.S., Prinz, A., Read, D.J., Scherer-Lorenzen, M., Schulze, E.-D., Siamantziouras, A.-S.D., Spehn, E.M., Terry, A.C., Troumbis, A.Y., Woodward, F.I., Yachi, S. & Lawton, J.H. (1999) Plant Diversity and Productivity Experiments in European Grasslands. Science, 286, 1123–1127.
Hofmann, M. & Isselstein, J. (2005) Species enrichment in an agriculturally improved grassland and its effects on botanical composition, yield and forage quality. Grass and Forage Science, 60, 136–145.
Hopkins, A. & Holz, B. (2006) Grassland for agriculture and nature conservation: production, quality and multi-functionality. Agronomy Research, 4, 3–20.
Hopkins, A. & Wilkins, R.J. (2006) Temperate grassland: key developments in the last century and future perspectives. The Journal of Agricultural Science, 144, 503.
Hutton, P., Kenyon, P., Bedi, M., Kemp, P., Stafford, K., West, D. & Morris, S. (2011) A herb and legume sward mix increased ewe milk production and ewe and lamb live weight gain to weaning compared to a ryegrass dominant sward. Animal Feed Science and Technology, 164, 1–7.
Illius, A. & Gordon, I. (1987) The allometry of food intake in grazing ruminants. Journal of Animal Ecology, 56, 989–999.
Isbell, F.I. & Wilsey, B.J. (2011) Increasing native, but not exotic, biodiversity increases aboveground productivity in ungrazed and intensely grazed grasslands. Oecologia, 165, 771–781.
Isselstein, J., Jeangros, B. & Pavlů, V. (2005) Agronomic aspects of biodiversity targeted management of temperate grasslands in Europe – A review. Agronomy Research, 3, 139–151.
Kahmen, A., Perner, J., Audorff, V., Weisser, W. & Buchmann, N. (2005) Effects of plant diversity, community composition and environmental parameters on productivity in montane European grasslands. Oecologia, 142, 606–615.
Kirwan, L., Lüscher, A., Sebastià, M.T., Finn, J.A., Collins, R.P., Porqueddu, C., Helgadottir, A., Baadshaug, O.H., Brophy, C., Coran, C., Dalmannsdóttir, S., Delgado, I., Elgersma, A., Fothergill, M., Frankow-Lindberg, B.E., Golinski, P., Grieu, P., Gustavsson, A.M., Höglind, M., Huguenin-Elie, O., Iliadis, C., Jørgensen, M., Kadziuliene, Z., Karyotis, T., Lunnan, T., Malengier, M., Maltoni, S., Meyer, V., Nyfeler, D., Nykanen-Kurki, P., Parente, J., Smit, H.J., Thumm, U. & Conolly, J. (2007) Evenness drives consistent diversity effects in intensive grassland systems across 28 European sites. Journal of Ecology, 95, 530–539.
Kitessa, S. & Nicol, A. (2001) The effect of continuous or rotational stocking on the intake and live-weight gain of cattle co-grazing with sheep on temperate pastures live-weig pastures. Animal Science, 72, 199–208.
MacDiarmid, B.N. & Watkin, B.R. (1971) The cattle dung patch. 1. Effect of dung patches on yield and botanical composition of surrounding and underlying pasture. Grass and Forage Science, 26, 239–246.
Magurran, A.E. (2004) Measuring biological diversity. Blackwell, Oxford.
Marley, C., Fraser, M., Davies, D., Rees, M., Vale, J. & Forbes, A. (2006) The effect of mixed or sequential grazing of cattle and sheep on the faecal egg counts and growth rates of weaned lambs when treated with anthelmintics. Veterinary Parasitology, 142, 134–141.
Monteath, M.A., Johnstone, P.D. & Boswell, C.C. (1977) Effects of animals on pasture production. New Zealand Journal of Agricultural Research, 20, 23–30.

CHAPTER III
82
Murphy, W., Mena Barreto, A., Silman & J.P. (1995) Sward dynamics of a smooth-stalked meadowgrass dominantwhite clover sward rotationally grazed by cattle and/or sheep. Grass and Forage Science, 50, 183–190.
Nolan, T. & Conolly, J. (1989) Mixed v. mono-grazing by steers and sheep. Animal Production, 48, 519–533.
Olson, K., Wiedmeier, R., Bowns, J. & Hurst, R. (1999) Livestock response to multispecies and deferred-rotation grazing on forested rangeland. Journal of Range Management, 462–470.
O'Mara, F.P. (2012) The role of grasslands in food security and climate change. Annals of Botany, 110, 1263–1270.
Petersen, U., Wrage-Mönnig, N. & Isselstein, J. (2013) Effects of herbicide application to control sward composition in different management variants. International Journal of Biodiversity Science, Ecosystem Services & Management, 9, 155–165.
Petersen, U., Wrage, N., Köhler, L., Leuschner, C. & Isselstein, J. (2012) Manipulating the species composition of permanent grasslands—A new approach to biodiversity experiments. Basic and Applied Ecology, 13, 1–9.
R Development Core Team (2012) R. R Foundation for Statistical Computing, Vienna; Austria.
Rook, A., Dumont, B., Isselstein, J., Osoro, K., WallisDeVries, M., Parente, G. & Mills, J. (2004) Matching type of livestock to desired biodiversity outcomes in pastures – a review. Biological Conservation, 119, 137–150.
Rose, L., Hertel, D. & Leuschner, C. (2013) Livestock-type effects on biomass and nitrogen partitioning in temperate pastures with different functional-group abundance. Grass and Forage Science, 68, 386–394.
Roy, J. (2001) How does biodiversity control primary productivity. Terrestrial global productivity (eds J. Roy, B. Saugier & H.A. Mooney), pp. 169–186. Academic Press, San Diego, California.
Rusch, G.M. & Oesterheld, M. (1997) Relationship between productivity, and species and functional group diversity in grazed and non-grazed Pampas grassland. Oikos, 78, 519–526.
Sanderson, M.A., Soder, K.J., Muller, L.D., Klement, K.D., Skinner, R.H. & Goslee, S.C. (2005) Forage mixture productivity and botanical composition in pastures grazed by dairy cattle. Agronomy Journal, 97, 1465.
Seip, K., Breves, G., Isselstein, J., Daş, G. & Abel, H. (2012) Ruminal fermentation characteristics and microbial nitrogen assimilation in sheep fed differently composed grass silages. Archives of Animal Nutrition, 66, 215–226.
Seither, M., Wrage, N. & Isselstein, J. (2012) Sward Composition and Grazer Species Effects on Nutritive Value and Herbage Accumulation. Agronomy Journal, 104, 497.
Soder, K.J., Rook, A.J., Sanderson, M.A. & Goslee, S.C. (2007) Interaction of plant species diversity on grazing behavior and performance of livestock grazing temperate region pastures. Crop Science, 47, 416–425.
Soder, K., Sanderson, M., Stack, J. & Muller, L. (2006) Intake and performance of lactating cows grazing diverse forage mixtures. Journal of Dairy Science, 89, 2158–2167.
Tariq, K., Chishti, M., Ahmad, F. & Shawl, A. (2008) Anthelmintic efficacy of Achillea millifolium against gastrointestinal nematodes of sheep: in vitro and in vivo studies. Journal of Helminthology, 82, 227–233.
Tillmann, P. (2010) Anwendung der Nahinfrarotspektroskopie (NIRS) an Grünlandproben. VDLUFA Schriftenreihe, 66, 145–150.
Tilman, D., Reich, P.B., Knops, J., Wedin, D., Mielke, T. & Lehman, C. (2001) Diversity and productivity in a long-term grassland experiment. Science, 294, 843–845.

CHAPTER III
83
Totty, V., Greenwood, S., Bryant, R. & Edwards, G. (2013) Nitrogen partitioning and milk production of dairy cows grazing simple and diverse pastures. Journal of Dairy Science, 96, 141–149.
Tracy, B.F. & Faulkner, D.B. (2006) Pasture and Cattle Responses in Rotationally Stocked Grazing Systems Sown with Differing Levels of Species Richness. Crop Science, 46, 2062.
White, T.A., Barker, D.J. & Moore, K.J. (2004) Vegetation diversity, growth, quality and decomposition in managed grasslands. Agriculture, Ecosystems & Environment, 101, 73–84.
White, T.A. & Knight, T.L. (2007) Pasture yield and composition under different land uses in North Otago Rolling Downlands. Proceedings of the New Zealand Grassland Association, 69, 65–71.
Wrage, N., Strodthoff, J., Cuchillo, H.M., Isselstein, J. & Kayser, M. (2011) Phytodiversity of temperate permanent grasslands: ecosystem services for agriculture and livestock management for diversity conservation. Biodiversity and Conservation, 20, 3317–3339.
Wright, I.A., Jones, J.R., Davies, D.A., Davidson, G.R. & Vale, J.E. (2006) The effect of sward surface height on the response to mixed grazing by cattle and sheep. Animal Science, 82.
Yachi, S. & Loreau, M. (2007) Does complementary resource use enhance ecosystem functioning? A model of light competition in plant communities. Ecology Letters, 10, 54–62.

GENERAL DISCUSSION
84
GENERAL DISCUSSION

GENERAL DISCUSSION
85
In the present study, the effects of grazing intensity and the type of livestock on
biodiversity and productivity were investigated. Furthermore the impact of phytodiversity on
primary and secondary production of pastures was analysed.
In order to discuss all chapters as a whole, two grazing experiments with different
management have to be reconciled. In the first experiment, grazing intensity of continuously
stocked cattle was varied, while in the second experiment two sward types differing in
vegetation composition and diversity were created and rotationally grazed by cattle and
sheep in mono- or mixed grazing. Although these differences should not be underestimated,
there are many aspects that both experiments have in common. Both are conducted at the
same experimental farm and lay side-by-side, thereby being comparable in altitude,
exposition, soil and vegetation parameters. Both are low-input systems receiving no
fertilizers or manure since the experimental procedures started and both are long-term
experiments.
The central questions of this study were:
Can the livestock type be used to alter vegetation composition, diversity and
structure?
Which grazing intensity is most suitable for insect diversity?
Is biodiversity beneficial for primary and secondary productivity?
Can mixed grazing contribute to a better livestock performance?
Livestock species differing in grazing characteristics are proposed to alter biodiversity
(Rook et al. 2004; Wrage et al. 2011). However, in this study, we found no effects of grazing
cattle and sheep neither in mono- nor in mixed grazing on vegetation composition. Even
though selective grazing was observed on the present experiment (Cuchillo Hilario 2012), it
did apparently not cause sward differentiation. A possible explanation for this might be
found in the duration of grazing and forage on offer. We used a rotational system in which
forage is more or less completely consumed. Even if selective grazing occurred at the start of
grazing, selective choices of animals decreased in the progress of grazing with decreasing
forage on offer. The impact of selectivity might therefore be more distinct under continuous
grazing as used in the other experiment examined in this study. Under continuous stocking,
grazing intensity is a major variable predicting livestock selectivity. In contrast to high grazing

GENERAL DISCUSSION
86
pressure, at low stocking rates animals are offered a variety of dietary choices and can
satisfy their forage requirements for preferred vegetation finally resulting in improved
individual livestock performance (Pavlů et al. 2003; Röver 2006). As a consequence of
feeding choices areas develop which are grazed over and over while others remain
underutilized (Bailey et al. 1998; Dumont et al. 2007; Milchunas et al. 1988). This pattern is
known as patch grazing (Adler et al. 2001) and is particularly pronounced on low-intensive,
continuously grazed cattle pastures (Cid & Brizuela 1998; Dumont et al. 2007). The patch
type itself determines phytodiversity more than grazing intensity, as shown by Wrage et al.
(2012). In addition, different patch types can also host differing vegetation compositions
(Marion et al. 2010) thereby the special feature of patch grazing for phytodiversity cannot be
combined in a single patch type but is more a result of the diversity of patches. While
intensively grazed cattle pastures often consist of rather homogeneous swards only
interrupted by single dung patches, extensive grazed pastures are more able to offer this
patch-diversity (Gibb & Ridout 1988). As outlook, it would be therefore very interesting to
investigate pastures regarding their vegetation composition of patches and to test whether
and how grazing intensity-treatments differ in these patch types.
Structural heterogeneity of pastures could not only be beneficial for floristic but also for
faunistic diversity (Metera et al. 2010; Rook et al. 2004). Intensively grazed swards have
shown to be detrimental for insect diversity (Dennis et al. 1998; Eschen et al. 2012; Kruess &
Tscharntke 2002) which was also confirmed in the present study. Structure-sensitive insects
such as grasshoppers react fast to altered conditions and changes mediated by cattle grazing
(Weiss et al. 2012). Even though taller swards are preferred by many insects because they
offer more forage and shelter against predation (Dennis et al. 1998; Gardiner et al. 2002;
Morris 2000), some species depend on short swards (Littlewood et al. 2012; Morris 2000).
Extensive grazing creating different sward heights was in this study shown to benefit both,
grasshopper and butterfly diversity. However, in very lenient grazing which was the most
extensive treatment, neither species richness nor abundance exceeded values of those
found at the medium intensive, lenient treatment. Thus, insect diversity seems to rather
follow an asymptotic curve (Dennis et al. 1998) or an unimodal relationship with grazing
intensity as predicted by the intermediate-disturbance theory (Huston 1994). As a result, for
butterfly and in particular grasshopper diversity, grazing is not required to be extensified to a
maximum. Rather a well-balanced proportion of sward structural differences offering

GENERAL DISCUSSION
87
networked habitats would be advantageous to benefit species depending on short as well as
tall areas.
Structure is not only an important link between pythodiversity and herbivorous insects,
it can also proceed to higher trophic levels (Vickery et al. 2001). For instance, birds
depending on insects as forage profit from heterogeneous swards. While many insects
prefer taller sward patches, birds can find their pray easier on short sward areas (Eschen et
al. 2012; Vickery et al. 2001). In addition, sward structural complexity affects bird’s nest site
availability (Vickery et al. 2001). A structural heterogeneous sward can thereby not only
profit invertebrate diversity but also that of vertebrates. In general, biodiversity effects have
been shown to proceed to higher trophic levels, even though this relationship weakens from
one level to another (Haddad et al. 2009, Scherber et al. 2010). However, in this study insect
diversity was not predicted by phytodiversity thereby concurring with findings of Zhu et al.
(2012) suggesting that heterogeneity created by grazing is more important for insect
diversity than plant species richness.
Sward structural differences were also investigated in response to livestock types by
means of cattle and sheep in mono or mixed grazing. Besides an effect on biodiversity, as
discussed above, sward structure can affect sward agricultural utilization. Mixed grazed
pastures are assumed to be subject to complementary grazing resulting in a more evenly
utilized sward (Forbes & Hodgson 1985; Seither 2011). In this study, we could not support a
better utilization indicated by a structural more homogeneous sward. In contrast, we found
sheep grazed swards to be more homogeneous than cattle. This result might be attributable
to the scale of measurements which was in this chapter recorded with a Rising Plate Meter
which is less sensitive for small-scale differences created by sheep (Barthram et al. 2005).
Even though structural differences benefit phytophagous insects as well as plant diversity as
described above, the livestock choice has in rotational grazing only low potential to promote
biodiversity because findings were only temporary and not consistent.
Biodiversity itself contributes to many ecosystem services (Hector & Bagchi 2007; Isbell
et al. 2011). In this study, we analysed the effect of plant diversity on agricultural
productivity. Although primary productivity of sown grassland was shown to increase with
increasing levels of phytodiversity (Hector et al. 1999; Tilman et al. 2001; Weigelt et al.
2009), we could not confirm this relationship. Permanent grasslands possess more species
than the level of around five species at which biodiversity-effects usually weaken (Roy 2001;

GENERAL DISCUSSION
88
Wrage et al. 2011). In this context, van Ruijven and Berendse (2009) suggested that only a
few species are needed to maintain ¾ of the productivity, but more than eight species are
required for 95% of the maximum productivity. However, even the herbicide-treated sward
type used in this study possessed more plant species. Therefore, the biodiversity-
productivity relationship might not be visible on permanent grassland and even relatively
species-poor, intensive sites are able to feature enough species to use resources
complementary (Petersen et al. 2013; Wrage et al. 2011).
Nonetheless, in this study increased phytodiversity improved herbage quality. Diverse
swards contained higher crude protein levels and lower ADF values as a result of additional
forbs and legumes. Therefore, more diverse swards did not produce herbage of a higher
quantity but of a higher quality. This advantage in turn has the potential to translate into
improved livestock performance.
Performance of lambs, measured as daily live weight gains, was indeed slightly
enhanced in the more diverse sward type. This was either attributable to the increased
herbage quality or to the enhanced possibility for fodder selection in order to fulfil
nutritional requirements. However, cow-calf performance was not consistently affected by
sward types differing in phytodiversity, likely an effect of their smaller abilities for fine-scale
selection of preferred plants and their lower need for high quality forage to convert into live
weight in contrast to sheep (Illius & Gordon 1987).
In order to improve livestock performance, mixed grazing of cattle and sheep was used
in this study. Confirming this hypothesis, mixed grazing produced higher live weight gains of
lambs and suckler cows when all years were considered together. In addition increased
outputs per area of mixed grazing treatments were found in contrast to mono-grazed cattle-
treatments. These results are in line with a recent meta-analysis integrating nine papers of
mixed grazing which underlines the advantage of mixed grazing for sheep production
(d'Alexis et al. 2013).
A special characteristic was the long duration of both experiments analysed in this
study. Insect recordings were performed between 2002 and 2004 and sites revisited in 2010
and 2011. Vegetation was analysed on the other experiment in six consecutive years in
relation to five years of grazing and associated secondary production of cattle and sheep
integrated on the basis of four years. Long-term grazing experiments are very rare, but
essential to deduce conclusions for real systems. Vegetation responses to grazing take a long

GENERAL DISCUSSION
89
time (Bullock et al. 2001; Jones et al. 1995; Marriott et al. 2009). In particular weather
conditions can have a marked impact and vegetation and subsequently pasture productivity
as well as insect populations are subject to high year-to-year variations (Bullock et al. 2001;
Jones et al. 1995; Milchunas et al. 1994; Roy et al. 2001). Therefore often different
conclusions from initial developments are drawn compared to the long-term evaluation of
the same study (e.g. Bullock et al. 2001). For instance, in the livestock species-experiment,
vegetation composition showed a significant effect of cattle grazing in the third year of the
experiment (Seither 2011), while findings of this work indicate no significant changes
according to livestock grazing-treatments.
Our study has shown that grazing management can be used to affect biodiversity. In
particular grazing intensity can shape faunistic diversity with regard of grasshoppers and
butterflies as a result of the structural modifications and patchy grazing mediated by cattle
under continuous stocking. The choice of livestock in rotational grazing seems to be less
important as we could only find marginal effects on phytodiversity by mono- or mixed
grazing of cattle and sheep. Although herbage masses were not larger in diverse swards, a
higher nutritive value was produced which subsequently benefitted lamb growth. We
suggest that phytodiverse swards can be used to enhance lamb production without negative
effects on calf performance. Therefore, this work represents a milestone strengthening the
inclusion and suitability of phytodiverse grasslands for secondary production of rearing
livestock.

GENERAL DISCUSSION
90
References
Adler, P., Raff, D. & Lauenroth, W. (2001) The effect of grazing on the spatial heterogeneity of vegetation. Oecologia, 128, 465–479.
Bailey, D.W., Dumont, B. & WallisDeVries, M.F. (1998) Utilization of heterogeneous grasslands by domestic herbivores: Theory to management. Annales de Zootechnie, 47, 321–333.
Barthram, G.T., Duff, E.I., Elston, D.A., Griffiths, J.H., Common, T.G. & Marriott, C.A. (2005) Frequency distributions of sward height under sheep grazing. Grass and Forage Science, 60, 4–16.
Bullock, J. M., Franklin, J., Stevenson, M.J., Silvertown, J., Coulson, S.J., Gregory, S.J. & Tofts, R. (2001) A plant trait analysis of responses to grazing in a long-term experiment. Journal of Applied Ecology, 38, 253–267.
Cid, M. & Brizuela, M. (1998) Heterogeneity in tall fescue pastures created and sustained by cattle grazing. Journal of Range Management, 51, 644–649.
Cuchillo Hilario, M. (2012) Grazing behavior and forage selectivity of cattle and sheep grazing alone or together on swards differing in plant species diversity. Cuvillier, Göttingen.
d'Alexis, S., Sauvant, D. & Boval, M. (2013) Mixed grazing systems of sheep and cattle to improve liveweight gain: a quantitative review. The Journal of Agricultural Science, 1–12.
Dennis, P., Young, M.R. & Gordon, I.J. (1998) Distribution and abundance of small insects and arachnids in relation to structural heterogeneity of grazed, indigenous grasslands. Ecological Entomology, 23, 253–264.
Dumont, B., Garel, J.P., Ginane, C., Decuq, F., Farruggia, A., Pradel, P., Rigolot, C. & Petit, M. (2007) Effect of cattle grazing a species-rich mountain pasture under different stocking rates on the dynamics of diet selection and sward structure. Animal, 1, 1042.
Eschen, R., Brook, A.J., Maczey, N., Bradbury, A., Mayo, A., Watts, P., Buckingham, D., Wheeler, K. & Peach, W.J. (2012) Effects of reduced grazing intensity on pasture vegetation and invertebrates. Agriculture, Ecosystems & Environment, 151, 53–60.
Forbes, T.D.A. & Hodgson, J. (1985) The reaction of grazing sheep and cattle to the presence of dung from the same or the other species. Grass and Forage Science, 40, 177–182.
Gardiner, T., Pye, M., Field, R. & Hill, J. (2002) The influence of sward height and vegetation composition in determining the habitat preferences of three Chorthippus species (Orthoptera: Acrididae) in Chelmsford, Essex, UK. Journal of Orthoptera Research, 11, 207–213.
Gibb, M.J. & Ridout, M.S. (1988) Application of double normal frequency distributions fitted to measurements of sward height. Grass and Forage Science, 43, 131–136.
Haddad, N.M., Crutsinger, G.M., Gross, K., Haarstad, J., Knops, J.M. & Tilman, D. (2009) Plant species loss decreases arthropod diversity and shifts trophic structure. Ecology Letters, 12, 1029–1039.
Hector, A. & Bagchi, R. (2007) Biodiversity and ecosystem multifunctionality. Nature, 448, 188–190.
Hector, A., Schmid, B., Beierkuhnlein, C., Caldeira, M.C., Diemer, M., Dimitrakopoulos, P.G., Finn, J.A., Freitas, H., Giller, P.S., Good, J., Harris, R., Högberg, P., Huss-Danell, K., Joshi, J., Jumpponen, A., Körner, C., Leadley, P.W., Loreau, M., Minns, A., Mulder, C.P.H., O‘Donovan, G., Otway, S.J., Pereira, J.S., Prinz, A., Read, D.J., Scherer-Lorenzen, M., Schulze, E.-D., Siamantziouras, A.-S.D., Spehn, E.M., Terry, A.C., Troumbis, A.Y., Woodward, F.I., Yachi, S. & Lawton, J.H. (1999) Plant Diversity and Productivity Experiments in European Grasslands. Science, 286, 1123–1127.
Huston, M.A. (1994) Biological diversity: The coexistence of species on changing landscapes. Cambridge University Press, Cambridge, New York, NY, USA.
Illius, A. & Gordon, I. (1987) The allometry of food intake in grazing ruminants. Journal of Animal Ecology, 56, 989–999.

GENERAL DISCUSSION
91
Isbell, F., Calcagno, V., Hector, A., Connolly, J., Harpole, W.S., Reich, P.B., Scherer-Lorenzen, M., Schmid, B., Tilman, D., van Ruijven, J., Weigelt, A., Wilsey, B.J., Zavaleta, E.S. & Loreau, M. (2011) High plant diversity is needed to maintain ecosystem services. Nature, 477, 199–202.
Jones, R.M., Jones, R.J. & McDonald, C.K. (1995) Some advantages of long-term grazing trials, with particular reference to changes in botanical composition. Australian Journal of Experimental Agriculture, 35, 1029-1038.
Kruess, A. & Tscharntke, T. (2002) Grazing intensity and the diversity of grasshoppers, butterflies, and trap-nesting bees and wasps. Conservation Biology, 16, 1570–1580.
Littlewood, N.A., Steward, A.J.A. & Woodcock, B.A. (2012) Science into practice - how can fundamental science contribute to better management of grasslands for invertebrates? Insect Conservation and Diversity, 5, 1–8.
Marion, B., Bonis, A. & Bouzillé, J.-B. (2010) How much does grazing-induced heterogeneity impact plant diversity in wet grasslands? Ecoscience, 17, 229–239.
Marriott, C., Hood, K., Fisher, J. & Pakeman, R. (2009) Long-term impacts of extensive grazing and abandonment on the species composition, richness, diversity and productivity of agricultural grassland. Agriculture, Ecosystems & Environment, 134, 190–200.
Metera, E., Sakowski, T., Słoniewski, K. & Romanowicz, B. (2010) Grazing as a tool to maintain biodiversity of grassland – a review. Animal Science Papers and Reports, 28, 315–334.
Milchunas, D.G., Forwood, J.R. & Lauenroth, W.K. (1994) Long-term grazing treatments in response to seasonal precipitation. Journal of Range Management, 47, 133–139.
Milchunas, D.G., Sala, O.E. & Lauenroth, W.K. (1988) A generalized model of the effects of grazing by large herbivores on grassland community structure. The American Naturalist, 132, 87–106.
Morris, M. (2000) The effects of structure and its dynamics on the ecology and conservation of arthropods in British grasslands. Biological Conservation, 95, 129–142.
Pavlů, V., Hejcman, M., Pavlů, L. & Gaisler, J. (2003) Effect of rotational and continuous grazing on vegetation of an upland grassland in the Jizerské hory Mts., Czech Republic. Folia Geobotanica, 38, 21–34.
Petersen, U., Wrage-Mönnig, N. & Isselstein, J. (2013) Effects of herbicide application to control sward composition in different management variants. International Journal of Biodiversity Science, Ecosystem Services & Management, 9, 155–165.
Rook, A., Dumont, B., Isselstein, J., Osoro, K., WallisDeVries, M., Parente, G. & Mills, J. (2004) Matching type of livestock to desired biodiversity outcomes in pastures – a review. Biological Conservation, 119, 137–150.
Röver, K.-U. (2006) Grazing behaviour and performance of beef cattle on grassland managed for biodiversity benefits. Cuvillier, Göttingen.
Roy, D.B., Rothery, P., Moss, D., Pollard, E. & Thomas, J.A. (2001) Butterfly numbers and weather: predicting historical trends in abundance and the future effects of climate change. Journal of Animal Ecology, 70, 201–217.
Roy, J. (2001) How does biodiversity control primary productivity. Terrestrial global productivity (eds J. Roy, B. Saugier & H.A. Mooney), pp. 169–186. Academic Press, San Diego, California.
Scherber, C., Eisenhauer, N., Weisser, W.W., Schmid, B., Voigt, W., Fischer, M., Schulze, E.-D., Roscher, C., Weigelt, A., Allan, E., Beßler, H., Bonkowski, M., Buchmann, N., Buscot, F., Clement, L.W., Ebeling, A., Engels, C., Halle, S., Kertscher, I., Klein, A.-M., Koller, R., König, S., Kowalski, E., Kummer, V., Kuu, A., Lange, M., Lauterbach, D., Middelhoff, C., Migunova, V.D., Milcu, A., Müller, R., Partsch, S., Petermann, J.S., Renker, C., Rottstock, T., Sabais, A., Scheu, S., Schumacher, J., Temperton, V.M. & Tscharntke, T. (2010) Bottom-up effects of plant diversity on multitrophic interactions in a biodiversity experiment. Nature, 468, 553–556.

GENERAL DISCUSSION
92
Seither, M. (2011) The effect of grassland botanical composition and (co-) grazing cattle and sheep on herbage production and sward nutrient utilisation. PhD-thesis, Georg-August-Universität Göttingen.
Tilman, D., Reich, P.B., Knops, J., Wedin, D., Mielke, T. & Lehman, C. (2001) Diversity and productivity in a long-term grassland experiment. Science, 294, 843–845.
van Ruijven, J. & Berendse, F. (2009) Long-term persistence of a positive plant diversity-productivity relationship in the absence of legumes. Oikos, 118, 101–106.
Vickery, J., Tallowin, J., Feber, R., Asteraki, E., Atkinson, P., Fuller, R. & Brown, V. (2001) The management of lowland neutral grasslands in Britain: effects of agricultural practices on birds and their food resources. Journal of Applied Ecology, 38, 647–664.
Weigelt, A., Weisser, W.W., Buchmann, N. & Scherer-Lorenzen, M. (2009) Biodiversity for multifunctional grasslands: equal productivity in high-diversity low-input and low-diversity high-input systems. Biogeosciences, 6, 1695–1706.
Weiss, N., Zucchi, H. & Hochkirch, A. (2012) The effects of grassland management and aspect on Orthoptera diversity and abundance: site conditions are as important as management. Biodiversity and Conservation.
Wrage, N., Şahin Demirbağ, N., Hofmann, M. & Isselstein, J. (2012) Vegetation height of patch more important for phytodiversity than that of paddock. Agriculture, Ecosystems & Environment, 155, 111–116.
Wrage, N., Strodthoff, J., Cuchillo, H.M., Isselstein, J. & Kayser, M. (2011) Phytodiversity of temperate permanent grasslands: ecosystem services for agriculture and livestock management for diversity conservation. Biodiversity and Conservation, 20, 3317–3339.
Zhu, H., Wang, D., Wang, L., Bai, Y., Fang, J. & Liu, J. (2012) The effects of large herbivore grazing on meadow steppe plant and insect diversity. Journal of Applied Ecology, 49, 1075–1083.

SUMMARY
93
SUMMARY
Grazing is seen as a promising tool to maintain and enhance biodiversity due to the
creation of structurally diverse pastures. So far, grassland biodiversity has been studied in
relation to various grazing management scenarios, but knowledge of grazing effects gained
on experiments managed in the same way over various years is very rare.
In the first experiment, we aimed to answer the question of which grazing intensity is
suitable to benefit insect diversity. On a long-term grazing experiment two treatments of
grazing intensity had been established in 2002, and an additional third treatment had been
introduced in 2005. The influence on insect diversity in terms of grasshopper (Orthoptera)
and butterfly (Lepidoptera) species richness and abundance was investigated from 2002 to
2004 and again in 2010 and 2011. Confirming our hypotheses, the most intensively grazed
paddocks featured the lowest diversity. However, the most extensive treatment did not
prove to be more favorable for insects than the medium one. We therefore suggest that
continuous grazing of medium intensity is most appropriate to maintain and enhance insect
diversity due to a sufficient average sward height and the creation of a patchy grazed sward.
This grazing management offers several ecological niches beneficial for a wide array of
species, in particular for less mobile herbivore groups like grasshoppers.
When focusing grassland phytodiversity, it is also important to consider the type of
grazing livestock. Grazer species differ with regard to their grazing behavior and can hence
differently affect vegetation and sward structure. In a second experiment, we therefore used
either cattle or sheep in mono grazing or both grazer species in mixed grazing. In order to
analyze the effect of grazers on different sward types, swards were also manipulated with
herbicides against dicotyledonous plants. Paddocks were grazed from 2007 to 2011 and
vegetation composition was studied before the grazing season each year and additionally in
2012. Sward composition and diversity confirmed obvious differences between sward types.
Grazer species, in contrast, had only negligible effects on vegetation development over years
and sward structure. Cattle-grazed paddocks had a higher alpha-(species richness) and beta-
diversity, but only for one year and one sward type. As conclusion, in rotational stocking the
choice between cattle and/or sheep can only be used in a limited way to form vegetation
composition and diversity on common agriculturally used grasslands with a very slight
advantage for cattle grazing in terms of phytodiversity.

SUMMARY
94
On the same experiment, we also studied how plant species diversity and productivity in
terms of herbage mass are related with livestock performance. Our results negated the
productivity-diversity theory. Pastures might offer enough plant species for complementary
resource use even on species-poor, herbicide treated swards. In contrast, forage of swards
with a high species richness contained more crude protein and less ADF thereby leading to a
higher nutritive value. However, these results might also be attributed to a legume effect
due to the overlap of species richness with legume and forb abundance in this experiment.
Pasture productivity and quality were both not influenced by grazer species. Considering all
years together, findings point towards an enhanced livestock output on phytodiverse
pastures reflected by daily live weight gains of lambs. Mixed grazing also seems promising to
contribute to an increased animal performance of lambs and suckler cows.
In conclusion, livestock grazing can be used to shape sward structure by the variation of
grazing intensity with subsequent effects on biodiversity, whereas the type of livestock
seems to have only minor effects, at least in the rotational grazing system studied here. Even
though the relationship between species richness and herbage production was not found, a
higher amount of dicotyledonous forbs and legumes can contribute to a better forage
quality which translates also into higher livestock weight gains of lambs. In conclusion,
grassland management can be used to enhance biodiversity and this in turn has the
potential to improve livestock performance.

ZUSAMMENFASSUNG
95
ZUSAMMENFASSUNG
Die Nutzung von Beweidung zur Erhaltung und Förderung von Biodiversität wird
allgemein als positiv erachtet, da so strukturell diverse Flächen erhalten werden können. Die
Auswirkungen unterschiedlicher Managementszenarien auf die Artenvielfalt sind zwar
weitreichend untersucht, auf Langzeitexperimenten jedoch sehr rar.
Mit unserem ersten Experiment wollten wir die Frage beantworten, welche
Nutzungsintensität am besten geeignet ist, um Diversität von Insekten zu fördern. Das dafür
genutzte Langzeitexperiment wurde 2002 mit zwei Beweidungsintensitäten etabliert und
eine dritte Intensitätsstufe 2005 eingeführt. Zwischen 2002 und 2004 sowie 2010 und 2011
wurde der Einfluss der Beweidungsvarianten auf die Insektendiversität im Sinne des
Artenreichtums und der Abundanz von Heuschrecken (Orthoptera) und Tagfaltern
(Lepidoptera) aufgenommen. Wie erwartet, zeigte sich bei intensivster Beweidung die
geringste Diversität. Trotzdem war die extensivste Beweidung nicht vorteilhafter als die
mittel intensive Beweidung. Aus diesem Grund empfehlen wir eine mittelstarke Beweidung,
da diese besonders geeignet ist um eine ausreichende Narbenhöhe und eine strukturell
diverse Grasnarbe zu schaffen. Dieses Management zeichnet sich durch vielfältige
ökologische Nischen aus, die einer Bandbreite von unterschiedlichen Arten Habitat bieten,
wovon besonders weniger mobile Herbivoren wie Heuschrecken profitieren können.
Wenn Pflanzendiversität im Vordergrund steht, muss auch die Art des Weidetiers
betrachtet werden, da sich die Tierarten in ihren Beweidungseigenschaften unterscheiden
und demnach auch Vegetation und Narbenstruktur beeinflusst werden können. In einem
zweiten Experiment haben wir deshalb den Einfluss von Rindern und Schafen in
Monobeweidung als auch in Mischbeweidung untersucht. Eine Hälfte der Parzellen wurde
mit Herbiziden gegen Dikotyle behandelt um den Weidetiereffekt in Abhängigkeit der
Narbenzusammensetzung zu analysieren. Das Experiment wurde zwischen 2007 und 2011
beweidet und die Vegetationszusammensetzung jeweils vor jeder Beweidungsperiode und
zusätzlich im Jahr 2012 aufgenommen. Die beiden Narbentypen zeigten wie erwartet
deutliche Unterschiede in Zusammensetzung und Diversität. Dahingegen unterschieden sich
die Weidetier-Varianten nur marginal voneinander. Die Rinderparzellen wiesen zwar eine
höhere alpha-(Artenreichtum) als auch beta-Diversität auf, allerdings war dieser Effekt nur in
einem Jahr auf jeweils einem Narbentyp zu finden. Zusammenfassend können gewöhnliche

ZUSAMMENFASSUNG
96
Weiden in ihrer Vegetationszusammensetzung und -diversität mithilfe unterschiedlicher
Tierarten nur geringfügig gesteuert werden. Es konnte lediglich ein marginaler Vorteil von
Rinder- gegenüber Schafbeweidung festgestellt werden
Auf demselben Experiment waren wir weiterhin daran interessiert, wie pflanzliche
Diversität und agrarische Produktivität miteinander verbunden sind. Unsere Ergebnisse
verneinen jedoch einen positiven Zusammenhang. Weiden besitzen wahrscheinlich ein
genügend großes Arteninventar auch bei artenarmer, herbizidbehandelter Ausprägung, so
dass eine komplementäre Ressourcennutzung bereits ausgeschöpft wird. Im Gegensatz dazu
enthielten die artenreicheren Futterproben tatsächlich mehr Rohprotein und weniger ADF,
so dass von einer gesteigerten Futterqualität gesprochen werden kann. Diese Ergebnisse
könnten jedoch auch durch ein erhöhtes Vorkommen von Leguminosen erklärt werden, da
auf dem Versuch aufgrund des Designs eine hohe Korrelation von Artenreichtum mit
Kräutern und Leguminosen besteht. Hinsichtlich der unterschiedlichen Weidetiere konnte
kein signifikanter Effekt weder auf Primärproduktivität noch auf Futterqualität festgestellt
werden. Über alle Jahre hinweg zeigte sich vor allem die Phytodiversität als förderlich für die
Lebendmassezunahmen der Lämmer. Zudem konnte die Mischbeweidung zu einer
gesteigerten Wachstumsintensität von Lämmern und Mutterkühen beitragen.
Zusammenfassend kann Beweidung genutzt werden um die Narbenstruktur zu steuern,
was vor allem durch eine Anpassung der Beweidungsintensität erreicht werden kann.
Nachfolgend wird sich die Intensität auf die Biodiversität aus, die jedoch durch die Wahl des
Weidetieres nur recht geringfügig beeinflusst wird. Auch wenn die Primärproduktivität nicht
mit dem Artenreichtum verbunden war, so kann durch das Hinzukommen von Kräutern und
Leguminosen doch eine Steigerung der Futterqualität erreicht werden, die sich auch in
höheren Lebendmassezunahmen der Lämmer wiederspiegelt. Demnach kann durch ein
geeignetes Graslandmanagement Einfluss auf die Biodiversität genommen werden, welche
wiederum das Potential besitzt, die tierischen Leistungen zu steigern.

97
ACKNOWLEDGEMENTS
The research leading to these results has received funding from the European Community's Seventh Framework Programme (FP7/ 2007-2013) under the grant agreement n° FP7-244983 (MULTISWARD). First of all I thank Prof. Dr. Johannes Isselstein for giving me the opportunity to work in his group, the excellent supervision of my thesis and constructive comments on my work. I thank Prof. Dr. Nicole Wrage-Mönnig for always encouraging me on my scientific way, for the support in writing papers and for participating in my thesis committee. I want to express my gratitude to Prof. Dr. Teja Tscharntke for co-reviewing my thesis. I am also grateful to the other members of my thesis committee, Prof. Dr. Dr. Matthias Gauly, Prof. Dr. Eva Schlecht and Prof. Dr. Christoph Leuschner. My thanks go to Barbara Hohlmann for everything: handling of animals, organization of experimental procedure, great conversations and the awesome atmosphere in our office. Special thanks to the staff at the experimental farm in Relliehausen, above all to Arne Oppermann and Knut Salzmann, for handling all aspects concerning the animals. I want to thank my lovely student assistants, above all Anja Schmitz and Birgit Schäbitz, for the participation in my investigations and the enjoyable time we had. Many thanks to Dr. Melanie Seither, Dr. Ute Petersen and Dr. Laura Breitsameter for the contribution to my scientific work. I would like to thank all the people from the grassland group for always encouraging me and for the great discussions we had. My gratitude goes to PD Dr. Christoph Scherber for his statistical support and also to Dr. Manfred Kayser for help in statistics and for many valuable scientific comments. Last but not least, I want to thank my family for their overall support in any kind and my friends: Without you, this work would not have been possible.