effects of land use and soil management on soil quality...
TRANSCRIPT

Faculteit Bio-ingenieurswetenschappen
Academiejaar 2010 – 2011
Effects of land use and soil management on soil quality in
the Mekong Delta, Vietnam
Sara Van Elsacker
Promoter: Prof. dr. ir. W. Cornelis
Tutor: Tran Ba Linh
Masterproef voorgedragen tot het behalen van de graad van
Master in de bio-ingenieurswetenschappen: Milieutechnologie


This is an unpublished M. Sc. thesis and is not prepared for further distribution. The author and
the promoter give the permission to use this thesis for consultation and to copy parts of it for
personal use. Every other use is subject to the copyright laws, more specifically the source must
be extensively specified when using results from this thesis.
Dit werk is een niet gepubliceerde M. Sc. thesis en is niet uitgewerkt voor verdere distributie. De
auteur en de promotor geven de toelating dit afstudeerwerk voor consultatie beschikbaar te
stellen en delen ervan te kopiëren voor persoonlijk gebruik. Elk ander gebruik ervan valt onder
de beperkingen van het auteursrecht, in het bijzonder met betrekking tot de verplichting
uitdrukkelijk de bron te vermelden bij het aanhalen van de resultaten uit dit afstudeerwerk.
Gent,
The Promoter, The Author,
Prof. dr. ir. W. Cornelis Sara Van Elsacker


i
ACKNOWLEDGEMENT
Before I start to thanking those who supported me during the accomplishment of my thesis, I
would first like to thank my mother, my father, my sister, Patrick, all my other family and close
friends who supported me during the though first years of University and in particular during my
exams, when I was no pleasure to look or listen at. I am also grateful to those that helped me to
make it through the difficult courses and to the professors that where passionate with the
lectures they taught.
Without you all, I would not be where I am now.
To carry out my thesis I had the support of a lot of people. During my three-month stay in
Vietnam Linh Tran Ba helped me to start the research. He also arranged practical matters, such
as housing, local transport, communication with local people etc. We got invited to the beautiful
countryside and he made me see the real Vietnam. Back in Belgium, he helped me to complete
my thesis. I cannot thank him enough for what he did.
Also, I am thankful to all the people in Can Tho University who showed me around in the lab,
helped me to take soil samples, and drove me around on their motorbikes, and to Dr. Le Van
Khoa to be my local promoter in Can Tho.
In addition, I would like to thank Lieselot to be a good friend during our stay in Vietnam and
Sophie, Michiel and all other people we met in the Mekong Delta, to make this experience
unforgettable.
In particular I would like to acknowledge my promoter Prof. dr. ir. Wim Cornelis for his guidance,
helpful recommendations and insights. Notwithstanding his very busy schedule and the large
amount of thesis students under his regard, he managed to get some time to discuss my
research and writing.
Kindly thanks to VLIR-UOS for funding this thesis in Can Tho, Vietnam.
Finally, I would also like to thank Charlotte, Hanne and Katrien, with who I shared the experience
to write a thesis in the same house. I could always rely on these three wonderful girls, on
difficult moments or to ask for advice. Thanks to my classmates who also shared the feeling of
being a last year student at university, a time I will never forget. And last but not least, I would
like to thank Jordi, for everything he did for me and for all the love he gave me.

ii
ABSTRACT
The Mekong Delta, situated in the South of Vietnam, is one of the biggest and most fertile deltas
in South East Asia. Alluvial soils account for about 31.5 percent of the Mekong Delta, they have a
silt-clay to clay texture and, because of the delta’s flat area, the soil is poorly drained. Low
investment in diversification of crops, imbalanced fertilizer application, changing land use, and
increasing mechanization have led to land degradation and consequently crop yield losses. This
intensive land use also affects the farmers income.
A study area in Cai Lay district (Tien Giang province, belonging to the Mekong Delta), where the
alluvial soils have been used intensively by many farmer generations, is representative for the
current problems in the South of Vietnam. This area is suitable for rice production and therefore
continuous rice cultivation is the dominant cropping pattern. The experimental site with
different land use and land management practices was arranged in a randomized complete block
design with four replications. Each plot has an area of exact 42 m². The six different treatments
were: rice-rice-rice, rice-rice-rice+10 tons organic manure/crop season, rice-maize-rice, rice-
maize (+10 tons organic manure)-rice, rice-mungbean-rice, rice-mungbean- maize. Physical and
chemical soil quality indicators were determined to better understand and interpret sustainable
management of the soil.
Results showed an improvement of soil quality for crop rotations with upland crops, particularly
in the distribution of soil organic carbon, labile C and the nutrient supply. This was translated in
a decreased bulk density, an increased total porosity and macro-porosity for the 20-30 cm
horizon, which resulted in a higher air capacity, plant available water capacity, stability quotient
and Dexter’s S-index. There was a high correlation (r=0.84) between soil organic carbon and
water content at permanent wilting point, which implies that the water content at permanent
wilting point was significant lower for the rotations with one upland crop. For matrix porosity,
absence of optimum values made it difficult to interpret the results.
The addition of organic manure to the rotations (R-R-R+OM and R-M-R+OM) did not show a
significant increase in soil organic carbon and labile C and subsequently, no difference in bulk
density and total porosity was noticed. However, improvement in Nav, Pav and total acidity has
been observed in the rice monoculture and plastic limit, air capacity, stability quotient increased
for both treatments with organic manure.
iii
From the interviews with the farmers, it was concluded that the rice yield in the last five years
increased when rotation with upland crops was implemented, which was strongly in contrast
with the rice-yield decrease over the last five years for rice monoculture. Farmers are reluctant
to use upland crops because of the higher (cost for) labor. We calculated, however, that the
benefit/cost-ratio was the highest for rotation with one upland crop in between two rice
cultivations.
SAMENVATTING
De Mekong Delta, gesitueerd in het zuiden van Vietnam, is één van de grootste en vruchtbaarste
delta’s in Zuidoost Azië. Alluviale bodems nemen 31,5 procent van de Mekong Delta voor hun
rekening en de bodems in deze omgeving hebben een lemig klei tot kleitextuur. Doordat het
gebied vlak is, is de bodem slecht gedraineerd en de weinige investeringen in
gewasdiversificatie, onevenwichtige bemesting, veranderingen in landgebruik en stijgende
mechanisatie hebben geleid tot landdegradatie en vervolgens tot daling van gewasopbrengst.
Een studiegebied in Cai Lay District (Provincie Tien Giang), waar alluviale bodems reeds vele
generaties intensief door landbouwers worden gebruikt, is representatief voor de huidige
problemen in het zuiden van Vietnam. Dit gebied is geschikt voor rijstproductie en daarom is
continue rijstteelt de meest voorkomende landbouwactiviteit. Het proefterrein met
verschillende grondgebruiken en landbeheer werd gerangschikt in een gerandomiseerd
complete blok ontwerp met vier herhalingen. Elk stukje grond heeft een oppervlakte van 42 m².
De verschillende behandelingen waren: rijst-rijst-rijst, rijst-rijst-rijst+10 ton organische
mest/teeltseizoen, rijst-maïs-rijst, rijst-maïs(+10 ton organische mest)-rijst, rijst-mungboon-rijst
en rijst-mungboon-maïs. Fysische en chemische bodemeigenschappen werden bepaald om een
goed inzicht en een goede interpretatie van duurzaam bodembeheer te bekomen en om aan
toekomstige behoeften te kunnen voldoen.
De resultaten toonden een verbetering in de verdeling van bodemorganisch materiaal, labiele
koolstof en nutriëntaanbod bij gewasrotatie met maïs of mungboon. Dit werd vertaald in een
verlaagde dichtheid, een verhoogde totale porositeit en macroporositeit voor de 20-30 cm
horizon, wat resulteerde in een hogere luchtcapaciteit, hogere beschikbare watercapaciteit voor
de plant, hogere stabiliteitsquotiënt en hogere Dexter’s S-index. Er bestond een hoge correlatie
tussen bodemorganisch materiaal en het watergehalte bij permanent verwelkingpunt (r=0.84),
wat inhoud dat de waterinhoud bij permanent verwelkingpunt voor rotatie met één niet-rijst

iv
voedingsgewas lager was. De interpretatie van de matrix porositeit werd bemoeilijkt door de
afwezigheid van optimale waarden.
De toevoeging van organische mest aan de rotaties (R-R-R+OM en R-M-R+OM) wezen niet op
significante stijging aan bodemorganisch materiaal en labiele koolstof en vervolgens kon geen
verschil in bulkdensiteit en totale porositeit worden waargenomen. Echter, verbetering in totale
aciditeit, beschikbare stikstof en fosfor werden waargenomen in de rijst monocultuur. De
uitrolgrens, luchtcapaciteit en stabiliteitsquotiënt stegen voor beide behandelingen met
organische mest.
Uit de interviews met de landbouwers kon worden geconcludeerd dat de rijstopbrengst de
laatste vijf jaar een stijging vertoonde bij gewasrotatie met één of meerdere niet-rijst
voedingsgewassen, wat sterk in contrast was met een zichtbare daling in rijstopbrengst bij
monoculturen. Boeren zijn echter niet gewillig om niet-rijst voedingsgewassen te gebruiken door
de extra (kost voor) arbeid. We berekenden echter dat de baten-kosten-verhouding het hoogst
was voor de rotatie met één niet-rijst voedingsgewas tussenin twee rijstteelten.

v
TABLE OF CONTENTS
ACKNOWLEDGEMENT ------------------------------------------------------------------------------------------------------- i
ABSTRACT ----------------------------------------------------------------------------------------------------------------------- ii
SAMENVATTING -------------------------------------------------------------------------------------------------------------- iii
TABLE OF CONTENTS --------------------------------------------------------------------------------------------------------- v
LIST OF FIGURES ------------------------------------------------------------------------------------------------------------- vii
LIST OF TABLES-------------------------------------------------------------------------------------------------------------- viii
ABBREVIATIONS AND ACCRONYMS ------------------------------------------------------------------------------------- ix
1. INTRODUCTION ---------------------------------------------------------------------------------------------------------1
2. LITERATURE REVIEW ---------------------------------------------------------------------------------------------------3
2.1. Soil as a non-renewable natural resource -----------------------------------------------------------------3
2.2. Alluvial soils -------------------------------------------------------------------------------------------------------3
2.3. Soil quality and soil health -------------------------------------------------------------------------------------4
2.4. Soil degradation -------------------------------------------------------------------------------------------------8
2.4.1. Soil degradation processes ------------------------------------------------------------------------------9
2.4.1.1. Loss of organic matter -----------------------------------------------------------------------------9
2.4.1.2. Erosion -------------------------------------------------------------------------------------------------9
2.4.1.3. Floods ------------------------------------------------------------------------------------------------ 10
2.4.1.4. Salinisation and sodification ------------------------------------------------------------------- 11
2.4.1.5. Compaction ---------------------------------------------------------------------------------------- 11
2.4.1.6. Contamination ------------------------------------------------------------------------------------- 12
2.4.1.7. Sealing ----------------------------------------------------------------------------------------------- 12
2.4.2. Identification of soil degradation processes ------------------------------------------------------ 13
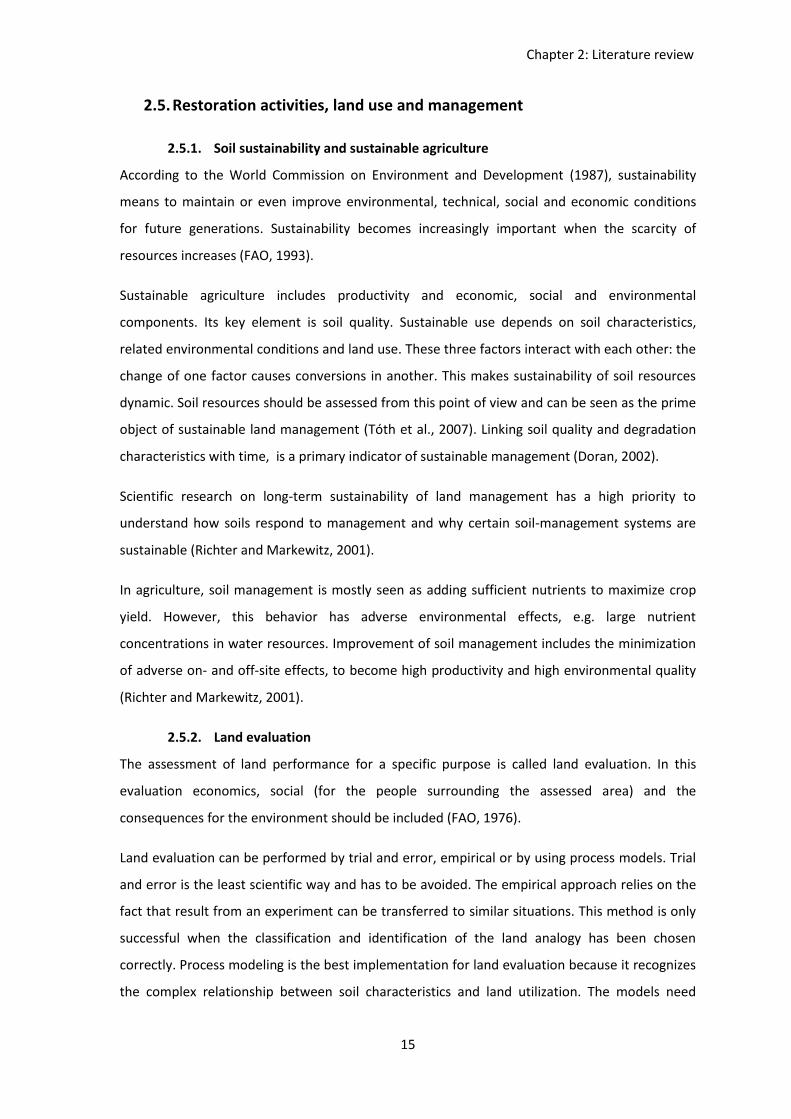
2.5. Restoration activities, land use and management ----------------------------------------------------- 15
2.5.1. Soil sustainability and sustainable agriculture --------------------------------------------------- 15
2.5.2. Land evaluation ------------------------------------------------------------------------------------------ 15
vi
2.5.3. Impact of crop rotation and land use on soil quality ------------------------------------------ 16
2.6. Soil requirements of maize, mungbean and rice ------------------------------------------------------ 18
3. MATERIALS AND METHODS --------------------------------------------------------------------------------------- 19
3.1. Study area ------------------------------------------------------------------------------------------------------- 19
3.2. Experimental design ------------------------------------------------------------------------------------------ 21
3.3. Field survey ----------------------------------------------------------------------------------------------------- 22
3.4. Soil analysis ----------------------------------------------------------------------------------------------------- 23
3.4.1. Field measurements ----------------------------------------------------------------------------------- 23
3.4.2. Soil sampling --------------------------------------------------------------------------------------------- 23
3.4.3. Chemical soil analysis ---------------------------------------------------------------------------------- 24
3.4.4. Soil physical analysis ----------------------------------------------------------------------------------- 24
3.5. Statistical analysis --------------------------------------------------------------------------------------------- 29
4. RESULTS AND DISCUSSION ---------------------------------------------------------------------------------------- 30
4.1. Chemical soil properties ------------------------------------------------------------------------------------ 30
4.2. Physical soil properties and characteristics ------------------------------------------------------------- 34
4.3. Soil water characteristics ------------------------------------------------------------------------------------ 47
4.3.1. Soil water retention curve ---------------------------------------------------------------------------- 47
4.3.2. Soil water properties ----------------------------------------------------------------------------------- 49
4.4. Field survey with farmers ----------------------------------------------------------------------------------- 52
5. GENERAL CONCLUSIONS AND RECOMMENDATIONS ------------------------------------------------------- 59
REFERENCES ----------------------------------------------------------------------------------------------------------------- 61
APPENDICES ----------------------------------------------------------------------------------------------------------------- 70

vii
LIST OF FIGURES
Figure 2.1: Multiple scales for soil quality evaluation (Karlen et al., 1997). ------------------------------------8
Figure 3.1: Map of the Mekong Delta Vietnam, with the study location. ------------------------------------- 19
Figure 3.2: Map of Tien Giang province, with the study location ----------------------------------------------- 20
Figure 3.3: Distribution of mean monthly rainfall and temperature at the experimental site. ---------- 21
Figure 4.1: Bulk density for six different treatments, at three depths. ---------------------------------------- 35
Figure 4.2: Influence of six different crop rotations at three depths on soil matrix porosity. ----------- 38
Figure 4.3: Influence of six different crop rotations, at three depths on the plastic limit, the liquid
limit and the plasticity index. -------------------------------------------------------------------------------------------- 41
Figure 4.4: correlation between plastic limit and organic carbon. ---------------------------------------------- 42
Figure 4.5: Soil strength. -------------------------------------------------------------------------------------------------- 43
Figure 4.6: Air capacity of six different treatments at three depths. ------------------------------------------- 45
Figure 4.7: Effect of the treatments on soil water retention characteristics, at depth 0-10 cm. -------- 48
Figure 4.8: Effect of the treatments on soil water retention characteristics, at depth 10-20 cm. ------ 48
Figure 4.9: Effect of the treatments on soil water retention characteristics, at depth 20-30 cm. ------ 49
Figure 4.10: Rice yield within recent-past 5 years (kg/ha) for different land management systems. -- 56
Figure 4.11: Cost and income for different crop rotations. ------------------------------------------------------- 57

viii
LIST OF TABLES
Table 2.1: Summary of soil characteristics and soil-forming factors that determine soil
degradation processes. --------------------------------------------------------------------------------------------------- 13
Table 3.1: Nutritional characteristics of the compost used at the study location. ------------------------- 22
Table 4.1: Chemical properties: EC, CEC, SOC, labile C. ----------------------------------------------------------- 31
Table 4.2: Chemical properties: TA, Nav, Pav. ------------------------------------------------------------------------- 33
Table 4.3: Particle density, total porosity and clay content for the six different treatments. ----------- 36
Table 4.4: Influence of six different crop rotations at three depths on soil macro-porosity ------------ 40
Table 4.5: Influence of six different rotations of crops at three depths on selected soil physical
quality indicators and parameters. ------------------------------------------------------------------------------------ 46
Table 4.6: Soil water characteristics for six different crop rotations at three depths. -------------------- 51
Table 4.7: Mean area under cultivation (ha) and costs-benefit ratio. ----------------------------------------- 58

ix
ABBREVIATIONS AND ACCRONYMS
AC Air Capacity
ANOVA Analysis of Variance
CEC Cation Exchange Capacity
EC Electric Conductivity
FA Factor Analysis
FAO Food and Agriculture Organization
FC Field Capacity
IS Instability Index
Ks Saturated hydraulic conductivity
LL Liquid Limit
MacPOR Macro-porosity
MatPOR Matrix porosity
MBC Microbial Biomass Carbon
MDS Minimum Data Set
P Precipitation
PAWC Plant Available Water Capacity
PI Plasticity Index
PL Plastic Limit
RH Relative Humidity
RWC Relative Water Capacity
SI Stability Index
SQI Soil Quality Index
SOC Soil Organic Carbon
SOM Soil Organic Matter
SSSA Soil Science Society of America

x
TA Total acidity
TAW Total Available Water
UNESCO United Nations Educational, Scientific and Cultural Organization
USDA United States Department of Agriculture

Chapter 1: Introduction
1
1. INTRODUCTION
Vietnam is a country in South East Asia with 84,967,524 inhabitants. Since 2000, there has been
a strong progress in the agricultural sector in Vietnam, with an overall growth of 4 percent a
year. Vietnam is the world’s second large rice exporter and the livelihoods of 90 percent of the
poor inhabitants, or two thirds of the population, of Vietnam are dependent on agriculture
(Worldbank, 2010).
The Mekong Delta, situated in the South of Vietnam, is one of the biggest and most fertile deltas
in South East Asia. This region provides 50 percent of Vietnam’s rice production, 90 percent of
the rice export volume and 70 percent of the fruit production output (Vietnam Business Forum,
2010). Water from the Mekong River is used for irrigation, fishing and domestic use and is the
main water resource (Minh, 2000).
Soil groups of alluvial sedimentation account for about 31.5 percent of the Mekong Delta and
are generally located on the river side. The soils in these surroundings have a silt-clay to clay
texture and, because of its flat surface, the soil is poorly drained.
Low investment in diversification of crops, imbalanced fertilizer application, changing land use,
and increasing mechanization have led to land degradation and consequently crop yield losses.
This intensive land use also affects the farmer’s income.
As a result of sea level rise and intensive rice-shrimp farming, intrusion of saltwater occurs.
Sustainable management of the soil is necessary because it is a non-renewable resource and
thus needs protection to ensure the fulfillment of future needs. Good understanding and
interpretation of possible soil quality indicators is important to meet this goal. The objective of
this research was therefore to assess the impact of land management practices on soil quality.
A study area in Cai Lay district (Tien Giang province, belonging to the Mekong Delta), where the
alluvial soils have been used intensively by many farmer generations, is representative for the
current problems in the South of Vietnam. This area is suitable for rice production and therefore
continuous rice cultivation is the dominant cropping pattern. This intensive land use involves the
growth of three rice crops per year, and even up to seven rice crops in two years. Over several
years many different farming practices, such as irrigation, drainage, tillage under wet soil
conditions, inorganic fertilizer application, pesticide use and burning of plant residues, have
been implemented. This poor land management and intensive farming are some of the causes of
the land degradation. The local farmers in this area observed that rice yield has been gradually

Chapter 1: Introduction
2
declining every year, even when the same amount (or even an increasing amount) of chemical
fertilizer was applied. Experiments have been set up to understand how to avoid these negative
effects. They comprise new land utilization systems that exist of rotation of rice and upland
crops in order to improve soil fertility and hereby farmer’s income.
Important soil properties for evaluating soil change and soil quality in agricultural systems,
particularly on alluvial soils in the Mekong Delta, were determined to provide a clear evaluation
and better understanding of the effects of land use and soil management practices on soil
quality, in general.
The main questions that have been addressed were:
Are soil characteristics related to soil degradation?
Is there a relationship between soil quality and the present and historical land uses and
land management practices?
How can we control and restore soil degradation in alluvial soils in the Mekong Delta?
Based on the obtained data, can we identify soil quality in the future for the studied soil
group as well as introduce new land use systems and land management practices?

Chapter 2: Literature review
3
2. LITERATURE REVIEW
2.1. Soil as a non-renewable natural resource
Soil is a natural resource with crucial ecological, economic and social functions. It is the upper
part of the earth crust that exists of mineral and organic solids, and pores filled with air and
water. Soil is the essential component of the terrestrial environment and forms the interface
between geosphere, atmosphere, hydrosphere and biosphere (Doran and Parkin, 1994).
The proportions of different components, especially sand, loam and clay, organic matter,
mineral components, water and air (especially in the pore space) and the way they form a stable
structure, determine the soil characteristics. Every soil exists of different horizons, with different
physical, chemical and biological properties. Chemical properties are mostly related to the clay
fraction and soil organic carbon, while physical properties are determined by the size
distribution of the mineral particles (Wild, 2003).
This non-renewable resource has several important functions, including: biomass production;
storing, filtering and transforming nutrients and water; hosting the biodiversity pool; acting as a
platform for most anthropogenic activities; providing raw materials; acting as a carbon pool and
storing geological and archeological heritages. These functions are determined by the soil
characteristics and makes it important to understand the physical, chemical and biological
processes and their interactions (Hassett and Banwart, 1992; Tóth et al., 2007).
Soil structure and characteristics are the result of soil formation. Most important factors of soil
formation are parent material, relief, climate, time, biological and anthropological factors. Soil is
known as a non-renewable resource because formation and recovery are time-consuming
(MIRA, 2007).
2.2. Alluvial soils
Alluvial soils are relatively young (less developed) soils in alluvial plains (Edelman and Van der
Voorde, 1963). They are deposited by water and origin from the youngest geological time
period, the Holocene (Brady, 1990). These soils are worldwide responsible for more than 25
percent of the food supply.
The properties of alluvial soils vary strongly and are dependent on the mineral composition, the
origin of the sedimentary material and deposition of the soil. In the Mekong river, because of its
excessive basins, supplied sediment is rich in nutrients. Unlike in moderate climates, deposits in

Chapter 2: Literature review
4
the tropics contain little CaCO3. This makes tropical alluvial soils often acid and subjective to
faster degradation of organic material, what in general implies a low organic carbon content for
these soils (Edelman and Van der Voorde, 1963).
The fertility of alluvial soils is dependent on the type of deposited clay mineral. In the tropics the
most important clay minerals are kaolinite, illite (by contact with seawater) and
montmorillonite. The physical fertility of alluvial soils mostly depends on the structure and its
swell and shrink capacity (Brady, 1990).
The Mekong Delta is occupied by one million ha of alluvial soils (Khoa, 2002), this is 31.5% of the
delta’s land area (Chieu et al., 1990; Ve and Anh, 1990). The Mekong river transports every year
500 milliard m³ water, containing 70 million tons of sludge. Sedimentation occurs every year
during the flood season in the delta area. Agronomically, the alluvial soils are the best soils in the
Mekong Delta. The pH varies from 4.5 to 6.5. The topsoil exists of 2 to 5% organic material, but
this declines strongly with the depth (C/N for topsoil: 5-12; C/N for lower horizons: 12). Total
nitrogen is moderate for the topsoil (0.1-0.3%), but much lower for underlying horizons (to
0.05%). The phosphorus concentration also declines with the depth (from 0.08% to lower than
0.05%). The total content of potassium is generally high (0.10-0.15%) (Cartrysse, 1999).
2.3. Soil quality and soil health
2.3.1. Soil Quality
According to the Soil Science Society of America (SSSA) the simplest definition of soil quality is
“the capacity of soil to function”. A more extended definition represents soil quality as: "the
capacity of a specific kind of soil to function, within natural or managed ecosystem boundaries,
to sustain plant and animal productivity, maintain or enhance water and air quality, and support
human health and habitation" (Karlen et al., 1997).
Soil quality can be seen in several different ways. In the past it was seen in relation to plant
cultivation and crop productivity, resulting from physical, chemical and biological soil fertility.
Fertility indicators were soil-water-air ratio in the soil, formation of soil aggregates, water-
holding capacity, rooting, potential of nutrient supply, adsorption capacity of nutrients and
abundance of soil organisms (MIRA, 2007).
Doran et al. (1996) recommend that soil quality rather should be based on its soil function. If a
soil is not suitable for a specific use, it should not be used to define soil quality for this specific
use. Most of the time it is not possible to make a perfect combination between soil and its

Chapter 2: Literature review
5
intended function, which makes that use of a best management scenario is recommended. The
functions, processes and attributes of ecosystem concepts and indicators are a useful framework
to indicate soil quality. Soil quality defines an objective state or condition of the soil, but also has
to be seen subjective because evaluation is dependent on personal and social determination
(Carter, 2002). An agricultural soil with good quality promotes and sustains good agricultural
productivity with a negligible environmental impact and possesses physical, chemical and
biological attributes to fulfill these requirements (Reynolds et al., 2007).
Soil quality can be subdivided in his inherent capacity for crop growth and in a dynamic part,
influenced by its user. Dynamic soil quality contains the soil properties that change in a short
time period and that are influenced by human activity, i.e. agronomic practices. This assumes
that when the soil operates at its full potential for a specific land use, optimal quality is achieved
(Karlen et al., 1997). Inherent soil quality encompasses soil’s natural composition, function of
soil state factors and geological materials. The typical characteristics are almost static and
change little over time, like mineralogy and particle size distribution. One should also consider
extrinsic factors such as climatic, topographic and hydrologic parameters to evaluate inherent
soil quality for crop production. For example, retention of moisture in clay soils is favorable for
semiarid areas but is undesirable for humid conditions in poor drained areas. This makes that no
universal set of inherent soil criteria exists (Carter, 2002) and implies that if ecosystem processes
are well understood, the system will be truly sustainable (Karlen et al., 1997;Carter, 2002).
Ecosystem management and soil interpretation can be improved by evaluation of the
relationship between inherent and dynamic properties (Levi et al., 2009).
It is also possible to divide soil quality in soil physical, soil chemical and soil biological quality,
although these components interact and thus are not truly separable (Reynolds et al., 2007).
In general, sustainable land use is very important for agriculture and forestry to guaranty a good
soil quality. Sustainable soil use is referred to “the use of soils as a natural resource on a way
that does not exert any negative effects - that are irreparable under rational conditions - either
on the soil itself or any other systems of the environment” (after Tóth et al., 2007). Sustainable
methods of land management can guarantee good soil use if the material and energy flows
associated with soil processes are controlled and positively influenced. This means that a good
soil quality eventually can be preserved by good management and maintenance of soil
characteristics.

Chapter 2: Literature review
6
Farmers need simple and affordable measurements to compare and control options for land use
and to measure the risk of soil degradation caused by their management practices. Soil quality
assessment can serve as a basis for this comparison and is the main criteria for planning and
practicing sustainable soil use.
2.3.2. Soil Heath
Doran and Zeiss (2000) defined soil health as: “the continued capacity of soil to function as a
vital living system, by recognizing that it contains the biological elements that are the key to
ecosystem function within land use boundaries”. A healthy soil has to be able to sustain
biological productivity, maintain the quality of surrounding air and water and to promote animal,
plant and human health (Doran et al., 1996). Most of the time, the terms soil quality and soil
health are used interchangeable, but it is important to notice that soil quality is linked to its
function and that soil health presents soil as a dynamic, living and finite non-renewable resource
(Doran and Zeiss, 2000).
2.3.3. Soil Quality Indicators
Certain parameters or indicators can measure the overall soil quality. A group of chemical,
physical and biological indicators can form a minimal data set (MDS), which can be measured at
regular intervals and be compared with predefined standards. These indicators meet the
demand for evaluation of the effect of management on soil function (Doran and Parkin, 1994). A
MDS is depends on the land use and the site (Baldwin, 2006).
Parameters of the MDS are sensitive to management changes and change should be detected in
relative short time. The data and measurement methodology should be accessible to most
people and the parameters for the MDS should have a utility in defining ecosystem processes
(Doran, 2002). Standardized methodology and threshold values for interpretation of soil quality
indicators is utterly important (Doran and Parkin, 1994). The MDS provides a list of indicators
necessary for assessment of soil quality (Doran and Parkin, 1996).
2.3.4. Soil Quality Evaluation
To evaluate soil quality, a conceptual framework could be used (Figure 2.1; Karlen et al., 1997).
This scheme recognizes that soil quality can be seen as an inherent or a dynamic function and
can be evaluated at different scales.
The first questions to be asked in the scheme are: how does the soil work and which indicators
can be used to make an appropriate evaluation? The second step is to develop parameter values
to indicate on which capacity a system is working. After this, a point-scale evaluation of soil

Chapter 2: Literature review
7
quality of sub-disciplinary levels can be made. This means that soil function can be assessed in
terms of physical, chemical and biological properties and processes. Physical parameters (e.g.
soil structure, pore space size and distribution, aggregate stability, saturated hydraulic
conductivity, particle bonding or retention mechanisms) might be used to evaluate how well a
certain soil accepts, retains and transmits water to crops. Chemical parameters include exchange
capacity, pH, C-content and absorption capacity. Biological properties of soil quality to sustain
plant growth include microbial biomass, respiration, mycorrhizal associations, nematode
communities, enzymes or fatty-acid profiles as parameters. The framework somehow influences
the function for which the assessment was made, needs some definable standards to compare
with and has to be sensitive enough to observe differences between time and space in the point-
scale. The point-scale can be extrapolated to develop full-potential values for soil groups. Plot-
scale can be directed with a disciplinary focus (level 1), but cross-disciplinary is more useful for
larger systems (level 2).
The evaluation of soil quality leads from an experimental mode, that helps to understand the
mechanisms and processes, to a monitoring approach (level 3). This implies that land managers
and decision makers have to cooperate with researchers to use existing information and identify
knowledge gaps. In the last level (level 4) the need for regional, national and international
assessment of soil quality is identified. This level uses very broad en general perspectives for
overall soil quality and sustainable land use (Karlen et al., 1997).
However, to evaluate land management in the near or distant future, this soil quality evaluation
is not sufficient. To monitor changes in sustainability and environmental quality, to identify
production problem areas, a soil quality index, which integrates different indicators, should be
used (Doran and Parkin, 1994).

Chapter 2: Literature review
8
Figure 2.1: Multiple scales for soil quality evaluation (Karlen et al., 1997).
2.4. Soil degradation
Soil degradation can be defined as the loss of soil or soil quality for a number of soil functions.
Loss of organic matter, erosion, floods, salinisation, compaction, landslides, contamination and
sealing are the eight most important degradation processes and are closely related to
agriculture. Most of the degradation processes are strongly correlated. Risk of soil degradation
can also be caused by extreme natural condition, but are rather rare in comparison with human
influence (Blum, 1998).
Degradation of soil has a direct impact on water and soil quality, influences food chains, climate
change and hinders biosphere functioning (Tóth et al., 2007). This makes it important to

Chapter 2: Literature review
9
maintain a good soil condition to guarantee good environmental conditions and high
productivity (MIRA, 2007).
2.4.1. Soil degradation processes
2.4.1.1. Loss of organic matter
The most important function of organic matter is to supply the binding and buffer capacity of
the soil and contributes to limit diffusion of contaminated water through the soil (MIRA, 2007).
Soil Organic Matter (SOM) provides the sequestration of atmospheric CO2 and emits some
greenhouse gasses. Change in land use can elevate CO2- and greenhouse gas emission (Batjes,
1996). Soil Organic Carbon (SOC) is one of the most important components of SOM. SOC is
indispensable for ecosystem functioning, has a major influence on soil structure, water holding
capacity, cation exchange capacity (CEC) and soils’ ability to form complexes with metal ions and
nutrients for storage (Milne et al., 2007). Moreover, soil is very important for the global carbon
cycle (MIRA, 2007).
The decline of SOM is mainly caused by climate change, decoupling of cattle breeding and
agricultural activities and of intensification of agricultural practice, e.g. higher frequencies and
depth of tillage, continuous cropping and narrow crop rotations (Gardi et al., 2008). In
agriculture, the factors to be controlled to reduce SOM-loss are crop rotation, tillage and
management practice (Rickman et al., 2002). Loss of SOC can cause shortage of nutrients for
sustainable plant production (Maréchal et al., 2008).
To restore SOM content in crop cultivation, land management options such as improved farming
on eroded soils, reduced or no tillage, improved residue management, organic amendment, and
improved crop rotation should be introduced (Dawson and Smith, 2007).
Loss of SOM often depends on other degradation processes like wind and water erosion, floods
and landslides (Dawson and Smith, 2007).
2.4.1.2. Erosion
Soil erosion is the detachment, transport and deposition of soil particles. It can be divided in
wind- and water erosion and mass movement. Erosion caused by operation processes is also
seen as a separate process and occurs as soil displacement due to tillage and is termed “tillage
erosion” (Wildemeersch et al., 2011).

Chapter 2: Literature review
10
Water erosion is a natural process caused by loss of organic matter content, topography, type
and amount of vegetation covering the soil and by intensive rainfall. However, it can be
increased drastically by human activities (e.g. crop practice, deforestation,…) (Gay et al., 2009).
Erosion of cultivated soils frequently results from aggregate breakdown (i.e. slaking, breakdown
by differential swelling, mechanical aggregate destruction by rain drop impact and physico-
chemical dispersion) and its relative importance depends on the nature of the rain and soil’s
physical and chemical properties. Soil’s susceptibility to this kind of erosion can be expressed by
its aggregate stability (Le Bissonnais, 1996).
Wind erosion has a major influence on fine particles and results, among others, in fertility
degradation and reduction of air quality. This makes that the effects of wind erosion on
agricultural productivity are only observed after a long time. Other interactions of various
factors, such as land use, have a large influence on wind erosion risk (Gay et al., 2009).
Tillage erosion is caused by agricultural tools and plowing is the main process that provides
vertical and lateral displacement of soil. This phenomena leads to redistribution of nutrients and
organic matter, which can cause that there are relative impoverished zones and other zones
with accumulation of too much nutrients (MIRA, 2007).
Finally, export of soil during harvesting of crops is an important factor of erosion, especially
when the harvested part is located under the ground. This leads to reduction of soil quality and
sequentially to reduced crop yield (Gay et al., 2009).
2.4.1.3. Floods
Flooding is strongly correlated with erosion and compaction (Gay et al., 2009). In urban areas
this effect is mainly caused by replacing the vegetated soil by impermeable surfaces or bypassing
the natural storage (Wheater and Evans, 2009). In agricultural land use, flooding is not always
negative. It has an important influence on the grade of soil salinisation (Tóth et al., 2008).
The Mekong Delta is subjected to flooding half of the year (1.2-1.8 million ha). This causes loss of
lives and property but is also beneficial because salty and acid water is washed away and
deposits of sediment provides fertilization to the soil (Hoa et al., 2008). The rainy season starts in
May and during this period farmers plough their soil for rice cultivation. A large amount of toxics
are released by the ploughing and need to be flushed out by the floods.

Chapter 2: Literature review
11
2.4.1.4. Salinisation and sodification
Salinisation can be defined as a process that leads to an excessive amount of water-soluble salts
in the soil (Várallyay and Tóth, 2006). High amounts of sodium ions in the soil or on the cation
exchange sites result in sodification. Primary salinisation is the accumulation of salts through
natural processes, e.g. high salt content in parent material or groundwater. Salinisation caused
by human activities, such as irrigation with salt rich water or insufficient drainage is grouped as
secondary salinisation (Qadir et al., 2008).
Excessive salt intrusion in agricultural soils causes decreasing yields or even crop failure. These
adverse effects are especially caused by the osmotic stress due to the presence of excessive salts
and by toxicity or deficiency of certain nutrients (Qadir et al., 2008).
This threat cannot be reduced with time by routine irrigation and crop management practices
but needs soil amelioration. Amelioration includes movement of excess soluble salts deeper in
the soil via leaching or biological reduction of the salt in the soil by extraction with salt
accumulating plants (Qadir et al., 2000).
Currently, 42 percent of the Mekong Delta is affected by salinity intrusion. This serves as the
limiting factor for agricultural production and causes shortage of drinking water for the local
population (Minh, 2000).
2.4.1.5. Compaction
Soil compaction is a human induced problem (FAO, 2003) and is caused by compressive sources
on the soil, e.g. passage of tillage implemented in agricultural areas (Le Bas et al., 2006).
Orientation, size and shape of soil aggregates, increase in bulk density and reduction of porosity
indicates soil compaction (Gardi et al., 2008). Clay soils are most susceptible to this degradation
(Gay et al., 2009). The created damage depends on the water content and the bearing capacity
of the soil and the magnitude of the pressure force applied. The compaction mostly occurs at the
surface but to which depth the forces are transmitted depends also on the moisture content
(Batey, 2009).
Compaction strengthens the erosion effects and can lead to crop failure due to negative effect
on the crop root depth, water availability and poor aeration of the soil (FAO, 2003).
To avoid this soil threat, the time of tillage is important because the degree of compaction
depends on the soil moisture content (Batey, 2009). No-tillage agriculture is the best alternative
(Le Bas et al., 2006). Soil compaction can be restored using rotation crops with natural crop-

Chapter 2: Literature review
12
induced wetting and drying cycles to crack the soil, crops that provide root penetration and
increase the organic matter in the soil (FAO, 2003).
2.4.1.6. Contamination
Soil contamination is defined as the occurrence of certain products in such a concentration that
it causes deterioration or loss of soil functions. The most common contaminations are heavy
metals and high levels of nitrogen. High nitrate and phosphor concentrations introduced by
fertilizers and manure are the most common diffuse contaminants in agricultural soils (Gay et
al., 2009).
These contaminations reduce the capability to serve nutrients to crops, to buffer and filter.
Consequently, this leads to yield reduction, leaching of nutrients to groundwater and
eutrophication (Maréchal et al., 2008).
In agriculture, soil contamination remediation is rarely used because the cost is too high. Crop
rotation contributes to reduction of the use of chemicals and thus reduces contamination. Some
plants absorb contaminants and thus improve water and soil quality. Biological activity also has a
positive influence on the grade of contamination because it stimulates the breakdown of
chemical components (Gay et al., 2009).
In the Mekong Delta a large amount of inorganic fertilizers are used and is stimulated by the
government with price incentives. This causes high amounts of nitrogen with as consequence a
high population of brown plant hoppers and other pests. The wrong use of fertilizers also brings
farmer and consumer at risk (Dung et al., 2000).
2.4.1.7. Sealing
It should first be noted that there are two definitions of sealing. In the Thematic Strategy on Soil
Protection it is defined as: “Soil sealing is the separation of soils from other compartments of the
ecosystem, such as biosphere, atmosphere, hydrosphere, anthroposphere and other parts of
pedosphere by layers and other bodies of completely or partly impermeable material”. The
second definition, that will be used in the context of this study, is: “Soil sealing is the changing of
its nature so that the soil becomes impermeable, such that soil is no longer able to perform the
range of functions associated with it”( Van Camp et al., 2004).
The extend of sealing is affected by the texture of the soil (Segeren and Trout, 1991). Soils with a
high aggregate stability are more resistant to surface sealing (Maréchal et al., 2008). This
aggregate stability highly depends on the organic matter content and the initial humidity of the
soil (Singer and Le Bissonnais, 1998) and is affected by raindrops or chemical dispersion. Soil

Chapter 2: Literature review
13
sealing enhances erosion and run-off (Thierfelder et al., 2005) and causes infiltration reduction
of water (Singer and Le Bissonnais, 1998).
A minimum tillage method and crop rotation improve the physical soil status and reduce the
susceptibility to sealing (Thierfelder et al., 2005).
2.4.2. Identification of soil degradation processes
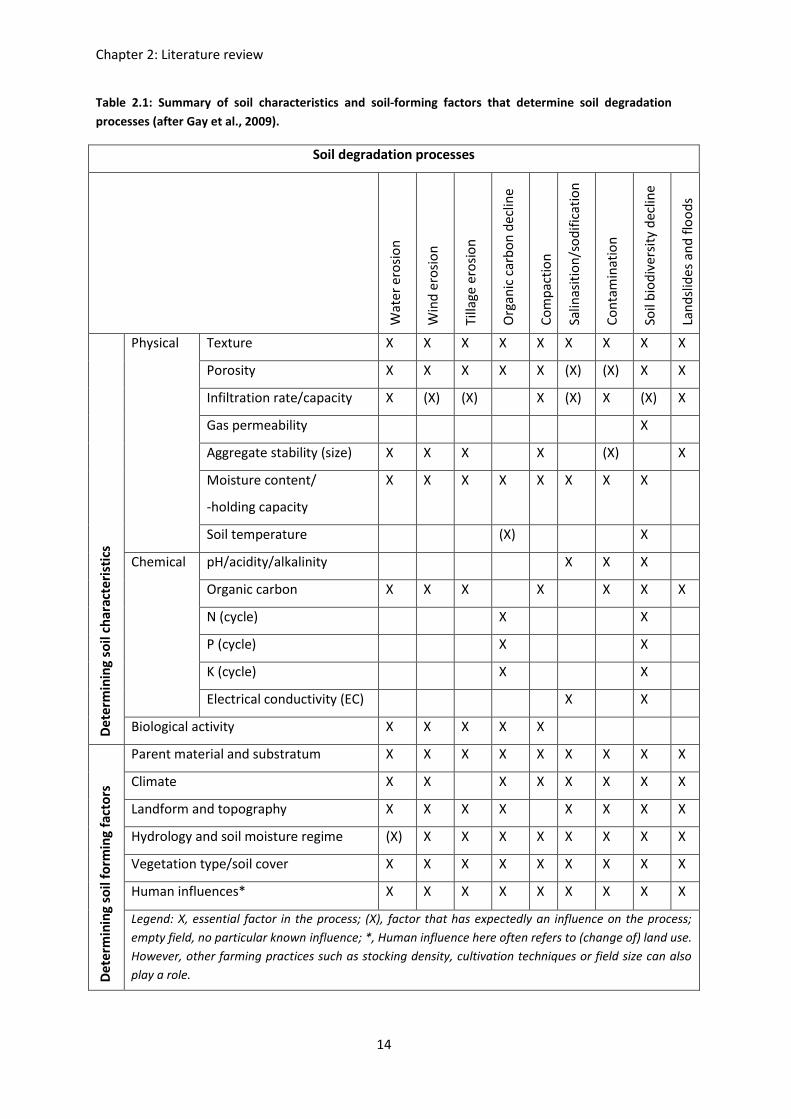
Table 2.1 lists several soil characteristics and soil forming factors that determine soil degradation
processes. The table indicates potential influence of the external factors of degradation on the
soil response properties, while the actual degradation is site-specific.
The influence of soil texture on organic matter decline depends largely on the type of soil. Sandy
soils usually have already a low SOC content while clay soil mostly accumulate humus. Aggregate
stability (and soil structure) is also closely related to SOC and these two factors strongly
influence soil biodiversity.
Soil-forming factors are natural and anthropogenic processes. Soil degradation can be
accelerated or slowed down by human activities. An actual example is that climate change will
influence all soil degradation processes. Climate influences water holding capacity and this has a
large effect on other soil properties. The water balance in the soil is important for salinisation,
temperature and precipitation influence carbon mineralization and accumulation (Gay et al.,
2009).
Chapter 2: Literature review
14
Table 2.1: Summary of soil characteristics and soil-forming factors that determine soil degradation
processes (after Gay et al., 2009).
Soil degradation processes
Wat
er
ero
sio
n
Win
d e
rosi
on
Tilla
ge e
rosi
on
Org
anic
car
bo
n d
eclin
e
Co
mp
acti
on
Salin
asit
ion
/so
dif
icat
ion
Co
nta
min
atio
n
Soil
bio
div
ersi
ty d
eclin
e
Lan
dsl
ides
an
d f
loo
ds
De
term
inin
g so
il ch
arac
teri
stic
s
Physical Texture X X X X X X X X X
Porosity X X X X X (X) (X) X X
Infiltration rate/capacity X (X) (X) X (X) X (X) X
Gas permeability X
Aggregate stability (size) X X X X (X) X
Moisture content/
-holding capacity
X X X X X X X X
Soil temperature (X) X
Chemical pH/acidity/alkalinity X X X
Organic carbon X X X X X X X
N (cycle) X X
P (cycle) X X
K (cycle) X X
Electrical conductivity (EC) X X
Biological activity X X X X X
De
term
inin
g so
il fo
rmin
g fa
cto
rs
Parent material and substratum X X X X X X X X X
Climate X X X X X X X X
Landform and topography X X X X X X X X
Hydrology and soil moisture regime (X) X X X X X X X X
Vegetation type/soil cover X X X X X X X X X
Human influences* X X X X X X X X X
Legend: X, essential factor in the process; (X), factor that has expectedly an influence on the process;
empty field, no particular known influence; *, Human influence here often refers to (change of) land use.
However, other farming practices such as stocking density, cultivation techniques or field size can also
play a role.
Chapter 2: Literature review
15
2.5. Restoration activities, land use and management
2.5.1. Soil sustainability and sustainable agriculture
According to the World Commission on Environment and Development (1987), sustainability
means to maintain or even improve environmental, technical, social and economic conditions
for future generations. Sustainability becomes increasingly important when the scarcity of
resources increases (FAO, 1993).
Sustainable agriculture includes productivity and economic, social and environmental
components. Its key element is soil quality. Sustainable use depends on soil characteristics,
related environmental conditions and land use. These three factors interact with each other: the
change of one factor causes conversions in another. This makes sustainability of soil resources
dynamic. Soil resources should be assessed from this point of view and can be seen as the prime
object of sustainable land management (Tóth et al., 2007). Linking soil quality and degradation
characteristics with time, is a primary indicator of sustainable management (Doran, 2002).
Scientific research on long-term sustainability of land management has a high priority to
understand how soils respond to management and why certain soil-management systems are
sustainable (Richter and Markewitz, 2001).
In agriculture, soil management is mostly seen as adding sufficient nutrients to maximize crop
yield. However, this behavior has adverse environmental effects, e.g. large nutrient
concentrations in water resources. Improvement of soil management includes the minimization
of adverse on- and off-site effects, to become high productivity and high environmental quality
(Richter and Markewitz, 2001).
2.5.2. Land evaluation
The assessment of land performance for a specific purpose is called land evaluation. In this
evaluation economics, social (for the people surrounding the assessed area) and the
consequences for the environment should be included (FAO, 1976).
Land evaluation can be performed by trial and error, empirical or by using process models. Trial
and error is the least scientific way and has to be avoided. The empirical approach relies on the
fact that result from an experiment can be transferred to similar situations. This method is only
successful when the classification and identification of the land analogy has been chosen
correctly. Process modeling is the best implementation for land evaluation because it recognizes
the complex relationship between soil characteristics and land utilization. The models need

Chapter 2: Literature review
16
physical parameters as input. This method is only just starting to be used in soil survey and land
evaluation (McKenzie et al., 2002).
Soil quality indicators (SQIs) can reflect the capacity of soil to function and are a measure for
land evaluation. The development of these SQIs is essential to determine if soil quality under
certain land uses is improving or declining. The integration of soil physical, chemical and
biological properties and processes, the application under different field conditions, the
complementation with existing databases or easily measurable data and their response to land
use, management practices, climate and human factors is essential to develop SQIs. Linear and
multiple regression analysis, pedotransfer functions, scoring functions and factor analysis (FA)
are other techniques for identification or interpretation of SQIs (Shukla et al., 2006).
Multivariate data analysis of soil change and quality can contribute to a more holistic view on
the effects of land use. With these techniques it is possible to develop a MDS with the
parameters that are the most sensible to variation in land use and facilitates comparison among
land use systems (Levi et al., 2009).
2.5.3. Impact of crop rotation and land use on soil quality
Crop rotation can improve soil characteristics and reduce pest pressure and consequently, yields
will be higher and more stable (Liebman et al., 2001). The time of rotation and the combination
of different crops will influence the soil physical parameters. This appears to be related to their
different ability to promote soil structure formation and structure stabilization (Chan and
Heenan, 1996).
Improvement of soil physical quality because of the implementation of crop rotation or different
land management practice, can be measured by changes in parameters. The most important
parameters are: organic carbon, Ks, bulk density, air capacity and relative water capacity
(Reynolds et al., 2007).
According to a study on Alfisol soils in rain fed semi-arid tropics (Sharma et al., 2008) the most
appropriate nutrient-management practice to improve soil quality is the use of organic fertilizer.
In this study the organic matter caused a progress of 31.8% of the soil quality, over the control.
The changes were most visible in microbial biomass carbon (MBC), available N and extractable
Zn. In another study (Pagliai et al., 2004) the use of organic manure gives significant positive
effects on soil structure, and thus soil quality improves. The use of manure or compost gives a
higher macro-porosity value, due to less mineralization of SOM.

Chapter 2: Literature review
17
Rice is successful in crop rotation because of its indirect effects on environment and succeeding
crops, and on the overall profit. Loss of surface elevation because of mineralization is reduced
when rice is cultivated in tropical conditions. This favorable condition for rotation with
vegetables is caused because of the higher water table in rice fields that doesn’t allow high
oxygen concentrations in the soil which are necessary for mineralization. Another consequence
of rotation with rice crops, called ‘rice effect’, improves the yield in crops that succeed rice in the
rotation. This phenomenon could be possible explained because rice straw an stubble improve
soil texture, improve drainage and store nutrients in an available form for the next crop. Rice
cultivation has also some environmental benefits, e.g. improved water storage and removal of
excessive nutrients in water runoff. In tropical climates water storage can be improved by use of
rice crops because surface evaporation during the dry season is higher than evapotranspiration
from the crop. Rice paddies are an excellent solution to high nutrient concentrations in drainage
water. When the water is pumped into the rice fields, the algae and plants have enough time to
consume these nutrients (Schueneman et al., 2008). Intensive rice monoculture is less favorable
because of rapid nutrient depletion, soil compaction and its flooded conditions that destroy
structure, porosity and reduce aeration (Verplancke, 2003).
Rotation between upland crops and rice with its flooded soils brings a transition in soil aeration
status from anaerobic to aerobic and vice versa. This has impact on the accumulation and
dissipation of soil mineral nitrogen, the PO4-availability and K-exchangeability (George et al.,
2002).
Plant roots cannot penetrate in very compacted soils, with a soil strength higher than 2,5 kPa. It
is the hydrostatic (turgor) pressure in the roots that makes it possible to penetrate the soil.
Some species, e.g. legumes (especially lupines) are able to grow in compacted soils and loosens
compaction by their diurnal changes in root diameter. Rotation with these crops minimizes the
risk on subsoil compaction and improves soil structure (Hamza and Anderson, 2005).
Because of the rapid population growth and the excellent environmental circumstances for rice
cultivation, a lot of intensive rice-monoculture is used in farming in the Mekong Delta. It is
generally known that the intensive use of the soil reduces gradually the rice-yield and increases
need for agro-chemicals. The high doses of chemicals cause pollution of the water ways of rural
areas and elevate the costs for the farmers. Diversification of crops could be a solution to these
problems. In this study different crop rotations are considered and the results are measured
with different SQIs.

Chapter 2: Literature review
18
2.6. Soil requirements of maize, mungbean and rice
A soil that is fertile provides enough water, nutrients, oxygen, an adequate rooting depth, a
good temperature and no toxicities for the cultivated crops. The specification of these properties
depends on the requirements of the crops. Farmers manipulate soil properties to achieve higher
yield, but of course also climate and water applications play an important role (Wild, 2003). The
requirements for maize, mungbean and rice as described in the next sections were taken from
Sys et al. (1993).
2.6.1. Requirements of maize (Zea mays)
Maize is tolerant to a wide range of environmental conditions, but the growing season must be
frost free. The optimum temperature for germination is 18-21°C. Maize grows in a temperature
range from 14-40°C. The optimum temperature range for growth is 18-32°C. Rainfall should be
500-1200mm in a growing cycle to become an optimum water supply. No excessive relative
humidity (RH) is favorable. Maize grows on many forms of soils. Well drained, well aerated, deep
loam and silt loam soils with adequate organic matter are most suitable for cropping.
2.6.2. Requirements of mungbean (Phaseolus vulgaris)
Mungbean is not grown in the lowland humid tropics. The optimum temperature ranges from
15-20°C. Soil temperature for germination should be higher than 15°C. Mungbeans are sensitive
to frost and to temperatures higher than 30°C. The total precipitation should be 400-500mm per
growing cycle. Dry weather is required at harvest. Excessive rain causes flower drop and
diseases. Medium to high RH is required, especially at flowering. The optimum texture is loam to
clay loam. The crop is sensitive to water logging, so the soils should be well drained.
2.6.3. Requirements of rice (Oryza sativa)
Rice is generally considered as a tropical crop and is the most productive cereal growing in Asia
on land from below the sea level to 2700m elevation. The average temperature for rice
cultivation has to exceed 20°C and the minimum temperature has to exceed 10°C for 4-6
months. The optimum temperature for rice growth is 30-32°C. Rice needs generous rainfall or
irrigation. In tropical countries the crops receive high rainfall (1000-1400mm). High relative
humidity favors crop growth through the vegetative stage but also favors diseases. Low RH
causes shrunken grains. Light is not a limiting factor to growth in the early stages but becomes
progressively more critical with the age of the plant. Throughout the growing period the sum of
hours of sun is approximately 1200 hours. The intensity of sunshine should be higher in the later
stages of the growth. The requirements of the slope and landform for the cultivation depend on
the type of rice culture.

Chapter 3: Materials and methods
19
3. MATERIALS AND METHODS
3.1. Study area
The study was carried out in Long Khanh village, Cai Lay district, Tien Giang province, and
belongs to the Mekong Delta, Vietnam (Figure 3.1, Figure 3.2).
Figure 3.1: Map of the Mekong Delta Vietnam, with the study location.

Chapter 3: Materials and methods
20
Figure 3.2: Map of Tien Giang province, with the study location.
The study location is in the southern part of Cai Lay district and belongs to the major region of
alluvial soils in the Mekong Delta. The total annual precipitation is between 1,200 mm and 1,500
mm and the total annual evaporation between 1,200 and 1,400 mm. The temperatures are
stable throughout the year and vary from 25 to 28°C average. Average radiation is
162Kcal/cm²/year and there are about 2,709 hours of sunshine/year. Most of these climatic
factors are favorable for agriculture and crop growth (Tran Ba, 2004).
The area is supplied by fresh water through a network of canals and the flooding period is at the
end of September. Flooding depth of this region ranges from 20-50 cm (Tran Ba, 2004).
Figure 3.3 shows the monthly average rainfall and temperature of the study location (station My
Tho, Tien Giang) at latitude 10°22’51’’ N and longitude 106°07’03’’ E, with an elevation of 2m.

Chapter 3: Materials and methods
21
Figure 3.3: Distribution of mean monthly rainfall and temperature at the experimental site from 2001 to
2010 (Long Khanh Village, Tien Giang).
The climate has optimal conditions for rice cultivation, especially during the wet season (June till
November, crop 1 and 3 in section 4.4.2.). The temperatures are always between 20 and 35°C,
what is a preferable temperature range for rice, maize and mungbean growth. Mungbeans need
only 400-500 mm precipitation per growing cycle (crop 2 in section 4.4.2.) and are normally
cultivated from March till June. Maize needs more precipitation and the best growing season
would be from June till September (crop 3 in section 4.4.2.). If maize is cultivated in another
period, additional irrigation is necessary.
All the soil samples were taken in the beginning of July, after harvest of the upland crops. In this
period of the year it is rainy season and conditions of the water content of the soil varies from
field capacity to saturation.
3.2. Experimental design
The experiment-fields with different land use and land management practices were arranged in
a randomized complete block design with four replications. Each plot has an area of exact 42 m².
The six different treatments were:
Rice-rice-rice
Rice-rice-rice+10 tons organic manure/crop season
Rice-maize-rice
Rice-maize (+10 tons organic manure)-rice
Rice-mungbean-rice
Rice-mungbean- maize
0
50
100
150
200
250
300
0
5
10
15
20
25
30
35
40
Jan. Feb. Mar. Apr. May June July Aug. Sep. Oct. Nov. Dec.
Pre
cip
itat
ion
(m
m)
Tem
pe
ratu
re (
°C)
Precipitation (mm) Tmax (°C) Tmin (°C)

Chapter 3: Materials and methods
22
For upland crops, beds of a height of 20 cm above the field surface were prepared, with the use
of the soil next to the beds. This provided rotation of soil between the Ap and AB-horizon.
Before sowing of rice crops, the soil was aligned and tilled.
The soil at the experimental field has been classified as Gleyic Fluvisols (Soil Science
Department, Can Tho University, 2005; Soil Survey Staff, 1998) based on USDA/Soil Taxonomy
Classification system (1996). All master soil horizons have been described using the Guidelines of
FAO/UNESCO (1990) and thus considering following morphological characteristics: soil matrix
color (field conditions), soil matrix color (wet and dry conditions), soil texture, development of
soil mottling patterns and their characteristics, soil structure, soil consistency, soil ripening, bio-
pore system, concretions and abundance and distribution of the roots.
The top soil showed an accumulation of brown alluvial material, mixed with common brown
fresh roots. Soil was ripe and nearly ripe down to the depth of 130 cm. From the depth of 130
cm, the texture was sandy loam. The profile descriptions were performed by Tran Ba Linh in
2003 and are described in Appendix A.1. The 20-30 cm depth was the AB-horizon (20/25-45/55
cm) for the rice monoculture treatments. In the treatments with upland crops this layer was
mixed with the Ap-horizon (0-20/25 cm) because beds were used. The beds were dug from the
AB-horizon, which provided a good soil mixing and decreased the possibility on a compacted
layer.
Table 3.1 gives the chemical properties of the organic manure used in treatment R-R-R+OM and
R-M-R+OM. The composition might influence the chemical soil characteristics.
Table 3.1: Nutritional characteristics of the compost used at the study location.
C (%) pH EC (µS/cm) Ntotal (%) C/N Ptotal (%)
45.9 7.5 2,068 2.32 19.78 2.56
PH and EC of the organic manure were higher than pH and EC of the soil at the study location,
which means that addition of organic manure could have an influence on these parameters. The
high carbon content of the manure can also affect the SOC-content of the soil.
3.3. Field survey Local farmers have been interviewed at the selected study site and from surrounding areas with
alluvial soils as the major soil group. The purpose of this investigation was to collect information
about former and present land use systems and land management practices. The interviews
were taken from 109 farmers. These include four types of land use: 3 rice crops/year, 3 upland

Chapter 3: Materials and methods
23
crops/year, 1 rice and 2 upland crops/year, 2 rice and 1 upland crop/year. For the cultivation of 3
upland crops/year 19 farmers were interviewed and for the other types of land use, 30 farmers
were interviewed.
In the interview sheets following information was collected:
The history of people’s settlement and exploitation, and land use system development.
Farming system analysis: cropping pattern and types of cultivation.
Cultivation techniques and land management: soil preparation for cultivation
(ploughing, digging, how deep, duration application, number of times per year), ways to
level the soil surface, application of fertilizers (type, amount, number and methods of
application), irrigation and drainage (ways, methods and water quality of the irrigated
water), other soil preparations influencing the soil characteristics.
Limiting factors of plant yield and soil productivity (according to local farmers and others
concerned).
Rice yield and total cost of cultivation to calculate economic efficiency of the different
land management practices.
3.4. Soil analysis
3.4.1. Field measurements
Soil strength (i.e. soil penetration resistance) has been measured with an electronic
penetrometer (Eijkelkamp, Agrisearch Equipment, Giesbeek, The Netherlands), directly in the
field to characterize soil strength resulting from the cohesive forces between soil particles and
their frictional resistance. These measurements have been repeated four times, with three
replicates per land use system or land management practice.
3.4.2. Soil sampling
Undisturbed soil samples were taken with rings of a volume of 98,125 cm³. Two rings per plot
were used, with four replications at six different land uses and managements, at three depths
(0-10 cm, 10-20 cm and 20-30 cm). These rings have been used to determine most of the
physical parameters.
About three kg of disturbed soil was taken per replicate and per land use and management
system at three depths (0-10 cm, 10-20 cm and 10-30 cm) for chemical and other physical
analysis. Every sample was a randomized composition from ten locations within one plot. All the
samples were air-dried in the storage room of the Department of Soil Science, College of
Agriculture and Applied Biology, Can Tho University.

Chapter 3: Materials and methods
24
3.4.3. Chemical soil analysis
The chemical soil properties were analyzed on sieved (<1mm) disturbed soil samples.
For the determination of the pH in the soil, 10 g of soil was extracted by 50 ml of distilled water
(1/5) and measured with a pH Meter (OKAION pH/mV/C0 meter, Eutech Instruments, Nijkerk,
The Netherlands).
The Electric Conductivity of the soil (EC) was measured with an EC-meter (Schott Instruments D-
55122, Mainz, Germany) on the extract of soil with water (1/5).
The Cation Exchange Capacity (CEC) was determined with the method of Gilman (1979). Barium
(from BaCl2) was used to remove the adsorbed cations, afterwards Barium was precipitated as
BaSO4, with MgSO4. The amount of magnesium-ions was used to calculate the CEC. These values
are expressed in cmol(+)/kg soil.
Soil Organic Carbon (SOC) was determined by the Walkley and Black method (1934). The organic
carbon of the soil was oxidized by K2Cr2O7. In the second step the excess of Cr2O72- was titrated
with FeSO4. The efficiency of this method is 75%.
Labile C was calculated by the subtraction of hydrolysable carbon from SOC. The hydrolysable
carbon was determined with the acid hydrolysis method.
Available nitrogen, i.e. the amount of organic nitrogen and the amount of ammonia in the soil,
was extracted by KCl and was measured with a colorimeter (Shimadzu UV-1800): N-NH4+ at 640
nm and N-NO3- at 543 nm.
Available Phosphor was determined with the Bray and Kurtz method (1945). This includes an
extraction with NH4F dissolved in distilled water (at pH 2.6) and a measurement with the
colorimeter (Shimadzu UV-1800) to analyze for P.
For total acidity (cmol/kg), soil was extracted with KCl 1N and titrated by NaOH 0.01N.
3.4.4. Soil physical analysis
3.4.4.1. Soil Texture
First, the soil sample was air dried and sieved with a sieve of 2 mm. Then soil organic matter was
destroyed by H2O2. The Robinson pipette method (Klute, 1986) was used to analyze the soil
particle size distribution. Based upon Stokes Law the different particle sizes were minutely
collected and measured at regular time intervals.

Chapter 3: Materials and methods
25
The sand (0.05-2 mm), silt (0.002-0.05 mm) and clay (<0.002 mm) fraction of the soil sample was
determined and calculated and the texture triangle of USDA/Soil Taxonomy (Soil Survey Staff,
1998) was used to classify soil texture.
3.4.4.2. Soil Bulk Density, ρb
Dry bulk density (ρb) was calculated as dried soil weight (oven dried at 105°C) per bulk volume
unit using the core method (Grossman and Reinsch, 2002). Undisturbed soil samples (volume of
98.125 cm³) were used.
3.4.4.3. Soil Particle Density, ρp
A pycnometer was used to determine the soil particle density, ρp. The soil fraction (< 2 mm) was
oven- dried and a 50 ml pycnometric flask was used to analyze the soil particle density.
3.4.4.4. Soil Porosity
Porosity or Total Pore Volume Percentage was deduced and calculated from ρb and ρp:
(
)
3.4.4.5. Volumetric Water Content, Ѳ
The volumetric water content (Ѳ) is the amount of water present in the soil sample. The initial
weight of the undisturbed soil samples and the oven- dried weight were used to calculate the
amount of water in the initial sample:
In which Ѳ is the volumetric water content (m³/m³), Vaq is the water volume in the initial
sample (m³) and Vi is the initial soil bulk volume (m³).
3.4.4.6. Water Retention Curve
The water retention curve was experimentally established at seven matric potentials: -1 kPa, -30
kPa, -5 kPa, -10 kPa, -33 kPa, -100 kPa and -1500 kPa.
The sand-box apparatus (Eijkelkamp Agrisearch Equipment, Giesbeek, the Netherlands) was
used to determine matric potentials between -1 and -10 kPa, whereas pressure chambers (Soil
moisture Equipment, Santa Barbara CA, USA) were used for matric potentials ranging from -33
to -1500 kPa, following the procedure described in Cornelis et al. (2005). Hydraulic equilibrium
between the applied pressure and soil water content was reached after 7 days.

Chapter 3: Materials and methods
26
The van Genuchten equation (1980), an effective and commonly used parametric model for
relating water content to matrix potential, was fitted to the measured water retention data:
( ) [
( | |) ]
in which is the water content (m³/m³), h is the matrix potential (cm), r is the residual water
content (m³/m³), s is the water content at saturation (m³/m³), α, n, m are parameters directly
dependent on the shape of the (h) curve, m= 1-1/n, and with α in cm-1.
3.4.4.7. Soil Macro-porosity and Matrix Porosity
Macro-porosity (MacPOR) and matrix porosity (MatPOR) parameters define the volume of soil
macro-pores and matrix pores:
s – MatPOR
MatPOR = m
with:
saturated volumetric water content of soil matrix, exclusive of macro-pores
(m³/m³).
Matric potential values of -10, -5 and -1 kPa were used to determine θm, as suggested in
Reynolds et al. (2007). These values correspond to pore diameters greater than 0.03, 0.06 and
0.3 mm, respectively.
3.4.4.8. Air Capacity
Soil air capacity (AC) is an indicator for the grade of aeration:
with:
water content at saturation (m³/m³)
water content at field capacity (m³/m³)
A matric potential of -33 kPa was taken as field capacity (Romano and Santini, 2002).
3.4.4.9. Plant Available Water Capacity
The plant-available water capacity (PAWC) was used as an indicator for soil’s capacity to store
and provide water to plant roots:
PAWC = θfc –θpwp
Chapter 3: Materials and methods
27
with:
θfc water content at field capacity (m³/m³)
θpwp water content at permanent wilting point (m³/m³)
Wilting point was considered at -1500 kPa (Reynolds et al., 2007; Romano and Santini, 2002).
3.4.4.10. Relative Water Capacity
The relative water capacity (RWC) was used to express soil’s capacity to store water and air,
relative to its total pore volume (i.e. the water content at saturation, θs):
[ (
)]
3.4.4.11. Aggregate stability
The stability of the aggregates was measured on air dried soil samples using the dried and wet
sieving method of De Leenheer and De Boodt (1959). Sieve fractions of 8.0-4.76 mm, 4.76-2.8
mm and 2.8-2.0 mm were collected. The difference in the weighted quantities of the aggregate
sizes between dry and wet sieving is an index for aggregate instability:
IS = MWDd – MWDw
with:
in which:
IS Instability Index
MWD Mean Weighted Diameter of the dry (d) and wet (w) aggregate fractions
mi mass of the aggregate fraction i (g)
di mean diameter of the aggregate fraction i (mm)
The stability index was expressed as:
and the Stability Quotient represents for structural stability:
SQ = SI * (% aggregates > 2 mm)
Additionally, aggregate stability was measured with the three methods of Le Bissonnais (1996):
fast wetting, slow wetting and mechanical breakdown by shaking after pre-wetting.

Chapter 3: Materials and methods
28
3.4.4.12. Atterberg limits
Atterberg (1911) divided soils in consistency zones, depending on their water content. The most
important limits are the plastic limit and the liquid limit and were tested in the laboratory, from
which the plastic index was calculated.
The plastic limit (PL) is the water content of the soil when its behavior changes from brittle to
plastic. The soil is at its plastic limit when a 3 mm diameter rod is beginning to crumble while
rolling it, upon which its water content was determined gravimetrically at 105 °C (ASTM D 4138,
1989).
The liquid limit (LL) is the water content of the soil at which the soil changes from plastic to liquid
behavior and was determined using a Casagrande device (ASTM D4318, 2003). A 12-mm deep
groove was made through the soil which was brought in to the cup of the device and
subsequently the cup was dropped from 12 mm. Water was added until it was sufficient to
become between 30 and 40 drops to cause closure of the groove.
The plasticity index (PI, ASTM D 4138, 1989) is a measure of the plasticity of the soil. This index is
the size of the range of water contents where the soil exhibits plastic properties and is calculated
as the difference between LL and PL. Soils with a high plasticity index are clayey soils (>15), a
lower PI tend to be soils with more silt (<10) and soils with PI=0 possesses no silt or clay.
3.4.4.13. S-index
The S-index of Dexter (2004a,b,c) represents the magnitude of the slope of the soil water
retention curve at the inflection point. The curve has to be expressed as gravimetric water
content, θg (in kg/kg) versus the natural logarithm of the matrix potential, ln(h) (cm, h > 0). Soil
physical degradation is made visible with the S-index; e.g. when soil is compacted, the slope of
the retention curve at the inflection point is reduced.
The S-index was evaluated using equation:
( ) (( )
( ))
where n, θs, θr are the Van Genuchten parameters. Θr was set to 0 before the estimation of the
other parameters, as suggested by Dexter (2004b).

Chapter 3: Materials and methods
29
3.5. Statistical analysis Effects of land management strategies on physical and chemical properties were analyzed by the
one way analysis of variance (ANOVA) for the randomized complete block design. When
treatments main effects occurred, significant differences were determined using the Duncan’s
multiple range test at 0.05% significance level. The standard deviation was also calculated and
denoted by error bars on the graphs and bar charts to indicate the variability about the mean
values. The analysis of variance, the differences between the means and the interaction
between the means were tested using SPSS 17 (SPSS Inc.).

Chapter 4: Results and discussion
30
4. RESULTS AND DISCUSSION
4.1. Chemical soil properties
The soil at the study location had a pH between 5.15 and 5.70 and did not show any significant
difference between the different horizons or treatments. For coarse-textured soils with low clay
content a higher pH is important to increase the total number of charges on the colloids so that
higher nutrient concentrations are retained in the soil (Arthur et al., 2011). Since the soil at the
study location had a high clay content, this quite low pH has no specific constraints for crop
growth.
Table 4.1 and Table 4.2 give the chemical properties for six different treatments at three depths.
Electric conductivity (EC; Table 4.1) was not significantly different between the treatments and
the horizons (between 525.0 µS/cm and 738.8 µS/cm), with exception of R-Mb-M at horizon 10-
20 cm where EC was significantly lower (404.0 µS/cm) than in all other treatments and horizons.
At the other depths a lower EC is also visible for this treatments, though not significant. The salts
could be washed out because of the better drainage due to the bed-formation for the two
upland crop cultivations, which lowers the EC. As a general guideline, an EC level between 200-
1200 µS/cm is a good range for growing crops. Lower than 200 µS/cm would indicate low
nutrient levels and low microbial activity. EC higher than the optimum range would mean too
high salt concentrations, because of overuse of high salt fertilizer or due to lack of drainage
(Agriculture Solutions, 2011).
The soil organic carbon content (SOC; Table 4.1) significantly declined with the depth in all the
treatments. The rotations with added organic manure per crop season did not show significant
difference with the same rotation without the added organic manure. The organic manure has
only been applied for four years and this might be the reason that there was no build up in SOC-
content. However, Dalal and Chan (2001) stated that added organic manure directly influences
the crop productivity. The SOC-content in R-R-R at the top horizon was significantly higher than
at the top horizon of R-M-R, R-M-R+OM and R-Mb-R. This can be explained by the lower oxygen
concentration (caused by the higher water level) in rice fields, which slows down the
mineralization rate. R-Mb-M had significantly lower SOC than all other treatments. Upland crops
bring no organic carbon in the soil, while after harvesting of rice the organic residues stay in the
soil. This makes that the R-Mb-M rotation (2 upland crops) had a lower SOC-content than the
rotations with more rice cropping. At a depth of 10-20 and 20-30 cm, R-M-R(+OM) had a

Chapter 4: Results and discussion
31
significantly higher SOC-content than R-R-R(+OM). This can be explained by the higher soil
mixing rate in rotations with upland crops in comparison with rice monoculture. In the research
from Arthur et al. (2011) the SOC-values are between 1.5% and 2% for sandy soils, which is
slightly lower than in this study on clayey soils. For the clayey Vertisols in Tasmania (Cotching et
al., 2001) the OC-content is higher (2.5%-8%) and the values of our study are in the lower part of
this range. There exists a positive correlation between OC and clay-content. The soil is in
Tasmania have a slightly lower clay-content, so it can be determined that the OC-values are
quite low for our study.
Table 4.1: Chemical properties for six different treatments, at three different depths: EC, CEC, SOC,
labile C.
Treatment Horizon
(cm)
EC
(µS/cm)
CEC
(cmol/kg)
SOC
(%)
C labile
(%)
R-R-R 0-10
10-20
20-30
661.6(81.28)
623.9(47.93)a
625.0(60.93)
21.21(0.44)b y
21.76(0.81)b y
24.02(1.73)abz
3.17(0.14)az
1.57(0.21)cy
1.03(0.11)cx
0.150(0.04)cz
0.067(0.03)dy
0.042(0.02)by
R-R-R+OM 0-10
10-20
20-30
684.4(120.97)
601.0(61.14)a
650.0(93.34)
23.36(0.92)a
23.71(1.67)ab
23.96(0.60)ab
3.20(0.22)az
1.56(0.16)cy
1.15(0.16)cx
0.374(0.06)abz
0.092(0.03)cdy
0.067(0.03)b y
R-M-R 0-10
10-20
20-30
671.0(140.55)
626.0(49.48)a
711.9(137.13)
22.90(1.12)ab
23.21(1.03)ab
22.19(1.19)c
2.77(0.19)bz
2.86(0.19)az
2.35(0.28)ay
0.449(0.11)az
0.333(0.10)az
0.167(0.05)ay
R-M-R+OM 0-10
10-20
20-30
680.1(114.00)
629.6(60.74)a
607.8(96.56)
22.79(1.39)ab
22.03(0.42)ab
22.49(0.83)bc
2.82(0.12)bz
2.87(0.12)az
2.38(0.20)ay
0.449(0.10)az
0.324(0.07)ay
0.208(0.03)ax
R-Mb-R 0-10
10-20
20-30
738.8(54.46)
614.8(8.89)a
699.4(172.29)
23.40(1.74)a
23.84(1.38)a
22.40(0.93)bc
2.74(0.16)bz
2.86(0.40)az
2.02(0.11)by
0.358(0.06)abz
0.241(0.08)aby
0.142(0.06)a y
R-Mb-M 0-10
10-20
20-30
585.4(73.83) z
404.0(58.31)by
525.0(85.39) z
24.48(1.07)a
23.54(1.55)ab
24.50(0.79)a
2.11(0.11)cz
2.22(0.10)bz
1.81(0.17)by
0.316(0.04)b z
0.183(0.08)bcy
0.141(0.05)ay
R-R-R, rice-rice-rice rotation; R-R-R+OM, rice-rice-rice rotation+10 tons organic manure/crop season; R-M-R, rice-maize-rice rotation; R-M-R+OM, rice-maize (+10 tons organic manure)-rice; R-Mb-R, rice-mungbean-rice rotation; R-Mb-M, rice-mungbean-maize rotation; EC, electrical conductivity; CEC, cation exchange capacity; OM, organic matter content; C labile, labile carbon content. Different letters in each column mean statistically significant differences at P ≤ 0.05 using DMRT; a, b, c, d are the significant differences between the rotations; x, y, z are the significant differences between the horizons. Numbers between brackets represent the standard deviations.

Chapter 4: Results and discussion
32
The R-R-R treatment showed a significant lower cation exchange capacity (CEC; Table 4.1) than
R-R-R+OM, R-Mb-R and R-Mb-M in the upper horizon (13-9% lower). At depth 10-20 cm this
significant difference was still visible between R-R-R and R-Mb-R (decrease of 9%). For all the
treatments the CEC was medium to high (between 21.0 and 24.5 cmol/kg; Brady and Weil, 2002)
because the soil has a high clay content.
The CEC was significantly higher (12%) for depth 20-30 cm in comparison with the upper depths,
in the rice monoculture treatment. This observation is in contrast with the expected result that
SOC makes a contribution to CEC what has been encountered by Dalal and Chan (2001) and
Cotching et al. (2002). The contradictory result might be due to the contribution of the higher
clay-content (Table 4.3) in horizon 20-30 cm. The clay content in rice monoculture treatment is
higher at a higher depth because no mixing occurs between the different rice cultivations and
clay sinks down in the soil because of its small particle diameter. The fact that no significant
difference in CEC was observed for R-R-R+OM can be explained by the high CEC of the SOC in the
upper horizons and the high clay content that contribute to a higher CEC in the lowest horizon.
All the other treatments showed no significant difference between the horizons.
Labile C turns over more rapidly and is a better indicator for soil quality than SOC (Hoyle, 2006).
In all the treatments labile C, as SOC, was significantly decreasing with depth. Between the
treatments at a depth of 0-10 cm, labile C was significantly higher for R-M-R(+OM) than for R-
Mb-M. Remarkable is that all the treatments had a significantly higher labile C than R-R-R at
depth 0-10 cm. At depth 10-20 cm and 20-30 cm, labile C was significantly lower for R-R-R(+OM)
than for all the other treatments. This means that even though SOC was higher in R-R-R (+OM)
than R-M-R(+OM) and R-Mb-R, and that SOC in R-Mb-R was higher than R-Mb-M, R-M-R(+OM)
has a greater potential for nutrient turnover because of its higher labile C-content, followed by
R-Mb-R and R-R-R+OM, R-Mb-M, R-R-R, respectively. Similarly, Kanema (2009) found highest
labile C for maize, followed by other upland crops and a high decline in rice monoculture. High
labile C influences the mass and the activity of micro-organisms, that have the capacity to
release available N (Stine and Weil, 2002). This makes that similar trends are visible in the Nav
data (Table 4.2).
Total acidity (TA; Table 4.2) was not significantly lower for the treatments with added organic
manure. This is likely due to the high standard deviations, because the mean of the total acidity
for R-R-R and R-M-R was 50% and 21% higher than for R-R-R+OM and R-M-R+OM, respectively.
The added organic manure decreased the acidity because of its higher pH (Table 3.1). The total
acidity of R-Mb-M was significantly lower than all other treatments at the upper horizon. During

Chapter 4: Results and discussion
33
the rice cropping, organic matter will be submerged in water and its decay produces H2S, which
increases the total acidity. This explains the lower TA in the rotation with two upland crops.
Table 4.2: Chemical properties for six different treatments, at three different depths: TA, Nav, Pav.
Treatment Horizon
(cm)
TA (cmol/kg) Nav (mg/kg) Pav (mg/kg)
R-R-R 0-10
10-20
20-30
0.421(0.305)a
0.418(0.323)a
0.227(0.390)
101.1(17.31)bz
55.0(28.13)by
24.6(10.63)cy
82.0(15.22)bz
26.8(9.35)dy
8.9(1.82)dx
R-R-R+OM 0-10
10-20
20-30
0.212(0.173)abc
0.211(0.224)ab
0.117(0.148)
143.0(41.16)bz
49.1(24.70)by
19.0(10.63)cy
123.5(25.20)az
22.2(7.06)dy
10.2(2.71)dx
R-M-R 0-10
10-20
20-30
0.371(0.099)abz
0.185(0.102)aby
0.401(0.061) z
239.9(63.87)az
162.2(60.22)ayz
121.0(27.55)ay
67.3(8.66)bcz
62.9(7.58)abz
48.2(4.40)a y
R-M-R+OM 0-10
10-20
20-30
0.292(0.174)abc
0.196(0.083)ab
0.277(0.198)
257.3(75.87)az
152.8(39.54)ay
109.3(39.32)ay
68.9(1.15)bcz
64.2(10.31)az
52.4(3.09)a y
R-Mb-R 0-10
10-20
20-30
0.133(0.080)bcyz
0.063(0.031)b y
0.230(0.139) z
159.1(28.86)bz
151.2(45.85)az
63.8(14.08)by
55.8(11.84)cdz
51.4(8.69)b yz
39.3(1.26)b y
R-Mb-M 0-10
10-20
20-30
0.033(0.029)cy
0.062(0.060)byz
0.176(0.109) z
110.8(24.24)bz
77.2(15.89)by
58.2(16.82)by
41.5(7.82)d
39.4(2.55)c
32.8(5.24)c
R-R-R, rice-rice-rice rotation; R-R-R+OM, rice-rice-rice rotation+10 tons organic manure/crop season; R-M-R, rice-maize-rice rotation; R-M-R+OM, rice-maize (+10 tons organic manure)-rice; R-Mb-R, rice-mungbean-rice rotation; R-Mb-M, rice-mungbean-maize rotation; TA, total acidity; Nav, available nitrogen; Pav, available phosphor. Different letters in each column mean statistically significant differences at P ≤ 0.05 using DMRT; a, b, c, d are the significant differences between the rotations; x, y, z are the significant differences between the horizons. Numbers between brackets represent the standard deviations.
Available nitrogen (Nav; Table 4.2) decreased significantly with the depth, in all treatments (47-
86%). For the upper horizon, Nav was significantly higher for R-M-R(+OM) (61 to 34% higher) in
comparison with all other treatments. At depth 10-20 cm, the same observation is true for R-M-
R(+OM) and R-Mb-R (49-69% higher Nav than all other treatments). At depth 20-30 cm, the
available nitrogen in R-M-R(+OM) was significantly higher (41-52% higher) than in R-Mb-R and R-
Mb-M, and Nav in R-Mb-R and R-Mb-M was significantly higher (58-70% higher) than in R-R-
R(+OM). These differences in Nav can be explained by the difference in labile C that influences
the microbial activity. The low available nitrogen in rice monoculture is due to the high water
table and similar results have been observed in a study of Olk et al. (1995).

Chapter 4: Results and discussion
34
For available phosphor (Pav; Table 4.2), a significant decrease of 89-92% was observed between
the upper horizon and the 20-30 depth in R-R-R(+OM). The same trend was visible in R-M-
R(+OM) and R-Mb-R, but with a decrease of 30-24%. R-Mb-M showed no significant difference in
Pav between the depths. At the upper horizon, R-R-R+OM recorded the significantly highest Pav
(34 to 66% higher), followed by R-R-R (up to 33% higher), in comparison with the other
treatments. For depth 10-20 and 20-30 cm, treatment R-R-R(+OM) had significantly lower Pav (up
to 86%) than all other treatments, followed by R-Mb-M which had a significantly lower Pav than
R-M-R(+OM) and R-Mb-R (up to 49% lower). At this depth R-Mb-R was also significantly lower
than R-M-R(+OM) (to 39% lower). The high decrease of Pav observed in R-R-R(+OM) might be due
to little mixing of the soil between the different cropping seasons. The higher level of Pav in the
upper horizon is due to the rice roots and straw that stay incorporated in the soil after
harvesting. As they decay, they release nutrients, available for the next crops (Schueneman et
al., 2008). Upland crops consume more nutrients and this explains the lower Pav in a rotation
with two upland crops (R-Mb-M).
4.2. Physical soil properties and characteristics
4.2.1. Soil texture
The soil textural class of the whole experimental area was clay, with a mean of 2.3% sand, 31.3%
loam and 66.4% clay. Heavy clayey soil are fine-textured and have a different soil physical
behavior than silt or sandy soils. Clay has typical higher organic matter content, lower hydraulic
conductivity, higher porosity, lower bulk density and higher water holding capacity than sandy
soils (Brady, 1998).
4.2.2. Bulk density, soil porosity, particle density and volumetric water content at
saturation
Soil bulk density (Figure 4.1), soil porosity and particle density (Table 4.3) were used to estimate
compaction and soil aeration.
Density of the volume of the dry soil as it naturally exists, or bulk density, includes air space and
organic carbon but not soil moisture. This value is dependent on soil texture, SOC-content, root
penetration and soil structure. For fine-textured soils, the optimal bulk density for crop
production ranges from 0.9 to 1.2 Mg/m³ (Reynolds et al., 2007).

Chapter 4: Results and discussion
35
Figure 4.1: Bulk density for six different treatments, at three depths. R-R-R, rice-rice-rice rotation; R-R-
R+OM, rice-rice-rice rotation+10 tons organic manure/crop season; R-M-R, rice-maize-rice rotation; R-
M-R+OM, rice-maize (+10 tons organic manure)-rice; R-Mb-R, rice-mungbean-rice rotation; R-Mb-M,
rice-mungbean-maize rotation. Different letters in each column mean statistically significant differences
at P ≤ 0.05 using DMRT; a, b, c are the significant differences between the rotations; the significant
differences between the horizons are not included in the figure. Error bars represent the standard
deviations.
Soil bulk density was significantly lower (19% decrease) for the upper horizon in the R-R-R(+OM)
rotation in comparison with the 10-30 cm depths. Compaction at 20-30 cm (for R-R-R and R-R-
R+OM ρb is 1.30 Mg/m³ and 1.32 Mg/m³, respectively) can impose mechanical root penetration
in the soil and rice plants fall down during growth. This makes harvest difficult. Rotations with
upland crops provides a higher rate of soil mixing and thus bulk density was similar at different
depths and significantly lower than in rice monoculture at a depth of 10-30 cm. The R-Mb-M
treatment had a slightly higher bulk density (5% increase) than the other rotations with upland
crops. In this rotation with two upland crops, the upland crops do not add OC to the soil so that
less SOC was contributed to the soil, what might increase bulk density. The correlation between
bulk density and organic carbon was high (r=0.85) for this study location. Similar differences due
to differences in SOC have been observed in the study of Reynolds et al. (2007). Cotching et al.
(2002) also perceived a negative correlation between organic carbon and bulk density.
Particle density of a soil is the average density of the individual soil grains. This parameter
depends on the accumulative density of the individual inorganic constituents of the soil and OC-
content tends to lower the overall particle density.
b b ab ab ab
a a a
bc c c b
a a
c c bc b
0,6
0,7
0,8
0,9
1,0
1,1
1,2
1,3
1,4
1,5
depth 0-10 cm
depth 10-20 cm
depth 20-30 cm
optimum range
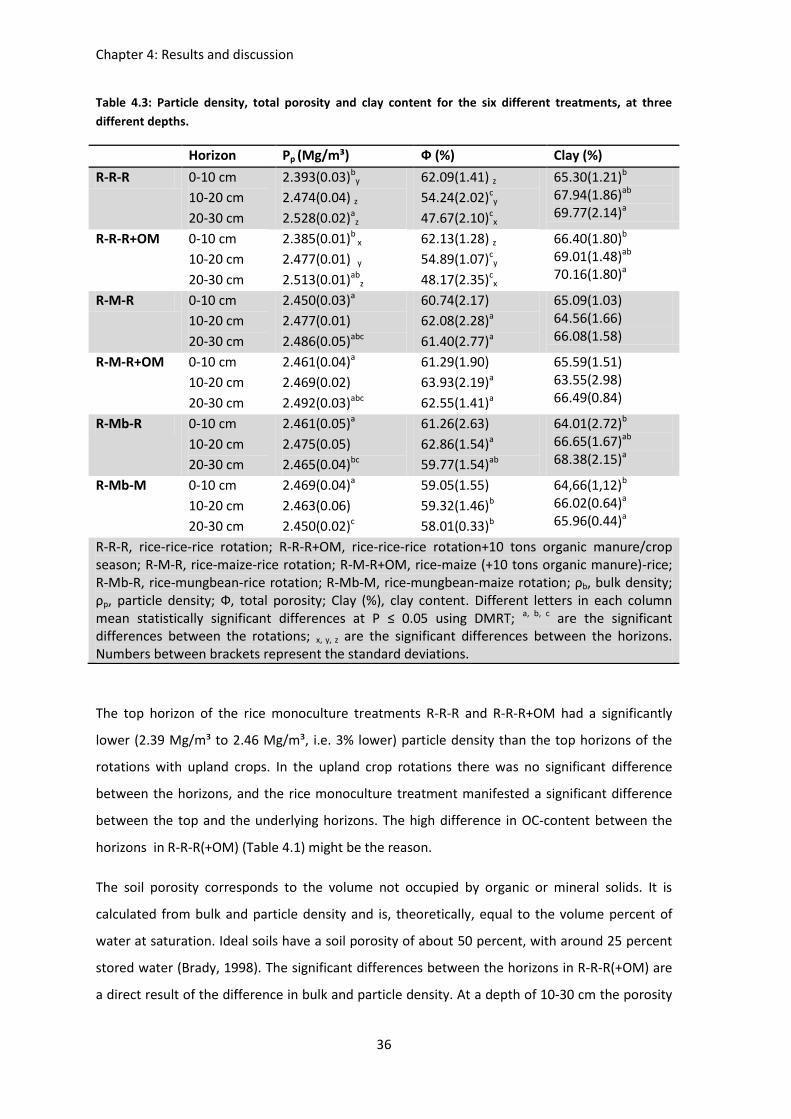
Chapter 4: Results and discussion
36
Table 4.3: Particle density, total porosity and clay content for the six different treatments, at three
different depths.
Horizon Pp (Mg/m³) Ф (%) Clay (%)
R-R-R 0-10 cm
10-20 cm
20-30 cm
2.393(0.03)by
2.474(0.04) z
2.528(0.02)az
62.09(1.41) z
54.24(2.02)cy
47.67(2.10)cx
65.30(1.21)b 67.94(1.86)ab 69.77(2.14)a
R-R-R+OM 0-10 cm
10-20 cm
20-30 cm
2.385(0.01)b x
2.477(0.01) y
2.513(0.01)abz
62.13(1.28) z
54.89(1.07)cy
48.17(2.35)cx
66.40(1.80)b 69.01(1.48)ab 70.16(1.80)a
R-M-R 0-10 cm
10-20 cm
20-30 cm
2.450(0.03)a
2.477(0.01)
2.486(0.05)abc
60.74(2.17)
62.08(2.28)a
61.40(2.77)a
65.09(1.03) 64.56(1.66) 66.08(1.58)
R-M-R+OM 0-10 cm
10-20 cm
20-30 cm
2.461(0.04)a
2.469(0.02)
2.492(0.03)abc
61.29(1.90)
63.93(2.19)a
62.55(1.41)a
65.59(1.51) 63.55(2.98) 66.49(0.84)
R-Mb-R 0-10 cm
10-20 cm
20-30 cm
2.461(0.05)a
2.475(0.05)
2.465(0.04)bc
61.26(2.63)
62.86(1.54)a
59.77(1.54)ab
64.01(2.72)b 66.65(1.67)ab 68.38(2.15)a
R-Mb-M 0-10 cm
10-20 cm
20-30 cm
2.469(0.04)a
2.463(0.06)
2.450(0.02)c
59.05(1.55)
59.32(1.46)b
58.01(0.33)b
64,66(1,12)b 66.02(0.64)a 65.96(0.44)a
R-R-R, rice-rice-rice rotation; R-R-R+OM, rice-rice-rice rotation+10 tons organic manure/crop season; R-M-R, rice-maize-rice rotation; R-M-R+OM, rice-maize (+10 tons organic manure)-rice; R-Mb-R, rice-mungbean-rice rotation; R-Mb-M, rice-mungbean-maize rotation; ρb, bulk density; ρp, particle density; Ф, total porosity; Clay (%), clay content. Different letters in each column mean statistically significant differences at P ≤ 0.05 using DMRT; a, b, c are the significant differences between the rotations; x, y, z are the significant differences between the horizons. Numbers between brackets represent the standard deviations.
The top horizon of the rice monoculture treatments R-R-R and R-R-R+OM had a significantly
lower (2.39 Mg/m³ to 2.46 Mg/m³, i.e. 3% lower) particle density than the top horizons of the
rotations with upland crops. In the upland crop rotations there was no significant difference
between the horizons, and the rice monoculture treatment manifested a significant difference
between the top and the underlying horizons. The high difference in OC-content between the
horizons in R-R-R(+OM) (Table 4.1) might be the reason.
The soil porosity corresponds to the volume not occupied by organic or mineral solids. It is
calculated from bulk and particle density and is, theoretically, equal to the volume percent of
water at saturation. Ideal soils have a soil porosity of about 50 percent, with around 25 percent
stored water (Brady, 1998). The significant differences between the horizons in R-R-R(+OM) are
a direct result of the difference in bulk and particle density. At a depth of 10-30 cm the porosity

Chapter 4: Results and discussion
37
of R-Mb-M was significantly lower than R-M-R(+OM). The porosity in treatments R-R-R and R-R-
R+OM was significantly lower than for all other treatments, at depth 10-30 cm, due to
compaction. This follows the trend of the bulk density. The results of total porosity are similar to
the ones in the research on clayey Vertisols in Tasmania of Cotching et al. (2002).
4.2.3. Matrix and Macro-porosity
Matrix pores are textural pores and are generally small in size. Textural porosity is defined by
primary particles that form aggregates. Non-matrix pores or macro-pores origin from roots,
animals and action of compressed air, and are not affected by soil texture. The volume of matrix
pores is subject to soil wetness and the volume of macro-pores is not (Lal and Shukla, 2004).
No available minimum or optimum values for MatPOR have been defined in literature (Reynolds
et al., 2007), which makes it difficult to draw final conclusions.
Matrix porosity (Figure 4.2) showed similar results when different matric potentials were used to
define macro-pores (-1 kPa, -6 kPa, -10 kPa, corresponding to pores greater than 300 µm, 50 µm
and 30 µm, respectively). R-Mb-M showed highest MatPOR for the upper horizon. This might be
due to the higher mixing of the soil, which breaks down aggregates and thus stimulates matrix
porosity. At depth 10-20 cm, MatPOR was significantly higher for R-R-R(+OM) and R-Mb-M than
for R-M-R(+OM) and R-Mb-R. That rice cropping breaks down aggregates because of higher bulk
density and the tillage before every cultivation of rice, which implies destruction of macro-pores,
could explain the higher MatPOR at higher depths, as suggested by Reynolds et al. (2007).
b ab b
b b
a
a a c c bc ab
ab a
b b
a a
0,4
0,42
0,44
0,46
0,48
0,5
0,52
0,54
0,56
0,58
Mat
PO
R (
m³/
m³)
(a)
depth 0-10 cm
depth 10-20 cm
depth 20-30 cm

Chapter 4: Results and discussion
38
Figure 4.2: Influence of six different crop rotations at three depths on soil matrix porosity. R-R-R, rice-
rice-rice rotation; R-R-R+OM, rice-rice-rice rotation+10 tons organic manure/crop season; R-M-R, rice-
maize-rice rotation; R-M-R+OM, rice-maize (+10 tons organic manure)-rice; R-Mb-R, rice-mungbean-rice
rotation; R-Mb-M, rice-mungbean-maize rotation; MatPOR10,5,1, soil matrix porosity corresponding to
the percentage of pores, which retain water at matric potentials of -10 kPa (a), -5 kPa (b) and -1 kPa (c),
respectively. Different letters in each column mean statistically significant differences at P ≤ 0.05 using
DMRT; a, b, c are the significant differences between the rotations; the significant differences between
the horizons has not been shown. Error bars represent the standard deviations.
b ab b b
b
a
a a b b b a
ab a
b b
a a
0,4
0,42
0,44
0,46
0,48
0,5
0,52
0,54
0,56
0,58
0,6
Mat
PO
R (
m³/
m³)
(b)
depth 0-10 cm
depth 10-20 cm
depth 20-30 cm
b ab b
b b
a
a a b b b a
ab a
b b
a a
0,4
0,42
0,44
0,46
0,48
0,5
0,52
0,54
0,56
0,58
0,6
Mat
PO
R (
m³/
m³)
(c)
depth 0-10 cm
depth 10-20 cm
depth 20-30 cm

Chapter 4: Results and discussion
39
Formation and stabilization of macro-pores (Table 4.4) is strongly influenced by organic carbon-
content and clay minerals, and thus by land use and soil management (Lal and Shukla, 2004).
Minimum or optimum values for MacPOR have not yet been determined, but for the upper
depth of fine textured soils MacPOR > 0.05-0.10 m³/m³ is defined as “undegraded” and MacPOR
< 0.04 m³/m³ is “degraded” because of compaction or consolidation (Reynolds et al., 2007).
MacPOR showed significant differences between the depths at treatment R-M-R+OM. This
significant decrease at depth 20-30 cm can be explained by the addition of organic manure at
the top layer. The results of MacPOR for the different treatments showed the same trends of
significant differences between the different suctions (-10 kPa, -5 kPa and -1 kPa).
The MacPOR-values of R-R-R and R-R-R+OM are lower than 0.05 m³/m³ at the three different
matric potentials, thus the soil can be considered as degraded (except for MacPOR1,5 in R-R-R, at
depth 20-30 cm). At matric potential of -5 and -1 kPa, the MacPOR for R-Mb-M showed values
<0.05 m³/m³. The low MacPOR for R-R-R(+OM) can be explained by the higher tillage frequency
and the unfavorable conditions of the compacted soil. For R-Mb-M the degradation might be
due to the low OC-input and the high use of minerals by upland crops. R-M-R+OM showed the
highest value for MacPOR10,5,1 (0.073, 0.063 and 0.059 m³/m³; respectively), which might be due
to the positive influence of the alternation between dry and wet conditions. Similar to the
findings in this study, Arthur et al. (2011) found that organic manure changes the distribution of
pores to higher macro-porosity.
At depth 20-30 cm, the treatments had no significant different MacPOR. This might mean that at
this depth the treatments had no influence on the macro-porosity, since clay-content (Table 4.3)
was similar and labile C (Table 4.1) showed no great differences at this depth.

Chapter 4: Results and discussion
40
Table 4.4: Influence of six different crop rotations at three depths on soil macro-porosity
Treatment Horizon
(cm)
MacPOR10
(m³/m³)
MacPOR5
(m³/m³)
MacPOR1
(m³/m³)
R-R-R
0-10
10-20
20-30
0.048(0.001)bc
0.039(0.01)ab
0.065(0.03)
0.040(0.01)bc
0.031(0.01)ab
0.052(0.02)
0.036(0.01)bc
0.026(0.01)ab
0.038(0.01)
R-R-R+OM
0-10
10-20
20-30
0.040(0.01)c
0.033(0.01)b
0.049(0.02)
0.030(0.001)c
0.027(0.01)b
0.042(0.02)
0.022(0.001)c
0.024(0.01)b
0.037(0.02)
R-M-R
0-10
10-20
20-30
0.065(0.02)ab
0.061(0.02)a
0.053(0.02)
0.059(0.02)ab
0.053(0.02)a
0.045(0.02)
0.055(0.02)ab
0.048(0.02)a
0.038(0.02)
R-M-R+OM
0-10
10-20
20-30
0.073(0.02)a z
0.056(0.01)abyz
0.044(0.02) y
0.065(0.02)a z
0.049(0.01)abyz
0.035(0.01) y
0.059(0.02)a z
0.043(0.01)abyz
0.028(0.01) y
R-Mb-R
0-10
10-20
20-30
0.061(0.01)abz
0.049(0.03)abyz
0.039(0.01) y
0.053(0.01)ab z
0.045(0.02)abyz
0.029(0.01) y
0.047(0.01)abz
0.043(0.02)abz
0.022(0.01) y
R-Mb-M
0-10
10-20
20-30
0.053(0.01)bc
0.044(0.01)ab
0.038(0.01)
0.042(0.01)bc
0.032(0.01)ab
0.028(0.01)
0.035(0.01)bc
0.023(0.02)b
0.020(0.01)
R-R-R, rice-rice-rice rotation; R-R-R+OM, rice-rice-rice rotation+10 tons organic manure/crop season; R-M-R, rice-maize-rice rotation; R-M-R+OM, rice-maize (+10 tons organic manure)-rice; R-Mb-R, rice-mungbean-rice rotation; R-Mb-M, rice-mungbean-maize rotation; MacPOR10, 5, 1, soil macro-porosity corresponding to the percentage of pores, which are drained at matric potential of -10, -5 and -1 kPa, respectively. Different letters in each column mean statistically significant differences at P ≤ 0.05 using DMRT; a, b, c are the significant differences between the rotations; x, y, z are the significant differences between the horizons. Numbers between brackets represent the standard deviations.
4.2.4. Atterberg limits
The plastic limit is the water content of the soil when it changes from brittle to plastic behavior
and the liquid limit is the water content at the boundary where the mixture of soil and water
flows as a liquid or behaves plastic (Brady, 1998). The plastic limit shows how the soil reacts in its
shear strength when the water content increases.

Chapter 4: Results and discussion
41
Figure 4.3: Influence of six different crop rotations, at three depths on the plastic limit, the liquid limit
and the plasticity index. R-R-R, rice-rice-rice rotation; R-R-R+OM, rice-rice-rice rotation+10 tons organic
manure/crop season; R-M-R, rice-maize-rice rotation; R-M-R+OM, rice-maize (+10 tons organic
manure)-rice; R-Mb-R, rice-mungbean-rice rotation; R-Mb-M, rice-mungbean-maize rotation; PL, plastic
limit is the difference between the height of PI and LL; LL, liquid limit; PI, plasticity index (lower bar).
Bars with the grey basis represent depth 0-10 cm, with white basis represent depth 10-20 cm and with
black basis represent depth 20-30 cm. Different letters in each column mean statistically significant
differences at P ≤ 0.05 using DMRT; a, b, c, d are the significant differences for PL between the rotations;
significant differences between the horizons are not shown in the figure. The error bars represent the
standard deviations.
The plastic limit (PL, grey bars in Figure 4.3) decreased significantly with depth for R-R-R(+OM)
and R-M-R. This might be due to the significant higher SOC-content in the upper layer. Malkawi
et al. (1999) suggested that PL increases because the water adsorptive capacity increases,
induced by the organic carbon. However, high OC-content also tends to decrease the water
adsorptive capacity, due to the decreased total surface area, caused by aggregation with organic
carbon. Since soil mostly has a smaller water adsorptive capacity compared to organic carbon, PL
increases with higher OC (Malkawi et al., 1999). This also explains the significant higher PL for R-
R-R(+OM) and R-M-R+OM compared to R-Mb-M, at the upper horizon and the significant lower
PL for R-R-R(+OM) than all the other treatments at depths 10-30 cm. In Cotching et al. (2002)
cropped paddocks had a significant lower PL than long term pasture treatments, because of
lower organic carbon contents. Similar results have also been found in Cotching et al. (2001) for
clayey Vertisols, with a high correlation between OC and PL (r=0.95). In our study, correlation
between PL and OM was also high with r=0.80 (Figure 4.4).
a d b a c b
ab a a a ab
a ab ab a b bc a
20
25
30
35
40
45
50
55
60
65
70
LL (%w/w)
PI

Chapter 4: Results and discussion
42
Figure 4.4: correlation between plastic limit and organic carbon.
The liquid limit and the plasticity index showed no significant difference between the treatments
and the horizons. PI was between 29% and 34% for all the treatments, which indicates that the
soils had a high plasticity because of the high clay content.
4.2.5. Soil strength
Soil strength is the resistance capacity of the soil matrix against external applied pressure forces
and is an important characteristic in agricultural soils, e.g. performance of implemented crops,
root growth and least-limiting water range (Vanags et al., 2006). Soil strength also gives a
measure for susceptibility of the soil to compaction. The results of the soil strength are
presented in Figure 4.5.
y = 3,9503x + 19,906 R² = 0,7975
15
20
25
30
35
40
0 1 1 2 2 3 3 4 4
PL
(%w
/w)
SOC (%)

Chapter 4: Results and discussion
43
Figure 4.5: Soil strength averaged for four replicates in rice-rice-rice (R-R-R) rotation, rice-rice-rice
rotation+10 tons organic manure/crop season (R-R-R+OM), rice-maize-rice rotation (R-M-R), rice-maize
(+10 tons organic manure)-rice (R-M-R+OM), rice-mungbean-rice rotation (R-Mb-R), rice-mungbean-
maize rotation (R-Mb-M). Bars represent standard errors for each land use system.
The largest differences in soil strength have been observed at depth 20-50 cm. At these depths,
measured soil strength increased strongly for R-R-R, followed by R-R-R+OM. The difference in
soil strength between the other treatments was not significant. These findings are supported by
the observed bulk density and total porosity, because of the compacted soil. The increase in soil
strength declined under a depth of 35 cm, below the compacted layer. Similar results have been
found in a study of Levi et al. (2010), in which the conventional row cropping had a much higher
increase in soil strength (at depth 10-20 cm) in comparison with longleaf pine forest. In Levi’s
study the increase in soil strength also declined under a depth of 30 cm, for both treatments.
Cotching et al. (2002) found the penetration resistance to be significantly higher at depth 20-40
cm, for cropping with rigorous tillage compared to shallow tillage and long term pasture.
The soil strength values were very high. These high values might be partially due to the low
moisture contents at higher depths (> 30 cm) during field measurements (average between 0.47
m3 m-3 and 0.40 m3 m-3, which is below the water content at the mean field capacity; Table 4.6).
1
6
11
16
21
26
31
36
41
46
51
56
61
66
71
76
0 1 2 3 4 5D
ep
th (
cm)
Penetration resistance (Mpa)
R-R-R
R-R-R+OM
R-M-R
R-M-R+OM
R-Mb-R
R-Mb-M

Chapter 4: Results and discussion
44
Lower moisture contents are typically increasing the penetration resistance (Hillel, 1998). The
high clay content also contributes to a high penetration resistance. In the study of Cotching et al.
(2001) on Vertisols with loamy clay to high clay content the penetration resistance increased to
a mean value of 3.2 MPa at a depth of 60 cm. At the study location in the Mekong Delta, clay
content was even higher compared to that study, resulting in an even higher penetration
resistance (between 3 and 4 MPa at a depth of 60 cm). A penetration resistance above 2MPa
would slow down root penetration drastically (Lowery and Morrison, 2002). Changing rice
monoculture to crop rotation with one or two upland crops would improve the possibility of
roots to penetrate.
4.2.6. Air capacity
Air capacity is an indicator of soil aeration, related to root-zone aeration, diffusion rates of gases
and oxygen demands of soil fauna. AC is recommended to be ≥ 0.10 m³/m³ to avoid crop-
damage because of aeration deficits in the root zone and ≥ 0.15 m³/m³ for fine textured soils
(e.g. clayey soils), to compensate for low gas diffusion rates (Reynolds et al., 2007).
The results of AC for the different treatments and different depths are given in Figure 4.6. Only
at depth 10-20 cm, the values of AC were significantly lower for R-R-R(+OM) than for R-M-
R(+OM), R-Mb-R and R-Mb-M (22-34% lower).The other depths showed the same trends, but
with a non-significant difference. The treatments with added organic manure also manifest a
significant difference between the depths. These observations can be explained by the addition
of organic manure at the upper depth, which results in an increased MacPOR (Table 4.4).

Chapter 4: Results and discussion
45
Figure 4.6: Air capacity of six different treatments at three depths. R-R-R, rice-rice-rice rotation; R-R-
R+OM, rice-rice-rice rotation+10 tons organic manure/crop season; R-M-R, rice-maize-rice rotation; R-
M-R+OM, rice-maize (+10 tons organic manure)-rice; R-Mb-R, rice-mungbean-rice rotation; R-Mb-M,
rice-mungbean-maize rotation; AC, soil air capacity; Different letters in each column mean statistically
significant differences at P ≤ 0.05 using DMRT; a, b, c are the significant differences between the
rotations; the significant differences between the horizons has not been shown. Error bars represent
the standard deviations.
All AC-values are lower than the recommended ones for good soil aeration (between 0.064 and
0.110 m³/m³). The low AC-values are possible due to the small amount of macro-pores, which
were destroyed by the tillage in rice cultivation. These low values for AC account for the higher
RWC values of the treatments because RWC was calculated inversely from AC (Table 4.6). For
the rice cropping, AC is no good soil quality indicator because rice is cropped in flooded
circumstances.
4.2.7. Aggregate stability
Soil aggregate stability is the ability of aggregates to resist mechanical and other disruptive
forces. It is widely considered as a key indicator of soil quality and can be influenced by cropping
systems, soil forming processes, soil texture, type of clay, organic matter and biological activity.
Soil aggregates influence soil erosion, movement of water, soil compaction and root growth. In
this study the stability quotient was used as a measure of structural stability (SQ; Table 4.5).
In the treatments with intensive rice cropping, SQ at depth 0-20 cm was significantly higher than
at depth 20-30 cm. In R-R-R+OM the difference in SQ between the horizons is even more
explicit, as the difference between SQ were also significant at 0-10 and 10-20 cm depth. R-R-
R+OM had a significant higher SQ than the R-R-R treatment, at all depths. The addition of
organic manure may explain an improvement in aggregate stability (Arthur et al., 2011; Khoa,
b b
a a a a
0,04
0,06
0,08
0,1
0,12
0,14
AC
(m
³/m
³)
depth 1
depth 2
depth 3

Chapter 4: Results and discussion
46
2002). This significant increase of SQ (22% at depth 0-10 cm, 17% at depth 10-20 cm and 10% at
depth 10-30 cm) was also visible in R-M-R+OM in comparison with R-M-R.
The use of upland crops in the rotations showed a significant improvement in SQ compared to
rice monoculture. When the rotations with the added organic manure are excluded, R-Mb-R
showed the highest SQ, followed by R-M-R and R-Mb-M. R-Mb-M had a significant lower SQ at
depth 20-30 cm, which is due to the lower OM-input in rotations with two upland crops.
In general, it can be concluded that the addition of organic manure and the rotation with upland
crops improved aggregate stability.
Table 4.5: Influence of six different rotations of crops at three depths on selected soil physical quality
indicators and parameters.
Treatment Horizon SQ S-index
R-R-R
0-10 cm
10-20 cm
20-30 cm
109.62(12.78)dz
100.36(13.21)dz
68.93(14.43)cy
0.071(0.001) z
0.051(0.01)by
0.034(0.01)bx
R-R-R+OM
0-10 cm
10-20 cm
20-30 cm
156.52(19.55)bcz
123.17(17.02)cdy
87.69(5.62)cx
0.076(0.001) z
0.063(0.01)ay
0.038(0.01)bx
R-M-R
0-10 cm
10-20 cm
20-30 cm
145.00(13.95)c
143.29(15.50)bc
154.24(23.75)a
0.070(0.02)
0.060(0.001)ab
0.060(0.01)a
R-M-R+OM
0-10 cm
10-20 cm
20-30 cm
185.68(10.12)a
173.09(10.66)a
171.95(6.32)a
0.063(0.01)
0.066(0.01)a
0.070(0.02)a
R-Mb-R
0-10 cm
10-20 cm
20-30 cm
173.25(16.63)ab
161.68(23.64)ab
160.49(21.84)a
0.064(0.01)
0.063(0.001)a
0.070(0.02)a
R-Mb-M
0-10 cm
10-20 cm
20-30 cm
139.38(15.96)cyz
151.55(7.02)abz
127.57(16.29)by
0.070(0.01)
0.062(0.01)a
0.065(0.001)a
R-R-R, rice-rice-rice rotation; R-R-R+OM, rice-rice-rice rotation+10 tons organic manure/crop season; R-M-R, rice-maize-rice rotation; R-M-R+OM, rice-maize (+10 tons organic manure)-rice; R-Mb-R, rice-mungbean-rice rotation; R-Mb-M, rice-mungbean-maize rotation; AC, soil air capacity; SQ, stability quotient; S-index, soil physical parameter index. Different letters in each column mean statistically significant differences at P ≤ 0.05 using DMRT; a, b, c are the significant differences between the rotations; x, y, z are the significant differences between the horizons. Numbers between brackets represent the standard deviations.

Chapter 4: Results and discussion
47
4.2.8. Dexter’s physical soil quality index
The S-index is related to the structural porosity of the soil. S-index ≥ 0.050 indicates “very good”
soil physical or structural quality, while 0.035 ≤ S-index ≤ 0.050 is “good physical quality”, 0.020 ≤
S-index ≤ 0.035 is “poor physical quality”, and S-index ≤ 0.020 is “very poor” or “degraded”
physical quality (Dexter, 2004a,b,c).
A significant decrease of the S-index, with depth, was observed in the R-R-R(+OM) treatments
(50-52% decrease). All the other treatments showed no significant difference between the
horizons. At depth 10-20 cm, the S-index of R-R-R was significantly lower (23-18% lower) than all
treatments except for treatment R-M-R. For depth 20-30 cm, both rice monoculture treatments
had a significantly lower (51-37% lower) S-index than all other treatments. The S-index was
correlated with bulk density (r=0.70) and this explains the lower S-values for the rice
monocultures at depth 20-30 cm. Similar to these findings, Reynolds et al. (2009) suggested a
high correlation between these two soil quality indicators for all types of soil texture, except for
some sandy soils.
R-R-R belonged with an S-index of 0.034 to the “poor physical quality” range. R-R-R+OM has a S-
index of 0.038 at depth 20-30 cm, which is already “good physical quality”. All the other
treatments were in the “very good physical quality” range. These values are exceptionally high
for heavy clayey soils. Optimal S-values should be assessed for the function of the soil and crop.
What might be bad for one crop, might be good for another, thus further research on the
correlation between rice cultivation and S-index is designated before conclusions can be drawn.
Dexter (2004a) suggested that the S-index decreases with clay content. He also suggested that
for soils with a lower clay content OM is stronger correlated with the S-index. This explains the
lower correlation (r=0.56) for the heavy clay soil from the study location.
4.3. Soil water characteristics
4.3.1. Soil water retention curve
The soil water retention curve represents the relationship between the soil matric potential and
the water content of the soil. The curve is influenced by the total porosity, the pore size
distribution, soil structure, soil texture and organic matter.
The van Genuchten equation (1980) was fitted to the observed data pairs to establish the curves
shown in Figure 4.7 to Figure 4.9 for the different depths. The soil water retention curves
showed steep slopes typical for clayey soils.

Chapter 4: Results and discussion
48
Some differences between the land use systems and management practices can be noticed in
the curves and soil water properties have been calculated from the van Genuchten equation in
order to compare the different treatments.
Figure 4.7: Effect of the treatments on soil water retention characteristics, at depth 0-10 cm.
Figure 4.8: Effect of the treatments on soil water retention characteristics, at depth 10-20 cm.
0,2
0,25
0,3
0,35
0,4
0,45
0,5
0,55
0,6
10 100 1000 10000
θ (
m³/
m³)
h (cm)
R-R-R
R-R-R+OM
R-M-R
R-M-R+OM
R-Mb-R
R-Mb-M
0,2
0,25
0,3
0,35
0,4
0,45
0,5
0,55
0,6
10 100 1000 10000
θ (
m³/
m³)
h (cm)
R-R-R
R-R-R+OM
R-M-R
R-M-R+OM
R-Mb-R
R-Mb-M

Chapter 4: Results and discussion
49
Figure 4.9: Effect of the treatments on soil water retention characteristics, at depth 20-30 cm.
4.3.2. Soil water properties
4.3.2.1. Soil water content at field capacity
The soil water content at field capacity is the maximum amount of water that a soil contains
after free drainage. In the study location, it was not possible to determine the field capacity on
site, and a soil water content at -33 kPa was used as an approximation (Θfc; Table 4.6).
In R-R-R and R-R-R+OM, Θfc increased significantly with depth (7% and 9% higher, respectively).
Water content at field capacity also increased with depth in R-Mb-R (8% higher). This might be
due to the higher MatPOR (Figure 4.2) at the upper horizon for these three treatments, because
the water content at field capacity was chosen at -33 kPa. Macro-pores have been already
drained at this matric potential and water retention is influenced mostly by matrix porosity.
In the upper horizon, only a significant higher Θfc was noticeable for R-Mb-M in comparison with
R-M-R+OM. At depth 10-20 cm R-M-R(+OM) and R-Mb-R showed a significant lower Θfc than R-
R-R(+OM) and R-Mb-M. R-Mb-M had a significantly lower (8-18% lower) Θfc than R-R-R+OM at
depth 10-20 cm. At depth 20-30 cm the same trend was visible, although it was not significant.
This can also be explained by the difference in MatPOR.
0,2
0,25
0,3
0,35
0,4
0,45
0,5
0,55
0,6
10 100 1000 10000
θ (
m³/
m³)
h (cm)
R-R-R
R-R-R+OM
R-M-R
R-M-R+OM
R-Mb-R
R-Mb-M

Chapter 4: Results and discussion
50
4.3.2.2. Soil water at permanent wilting point
The soil water at permanent wilting point (Θpwp; Table 4.6) is the residual water that is strongly
held by the adhesive forces from the soil particles and is regarded as the lower limit of available
water for plants. The volumetric soil water content at -15 bar was considered as a suitable
working point of Θpwp (Romano and Santini, 2002).
The Θpwp of the rice monoculture treatments was significantly lower (22-30% lower) for the
upper horizon. This can be explained by the higher amount of organic matter in the upper
horizon that increases the amount of macro-pores and aggregates. For depth 0-10 cm, Θpwp
was significantly lower for R-R-R+OM and R-M-R+OM, than for R-Mb-M (11 and 12%
respectively). At depth 10-20 cm, a significant difference could be noticed: R-M-R(+OM) and R-
Mb-R have lowest Θpwp, followed by R-R-R+OM and R-Mb-M, and highest Θpwp is for R-R-R.
For depth 20-30 almost the same trend can be noticed: R-R-R(+OM) showed the highest Θpwp
(0.33-0.23 m³/m³), followed by R-Mb-M and R-Mb-R (0.27 and 0.26 m³/m³), and the lowest for
R-M-R+OM (0.232 m³/m³). All these differences were strongly negative correlated with the OC-
contents (r=0.84), leading to the conclusion that soils with high OC-content supply more easily
water to the crops.

Chapter 4: Results and discussion
51
Table 4.6: Soil water characteristics for six different crop rotations at three depths.
Horizon Θfc (m³/m³) Θpwp
(m³/m³)
RWC (m³/m³) PAWC (m³/m³)
R-R-R 0-10 cm
10-20 cm
20-30 cm
0.452(0.03)ab y
0.507(0.02)ab z
0.487(0.01)abcz
0.236(0.02)aby
0.301(0.01)a z
0.329(0.02)a z
0.832(0.02) y
0.879(0.03)az
0.860(0.02) yz
0.2152(0.01) z
0.2068(0.01)bz
0.1588(0.02)cy
R-R-R+OM 0-10 cm
10-20 cm
20-30 cm
0.457(0.001)aby
0.514(0.02)a z
0.504(0.01)a z
0.232(0.001)bx
0.278(0.01)by
0.333(0.02)az
0.839(0.02) y
0.889(0.01)az
0.866(0.03) yz
0.2251(0.001)z
0.2365(0.02)a z
0.1708(0.04)bcy
R-M-R 0-10 cm
10-20 cm
20-30 cm
0.466(0.04)ab
0.436(0.03)c
0.446(0.04)c
0.245(0.01)ab
0.244(0.02)c
0.246(0.01)bc
0.825(0.03)
0.817(0.04)b
0.834(0.04)
0.2213(0.05)
0.1917(0.02)b
0.1999(0.04)abc
R-M-R+OM 0-10 cm
10-20 cm
20-30 cm
0.434(0.04)b
0.420(0.03)c
0.451(0.05)bc
0.230(0.01)b
0.230(0.01)c
0.232(0.01)c
0.797(0.04)
0.813(0.03)b
0.852(0.05)
0.2038(0.03)
0.1901(0.02)b
0.2191(0.05)ab
R-Mb-R 0-10 cm
10-20 cm
20-30 cm
0.453(0.02)ab y
0.436(0.02)c y
0.491(0.02)abcz
0.252(0.02)ab
0.236(0.01)c
0.261(0.01)b
0.823(0.02) y
0.820(0.02)by
0.860(0.02) z
0.2011(0.03)
0.1996(0.02)b
0.2230(0.03)a
R-Mb-M 0-10 cm
10-20 cm
20-30 cm
0.497(0.03)a
0.473(0.01)b
0.496(0.01)ab
0.260(0.02)a
0.268(0.01)b
0.266(0.02)b
0.828(0.02) y
0.841(0.02)byz
0.867(0.02) z
0.2370(0.04)
0.2056(0.02)b
0.2308(0.02)a
R-R-R, rice-rice-rice rotation; R-R-R+OM, rice-rice-rice rotation+10 tons organic manure/crop season; R-M-R, rice-maize-rice rotation; R-M-R+OM, rice-maize (+10 tons organic manure)-rice; R-Mb-R, rice-mungbean-rice rotation; R-Mb-M, rice-mungbean-maize rotation; θfc, volumetric water content at field capacity; Θpwp, volumetric water content at permanent wilting point; RWC, relative water capacity; PAWC, plant available water capacity. Different letters in each column mean statistically significant differences at P ≤ 0.05 using DMRT; a, b, c are the significant differences between the rotations; x, y, z are the significant differences between the horizons. Numbers between brackets represent the standard deviations.
4.3.2.3. Relative water capacity
The relative water capacity (RWC; Table 4.6) represents the capacity of a soil to store water (and
air) relative to the total pore volume. In the optimum range of RWC (0.6≤RWC≤0.7), the
proportion of soil water and soil air maximizes microbial activity. For RWC≤0.6, the insufficient
soil water reduces the microbial activity and for RWC≥0.7 microbial activity will be reduced by
insufficient soil air (Linn and Doran, 1984).
All of the RWC-values were higher than the optimum range, which could already have been
expected from the low AC-values (Figure 4.6). The insufficient aeration could reduce microbial
activity (Skopp et al., 1990). For horizon 10-20 cm, RWC was significantly higher for the rice
monoculture treatments (4-9% higher), which results from the significant lower AC. R-M-R+OM
at depth 0-10 cm scored best for RWC.

Chapter 4: Results and discussion
52
4.3.2.4. Plant available water capacity
For fine-textured soil, Cockroft and Olssen (1997) recommended that plant available water
capacity (PAWC; Table 4.6) should be higher than 0.20 m³/m³ to become maximum root growth
and minimum susceptibility to ‘doughtiness’. Soils with a PAWC < 0.10-0.15 m³/m³ are
‘droughty’.
For both rice monoculture treatments PAWC decreased significant at depth 20-30 cm. This might
be due to compaction at this depth, but in reality the rice fields are continuously flooded and its
PAWC gives no important indication for rice cropping. For the upper horizon, no significant
difference was observed, because Ѳfc and Ѳpwp follow the same trend. At depth 10-20 cm, R-R-
R+OM had a significantly higher PAWC than all other treatments, which might be explained by
its higher Ѳfc, due to the higher matrix porosity. For depth 20-30 cm, R-Mb-M and R-Mb-R
showed significantly higher PAWC (23-31% higher) than the rice monoculture treatments. At this
depth R-M-R(+OM) had also higher PAWC (22-27% higher), but not significant.
PAWC is not always the perfect measure to meet plant water supply. Easily available soil water is
the fraction of PAWC that can be withdrawn without difficulties and the reduction of available
soil water is regularly a consequence of intense evapotranspiration demands (Romano and
Santini, 2002). To become the easily available soil water a depletion factor p should be used,
which gives the average fraction of the total available soil water that can be depleted from the
root zone before moisture stress. The value of p depends on the crop type, the crop
development stage, soil texture and magnitude of evapotranspiration (Verplancke, 2003). For
rice cultivation, no p-factor should be used because the field is flooded.
4.4. Field survey with farmers
Interviews with the local farmers at the study location and from surrounding areas with the
same major soil group (Cai Lay district, Tien Giang province, Mekong Delta, Vietnam) were
carried out to collect information about former and present land use system and land
management practices. The investigation to a total of 109 farmers included four land uses: 30
farmers with 3 rice crops/year, 30 farmers with 1 rice and 2 upland crops/year, 30 farmers with
2 rice and 1 upland crop/year and 19 farmers with 3 upland crops/year.

Chapter 4: Results and discussion
53
4.4.1. History of land exploitation and land use
Local farmers exploited the land and produced one traditional rice crop per year before 1967.
This traditional rice had a growing period of 5-6 months and yielded on average 2.5-3.0 tons/ha.
Gradually, high yield rice varieties were introduced and two rice crops per year, a Winter - Spring
crop and a Summer-Autumn crop were cultivated. Since 1980, three rice crops are cultivated:
Winter - Spring rice (25-30/10 - 25-30/01), Spring - Summer rice (01-05/02 - 05-10/5), Summer -
Autumn rice (15-20/5 - 01-05/9) with short growing periods of 90-100 days.
4.4.2. Present land use systems and cultivation practices
4.4.2.1. Planting practices
The farmers are used to sowing or transplanting the next crop when the previous one is
harvested. The sowing density is 100 kg/ha – 200 kg/ha. The seeds are placed in water for 24
hours, they are kept warm for 36 hours and then sown directly on the field.
General crop schedule of the study location (Wet sowing)- 3 rice crop/year:
General crop schedule of the study location - 2 rice crop+ 1 upland crop/year:

Chapter 4: Results and discussion
54
General crop schedule of the study location- 1 rice crop + 2 upland crops/year:
General crop schedule of the study location- 3 upland crops/year:
4.4.2.2. Rice variety
The following rice (Oryza sativa) varieties are used OM 2517, OM 3536, OM 1490, OM 2514, OM
4495, IR 50404, MTL 250, MTL 233, VND 95-20.
4.4.2.3. Land and crop management
After harvesting the rice in the dry season (crop 1), the straw is broadcasted over the field and
burned. After burning, the soil is irrigated and the flooded soil is puddled with a machinery-
plough (tractor) or small handle tractor. Subsequently, the next crop can be sown.
After harvesting the rice in the rainy season (crop 2 and crop 3), the straw is cumulated in large
bundles. Then, as a traditional land preparation before sowing, soil preparation is applied using a
machinery-plough (tractor) or small handle tractor.
The soil is plowed 5-10 cm deep, three times per year for the three rice crops. For upland crop
the soil is dug 20-30 cm deep and the farmer makes a raised bed.

Chapter 4: Results and discussion
55
4.4.2.4. Fertilization and crop protection
For the annual activities, the local farmer has to carry out some management activities for each
rice crop cultivation:
Fertilizer application: each rice crop is fertilized by rather high dose of NPK (examples of
fertilizer: DAP, Urea, Superphosphat, Kaliclorua, NPK20-20-15, NPK16-16-8). Fertilizers
are broadcasted by hand. Organic fertilizers are not applied.
Crop protection (pesticides, insecticides, herbicides): Till, Validacine, Sofit, Basudin,
Badan, Regent, Applaumic, Bassan,…
Weed control and irrigation.
4.4.2.5. Soil management level
For soil improvement, no other activities are done besides the two main ones on the study
location: ploughing and applying inorganic fertilizers.
4.4.3. Rice yield evolution
Based on the interviews with local farmers, the following information on crop yield was collected
(Figure 4.10).
The rice yield is much higher for the Winter-Spring rice than for the Summer-Autumn or
Autumn-Winter cropping period (Figure 4.10). This may be due to the better climatic conditions
(Figure 3.3, period with average precipitation, Oct.-Jan.) and is the reason that rice is preferably
cultivated in this period. According to the farmers, the main limiting factor for their crop
production and income in the early growing period of the Summer-Autumn rice crop is water,
accompanied by insect diseases and soil compaction.
In the last five years, the rice yield has been decreasing significantly for the intensive rice
monoculture (decrease of 6%). For the crop rotation with one upland crop, the rice yield has
significantly been increased over the last 5 years (8% increase for Autumn-Winter and 6% for
Winter-Spring). For a crop rotation with two upland crops the rice yield has increased 7% over
five years.

Chapter 4: Results and discussion
56
Figure 4.10: Rice yield within recent-past 5 years (kg/ha) for different land management systems. 3xR,
rice-rice-rice rotation; 2R+1xU, rice-upland crop-rice rotation; 1xR+2xU, rice-upland crop-upland crop
rotation; W – Sp, Winter-Spring; Su – A, Summer-Autumn; A – W, Autumn-Winter.
4.4.4. Economic evaluation
In Figure 4.11, the costs for seeds and materials, fertilizers, pesticides and labor and the income
have been visualized for the different land management practices.
The contribution of seeds and materials to the total cost is very low (5 to 7%) and the lowest for
rice monoculture. Fertilizer application is 17 to 26% of the total cost. In rice monoculture more
fertilizer has to be applied because of the unilateral use of the soil and its minerals. The rotation
with one upland crop shows the lowest costs for pesticides. The interruption of the rice
cultivation by an upland crop might break off the food-supply for rice specific pests and
decreases need for pesticides. Pesticides are 10 to 12% of the total cost.
Labor manifests the highest contribution to the total cost (55-65% of total cost). The use of
upland crops in the rotations creates more labor because of the need for raised beds that have
to be dug. The price for labor in comparison with rice monoculture is 40, 28 and 16% higher for
three upland crops, two upland crops and one upland crop in the rotation, respectively. This
makes the total cost to increase with increasing use of upland crops in the rotation.
3.000
3.500
4.000
4.500
5.000
5.500
6.000
6.500
7.000
7.500
8.000
2006 2007 2008 2009 2010
Yie
ld (
kg/h
a)
year
Rice Yield
3xR (W-Sp)
2xR+1xU (W-Sp)
1xR+2xU (W-Sp)
3xR (Su-A)
2xR+1xU (A-W)
3xR (A-W)
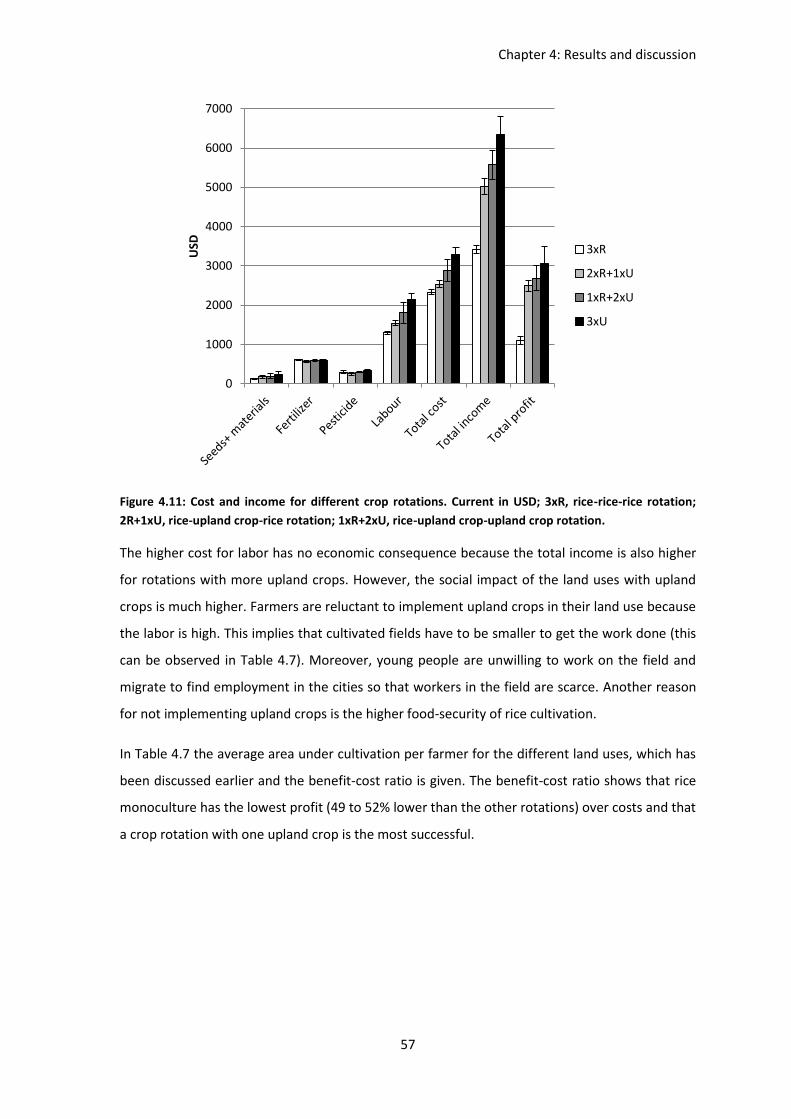
Chapter 4: Results and discussion
57
Figure 4.11: Cost and income for different crop rotations. Current in USD; 3xR, rice-rice-rice rotation;
2R+1xU, rice-upland crop-rice rotation; 1xR+2xU, rice-upland crop-upland crop rotation.
The higher cost for labor has no economic consequence because the total income is also higher
for rotations with more upland crops. However, the social impact of the land uses with upland
crops is much higher. Farmers are reluctant to implement upland crops in their land use because
the labor is high. This implies that cultivated fields have to be smaller to get the work done (this
can be observed in Table 4.7). Moreover, young people are unwilling to work on the field and
migrate to find employment in the cities so that workers in the field are scarce. Another reason
for not implementing upland crops is the higher food-security of rice cultivation.
In Table 4.7 the average area under cultivation per farmer for the different land uses, which has
been discussed earlier and the benefit-cost ratio is given. The benefit-cost ratio shows that rice
monoculture has the lowest profit (49 to 52% lower than the other rotations) over costs and that
a crop rotation with one upland crop is the most successful.
0
1000
2000
3000
4000
5000
6000
7000
USD
3xR
2xR+1xU
1xR+2xU
3xU

Chapter 4: Results and discussion
58
Table 4.7: Mean area under cultivation (ha) and costs-benefit ratio for different land management
systems.
Land use 3xR 2xR+1xU 1xR+2xU 3Xu
Area (ha) 0.91(0.36) 0.68(0.33) 0.43(0.18) 0.36(0.15)
B/C 0.47 0.98 0.93 0.93
3xR, rice-rice-rice rotation; 2R+1xU, rice-upland crop-rice rotation; 1xR+2xU, rice-upland crop-upland crop rotation; Area, average area under cultivation per farmer (ha); B/C, benefit/cost-ratio; Numbers between brackets represent the standard deviations.
When the rice cropping was rotated with one or more upland crops, the rice yield reduction
from the rice monoculture disappears and even an increase in rice yield has been observed. This
changes are accompanied with a minor use of fertilizer and pesticides, and most important, an
increase in farmer’s income.

Chapter 5: General conclusions and recommendations
59
5. GENERAL CONCLUSIONS AND RECOMMENDATIONS
Regarding the impact of land management on chemical parameters, this study showed that crop
rotation with rice and upland crops in alluvial soils with a heavy clayey texture improves the
distribution of OM and labile C between the horizons. For Nav and Pav this improvement has also
been observed, but was less pronounced. The rotation with two upland crops showed a lower
concentration of labile C, Nav and Pav in comparison with the rotation with one upland crop. This
could be due to the high nutrient demand of upland crops and its low input of organic matter.
The type of land management also had an effect on physical soil properties. Rotations with
upland crops showed a significant lower bulk density, higher total porosity and higher macro-
porosity than rice monoculture with a compacted layer (20-30 cm depth). The rotation with two
upland crops scores less good than the rotations with one upland crop for these parameters. The
higher bulk density in the rice monoculture treatments causes a significantly increased soil
strength or penetration resistance at the compacted layer, which makes it difficult for the crop
roots to move within the soil. For the same reason, AC, SQ and the S-index are significant lower
for the rice monoculture treatments. AC was lower than the optimum range for all treatments,
and subsequently RWC was also higher than the optimum values. RWC was highest for rice
monoculture treatments because of the flooded conditions. PAWC was also significantly lower
for the rice monoculture cropping at the compacted depth, because of the higher bulk density.
The higher SOC-content in the rotations with one upland crop results in lower water content at
permanent wilting point, compared to the other treatments. There is a high negative correlation
(r=0.84) between SOC and water content at permanent wilting point, leading to the conclusion
that soils with high OC-content supply more easily water to the crops.
The addition of organic manure to the rotations (R-R-R+OM and R-M-R+OM) did not show a
significant increase in SOC and labile C and subsequently, no differences in bulk density and total
porosity were observed. This might be due to the fact that organic manure has only been
applied for four years, and progress might be possible in the future. Improvement in Nav, Pav and
TA has been observed due to addition of organic manure in the rice monoculture. PL, AC, SQ
increase for both treatments with organic manure. A higher PL means that the topsoil becomes
more stable with addition of organic manure. The increase of SQ gives a higher structural
stability. The correlation of the S-index with SOC is quite low, and therefore the S-index does not
impart a higher value for the treatments with added organic manure .

Chapter 5: General conclussions and recommendations
60
For matrix porosity, absence of optimum values makes it difficult to interpret the results.
Anyhow, a higher MatPOR has been observed for the rice monoculture treatments because of
the flooded conditions and for the rotation with two upland crops because of the aggregate
breakdown by mixing. The matrix porosity influences the water content at field capacity because
at field capacity macro-pores are already emptied. This is why the water content at field capacity
was higher for the rice monoculture treatments.
From the interviews with the farmers, it was concluded that the rice yield was increased in the
last five years when rotation with upland crops was implemented. This was strongly in contrast
with the rice yield decrease over the last five years for rice monoculture. The use of upland crops
in the rotation implies higher costs, especially for labor, and this makes that farmers are
reluctant to use upland crops. The cost/benefit-ratio is the highest for rotation with one upland
crop in between two rice cultivations.
From the above, it can be finally concluded that soil quality tends to improve with crop rotation,
e.g. soil structure improves with cycles of drying (upland crops) and wetting (rice cultivation). In
general, rotation with one upland crop and two rice cultivations gives a better soil quality and
higher rice-yields than rice monoculture or rotation with two upland crops.
The advantage of higher soil quality and a higher cost-benefit ratio has to be balanced with the
disadvantage of higher labor costs and the decline in food security. Farmers are reluctant to use
upland crops for these reasons, and the recommendation of two upland crops in the rotation
would be unrealistic.
In line with the findings of this study and the recognized gaps in knowledge, succeeding research
should be investigating if soils that have been under rice monoculture show less optimal values
for various parameters after one or more years of land use change and if long term effects of
addition of organic manure on physical and chemical soil parameters give a different or higher
contributions to soil quality.
The absence of an optimum range for matrix and macro-porosity makes it difficult to draw
conclusions from these parameters. The optimal range of these soil quality indicators should be
investigated and the relation between Dexter’s S-index and rice cultivation should also be
researched to be able to conclude what is the good S-range for crop rotation involving rice and
upland crops in clayey soils. To optimize the water content at field capacity in rice fields, a
method to measure field capacity in the field of the rice cultivation should be developed.

References
61
REFERENCES
Agriculture Solutions (2011). Available at: www.agriculturesolutions.com (Accessed: 1 May 2011)
Arthur, E., Cornelis, W. M., Vermang, J., De Rocker, E. (2011). Amending a loamy sand with three
compost types: impact on soil quality. Soil Use and Management, 27, 116-123.
ASTM D 4138 (1989). Standard Test Methods for Liquid Limit, Plastic Limit and Plasticity Index of
Soils. Annual Book of ASTM Standards, Sec. 4, Vol. 04.08, Soil and Rock. American Society for
Testing and Materials, Building Stones, ASTM, Philadelphia, 279–289.
ASTM D 4318 (2003). Standard test methods for liquid limit, plastic limit, and plasticity index of
soils. Annual Book of ASTM Standards, 04.08, 582-595, West Conshohocke.
Atterberg, A. M. (1911). Über die physikalische bodenuntersuchung, und über die plasticität de
tone. International Mitteilungen für Bodenkunde, Verlach für Fachliteratur, G. m. b. H., Berlin, 1,
10-43.
Baldwin, K. R. (2006). Soil Quality Considerations for Organic Farmers. Organic Production,
Center for environmental farming systems, 1-14.
Batey, T. (2009). Soil compaction and soil management: a review. Soil Use and Management, 25,
335-345.
Batjes, N. H. (1996). Total carbon and nitrogen in the soils of the World. European Journal of Soil
Science, 47,151-163.
Blum, W. E. H. (1998). Agriculture in a Sustainable Environment: A Holistic Approach. Int.
Agrophyisics, 12, 13-24.
Bomans, K., Dewaelheyns, V., Goffings, M., Gulinck, H., Govers, G., Heremans, S., Lambie, B.,
Meeus, S., Notebaert, B., Poesen, J., Ruysschaert, G. ,Stalpaert, L., Van den Bulck, S.,
Vandendriessche, H., Van Rompaey, A., Verstraeten, G. (2006) . MIRA Milieurapport Vlaanderen,
Achtergronddocument 2007, Bodem, Vlaamse Milieumaatschappij, www.milieurapport.be.
Brady, N.C. (1998). The Nature and Properties of Soils. MacMillan Publishing Company, New
York, 881.
Brady, N. C., Weil, R. R. (2002). ‘Chapter 8: Soil Colloids: Seat of soil chemical and physical
activity.’ In: The Nature and Properties of Soils, 13th ed., Prentice Hall, New Jersey, USA, 960.

References
62
Bray, R. H. and Kurtz, L. T. (1945). Determination of total, organic and available forms of
phosphate soils. Soil Science, 59, 39.
Carré, F. ‘Identifying Risk Areas for Soil degradation in Europe by Landslides’. In: Eckelmann, W.,
Baritz, R., Bialousz, S., Bielek, P., Carre, F., Houšková, B., Jones, R.J.A., Kibblewhite, M.G., Kozak,
J., Le Bas, C., Tóth, G., Tóth, T., Várallyay, G., Yli Halla, M. & Zupan, M. (2006). Common Criteria
for Risk Area Identification according to Soil Threats. European Soil Bureau Research Report
No.20, EUR 22185 EN, 94pp. Office for Official Publications of the European Communities,
Luxembourg.
Carter, M. R. (2002). Soil Quality for Sustainable Land Management: Organic Matter and
Aggregation Interactions that Maintain Soil Functions. Agronomy Journal, 94, 38-47.
Cartrysse, D. (1999). Fysische evaluatie van het productiepotentieel van goed ontwikkelde
alluviale bodems in de Mekong Delta- Zuid Vietnam. Thesis, Ghent University, Faculty
Agricultural and Applied Biological Sciences, 138.
Celik, I., Ortas, I., Kilic, S. (2004). Effects of compost, mycorrhiza, manure and fertilizer on some
physical properties of Chromoxerert soil. Soil and Tillage Research, 78, 59-67.
Chan, K. Y., Heenan, D. P. (1996). The influence of crop rotation on soil structure and soil
physical parameters under conventional tillage. Soil and tillage research, 37, 113-125.
Chieu, T. T., Phong, T. A., Pho, N. C., Nhan, N. V., Khanh P. Q. (1990). Soil map of the Mekong
Delta, 1/250.000 scale. National Institute of Agricultural Planning and Projection (NIAP). State
program 60B, Hanoi, Vietnam.
Cockroft, B., Olssen, K. A. Case study of soil quality in southeastern Australia: Management of
structure of roots in duplex soils. In: Gregorich, E. G., Carter, M. R. (1997). Soil quality for crop
production and ecosystem health. Developments in Soil Science, vol.25. Elsevier, New York, 339-
350.
Cornelis, W. M., Khlosi, M., Hartmann, R., Van Meirvenne, M., De Vos, B. (2005). Comparison of
unimodal analytical expressions for the soil-water retention curve. Soil Science Society American
Journal, 69, 1902-1911.
Cotching, W. E., Cooper, J., Sparrow, L. A., McCorkell, B. E., Rowley, W. (2001). Effect of
agricultural management on Tenosols in northern Tasmania. Australian Journal of Soil Research,
40, 1267-1286.

References
63
Cotching, W. E., Cooper, J., Sparrow, L. A., McCorkell, B. E., Rowley, W., Hawkins, K. (2002).
Effect of agricultural management on Vertisols in Tasmania. Australian Journal of Soil Research,
40, 1267-1286.
Dalal, R. C., Chan, K. Y. (2001). Soil organic matter in rainfed cropping systems of the Australian
cereal belt. Australian Journal of Soil Research, 39, 435-464.
Dawson, J. J. C., Smith, P. (2007).Carbon losses from soil and its consequences for land-use
management. Science of the Total Environment, 382, 165-191.
De Leenheer, L., De Boodt, M. (1959). Determination of aggregate stability by the change in
mean weight diameter. Mededelingen van landbouwhogeschool en de opzoekingstations van de
staat te Gent, 24, 290–30.
Dexter, A.R. (2004a). Soil physical quality - Part I: Theory, effects of soil texture, density, and
organic matter, and effects on root growth. Geoderma, 120, 201–214.
Dexter, A.R. (2004b). Soil physical quality - Part II: Friability, tillage, tilth and hard-setting.
Geoderma, 120, 215–225.
Dexter, A.R. (2004c). Soil physical quality - Part III: Unsaturated hydraulic conductivity and
general conclusions about S-theory. Geoderma, 120, 227–239.
Doran, J. W., and Parkin, T. B. (1994). Defining and assessing soil quality. Soil Science Society of
America, 35, 3-21.
Doran, J. W., and Parkin, T. B. (1996). Quantitative Indicators of Soil Quality: A Minimum Dataset.
Soil Science Society of America, 49, 25-37.
Doran, J. W., Sarrantonio, M., Liebig, M. A. (1996). Soil Heath and Sustainability. Advances in
Agronomy, 56, 1-54.
Doran, J. W., and Zeiss, M. R. (2000). Soil health and sustainability: managing the biotic
component of soil quality. Applied Soil Ecology, 15, 3-11.
Doran, J. W. (2002). Soil health and global sustainability: Translating science into
practice.Agriculture, Ecosystems and Environment, 88, 119-127.
Dung, N. H., Thien,T. C., Hong,N. V., Loc,N. T., Minh, D. V., Thau, T. D., Nguyen, H. T. L., Phong,N.
T., Son, T. T. (2000). Impact of Agro-Chemical Use on Productivity and Health in Vietnam.
International Development Research Centre, Canada, 69.

References
64
Edelman, C. H., Van der Voorde, P. K. J. (1963). Important characteristics of alluvial soils in the
tropics. Soil Science, 95, 258-263.
FAO. (1976). A framework for land evaluation. Soil resource development and conservation
service: land and water development division, Rome, Italy.
FAO. (1993). FESLM: An international framework for evaluating sustainable land management.
World Soil Resource Report, 73.
FAO. (2003). Soil Compactation. Conservation of natural resources for sustainable agriculture.
Gardi, C., Menta, C., Montanarella, L., Cenci, R. ‘Main threats on soil biodiversity: The case of
agricultural activities impacts on soil microarthropods’. In: Tóth, G., Montanarella, L., Rusco, E.
(2008). Treats to Soil Quality in Europe. EUR 23438 EN, 150pp. Office for Official Publications of
the European Communities, Luxembourg.
Gay, S. H., Louwagie, G., Sammeth, F., Ratinger, T., Maréchal, B., Prosperi, P., Rusco, E., Terres, J.,
van der Velde, M., Baldock, D., Bowyer, C., Cooper, T., Fenn, I., Hagemann, N., Prager, K., Heyn,
N., Schuler, J. (2009). Final Report on the project ‘Sustainable Agriculture and Soil Conservation’.
EUR 23820 EN, 150pp. Office for Official Publications of the European Communities,
Luxembourg.
George, T., Magbanua, R., Garrity, D. P., Tuban, B. S., Quiton, J. (2002). Rapid Yield Loss of Rice
Cropped Successively in Aerobic Soil. Agronomy Journal, 94, 981-989.
Gillman, G.P. (1979). A proposed method or the measurement of exchange properties of highly
weathered soils. Australian Journal of Soil Research, 17, 129-139.
Grossman, R. B., Reinsch, T. G. ‘Bulk Density and Linear Extensibility’ In: Dane, J. H., Topp, G. C.
(2002). Methods of Soil Analysis: Part 4: Physical Methods. Soil Science Society of America Book
Series. Madison, Wisconsin, USA, 201-228.
Hamza, M. A., Anderson, W. K. (2005). Soil compaction in cropping systems: A review of the
nature, causes and possible solutions. Soil & Tillage Researc,. 82, 121–145.
Hassett, J. J., Banwart, W. L. (1992). Soils and their environment. Englewood Cliffs, New Jersey,
424.
Hillel, D. (1998). Environmental Soil Physics. Academic press, San Diego, CA, USA, 705.

References
65
Hoa, L. T. V., Shigeko, H., Nhan, N. H. Cong, T. T. (2008). Infrastructure effects on floods in the
Mekong River Delta in Vietnam. Hydrological Processes, 22, 1359-1372.
Hoyle, F.C., Murphy, D.V. (2006). Seasonal changes in microbial function and diversity associated
with stubble retention versus burning. Australian Journal of Soil Research, 44, 407-423.
Kanema, C. (2009). Production potential of wetland soils of the Kafue Flats in Zambia. Thesis,
Faculty of Agriculture, Rheinische Friedrich-Wilhelms-Universität zu Bonn, 78.
Karlen, D. L., Mausbach, M. J., Doran, J. W., Cline, R. G., Harris, R. F., Schuman, G. E. (1997). Soil
Quality: A Concept, Definition, and a Framework for Evaluation. Soil Science Society of America,
61, 4-10.
Khoa, L. V. (2002). Physical fertility of typical Mekong Delta soils (Vietnam) and land suitability
assessment for alternative crops with rice cultivation. PhD thesis, Faculty of Agricultural and
Applied Biological Science, Ghent University, Belgium.
Kibblewhite, M., Baritz, R., Zupan, M., Yli-Halla, M. ‘Identifying Risk Areas for Soil Degradation in
Europe by Soil Organic Matter (SOM) Decline’. In:Eckelmann, W., Baritz, R., Bialousz, S., Bielek,
P., Carre, F., Houšková, B., Jones, R.J.A., Kibblewhite, M.G., Kozak, J., Le Bas, C., Tóth, G., Tóth, T.,
Várallyay, G., Yli Halla, M. & Zupan, M. (2006). Common Criteria for Risk Area Identification
according to Soil Threats. European Soil Bureau Research Report No.20, EUR 22185 EN, 94pp.
Office for Official Publications of the European Communities, Luxembourg.
Lal, R., Manoj, K. S. (2004). Principles of Soil Physicis. Marcel Dekker, Inc., New York, USA, 149-
163.
Le Bas, C., Houšková, B., Bialousz, S., Bielek, P. ‘Identifying Risk Areas for Soil degradation in
Europe by Compaction’. In: Eckelmann, W., Baritz, R., Bialousz, S., Bielek, P., Carre, F., Houšková,
B., Jones, R.J.A., Kibblewhite, M.G., Kozak, J., Le Bas, C., Tóth, G., Tóth, T., Várallyay, G., Yli Halla,
M. & Zupan, M. (2006). Common Criteria for Risk Area Identification according to Soil Threats.
European Soil Bureau Research Report No.20, EUR 22185 EN, 94pp. Office for Official
Publications of the European Communities, Luxembourg.
Le Bissonnais, Y. (1996). Aggregate stability and assessment of soil crustability and erodibility: I.
Theory and methodology. European Journal of Soil Science, 47, 425-437.

References
66
Levi, M. R., Shaw, J. N., Hermann, S. M., Carter, E. A., Feng, Y. (2009). Land Management Effects
on Near-Surface Soil Properties of Southeastern U.S. Coastal Plain Kandiudults. Soil Science
Society of America,74, 258-271.
Liebman, M., Mohler, C. L., Staver, C. P. (2001). Ecological management of agricultural weeds.
Cambridge University Press, Cambridge.
Linn, D.M., Doran, J.W. (1984). Effect of water-filled pore space on carbon dioxide and nitrous
oxide production in tilled and nontilled soils. Soil Science Society of America, 48, 1267–1272.
Lowery, B., Morrison, J. E. ‘Soil Penetrometers and Penetrability’. In: Dane, J. H., Topp, G. C.
(2002). Methods of Soil Analysis: Part 4: Physical Methods. Soil Science Society of America Book
Series. Madison, Wisconsin, USA, 363-388.
Malkawi, A. I. H., Alawneh, A. S., Abu-Safaqah, O. T. (1999). Effects of organic matter on the
physical and the physicochemical properties of an illitic soil. Applied Clay Science, 14, 257-278.
Maréchal, B., Prosperi, P., Rusco, E. ‘Implications of soil threats on agricultural areas in Europe’.
In: Tóth, G., Montanarella, L., Rusco, E. (2008). Treats to Soil Quality in Europe. EUR 23438 EN,
150pp. Office for Official Publications of the European Communities, Luxembourg.
McKenzie, N., Coughlan, K., Cresswell, H. (2002). Soil physical measurement and interpretation
for land evaluation. Collingwood, CSIRO Publishing, 392.
Milne, E., Al Adamat, R., Batjes, N. H., Bernoux, M., Bhattacharyya, T., Cerri, C. C., Cerri f, C. E. P.,
Coleman, K., Easter, M., Falloon, P., Feller, C., Gicheru, P.,Kamoni, P., Killian, K., Pal, D.K.,
Paustian, Powlson, D. S., Rawajfih, Z., Sessay,M., Williams, S., Wokabi, S.(2007). National and
sub-national assessments of soil organic carbon stocks and changes: The GEFSOC modelling
system. Agriculture, Ecosystems and Environment, 122, 3-12.
Minh, L. Q. (2000). Environmental Governance: A Mekong Delta case study with downstream
perspectives. Can Tho University, Vietnam, 1-15.
Pagliai, M., Vignozzi, N., Pellegrini, S. (2004). Soil structure and the effect of management
practices. Soil and Tillage Research, 79, 131-143.
Olk, D. C., Gaunt, J.L., Neue, H. U., Cassman, K. G., Arah, J. R. M., Witt, C., Ottow, J. C. G., Grant, I.
F. (1995). Microbial biomass and organic matter turnover in wetland rice soils. Biology and
Fertility of Soils, 19, 333-342.

References
67
Qadir, M., Ghafoor, A., Murtaza, G. (2000). Amelioration strategies for saline soils: a review.
Land Degradation and Development, 11, 501-521.
Qadir, M., Tubeileh, A., Akhtar, J., Larbi, A., Minhas, P. S., Khan, M. A.(2008). Productivity
enhancement of salt-affected environments through crop diversification. Land Degradation and
Development, 19, 429-453.
Reynolds, W. D., Drury, C. F., Yang, X. M., Fox, C. A., Tan, C. S., Zhang, T. Q. (2007). Land
management effects on the near-surface physical quality of a clay loam soil. Soil & Tillage
Research, 96, 316-330.
Reynolds, W. D., Drury, C. F., Tan, C. S., Fox, C. A., Yang, X. M. (2009). Use of indicators and pore
volume-function characteristics to quantify soil physical quality. Geoderma, 152, 252-263.
Richter, D. D., Markewitz, D. (2001). Understanding Soil Change: soil sustainability over
Millennia, Centuries and Decades. University Press, Cambridge, 253.
Rickman, R., Douglas, C., Albrecht, S., Berc, J.(2002). Tillage, crop rotation, and organic
amendment effect on changes in soil organic matter. Environmental pollution, 116, 405-411.
Romano, N., Santini, A. ‘Field’. In: Dane, J. H., Topp, G. C. (2002). Methods of Soil Analysis: Part 4:
Physical Methods. Soil Science Society of America Book Series. Madison, Wisconsin, USA, 721-
738.
Schueneman, T., Rainbolt, C., Gilbert, R. (2008). Rice in the crop rotation. Institute of food and
agricultural science (IFAS), University of Florida, University cooperative extension program, 6.
Segeren, A. G., Trout, T. J. (1991). Hydraulic Resistance of Soil Surface Seals in Irrigated Furrows.
Soil Science Society of America,55, 640-646.
Sharma, K. L., Kusuma Grace, J., Mandal, U. K., Gajbhiye, P. N., Sriniva, K., Krowar, G. R., Bindu, V.
H., Ramesh, V., Ramachandran, K., Yada, S. K. (2008). Evaluation of long-term soil management
practices using key indicators and soil quality indices in a semi-arid tropical Alfisol. Australian
Journal of Soil Research, 46, 368–377.
Shukla, M. K., Lal, R., Ebinger. M. (2006). Determining soil quality indicators by factor analysis.
Soil & Tillage Research,87, 194-204.
Singer, M. J., Le Bissonnais, Y. (1998). Importance of surface sealing in the erosion of some soils
from a mediterranean climate. Geomorphology, 24, 79-85.

References
68
Skopp, J., Jawson, M. D., Doran, J. W. (1990). Steady-State Aerobic Microbial Activity as a
function of Soil-Water Content. Soil Science Society of America Journal, 54, 1619-1625.
Soil Survey Staff (1998). Keys to soil taxonomy. United States Department of Agriculture and
Natural Resources Conservation Service, Eighth Edition, Washington. D. C., 328.
Stine, M.A., Weil, R.R. (2002). The relationship between soil quality and crop productivity across
three tillage systems in south central Honduras. American Journal of Alternative Agriculture, 17,
1-8.
Sys, C., Van Ranst, E., Debaveye, J., Beernaert, F. (1993). Land Evaluation- Part III: Crop
requirements. Agricultural Publications, 7.
The Worldbank (2010). Available at: data.worldbank.org (Accessed: 10 November 2010).
Thierfelder, C., Amézquita, E., Stahr, K. (2005). Effects of intensifying organic manuring and
tillage practices on penetration resistance and infiltration rate. Soil & Tillage Research, 82, 211-
226.
Tóth, G., Stolbovoy, V., Montanarella, L. (2007). Soil Quality and Sustainability Evaluation. An
integrated approach to support soil-related policies of the European Union. EUR 22721 EN.
40pp. Office for Official Publications of the European Communities, Luxembourg. ISBN 978-92-
79-05250-7.
Tóth, G., Adhikari, K., Várallyay, G., Tóth, T., Bódis, K., Stolbovoy, V. ‘Updated map of salt
affected soils in the European Union’. In: Tóth, G., Montanarella, L., Rusco, E. (2008). Treats to
Soil Quality in Europe. EUR 23438 EN, 150pp. Office for Official Publications of the European
Communities, Luxembourg.
Tran Ba, L. (2004). Physical Fertility of a Soil under Intensive Rice Cultivation in the Mekong Delta
(Vietnam) and Land Suitability Assessment for Alternative Crops with Rice Cultivation. Case
Study at Long Khanh Village. Thesis, Ghent University, Free University of Brussels, Belgium, 155.
Vanags, C., Minasny, B., McBratney, A. B. (2006). The dynamic penetrometer for assessment of
soil mechanical resistance. Faculty of Agriculture, Food and Natural Resources, The University of
Sydney NSW, Australia, 8.
Van Camp, L., Bujarrabal, B., Gentile, A. R., Jones, R. J. A., Montanarella, L., Olazabal C.,
Selvaradjo, S. K. (2004). Reports of the technical working groups. Volume 6: Research. sealing
and cross-cutting issues, established under the thematic strategy for soil protection.
References
69
Van Genuchten, M. T. (1980). A closed-form equation for predicting the hydraulic conductivity of
unsaturated soils. Soil Science Society of America Journal, 44, 892-898.
Várallyay, G., Tóth, G.’ Identifying Risk Areas for Soil degradation in Europe by
Salinisation/Sodification’. In: Eckelmann, W., Baritz, R., Bialousz, S., Bielek, P., Carre, F.,
Houšková, B., Jones, R.J.A., Kibblewhite, M.G., Kozak, J., Le Bas, C., Tóth, G., Tóth, T., Várallyay,
G., Yli Halla, M. & Zupan, M. (2006). Common Criteria for Risk Area Identification according to
Soil Threats. European Soil Bureau Research Report No.20, EUR 22185 EN, 94pp. Office for
Official Publications of the European Communities, Luxembourg.
Ve, N. B., Anh, V. (1990). Soil map of Mekong Delta 1/250.000 scale based on USDA system. Soil
Science Department, Can Tho University and 60B project, Can Tho/Ho Chi Minh city, Vietnam.
Verplancke, H. (2003). Applied soil physics. Lecture notes, Faculty of Agricultural and Applied
Biological Sciences, Department of Soil Management and Soil Care, division Soil Physics, Ghent
University, Belgium.
Vietnam Business Forum (2010). Available at: www.vccinews.com (Accessed: 10 November
2010).
Walkley, A. and Black, I. A. (1934). An examination of Degtjareff method for determining soil
organic matter and a proposed modification of the chromic acid titration method. Soil Science,
37, 29-37.
Wheater, H., Evans, E. (2009). Land use, water management and future flood risks. Land Use
Policy, 26S, 251-264.
Wild, A. (2003). Soils, Land and Food: Managing the land during the twenty-first century.
University Press, Cambridge, 246.
Wildemeersch, J. C. J., Vermang, J., Cornelis, W. M., Diaz, J., Gabriels, D., Ruiz, M.E. (2011).
Tillage erosion and controlling factors in traditional farming systems in Pinar del Río, Cuba. Soil
& Tillage Research. Submitted.
World Commission on Environment and Development. (1987). Our Common Future. Oxford
UNiv. Press, New York.

Appendices
70
APPENDICES
A.1. Individual soil horizon description
Ap (0-20/25 cm): Distinguished by root distribution
This horizon is characterized by very dark grayish brown (10YR 3/2) at field conditions and gray
(10YR 5/1) when dry. The soil texture is clay at this depth. It consists of many yellowish brown
(10YR 5/6) spots, is massive, slightly sticky and plastic, and ripe. At this depth the soil has few
open, tubular, bio-pores (0.5-1.0 mm) with many brown fresh fine roots. In the soil matrix are
few spots of dark decomposed organic matter mixed. The boundary with the next horizon (AB) is
clear and wavy.
AB (20/25-45/55 cm): Recognized by soil matrix color and soil mottling pattern
At this depth the soil is black (5Y 2.5/1) when moist and gray (2.5Y 5/1) when dried. The soil
texture is clay. This horizon exists of 5-10 % brownish orange (2.5YR 3/6) and brown (7.5YR 4/4)
and has distinct, clear fine mottles distributed mainly in soil matrix. The soil feels massive, sticky
and plastic, and ripe. Few open bio-pores (<0.5 mm), few brown fresh roots and few traces of
decomposed organic matter have been found. There is a clear and wavy boundary with horizon
Bg1.
Bg1 (45/55-70/75 cm): Distinguished by soil matrix color and soil structure
Horizon Bg1 is gray (2.5Y 5/1) at field conditions, light gray (2.5Y 7/1) when dried. The soil
texture is clayey. 15-20 % of the soil at this depth is strong brown (7.5YR 5/6) and possesses
distinct, clear fine mottles distributed mainly in soil matrix. The soil feels moderate coarse, sub-
angular blocky, slightly sticky and plastic and is ripe with common, open, fine and vertical
channel bio-pores. The soil exists of very few, fine fresh roots and has a gradual, wavy boundary
to Bg2.
Bg2 (70/75-130 cm): Justified by soil structure and mottling pattern
This depth of the soil is gray (2.5Y 6/1) at field conditions, light gray (5Y 7/1) when dry and the
soil texture is clayey. 10-15 % of the horizon is reddish yellow (7.5YR 6/8) and distinct, clear fine
mottles irregularly mixed in 2-4 % dark yellowish brown (10YR 3/4) are visible. Faint, diffuse
mottles are distributed mainly in the soil matrix and on the surface of peds. The soil is weak,
very coarse prismatic, slightly sticky and plastic, and nearly ripe. Common very fine channel bio-
pores are present and a the horizon has a gradual, wavy boundary to Cg.

Appendices
71
Cg (>130 cm): Recognized by soil matrix color and soil material
This depth is reddish gray (5YR 5/2) when soil is still wet, light brownish gray (10YR 6/2) when
dry and the soil texture is sandy loam. The soil at this depth has no structure, is sticky and non-
plastic, and half ripe. Common, soft, strong brown (7.5YR 3/4) and fine angular, manganese
nodules are present in the soil matrix.