effects of iron solids and bacteria on iron oxidation rates in
TRANSCRIPT

EFFECTS OF IRON SOLIDS AND BACTERIA ON IRON OXIDATION RATES IN MINE DRAINAGE1
Carl S. Kirby and Paul G. Kostak, Jr.
Abstract: Published laboratory rate laws suggest an abiotic homogeneous mechanism, an
abiotic heterogeneous mechanism, and a bacterial-heterogeneous mechanism for aqueous iron
oxidation. This study attempts to groundtruth these laboratory rate laws against rates measured in
the field and from mine drainage brought to the laboratory. Rates of oxidation were measured
with varying pH and ferric oxyhydroxide concentrations.
Figure 1 shows rates from this study compared to other published rates. The addition of low
concentrations of ferric oxyhydroxides from field sites to pH 5.7 and 6 mine water had little effect
on oxidation rates, while it increased the rates at pH 3. At pH 6.5, the abiotic heterogeneous rate
law overestimated the oxidation rate in the field when there is sediment present. At pH 5.7, the
range of measured rates of oxidation fell between the predictions of the abiotic homogeneous and
abiotic heterogeneous rate laws. At pH 3 the rate was very similar to those predicted by the
bacterial-heterogeneous rate law.
Additional Key Words: kinetics, microbial catalysis, heterogeneous catalysis _______________________________ 1Poster was presented at the 2002 National Meeting of the American Society of Mining and
Reclamation, Lexington KY, June 9-13, 2002. Published by ASMR, 3134 Montavesta Rd., Lexington, KY 40502.
2Carl S. Kirby, Associate Professor and Chair, Department of Geology, Bucknell University, Lewisburg PA 17837 Paul G. Kostak, Jr, Assistant Director of Admissions, Avon Old Farms School, 500 Old Farms Road, Avon, CT 06001
1101

no sediment added initiallysediment added initially
This Study
pHhom
ogen
ous r
ate la
w
heterogeneous rate law
bacterial rate law
n = 3Other Studies
Kim, 1968Noike et al., 1983Nordstrom, 1985Williamson et al., 1992Hedin et al., 1994Kirby et al., 1998Dietz and Dempsey, 2002
log
rate
, mol
L-1
s-1
2 3 4 5 6-11
-9
-7
-5
7
Figure 1. Comparison of observed rates to rates predicted by laboratory rate laws. Shaded fields
represent the full range of pH, temperature, initial Fe(II), and initial Fe(III) conditions in
experiments.
Figures 2 and 3 suggest that acidophilic iron-oxidizing bacteria preferentially attach to the
surface of the ferric oxyhydroxides or oxyhydroxysulfates, accelerating the rate of oxidation at
low pH; few non-attached bacteria are found in the water column. The heterogeneous rate may
not be needed to predict the rate of oxidation at pH greater than 5.7 with low concentrations of
ferric oxyhydroxides, but other studies suggest that heterogeneous catalysis is important in this
pH range.
1102

2.5
3
3.5
4
pH
0 1000 2000 3000 4000 5000Time, min
150
200
250
0 1000 2000 3000 4000 5000Time, min
BR 34 - sediment present initiallyBR 32 - no sediment initially
0
50
100
150
200
250
BR 33; sedimentpresent initially
BR 31; nosediment initially
Sodium benzoate added to BR 32 and 34
a
b
0
9 x 10⁻⁹
1 x 10-82 x 10-8
3 x 10⁻⁸
2 x 10⁻⁹sedimentbecomesvisible
Fe(II) begins tobecome exhausted
Con
cent
ratio
n Fe
(II)
, mg
L-1
Figure 2. Results from longer-term iron oxidation experiments. Rates for line segments are in
mol L-1 s-1.
1103

a
10 µm
Figu
and
grai
“dea
min
Die
plain
b
“live” bacillus“dead” bacillus
10 µmUV light
re 3. Photomicrographs of sediment from Figure 2 experiments (pH ≈ 3.9) in a) plain light,
b) UV light. Sediment was composed of schwertmannite and goethite. The outline of two
ns are shown in white for reference. Mineral surfaces hosted abundant “live” (green) and
d” (red) bacilli. Note the absence of iron-oxidizing bacilli in the water surrounding the
eral grains, suggesting preferential attachment of bacilli to solid surfaces.
Literature Cited
tz, J. M. and B.A. Dempsey. 2002. Innovative treatment of alkaline mine drainage using
recirculated iron oxides in a complete mix reactor. In Proceedings of the National Meeting
of the American Society of Mining and Reclamation, Lexington KY, June 9-13.
1104

1105
Hedin R. S.; R..W. Nairn and R.L.P. Kleinmann. 1994. Passive Treatment of Coal Mine
Drainage, U.S. Bur. Mines Info. Circ. No. 9389, U.S Dept. Interior.
Kim, A.G. 1968. An experimental study of ferrous iron oxidation in acid mine water.
Proceedings of 2nd Symposium on Coal Mine Drainage Research, Pittsburgh, PA.
Kirby, C. S. and J.A. Elder Brady. 1998. Field determination of Fe2+ oxidation rates in acid
mine drainage using a continuously-stirred tank reactor. Appl. Geochem. 13, 4, 509-520.
Noike, T., Kanj, N. and M. Jun’ichiro. 1983. Oxidation of ferrous iron by acidophilic iron-
oxidizing bacteria from a stream receiving acid mine drainage. Water Research. 17, 21-27.
Nordstrom, D. K., 1985. The rate of ferrous iron oxidation in a stream receiving acid mine
effluent. In Selected Papers in the Hydrologic Sciences, U.S. Geological Survey Water
Supply Paper 2270. Washington D.C., 113-119.
Williamson M. A., C.S. Kirby and J.D. Rimstidt. 1992. The kinetics of acid mine drainage. In
Program and Abstracts, V. M. Goldschmidt Conference, Reston VA.

1106
EFFECTS OF IRON SOLIDS AND BACTERIA ON IRON OXIDATION RATES IN MINE DRAINAGE
Carl S. Kirby* and Paul G. Kostak, Jr.**
*Associate Professor and Chair, Department of Geology, Bucknell University, Lewisburg PA 17837
**Paul G. Kostak, Jr, Assistant Director of Admissions, Avon Old Farms School, 500 Old Farms Road, Avon, CT 06001
Presented as a poster at American Society for Mining & Reclamation Conference, Lexington, KY
June 9-13, 2002

1107
ABSTRACT
Published laboratory rate laws suggest an abiotic homogeneous mechanism, an abiotic heterogeneous mechanism, and a bacterial-heterogeneous mechanism for aqueous iron oxidation. This study attempts to groundtruth these laboratory rate laws against rates measured in the field and from mine drainage brought to the laboratory. Rates of oxidation were measured with varying pH and ferric oxyhydroxide concentrations.
The addition of low concentrations of ferric oxyhydroxides from field sites to pH 5.7 and 6 mine water had little effect on oxidation rates, while it increased the rates at pH 3. At pH 6.5, the abiotic heterogeneous rate law overestimated the oxidation rate in the field when there is sediment present. At pH 5.7, the range of measured rates of oxidation fell between the predictions of the abiotic homogeneous and abiotic heterogeneous rate laws. At pH 3 the rate was very similar to those predicted by the bacterial-heterogeneous rate law.
Data from this study suggest that acidophilic iron-oxidizing bacteria preferentially attach to the surface of the ferric oxyhydroxides or oxyhydroxysulfates, accelerating the rate of oxidation at low pH; few non-attached bacteria are found in the water column. The heterogeneous rate may not be needed to predict the rate of oxidation at pH greater than 5.7 with low concentrations of ferric oxyhydroxides, but other studies suggest that heterogeneous catalysis is important in this pH range.
1108
Acid mine drainage (AMD) is an important environmental issue worldwide. AMD is the result of the oxidation of pyrite and ferrous iron (1) and the precipitation of solid ferric hydroxide (2). The series of reactions that lead to AMD are usually given as
FeS2, s + H2O + 7/2O2 = Fe2+ + 2SO42- + 2H+, (1)
Fe2+ + 0.25 O2 + H+ = Fe3+ + 0.5 H2O, (2)Fe3+ + 3H2O = Fe(OH)3, s + 3H+. (3)
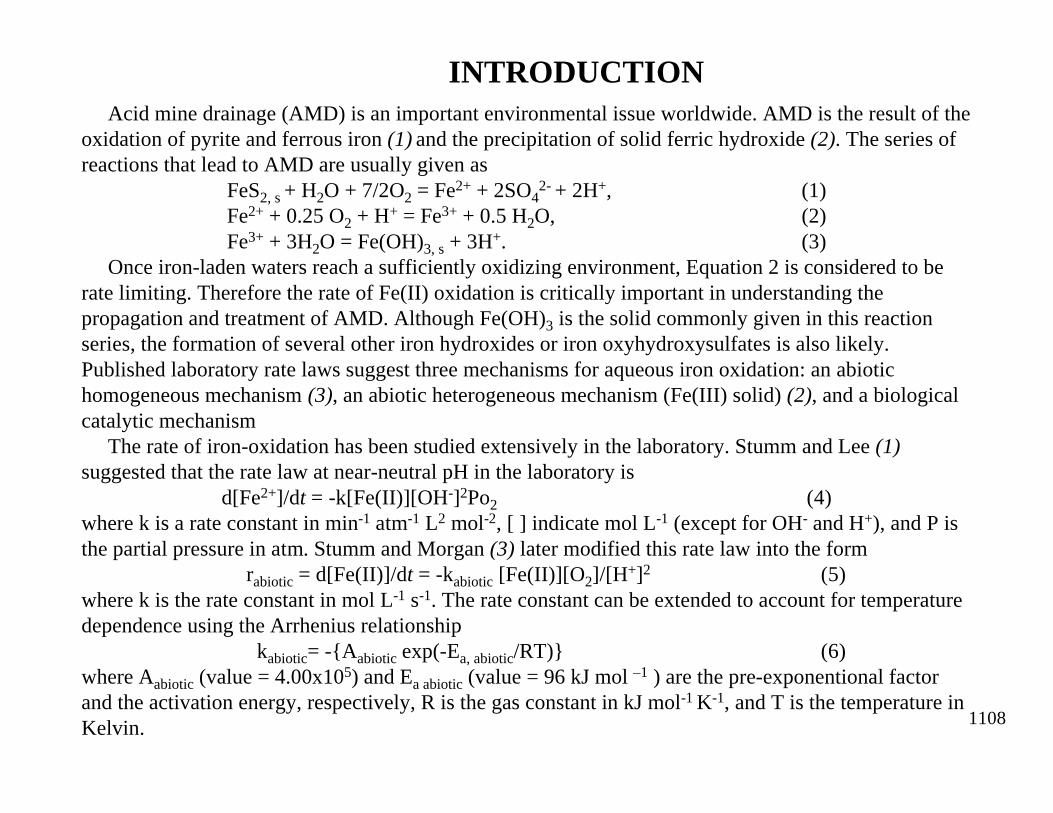
Once iron-laden waters reach a sufficiently oxidizing environment, Equation 2 is considered to be rate limiting. Therefore the rate of Fe(II) oxidation is critically important in understanding the propagation and treatment of AMD. Although Fe(OH)3 is the solid commonly given in this reaction series, the formation of several other iron hydroxides or iron oxyhydroxysulfates is also likely. Published laboratory rate laws suggest three mechanisms for aqueous iron oxidation: an abiotichomogeneous mechanism (3), an abiotic heterogeneous mechanism (Fe(III) solid) (2), and a biological catalytic mechanism
The rate of iron-oxidation has been studied extensively in the laboratory. Stumm and Lee (1)suggested that the rate law at near-neutral pH in the laboratory is
d[Fe2+]/dt = -k[Fe(II)][OH-]2Po2 (4)where k is a rate constant in min-1 atm-1 L2 mol-2, [ ] indicate mol L-1 (except for OH- and H+), and P is the partial pressure in atm. Stumm and Morgan (3) later modified this rate law into the form
rabiotic = d[Fe(II)]/dt = -kabiotic [Fe(II)][O2]/[H+]2 (5)where k is the rate constant in mol L-1 s-1. The rate constant can be extended to account for temperature dependence using the Arrhenius relationship
kabiotic= -{Aabiotic exp(-Ea, abiotic/RT)} (6)where Aabiotic (value = 4.00x10⁵) and Ea abiotic (value = 96 kJ mol –1 ) are the pre-exponentional factor and the activation energy, respectively, R is the gas constant in kJ mol-1 K-1, and T is the temperature in Kelvin.
INTRODUCTION

1109
Tamura et al. (2) reported that the rate law for iron oxidation depends on the amount of Fe(III) solid that is present and gave the rate law as
d[Fe(II)]/dt = [Fe(II)](ko[O2][OH-]2 + ks,o[O2]K[Fe(III)]/[H+]) (7)where the first term is the homogeneous component, and the second term is the heterogeneous component, which takes into account the concentration of Fe(III) solids. In this rate law, ko ≈ kabiotic
25°C,ks,o = 73 M-1 s-1, and K is an equilibrium constant (value = 1.41x10⁻⁵) for the adsorption of Fe(II) onto Fe(III) hydroxide, and [ ] indicates aqueous concentration in mol L-1 . No temperature dependence is reported for this rate law.
Pesic et al. (4) developed a parallel biological rate law, which included the influence of T.ferrooxidans is given as
d[Fe(II)]/dt = -kbioCbact[H+][Fe(II)][O2] (8)= -{Abiotic exp(-Ea, biotic/RT)}Cbact[Fe(II)][O2][H+] (9)
where k is the rate constant in L3 mg -1 mol -2 s-1, Cbact is the concentration of T. ferrooxidans in mg L-1, and [ ] indicates aqueous concentration in mol L-1. Ea, bio (value = 58.77 kJ mol –1) is the activation energy, R is the gas constant in kJ mol-1 K-1, and T is the temperature in Kelvin. Abiotic is reported as 1.62x10¹¹ in (4), but it has been modified for this study as in Kirby et al. (5) to a value of 1.02x10⁹ due to a mathematical mistake in the original reference.
Several rate laws invoke bacterial kinetics (e.g., 6,7,8,9). Other published laboratory rate laws show dependence on other variables such as organic acids and light intensity; for a list and references see Table 1 in (10). Published rates for iron oxidation in AMD in the field or for waters taken from the field include (10-17).

1110
This workThis research compares three laboratory rate laws to rates measured in solutions
or suspensions (including field sediments and bacteria) collected in the field. It is hypothesized that at low pH values iron-oxidizing bacteria, likely Thiobacillus ferrooxidans, act as significant biocatalysts primarily while attached to ferric iron hydroxide particles rather than while suspended unattached in the water column. It is also hypothesized that ferric iron hydroxide particles have a catalytic effect on the rate of oxidation at circumneutral pH (2,5,16). The goal is to examine the effects of pH, iron-oxidizing bacteria (both suspended and those attached to ferric hydroxide), and ferric hydroxide itself on these rates.

1111
Research SitesThree field sites:
1) Southwestern Virginia: A discharge from a massive sulfide deposit in the Great Gossan Lead district. The drainage comes from a pit that was filled with mine spoil amended with limestone in an unsuccessful attempt to raise the pH and keep the ferric hydroxide from precipitating. The pH drops from 6 to 3 in 75 meters; Fe(II) ˜ 220 mg L-1.
2) Shamokin, Pennsylvania: Untreated discharge in the Anthracite coal region of central PA. The pH is ˜ 5.7; Fe(II) ˜ 67 mg L-1.
2) Ravine, Pennsylvania: Untreated discharge in the Anthracite coal region of central PA. The pH is ˜ 3.8; Fe(II) ˜ 220 mg L-1.
METHODS
ExperimentalAll samples were collected in the field, and the rate experiments were conducted both in the field and laboratory; Figure1 shows a field setup. Data for seven field and eight laboratory (see Table 1) experiments are reported, although several other preliminary experiments were conducted. Upon arrival at the laboratory the water was brought to room temperature to limit the change in temperature during the experiment. About 2L water was collected from discharges, placed in high-density polyethylene (HDPE) batch reactors, and oxygen was introduced (such that 8.3 = DO = 7.5 mg L-1) by agitation. All reactors were continuously stirred with a known mass of in-situ iron oxide added to selected reactors. 50 mg sodium benzoate was added to selected reactors (see Table 1) to inhibit bacterial catalysis (18). For longer-term experiments (BR 31-34), the reaction vessel was fitted with a lid to prevent evaporation, and air was bubbled into the headspace. A multiparameter meter was used to measure temperature, pH, and dissolved oxygen; the same parameters measured in the field were measured in the laboratory. All parameters were recorded for times up to at least forty minutes; BR 31-34 were run for 4950 minutes (3.4 days).

1112
Figure 1. Water (± iron oxides and bacteria) for all experiments was collected in the field. Some oxidation experiments were conducted in the field as shown, and some were conducted in the lab soon after transport. DO, pH, and T were measured with a YSI multimeter (shown). Most experiments were less than one hour duration (with the exception of BR 31-34). No sediments were added to the experiments shown here.
Field iron oxidation experiments

1113
Experimental, continuedFe(II)
The concentration of dissolved Fe(II) was determined in the laboratory using a spectrophotometer and 1,10 phenanthroline and ammonium acetate reagents (19). The samples were filtered with 0.02 µm filters to prevent any bacterial oxidation while in transport. Immediately after collection, all samples were acidified (HCl). The preservation of samples was tested by filtering samples in the field, measuring the absorbance, transporting the same samples to the lab, and measuring the absorbance again in the laboratory.Sediments
Local subaqueous iron oxide sediments were collected from the discharges in an HDPE container before introduction into reactor vessels. A known volume of the stirred suspension was filtered through a dried and weighed 0.45 µm membrane filter to find the concentration of ferric hydroxides.
Suspensions of sediment samples for X-ray diffraction (XRD) analysis were centrifuged briefly at approximately 4000 rpm and the supernatant discarded. Samples were then rinsed with distilleddeionized water, centrifuged, and the supernatant discarded. The remaining suspensions were oven-dried at 40 °C overnight. Samples were either placed in a packed powder mount or mixed in acetone slurry and mounted on a low-background quartz plate if insufficient sample was available. Thediffractometer was operated at 30kV and 15 mA from 5 to 80° 2Θ with a 0.05 ° step size and 15 s/step counting times. Long counting times were necessary to identify the poorly crystalline mineralschwertmannite, which was undetectable in short scans. Minerals were identified based on visual comparison of patterns to standard JCPDS data (20). Schwertmannite was identified by comparison to published d-spacings. (21)

1114
Experimental, continuedObservation of bacteria
Selected suspensions of sediment samples were stained using L-13152 Live/Dead® BacLight™ two-color fluorescence stain kit by Molecular Probes according to the manufacturer's instructions; Southam (22, pers. comm.) recommended this approach. Suspensions were viewed on a glass slide with a cover slip. "Live" bacteria (those with uncompromised membranes) fluoresce green under UV light; "dead" bacteria (those with compromised membranes) fluoresce red under UV light. The dual band filter set on the microscope included 465-495 and 540-580 nm extinction filters, 505 and 595 nmdichromic mirrors, and 515-555 and 600-660 nm band pass emission (barrier) filters.
Analysis of DataTo compare the published homogeneous rate law with the field measured rates, the temperature and
dissolved oxygen measurements were averaged, the initial Fe(II) measured, and the rate constant for the average temperature for each experiment was calculated. All of these parameters were entered into Equation 5 to find the predicted abiotic homogeneous rate. The comparison for the bacterial rate law (Equation 9) was done similarly, but in addition, the concentration of bacteria was assumed to be 150 mg L-1; see (6) for a discussion of this choice. For the heterogeneous rate law (Equation 7), dissolved oxygen was averaged, initial Fe(II) was measured, the rate constants (25 °C) were calculated. Initial Fe(III) was entered assuming that all of the sediment mass added was Fe(OH)3. These predictions were then plotted against pH and compared to measured rates. With the exception of BR 31 and 33, measured rates were calculated using all data points in the initial rate method. Rates for BR 31 and 33 are discussed later.

1115
Table 1. Conditions and results for batch reactor experiments. T is temperature; DO is dissolved oxygen; dissolved iron concentrations are in mg L-1. T, pH, and DO are average values. Uncertainties are 1 σ values for the slopes of initial rates.
Samp BR Total T, DO, Initial Initial Rate Log Sodiumfrom Where Exp # Time, min pH °C mg/L Fe(II) Fe(III) mol/(L*s) Rate Benzoate
Virginia Field 6 45 2.98 27.4 6.1 97 0 1.9 ± 0.7 x 10⁻⁸ -7.7 NoShamokin Field 7 42 5.57 16.7 5.1 67 0 4 ± 3 x 10⁻⁹ -8.4 NoShamokin Field 8 45 5.87 17.5 7.8 67 unknown 7 ± 3 x 10⁻⁹ -8.2 NoShamokin Field 9 45 5.54 17.0 5.2 67 unknown 8 ± 3 x 10⁻⁹ -8.1 NoShamokin Lab 10 80 5.74 16.5 7.5 66 0 10 ± 1 x 10⁻⁹ -8.0 NoShamokin Lab 11 50 5.77 16.8 7.8 65 10 7.3 ± 0.8 x 10⁻⁹ -8.1 NoShamokin Lab 12 50 5.77 18.4 7.6 64 18 7.6 ± 0.7 x 10⁻⁹ -8.1 NoShamokin Lab 13 45 5.73 19.2 7.5 63 38 8.0 ± 0.6 x 10⁻⁹ -8.1 NoVirginia Field 14 41 6.26 16.1 7.0 229 0 4 ± 2 x 10⁻⁸ -7.4 NoVirginia Field 15 40 6.20 16.8 6.3 221 12 5 ± 3 x 10⁻⁸ -7.3 NoVirginia Field 17 20 3.12 18.8 8.0 157 41 4 ± 1 x 10⁻⁸ -7.4 NoRavine Lab 31 4950 *3.8→2.6 26.6 8.3 228 0 * Š 2 x 10⁻⁸ < -7.5 NoRavine Lab 32 4950 3.8-3.9 26.6 7.6 226 0 0 YesRavine Lab 33 4950 *3.8→2.9 23.8 8.0 218 25 * Š 3 x 10⁻⁸ <-7.5 NoRavine Lab 34 4950 3.7-4.1 23.8 8.2 224 25 0 Yes
* Rates and pH varied during BR 32 and 34 experiments. The pH decreased due to hydrolysis of Fe(III). Rate increases in BR 32 and 34 are attributed to increase in bacterial populations associated with sediment formation; see Figure 7.
1116
RESULTS AND DISCUSSIONSediment Examination
Figure 2 shows that the sediment from Shamokin, PA were almost entirely comprised of bacteria morphologically consistent with Gallionella ferruginea, which were partially coated by iron oxides. Figures 3a and 3b show the Shamokin sediment in plain light and under ultraviolet light, respectively. The Gallionella did not fluoresce, and very few bacilli were found attached to the Gallionella or in the water column.
Two distinct sediments were found at the Ravine site. The downstream sediment was a loose orangefloc that had few bacilli attached or in the water column. The upstream sediment (Figure 3a) was a mixture of a dark, red-brown subaerial crust and an orange floc found on the subaqueous substrates. Figure 4b shows the upstream sediment under fluorescent light; it was heavily coated with both “live” and “dead” attached bacilli, presumably Thiobacillus ferroxidans. There were very few bacilli present in the water column.
The upstream Ravine, PA sediment (See Figure 4) containing schwertmannite, quartz, and goethite was added to BR 33 and 34. The crystalline iron oxides that formed upon iron oxidation in BR 31 and 33 were primarily schwertmannite. Examination of suspensions of the original sediment and sediments from BR 31, 33, and 34 showed that bacilli (presumably T. ferrooxidans) were clearly preferentially attached to particle surfaces. Very few live or dead bacilli were found in the water surrounding particles. A biofilm that formed interference patterns on the water surface in BR 31 and BR 33 was sampled directly. Numerous bacilli and iron hydroxides were attached to the flat amber particles that formed the biofilm. Both "live" and "dead" bacilli were found in BR 34 sediments, suggesting that sodium benzoate did not necessarily kill bacteria, but rather inhibited bacterial catalysis.

1117
10 µm
10 µm
10 µm
Figure 2. Sediment from Shamokin PA site (pH ˜ 5.7) was almost entirely composed of stalked bacteria morphologically consistent withGallionella ferruginea (based on photographs in 23), which were coated with iron oxides.plain light
plainlight
UVlight
Figure 3. Single stalked bacteria from Shamokin PA site in plain light and UV light. Green arrow points to “live” bacillus; red arrow points to “dead” bacillus. Few live or dead bacilli were found in the sediments from this pH 5.7 water.
Addition of such sediment made no measureable difference in iron oxidation rates in the pH 5.7 range
Sediments from pH 5.7 (Ravine PA ) site

1118
Figure 4. Photomicrograph of sediment from Ravine PA site (pH ˜ 3.9) in a) plain light and b) UV light.
The sediment was composed of schwertmannite and goethite. Mineral surfaces hosted abundant “live” (green) and “dead” (red) bacilli. The outline of two grains are shown in white for reference.
Note the absence of iron-oxidizing bacilli in the water surrounding the mineral grains, suggesting preferential attachment of bacilli to solid surfaces.
plain light 10 µm
UV light 10 µm
“dead” bacillus“live” bacillus
a
b
Bacilli prefer iron oxide surface to water in low-pH suspensions

1119
Ehrlich (24) discusses the geomicrobiology of iron and the role of and occurrence of T.ferrooxidans as part of a consortium of several bacteria, but T. ferrooxidans appears to be the primary biological catalyst in these consortia. In a significant exception to this rule, Leptospirillum ferrooxidans have been found to be important (25 and references therein) in very low pH settings. A new iron-oxidizing Archeon was also found in very low pH settings (26).
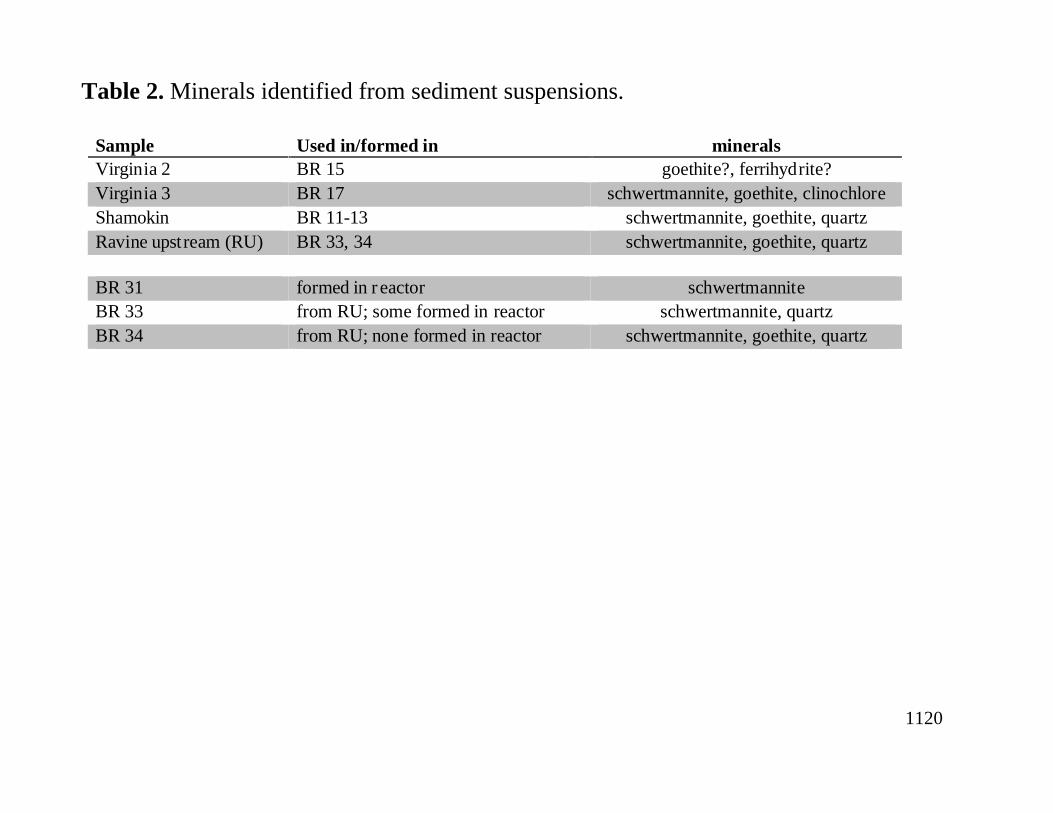
Initial one-hour XRD analyses of sediments showed few peaks. Six-hour runs produced much better defined peaks, especially for schwertmannite. Table 2 lists the minerals identified from field sediments used in reactors and sediments collected from batch reactors BR 31, 33, and 34 at the end of each run.The use of XRD for phase identification in mine drainage sediments is inexact because 1) the quantity of each phase cannot be determined without either spiking or crystal structure refinement modeling, 2) the presence of X-ray amorphous phases may be missed, 3) many freshly precipitated phases exhibit poor crystallinity, and 4) many iron oxide phases have peaks that overlap with each other and other minerals. In particular, it is difficult to distinguish ferrihydrite and schwertmannite from goethite. In many literature references, the subaqueous sediments associated with mine drainage are referred to as "amorphous iron hydroxides, " although jarosite, goethite, and ferrihydrite are sometimes mentioned. There are numerous iron solid phases and many of them are crystalline. For example, poorly crystalline schwertmannite is a common mine drainage mineral (22). The particular solid phase present is dependent on sediment age and water chemistry.
The Virginia sediments varied downstream due to the pH decrease from 6 to 3 within a 70-mflowpath. The upstream sediment (VA2; used in BR 15) contained ferrihydrite and goethite. The downstream sediments (VA3; in BR 17) were primarily goethite and possibly schwertmannite. The mineral clinochlore identified in VA3 was likely detrital. The mine discharge is located adjacent to a tailings pile, and chlorite group minerals have been identified in the schist that hosts the ore body (27). Bacterial populations were not examined in the Virginia sediments.
1120
Table 2. Minerals identified from sediment suspensions.
Sample Used in/formed in mineralsVirginia 2 BR 15 goethite?, ferrihydrite?Virginia 3 BR 17 schwertmannite, goethite, clinochloreShamokin BR 11-13 schwertmannite, goethite, quartzRavine upstream (RU) BR 33, 34 schwertmannite, goethite, quartz
BR 31 formed in r eactor schwertmanniteBR 33 from RU; some formed in reactor schwertmannite, quartzBR 34 from RU; none formed in reactor schwertmannite, goethite, quartz

1121
Rates at pH 5.7 to 6.2: The influence of iron oxyhydroxides.Table 1 shows the average experimental conditions and rates measured from field solutions. Figure
5 compares measured rates from this study and others to rates predicted by the three laboratory rate laws. Note that there are few measured rates for pH values between 4 and 5.6. Few mine waters fall in this pH range (28) for a combination of reasons. Buffering capacity in this pH range is low (29). As microbial iron oxidation proceeds, Fe(III) concentrations increase and Fe(III) hydrolysis causes pH to decrease. The pH values of solutions below pH 4 are probably controlled by the available concentrations of iron and other metals and equilibrium with respect to metal oxyhydroxides.
Williamson et al. (17) give field rates of > 10-7 mol L-1 s-1 for pH 3.7 to 5.7. These rates are significantly faster than the few other published rates and to predicted rates for this pH range (see Fig. 4).The data from BR 14 and 15 shown in Figure 5 suggest that the homogeneous rate law predicts the field rate well at a pH of approximately 6.2 while the heterogeneous rate law overestimates the field rate significantly and may not be needed to predict the field rate of oxidation in systems with low Fe(III) solid concentrations.
Between pH 5.7 and 6, rates from this study (BR 7-13) fall between the predicted homogeneous and heterogeneous rate laws. In some cases the addition of sediment had no effect while other reactors appear to show an increase in the rate with the presence of sediment. Based on our data and our analysis alone, it appears that the heterogeneous rate law overestimates the rate. Neither inorganic sediments nor the presence of bacteria morphologically consistent with Gallionella ferrugineaincreased oxidation rates significantly in samples with pH greater than 5.7. Although G. ferrugineaapparently comprised much of the "sediment" added to BR 11-13, these iron-oxidizing bacteria do not appear to have significantly increased oxidation rates over the predicted homogenous rate atcircumneutral pH values (see Figure 5). Indeed, reactors with higher amounts of this "sediment" produced slightly slower oxidation than samples with no added sediment (see Table 1). Significant catalysis of iron oxidation by G. ferruginea has not been conclusively demonstrated (24,30). However, the discussion below suggests that the abiotic heterogeneous rates likely are significant in some cases.

1122
no sediment added initiallysediment added initially
This Study
pHho
mogen
ous r
ate la
w
heterogeneous ra
te law
bacterial rate law
n = 3
Other Studies(12) highest rate(14) ranges shown(11) ranges shown(17)(13)(10) "ambient" rates only(16) rates increase withincreasing Fe(III) solid
log
rate
, mol
L-1
s-1
2 3 4 5 6 7-11
-9
-7
-5
Figure 5. Comparison of observed rates to rates predicted by laboratory rate laws. Shaded fields represent the full range of pH, temperature, initial Fe(II), and initial Fe(III) conditions in experiments. Arrows indicate pH-path for BR 31 and BR33 experiments over approximately 3 days. The other experiments in this study were of approximately 0.75-1.0 hour duration.Although heterogeneous iron oxidation was not predominant at pH > 5.7 in this study, Dietz and Dempsey (triangesl in this figure, 16) demonstrated signficant heterogeneous catalysis in the pH range at higher Fe(III) solid concentration than employed in this study. We do not speculate as to why the Williamson et al. (17) data do not correspond to other rate measurements.
Comparison of iron oxidation rates to lab-rate law predictions

1123
Rates at pH 5.7 to 6.2: The influence of iron oxyhydroxides, continuedIt is important to note that one component of the abiotic heterogeneous rate law (2) is a modified
version of the homogeneous rate law (3). In theory, the heterogeneous rate should equal the homogeneous rate when there is no sediment present. There will be increasingly large errors as field temperatures diverge from 25°C in the prediction of the heterogeneous rate law because of the lack of a temperature dependence reported in (2).
In solutions with up to 25 mg L-1 Fe(II), catalysis by amorphous Fe(III) solids is reported (2) at pH values between 6 and 7. Sung and Morgan (30) use the rate law from (2) , but they claim thatautocatalysis by Fe(III) solids is only noticeable for approximately pH 7 and greater. This observation seems contrary to the predicted heterogeneous rate law in Figure 5, which shows increasingautocatalytic rates with decreasing pH. Sung and Morgan (30) suggest that the Fe(III) solid surfaces forms slowly below pH 7, inhibiting adsorption of Fe(II) and autocatalysis. In solutions from pH 2.8 to 6.4 and with Fe(II) up to 240 mg L-1, Kirby et al. (5) were able to model iron oxidation rates in several passive mine drainage treatment systems using Equations 9 and 5 without calling upon heterogeneous catalysis.
In contrast, Dempsey et al. (15) suggest that heterogeneous catalysis accounts for 60 to 90 % percent of the iron oxidation in two passive mine drainage treatment systems, including one system examined in (6). Dietz and Dempsey (16) provide convincing evidence (see triangles in Fig. 4) of significant catalysis by iron oxide solids, especially at higher iron oxide concentrations, in a large scale field reactor. It seems likely that iron oxide catalysis does indeed occur and that it increases with increasing Fe(III) solid concentration. Our experiments had relatively low Fe(III) concentrations, making the heterogeneous rate contribution difficult to measure. Because the heterogeneous catalysis mechanism requires adsorption of Fe(II) to an Fe(III) surface, it is important to note that there are numerous Fe(III) hydroxides that form in mine drainage, and these solids will have different surface properties which are likely pH-dependent.

1124
Rates at pH 5.7 to 6.2: The influence of iron oxyhydroxides, continuedRecirculation of iron hydroxide solids for improved treatment is a relatively common practice in
active mine drainage treatment systems. For example, such a system operated by the Pennsylvania Department of Environmental Protection recirculates sludge from a thickener (late-stage clarifier) back to the first mixing unit; they observe increased sludge settling due to the recirculation at circumneutralpH (31). Recirculation likely increases iron oxidation rates, but this assertion has not been documented to our knowledge for active treatment. The work of Dietz and Dempsey (triangles in Figure 5 this study, 16) suggests that iron oxidation rates in passive treatment can be increased by increasing the concentration of Fe(III) solids.
Rates at pH 2.7 to 3.8: Influence of iron oxyhydroxides and bacteriaRates from BR 6 and 17 plot on or below predicted bacterial rates in Figure 5. Rates from (10,13)
were much lower than predicted rates, as were most rates from (12). The discussion below suggests that these slower rates may have been measured because of a lag time before bacterial and ironoxyhydroxide growth would have increased iron oxidation rates as seen in BR 31 and 33.
In preliminary short-term experiments using non-turbid water from the Virginia and Ravine, PA sites, no iron oxidation was measurable. However, after two days, reactors without sodium benzoate were coated with schwertmannite, indicating that iron oxidation rates accelerated as bacterial populations and iron oxyhydroxide concentrations increased. These results suggested that the oxidation observed in the streams occurred due to catalysis by bacteria inhabiting the surfaces of ironoxyhydroxides present on the stream bottom.
Figure 6 shows the experimental setup and visible results for the 3.5 day BR 31-34 experiments. Figure 7 shows that rates increased with time for BR 31 and 33. Sediment concentrations, pH, and oxidation rates changed during these experiments, thus rates were calculated as the slopes of selected time intervals in Figure 7. Regardless of whether sediments were initially present or not, sodium benzoate effectively stopped microbial oxidation of Fe(II) (see Figure 7b).

1125
Figure 6. Experiments 31-34 at end of 3.5-day experiment. Water from the Ravine PA site was transported to the lab. Lids and aeration system are not shown. Reactors are labeled with initial conditions; pH ranged from 2.7-4.1 (see Table 1 and Figure 5). See Figure 7 for Fe(II) concentration versus time data..
Ø No iron oxidation in reactors with sodium benzoate (BR 32, 34); final color same as initial color.Ø Iron oxidation was rapid early in BR 33 due to added sediment (plus bacteria).Ø Iron oxidation was initially slow in BR 31 until iron oxides formed and presumably bacterial population growth increased.
BR 31:228 mg Fe(II)/LDO = 8.3Fe(III) = 0 mg/LNo bactericide
BR 32:226 mg Fe(II)/LDO = 7.6Fe(III) = 0 mg/LBactericide added
BR 34:224 mg Fe(II)/LDO = 8.2Fe(III) = 25 mg/LBactericide added
BR 33:228 mg Fe(II)/LDO = 8.0Fe(III) = 25 mg/LNo bactericide
Lab iron oxidation experiments using water ± sediments from the field

1126
2.5
3
3.5
4
pH
0 1000 2000 3000 4000 5000Time, min
150
200
250
0 1000 2000 3000 4000 5000
Time, min
BR 34 - sediment present initiallyBR 32 - no sediment initially
0
50
100
150
200
250
Con
cent
rati
on F
e(II
), m
g L
-1
BR 33; sedimentpresent initially
BR 31; nosediment initially
Sodium benzoate added to BR 32 and 34
a
b
0
9 x 10⁻⁹
1 x 10⁻⁸
2 x 10⁻⁸
3 x 10⁻⁸
2 x 10⁻⁹sedimentbecomesvisible
Fe(II) begins tobecome exhausted
Figure 7. Results from longer term BR31 through BR34 experiments. Rates for line segments are in mol L-1 s-1.
a) Iron oxidation rate started out slow in BR 31 until iron oxides formed and (presumably) bacterial population increases. Iron oxidation rate started out rapid in BR 33 (with sediment and bacteria added initially); rate slowed when Fe(II) was nearly exhausted. The pH decreased in BR 31 and 33 as iron oxide precipitation occurred.
b) b) No iron oxidation was observed in reactors with sodium benzoate (BR 32, 34).
Lab iron oxidation rates using water ± sediments from the field

1127
Rates at pH 2.7 to 3.8: Influence of iron oxyhydroxides and bacteria, continuedFigure 7a shows duplicate measurements for all except two time intervals. In BR 31 and BR 33,
oxidation rates were initially too slow to measure. The samples were collected from a discharge at 3 °C with low dissolved oxygen. Water and sediments were warmed to room temperature, and the water was oxygenated before measurements began. These changes may have "shocked" iron-oxidizing bacteria (32). It is also likely that bacterial populations in the discharge were low because samples were collected in the winter. In BR 31, schwertmannite began to become visible between 1500 and 2800 minutes, providing a surface for iron-oxidizing bacteria to attach to. The oxidation rate became measurable and then increased to 2 x 10⁻⁸ mol L-1 s-1. The pH initially decreased more slowly in BR 31 than in BR 33. Having a "head start" due to added sediment and bacteria, the rate in BR 33 was always more rapid than in BR 31 except when Fe(II) was nearly exhausted. The increases in oxidation rates with time are likely due to increasing populations of attached iron-oxidizing bacteria, aided by pH decrease during the experiments. Although Fe(II) oxidation consumes H+, the pH decrease was driven by Fe(III) hydrolysis and schwertmannite precipitation. The data for BR 31 and 33 are very similar to other experiments (11,12) and can be explained by microbial growth kinetics and substrate [Fe(II))] exhaustion.
Figure 5 shows that at a pH of approximately 3, the bacterial rate law predicts the rate measured using the batch reactors in the field relatively well. The relatively small difference in predicted and measured rates could be due to the fact that a single concentration (150 mg L-1) of bacteria was assumed for the prediction. Southam (20) suggests that no satisfactory method for counting active T.ferrooxidans has been developed. Another likely reason for discrepancies between measured and predicted rates is the dynamic nature of microbial populations.

1128
Rates at pH 2.7 to 3.8: Influence of iron oxyhydroxides and bacteria, continuedThe results from BR 31-34 (and several preliminary experiments for which rates are not presented
here) combined with the association of bacteria with iron oxyhydroxide solids shown in Figure 4b suggest that the iron-oxidizing bacteria that are responsible for accelerated oxidation rates preferentially populate iron oxyhydroxide surfaces over the water between particles. Experiments at lower pH values to which no sediments were added showed slower oxidation rates (until sediments formed during the experiment) than experiments with added sediment. T. ferrooxidans have been shown to "hold tenaciously" to ferric sulfate or hydrated ferric oxides in the laboratory (33). The addition of a bacterial inhibitor, whether sediments were present or not, stopped iron oxidation.
Several different iron oxyhydroxides, jarosite, and schwertmannite can provide surface sites to which bacteria can attach, but we know of no studies of the affinities of these bacteria and minerals for each other. By analogy, the attachment of T. ferrooxidans to sulfide mineral surfaces in governed by both surface site properties of the mineral and by the lipopolysaccharide on the outer membrane surface, and this attachment can be quite strong (34 and references therein). Iron oxyhydroxides that are coating pyrite surfaces may facilitate bacterial attachment to pyrite that is undergoing oxidation (34 and references therein). Similarly it is likely that the surface properties of both bacteria and oxide minerals govern the affinities of iron-oxidizing bacteria for iron-bearing solid surfaces such as goethite, schwertmannite, ferrihydrite, and jarosite.
Iron oxyhydroxide solids may not be absolutely required for microbial catalysis. Wakao et al. (35)observed rapid field iron oxidation at pH near 2 due to T. ferrooxidans held in gelatinous streamers; visible iron oxides were absent. Grishin and Tuovinen (36) observed rapid oxidation in the laboratory at pH near 1.4 due to T. ferrooxidans sorbed to three types of synthetic biomass support particles (BSP) with minor amounts of jarosite formed. However, Nemati and Webb (37) note that ferric iron solids are an effective sorbent for bacteria and may accelerate the adsorption onto BSP's. It is clear that T. ferrooxidans prefer some organic or inorganic matrix to reside on. Nyavor et al. (38) also note inhibition of bacterial iron oxidation at high dissolved ferric iron concentrations.

1129
Rates at pH 2.7 to 3.8: Influence of iron oxyhydroxides and bacteria, continuedOne of the implications of this study is that prediction of iron oxidation rates using a term for the
concentration of bacteria can be difficult. The population of bacteria in water that is not turbid will likely be much lower than populations attached to bed surfaces. If waters are turbid due to suspended iron oxides, the prediction of field oxidation rates from a bacterial rate may be more realistic. Accurate enumeration of active T. Ferrooxidans is quite difficult. Additionally, bacterial populations are dynamic and dependent upon nutrients and other environmental factors. Due to the complexity of the field setting, a generally applicable rate law for microbial iron oxidation may continue to prove elusive.

1130
ACKNOWLEDGMENTSMany of the ideas in this study came out of conversations with others including Don Rimstidt, Mark Williamson, and Gordon Southam. The Program for Undergraduate Research at Bucknell, Pennsylvania Aggregate and Concrete Association Scholarship, and the Marchand Fund in the Department of Geology at Bucknell University supported Paul Kostak in this project.
LITERATURE CITED(1) Stumm, W.; Lee, G. Industrial and Engineering Chemistry. 1961, 53, 2, 143-146.
(2) Tamura, H.; Goto, K.; Nagayama, M. Corrosion Science. 1976, 16, 197-207.
(3) Stumm, W.; Morgan, J.J. Aquatic Chemistry: An Introduction Emphasizing Chemical Equilibria in Natural Waters, 2nd ed.; John Wiley and Sons, New York, 1981.
(4) Pesic, B.; Oliver, D.J.; Wichlacz, P. Biotechnol. Bioeng. 1989, 33, 428-439.
(5) Kirby, C. S.; Thomas, H. M.; Southam, G.; Donald, R. Appl. Geochem. 1999, 14, 4, 511-530.
(6) Chavaire C.; Karamanev D.; Godard F.; Garnier A.; Andre G. Geomicrobiology J. 1993, 11, 57-63.
(7) Okereke A.; Stevens S. E., Jr. Appl. Environm. Microbiol. 1991, 57, 1052-1056.
(8) Nemati, M.; Webb C. Biotechnol. Bioeng. 1997, 53, 478-486.
(9) Lacey D. T.; Lawson, F. Biotechnol. Bioeng. 1970, 12, 29-50.
(10) Kirby, C. S.; Elder Brady, J. A. Appl. Geochem. 1998, 13, 4, 509-520.
(11) Nordstrom, D. K., 1985 Selected Papers in the Hydrologic Sciences, U.S. Geological Survey Water Supply Paper 2270, Washington D.C., 113-119.
(12) Kim, A.G. Proceedings of 2nd Symposium on Coal Mine Drainage Research, Pittsburgh, PA, 1968.

1131
(13) Hedin R. S.; Nairn R. W.; Kleinmann R. L. P., 1994, Passive Treatment of Coal Mine Drainage, U.S. Bur. Mines Info. Circ. No. 9389, U.S Dept. Interior.(14) Noike, T.; Kanj, N.; Jun’ichiro, M. Water Res., 1983, 21-27.
(15) Dempsey, B. A.; Roscoe, H. C.; Ames, R.; Hedin, R.; Byong-Hun, J. Geochemistry: Exploration, Environment, Analysis 2001, 1, 81-88.
(16) Dietz, J. M.; Dempsey, B. A. Proceedings of the American Society for Mining And Reclamation Conference, Lexington KY, June 9-12, 2002.
(17) Williamson M. A.; Kirby C. S.; Rimstidt J. D. Program and Abstracts, V. M. GoldschmidtConference, Reston VA, 1992.
(18) Singh, G.; Bhatnagar, M. Internat. J. Mine Water. 1988, 7, 4, 13-26.
(19) American Public Health Association (APHA). Standard Methods for Examination of Water and Wastewater. 18th ed.; APHA: Washington, DC, 1992.
(20) Mineral powder diffraction file databook sets 1-42; International Centre for Diffraction Data, Swarthmore PA, 1993.
(21) Bigham, J.M.; Carlson, L.; Murad, E. Mineral. Mag. 1994, 58, 641-648.
(22) Southam, G. Department of Biology, Northern Arizona University, Flagstaff, AZ, personal communication, 2001.
(23) Robbins, E. I.; Norden, A. W. 11th Annual International Pittsburgh Coal Conference Proceedings: "Coal Energy and the Environment", Pittsburgh, PA, Coal Research Center, 1994, 1154-1159.
(24) Ehrlich, H. L. 1996, Geomicrobiology, 3rd Ed. M. Dekker, New York.
(25) Nordstrom, D. K. International Geol. Rev. 2000, 42, 499-515.
(26) Edwards, K.J.; Bond, P.L.; Gihiring, T. M.; Banfield, J.F. Sci. 2000, 287, 1796-1799.

1132
(27) Henry, D. K.; Craig, J. R.; Gilbert, M. C. Econ. Geol. 1979, 74, 645-656.
(28) Rose, A.; Cravotta III, C. In Coal Mine Drainage Prediction and Pollution Prevention in Pennsylvania, Department of Environmental Protection, Harrisburg, PA, 1998; pp 1-22.
(29) Langmuir, D. Aqueous Environmental Geochemistry, Prentice Hall, Upper Saddle River, NJ, 1997.
(30) Sung, W.; Morgan, J. J. Environ. Sci. Technol. 1980, 14, 5, 561-568.
(31) Buckwalter, J. Pennsylvania Department of Environmental Protection, Valley View, PA, personal communication, 2001.
(32) Jerez, Carlos A.; Chamorro, D.; Peirano, I.; Toledo, H.; Arredondo, R. Biochem. Internat. 1988, 17, 989-999.
(33) McGoran, C.J.M.; Duncan, D.W.; Walden, C.C. Can. J. Microbiol. 1969, 15, 135-138.
(34) Nordstrom, D. K.; Southam, Gordon Geomicrobiology: Interactions Between Microbes and Minerals, Eds. Banfield, J. F.; Nealson, K. H. Reviews in Mineralogy 35, Mineralogical Society of America, Washington D.C., 1997, 361-390.
(35) Wakao, N.; Tachibana, H.; Tanaka, Y.; Sakurai, Y.; Shiota, H. J. Gen. Appl. Microbiol. 1985, 31, 17-28.
(36) Grishin, S.I.; Tuovinen, O.H. Appl. Environm. Microbiol. 1988, 54, 3092- 3100.
(37) Nemati, M.; Webb C. J. Chem. Technol. Biotechnol. 1999, 74, 562-570.
(38) Nyavor K.; Egibor N. O.; Fedorak P. M. Appl. Microbiol. Biotechnol. 1996, 45, 688-691.