the iron oxidation state of garnet by electron …johnf/g777/hoferbrey_2007.pdfthe iron oxidation...
TRANSCRIPT
American Mineralogist, Volume 92, pages 873�885, 2007
0003-004X/07/0506�873$05.00/DOI: 10.2138/am.2007.2390 873
INTRODUCTION
The difference in the geochemical behavior of Fe2+ and Fe3+ in conjunction with the Fe2+/Fe3+ ratio is an important indicator of the oxygen fugacity during mineral formation. It makes the determination of the Fe oxidation state in minerals a highly sought after aim in earth sciences. SpeciÞ cally, the in situ specia-tion of Fe on the microscale is relevant to geology and material sciences, since geomaterials and synthetic materials generally are of small grain size or zoned. Techniques for the determination of Fe oxidation state with micrometer or nanoscale spatial resolution have gained new impetus due to recent advances in X-ray spec-troscopy with either electron beam sources [electron microprobe (EPMA) or transmission electron microscopy (TEM)] or with X-ray beam sources (synchrotron facilities).
The best spatial resolution for Fe3+/ΣFe determination is currently achieved with TEM using energy-loss spectroscopy (EELS) (Garvie and Craven 1994; Golla and Putnis 2001; van Aken and Liebscher 2002; van Aken et al. 1998, 1999). EELS opens the possibility of qualitative nanometer-scaled valence state mapping (Golla and Putnis 2001). For quantitative measure-ments, a spot size of about 1 μm in the TEM diffraction mode is used to avoid electron beam-induced oxidation (van Aken and Liebscher 2002). Absolute errors for Fe3+/ΣFe with EELS then range between ±0.02 and ±0.04 depending upon which
evaluation method is used with regard to energy-loss in near-edge structures. X-ray photoelectron spectroscopy [XPS, e.g., Raeburn et al. (1997a, 1997b)] and X-ray absorption near edge structure (XANES) spectroscopy (Bajt et al. 1994; Berry et al. 2003; Cressey et al. 1993; Delaney et al. 1998; Dyar et al. 2002; O�Neill et al. 2006; Schmid et al. 2003; Wilke et al. 2001) take an intermediate position in terms of the two-dimensional spatial resolution for Fe3+/ΣFe determination. XANES now allows Fe speciation with a 10 × 15 μm X-ray beam size and a spectrum acquisition time of 20�30 min with an error in Fe3+/ΣFe between ±0.03 and ±0.10 for garnets (Dyar et al. 2002). A very recent technique is RIXS (resonant inelastic X-ray scattering), which enables a detailed analysis of the FeK pre-edge spectral features that are sensitive to the oxidation state in conventional absorption spectroscopy (de Groot 2001; Glatzel and Bergmann 2005).
The technique most widely used at present for Fe3+/ΣFe deter-mination in earth sciences is Mössbauer spectroscopy. Although it is a bulk method it has gained importance for micrometer-sized areas through the development of the �milliprobe� (McCammon et al. 1991, 2001). Nonetheless, a spatial resolution of >50 μm is large compared to the resolution of an electron microprobe and long acquisition times are restrictive for routine use.
Electron-microprobe techniques with a spatial resolution on the order of 1 μm are based either on the change of the intensity or on the change of the wavelength of the soft FeLα and FeLβ X-ray emission lines. Both have been exploited in earlier attempts, generally only with semi-quantitative results [for an overview * E-mail: [email protected]
The iron oxidation state of garnet by electron microprobe: Its determination with the ß ank method combined with major-element analysis
HEIDI E. HÖFER* AND GERHARD P. BREY
Institut für Geowissenschaften, Facheinheit Mineralogie, Johann Wolfgang Goethe-Universität, Altenhöferallee 1, D-60438 Frankfurt am Main, Germany
ABSTRACT
We have established a method to determine the oxidation state of Fe using the electron micro-probe�the �ß ank method.� This method has the possibility to analyze simultaneously the major-element chemistry on the same spot. The method is based on FeL X-ray emission spectra that show a concomitant change of both the intensity and the wavelength of the soft FeLα and FeLβ emission lines. The method has been developed for garnets using well-characterized synthetic samples, and an empirical correction scheme has been established for self-absorption of the FeL X-ray emission. This enables the unambiguous correlation of measured intensity ratios of FeLα/FeLβ X-ray emission to the oxidation state in garnet. The ß ank method can be used with routine microprobe settings (e.g., 15 kV, 60 nA) and, for garnets, with minimum beam size. This way, Fe3+/ΣFe and major and trace elements can be determined within 10 minutes on the microscale. The resulting accuracy of Fe3+/ΣFe is then ±0.04 for garnets at 10 wt% total Fe. Application to natural garnet megacrysts with 8 wt% total Fe and Fe3+ known from Mössbauer spectroscopy yields excellent agreement between the two methods. For practical application, the calibration can be achieved by using three natural standards and Þ tting the data to Fe2+ and Fe3+ with linear equations. Through repeated measurements on homogeneous samples, the error in Fe3+/ΣFe becomes approximately ±0.02 (1σ). Optimization of analytical parameters such as beam current, measurement time, and repetition of analyses, will further lower the uncertainty.
Keywords: Iron oxidation state, ß ank method, self-absorption, electron microprobe, garnet
HÖFER AND BREY: IRON OXIDATION STATE BY ELECTRON MICROPROBE874
see Höfer et al. (1994, 2000)]. This semi-quantitative nature likely stems from several factors: (1) neither the wavelength shift nor the change in Lβ/Lα intensity ratios taken alone are very sensitive; (2) self-absorption of the FeL X-ray emission line by Fe was not accounted for, i.e., a correction for total Fe was missing; and (3) different mineral species were not treated separately. Attempts to correct the Lβ/Lα data for self-absorp-tion with matrix-correction programs have also failed (Arm-strong 1999; O�Nions and Smith 1971) since mass-absorption coefÞ cients are highly uncertain in the proximity of absorption edges, particularly near the L edges (Duncumb 1993). More recently, Fialin et al. (2004, 2001) analyzed the FeLα peak shift of several structurally different minerals or glasses with either Fe2+ or Fe3+ alone and took the overall difference between their positions as a normalizing measure. This difference increases with an increasing Fe content. In principle, this could yield a quantitative method as self-absorption is accounted for except for the fact that: (1) uncertainties in the peak position measure-ments are about 15% at 10 wt% Fe [compare Fig. 3 in Fialin et al. (2001)], and (2) data on mixed-valency minerals are lacking, which necessitates the unproven assumption that there is a linear increase of Fe3+/ΣFe between both curves for pure Fe2+- and pure Fe3+-bearing minerals.
Our approach in evaluating the FeLα and FeLβ X-ray emis-sion lines is the �ß ank method� (Höfer et al. 1994). It is a hybrid method that consists of both measuring the Lβ/Lα intensity ratios and the peak shift. This results in a dramatic increase in sensitivity. The ß ank method has been applied successfully to sodic amphiboles by Enders et al. (2000) and to wüstites (Höfer et al. 2000). First results on synthetic garnets were presented by Höfer et al. (1995) and by Höfer (2002) in a paper focused on the correlation between ß ank method data, Mössbauer quadrupole splitting, and crystallographic data.
In the present work, it will be shown that the ß ank method yields precise and accurate determinations of Fe3+/ΣFe in gar-nets and that it can be combined with simultaneous quantitative elemental determination. These advances became possible by extending our studies to a large number of synthetic, composi-tionally different garnets. Their analysis enabled us to establish systematic variations to correct for self-absorption as a dominat-ing factor for FeL X-ray emission lines, as already pointed out by Höfer et al. (1994). Since we have carried out ß ank-method measurements using both Jeol and Cameca microprobes, we can provide potential users with a practical overview concerning the steps involved in ß ank-method measurements for either electron microprobe (see Appendix).
SAMPLE SELECTION
All samples used were synthetic garnets with simple cation exchange vectors on either the octahedral or dodecahedral site (Table 1). They were synthesized at various temperature and pressure conditions in hydrothermal, belt, and multi-anvil ap-paratus and were donated by the persons whose names are listed in Table 1. The cation-substitution scheme on the dodecahedral or octahedral sites in these garnets is also given, together with the range in Fe3+/ΣFe. Samples with Fe2+, Mg2+, Mn2+, Ca2+ on the dodecahedral site and Fe3+, Al3+, Cr3+ on the octahedral site cover the full range from 0 to 1. The Fe3+/ΣFe ratio in pyrope-
almandine-grossular-spessartine garnet solid solutions is zero. It varies from zero to one in almandine-�skiagite� and �skiagite�-andradite garnets, and is constant at one in andradite-grossular solid solutions. The amount of Fe3+ was determined either by Mössbauer spectroscopy or calculated from microprobe analyses on the basis of the 3:2 ratio of the di- and trivalent cations in the structure of these synthetic garnets with simple chemistry.
ELECTRON PROBE MICROANALYSIS (EPMA)Measurements have been carried out over the years Þ rst with a Camebax
microprobe at the University of Mainz, then with a Cameca SX 50 at TU München and TU Darmstadt, and now with the Jeol JXA 8900RL at the University of Frank-furt. Our Jeol microprobe is equipped with a turbo molecular pump to minimize oil vapor in the column. The other microprobes have oil diffusion pumps. Earlier results on a part of the sample set have been already published (Höfer 2002). These measurements were re-evaluated in the course of this study with our new method for self-absorption correction, and the samples were also newly measured with the combination of ß ank method and major element analysis.
The ß ank-method measurements carried out with the Cameca microprobes were obtained by accumulating 27 700 counts at one position each of the FeLα and Lβ peak ß anks at 706.4 and 716.3 eV, respectively. This corresponds to an error of ±0.6% due to counting statistics as described by Höfer et al. (1994, 2000). Mea-surement conditions were 10 kV, 60 nA, TAP crystal, and scanning mode (approx. 5 × 3 μm) or defocused point mode (3 μm). For separate quantitative elemental analysis, we used 15 kV, 40 nA, and point mode. Oxygen was also analyzed with the almandine standard of McGuire et al. (1992).
For the combined ß ank method and quantitative elemental analysis using the Jeol microprobe, the FeLα and Lβ intensities were measured for a Þ xed time of up to 600 s each, typically 300 s. This has the disadvantage of different counting statistics for Lα and for Lβ, but the advantage of a Þ xed measurement time of 10 min per analyzed spot, even at very low Fe concentrations. One spectrometer with a TAP crystal and smallest detector slit (300 μm) was used for ß ank-method measurements. With the remaining 4 spectrometers, up to 12 elements (Si, Ti, Al, Cr, Fe, Mg, Ca, Mn, Ni, Na, K, P) were measured simultaneously, whereby counting times (in s) on peak and background were: Si 60/60, Ca 60/30 (CaSiO3); Ti 60/60 (MnTiO3); Al 60/60 (Al2O3); Cr 60/30 (Cr2O3); Fe 60/30 (Fe2SiO4), Mg 60/60 (Mg2SiO4); Mn 60/60 (MnO); Ni 60/30 (NiO); Na 20/20 (albite); K 30/15 (KTiOPO4). The accelerating voltage was 15 kV with a 60 nA beam current. The beam in point mode was either defocused to 3 μm or focused to the minimum beam diameter achievable with the W Þ lament.
THE FLANK METHOD
Derivation of ß ank measuring positions from difference and absorption spectra
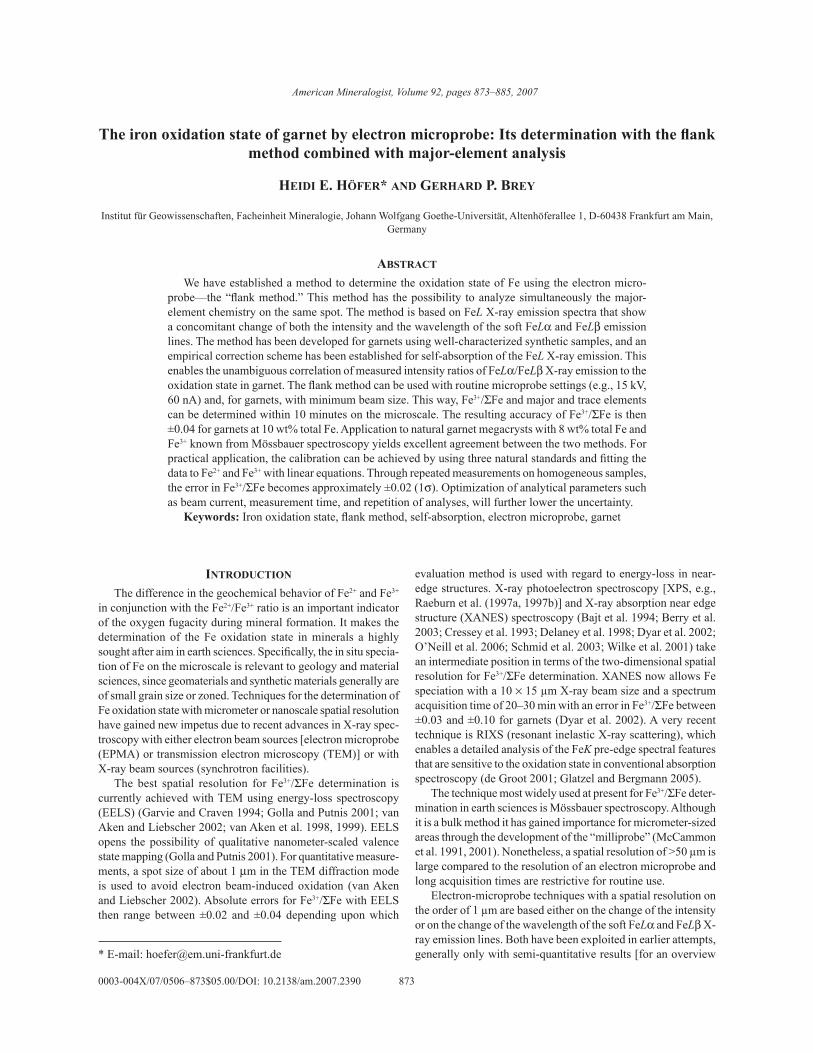
In Figure 1a, the FeL X-ray emission lines for two garnets (almandine and andradite) containing Fe2+ and Fe3+, respectively, are plotted vs. energy. Peak maxima are shifted to higher ener-gies for andradite (Fe3+) compared to almandine (Fe2+), and the
TABLE 1. Origin of synthetic garnet samples used in this study. Cation exchange takes place on dodecahedral (M2+) and octahedral (M3+) sites
System Cation exchange Fe3+/ΣFe Reference
Almandine-Pyrope Mg2+ ↔ Fe2+ 0 Geiger and Rossman 1994Almandine-Pyrope Mg2+ ↔ Fe2+ ↔ Ca2+ 0 Geiger et al. 1987-GrossularAlmandine-Pyrope Mg2+ ↔ Fe2+ 0 A. Doroshev and -Knorringite Al3+ ↔ Cr3+ G.P. Brey (unpubl.)Almandine-Spessartine Fe2+ ↔ Mn2+ 0 Geiger and Feenstra 1997Almandine-Skiagite Al3+ ↔ Fe3+ 0 – 0.4 Woodland and O’Neill 1993Andradite-Skiagite Ca2+ ↔ Fe2+ 0.4 – 1 Woodland and Ross 1994Andradite-Grossular Fe3+ ↔ Al3+ 1 Th. Fehr (unpubl.) A.B. Woodland (unpubl.)
HÖFER AND BREY: IRON OXIDATION STATE BY ELECTRON MICROPROBE 875
intensity ratios of Lα to Lβ are also higher. In principle, there are three way to exploit this behavior: (1) measure the peak shift; (2) evaluate the change in peak intensities either by measuring the intensities at the peak maximum or by measuring the peak areas; or (3) determine the ratio Lβ to Lα on the ß anks of Lβ and Lα at the deÞ ned energy positions of the minima and maxima of the difference spectrum (Fig. 1a). This distinctly enhances the sensitivity compared to the Þ rst two methods because it is a hybrid fortifying both effects (�ß ank method,� Höfer et al. 1994 and 2000).
The measurement positions for the ß ank method were de-termined from absorption spectra that may be calculated from the X-ray emission spectra at different accelerating voltages as logarithmic intensity ratios (Liefeld 1968; Fischer and Baun
1968). Almandine and andradite X-ray emission spectra at 2.5 and 10 kV were collected and used to derive ln(I2.5/I10) (Figs. 1b and 1c). For better comparison, the spectra were normalized to equal intensities at the ß ank-method measurement position for FeLβ. It is quite apparent and most pronounced in almandine that the Lα X-ray emission maxima are shifted to lower energies at 10 kV due to absorption on the high-energy side of the peak. The calculated absorption spectra are shown in the lower parts of Figures 1b and 1c. The L3 absorption edge overlaps exactly with the FeLα ß ank-method measuring position and moves across this measurement position as the Fe3+ content of the sample increases. Thus, by determining the intensities at this position, one directly monitors the effect of the valence-dependent movement of the absorption edge. This is the most probable reason for the high sensitivity of the ß ank method.
By comparing Figures 1a and 1b, it can be seen that the absorption spectrum calculated for Fe2+ (almandine) closely resembles the difference spectrum between andradite and al-mandine. This demonstrates that the differences between the andradite and almandine X-ray emission spectra are mainly caused by self-absorption. It also shows that the calculation of a difference spectrum is an easy and effective tool to determine the ß ank method measurement positions.
Advantage of the ß ank method over �conventional� Lβ/Lα ratios
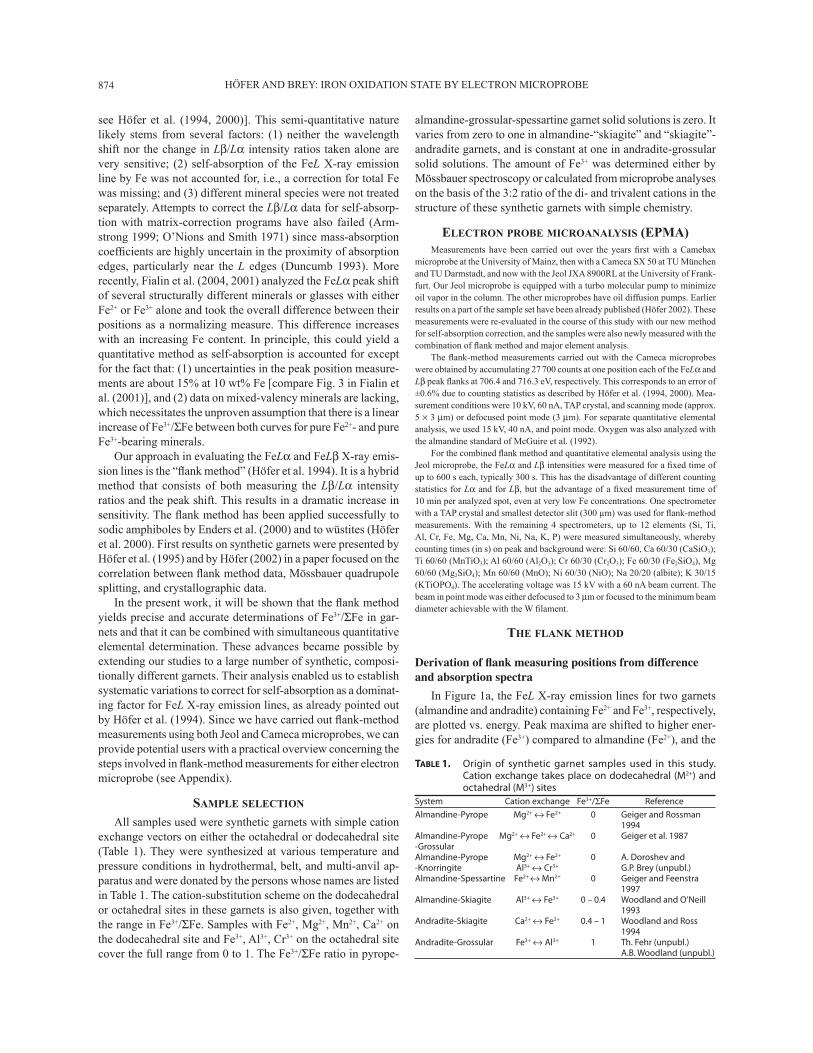
From the literature, Lβ/Lα intensity ratios measured at the peak maximum are available for natural garnets (Albee and Chodos 1970; Pavićević et al. 1989; Rösler 1989). These data are plotted in Figure 2 and show a clear dependency of this ratio on Fe3+/ΣFe, but the scatter is quite large. We analyzed several members of the almandine-�skiagite� and �skiagite�-andradite solid solution series in a similar way but used peak area ratios. The results with respect to resolution are fairly similar (Fig. 2). The application of the ß ank method yielded a substantial increase of the range of ratios from andradite to �skiagite� to almandine, but the relationship is not linear. A few pyrope-almandine garnets with only Fe2+ were also measured and it is clear that both our data and those from the literature (Pavićević et al. 1989) fall off the correlation lines.
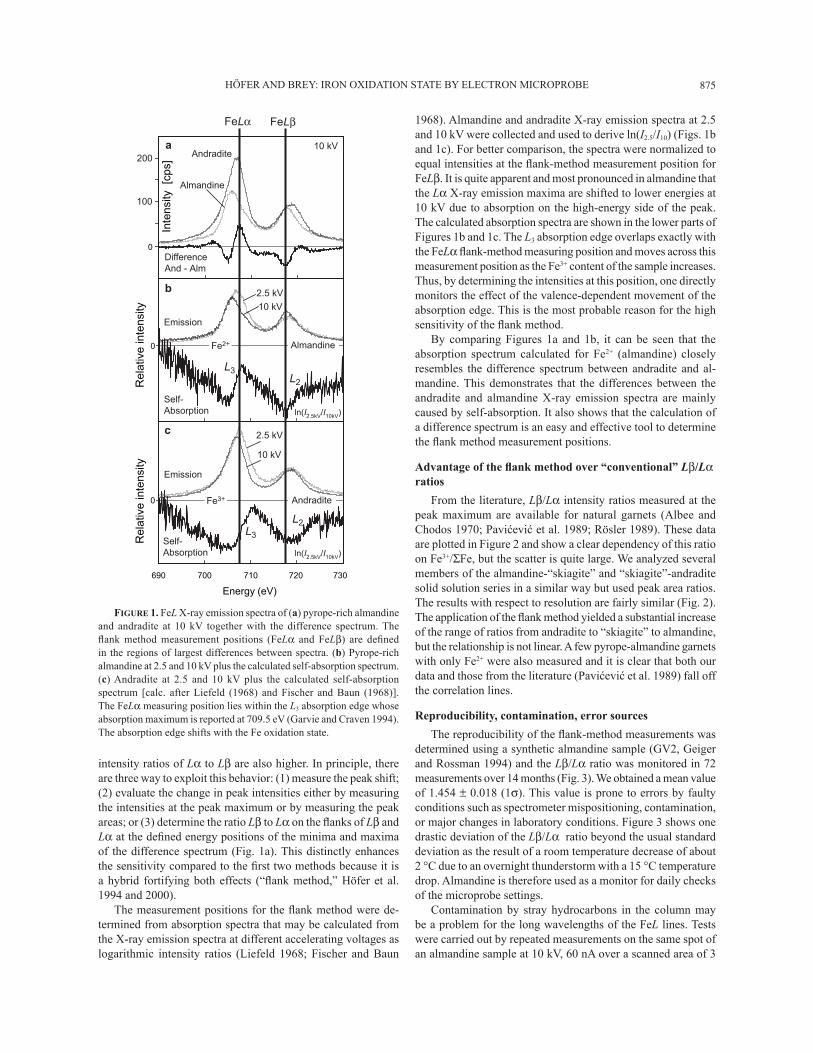
Reproducibility, contamination, error sourcesThe reproducibility of the ß ank-method measurements was
determined using a synthetic almandine sample (GV2, Geiger and Rossman 1994) and the Lβ/Lα ratio was monitored in 72 measurements over 14 months (Fig. 3). We obtained a mean value of 1.454 ± 0.018 (1σ). This value is prone to errors by faulty conditions such as spectrometer mispositioning, contamination, or major changes in laboratory conditions. Figure 3 shows one drastic deviation of the Lβ/Lα ratio beyond the usual standard deviation as the result of a room temperature decrease of about 2 °C due to an overnight thunderstorm with a 15 °C temperature drop. Almandine is therefore used as a monitor for daily checks of the microprobe settings.
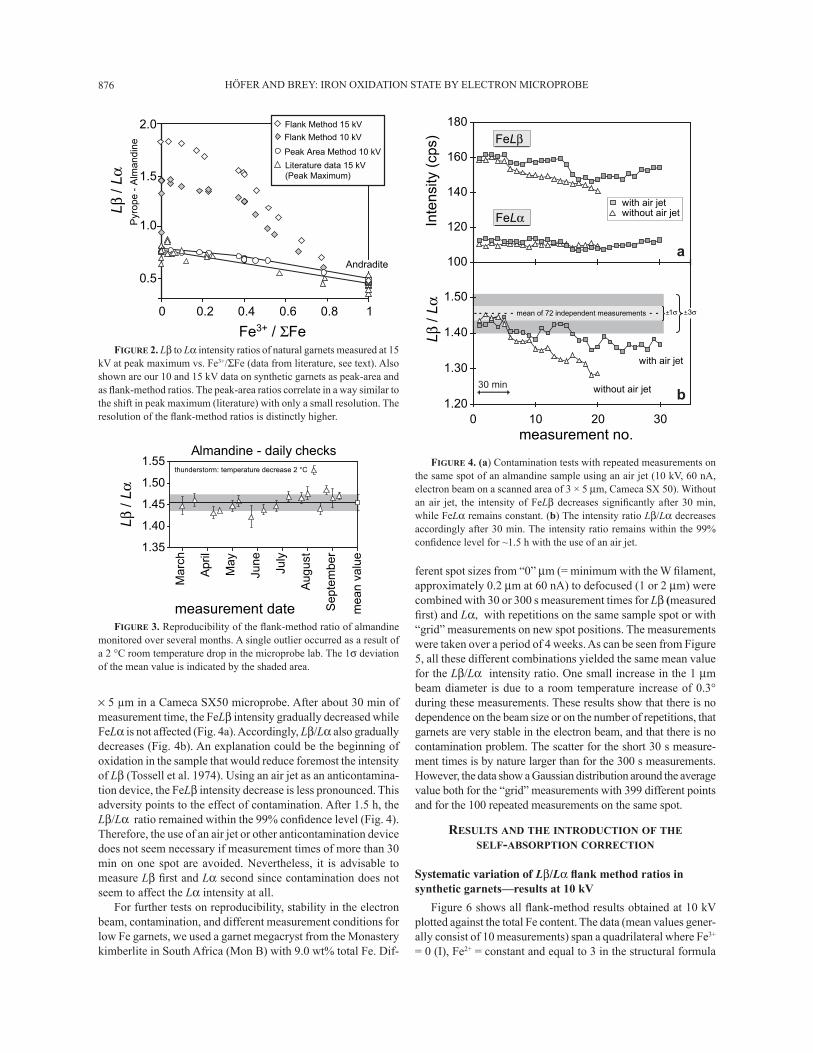
Contamination by stray hydrocarbons in the column may be a problem for the long wavelengths of the FeL lines. Tests were carried out by repeated measurements on the same spot of an almandine sample at 10 kV, 60 nA over a scanned area of 3
Inte
nsity
[cp
s]
0
200
100
FeLα FeLβ
Andradite
Almandine
DifferenceAnd - Alm
Emission
Self-Absorption
a 10 kV
690 700 710 720 730
Energy (eV)
0 Fe3+
Rel
ativ
e in
tens
ity
c 2.5 kV
10 kV
ln(I2.5kV/I10kV)
Emission
Self-Absorption
Andradite
L3
L2
Rel
ativ
e in
tens
ity
0 Almandine
2.5 kV
10 kV
ln(I2.5kV/I10kV)
b
L3L2
Fe2+
FIGURE 1. FeL X-ray emission spectra of (a) pyrope-rich almandine and andradite at 10 kV together with the difference spectrum. The ß ank method measurement positions (FeLα and FeLβ) are deÞ ned in the regions of largest differences between spectra. (b) Pyrope-rich almandine at 2.5 and 10 kV plus the calculated self-absorption spectrum. (c) Andradite at 2.5 and 10 kV plus the calculated self-absorption spectrum [calc. after Liefeld (1968) and Fischer and Baun (1968)]. The FeLα measuring position lies within the L3 absorption edge whose absorption maximum is reported at 709.5 eV (Garvie and Craven 1994). The absorption edge shifts with the Fe oxidation state.
HÖFER AND BREY: IRON OXIDATION STATE BY ELECTRON MICROPROBE876
× 5 μm in a Cameca SX50 microprobe. After about 30 min of measurement time, the FeLβ intensity gradually decreased while FeLα is not affected (Fig. 4a). Accordingly, Lβ/Lα also gradually decreases (Fig. 4b). An explanation could be the beginning of oxidation in the sample that would reduce foremost the intensity of Lβ (Tossell et al. 1974). Using an air jet as an anticontamina-tion device, the FeLβ intensity decrease is less pronounced. This adversity points to the effect of contamination. After 1.5 h, the Lβ/Lα ratio remained within the 99% conÞ dence level (Fig. 4). Therefore, the use of an air jet or other anticontamination device does not seem necessary if measurement times of more than 30 min on one spot are avoided. Nevertheless, it is advisable to measure Lβ Þ rst and Lα second since contamination does not seem to affect the Lα intensity at all.
For further tests on reproducibility, stability in the electron beam, contamination, and different measurement conditions for low Fe garnets, we used a garnet megacryst from the Monastery kimberlite in South Africa (Mon B) with 9.0 wt% total Fe. Dif-
ferent spot sizes from �0� μm (= minimum with the W Þ lament, approximately 0.2 μm at 60 nA) to defocused (1 or 2 μm) were combined with 30 or 300 s measurement times for Lβ (measured Þ rst) and Lα, with repetitions on the same sample spot or with �grid� measurements on new spot positions. The measurements were taken over a period of 4 weeks. As can be seen from Figure 5, all these different combinations yielded the same mean value for the Lβ/Lα intensity ratio. One small increase in the 1 μm beam diameter is due to a room temperature increase of 0.3° during these measurements. These results show that there is no dependence on the beam size or on the number of repetitions, that garnets are very stable in the electron beam, and that there is no contamination problem. The scatter for the short 30 s measure-ment times is by nature larger than for the 300 s measurements. However, the data show a Gaussian distribution around the average value both for the �grid� measurements with 399 different points and for the 100 repeated measurements on the same spot.
RESULTS AND THE INTRODUCTION OF THE SELF-ABSORPTION CORRECTION
Systematic variation of Lβ/Lα ß ank method ratios in synthetic garnets�results at 10 kV
Figure 6 shows all ß ank-method results obtained at 10 kV plotted against the total Fe content. The data (mean values gener-ally consist of 10 measurements) span a quadrilateral where Fe3+ = 0 (I), Fe2+ = constant and equal to 3 in the structural formula
0.5
1.0
1.5
0 0.2 0.4 0.6 0.8 1
Peak Area Method 10 kV
Flank Method 10 kV
Literature data 15 kV(Peak Maximum)
Andradite
Pyr
ope
- A
lman
dine
Fe3+ / ΣFe
Lβ / Lα
Flank Method 15 kV2.0
FIGURE 2. Lβ to Lα intensity ratios of natural garnets measured at 15 kV at peak maximum vs. Fe3+/ΣFe (data from literature, see text). Also shown are our 10 and 15 kV data on synthetic garnets as peak-area and as ß ank-method ratios. The peak-area ratios correlate in a way similar to the shift in peak maximum (literature) with only a small resolution. The resolution of the ß ank-method ratios is distinctly higher.
Almandine - daily checks
1.35
1.40
1.45
1.50
1.55
Mar
ch
Apr
il
May
June
July
Aug
ust
Sep
tem
ber
measurement date
Lβ / Lα
thunderstorm: temperature decrease 2 °C
mea
n va
lue
FIGURE 3. Reproducibility of the ß ank-method ratio of almandine monitored over several months. A single outlier occurred as a result of a 2 °C room temperature drop in the microprobe lab. The 1σ deviation of the mean value is indicated by the shaded area.
1.20
1.30
1.40
1.50
0 10 20 30measurement no.
with air jet
without air jet30 min
mean of 72 independent measurements + 1σ
Lβ / Lα + 3σ
100
120
140
160
180
Inte
nsity
(cp
s)
FeLα with air jet without air jet
a
b
FeLβ
FIGURE 4. (a) Contamination tests with repeated measurements on the same spot of an almandine sample using an air jet (10 kV, 60 nA, electron beam on a scanned area of 3 × 5 μm, Cameca SX 50). Without an air jet, the intensity of FeLβ decreases signiÞ cantly after 30 min, while FeLα remains constant. (b) The intensity ratio Lβ/Lα decreases accordingly after 30 min. The intensity ratio remains within the 99% conÞ dence level for ~1.5 h with the use of an air jet.
HÖFER AND BREY: IRON OXIDATION STATE BY ELECTRON MICROPROBE 877
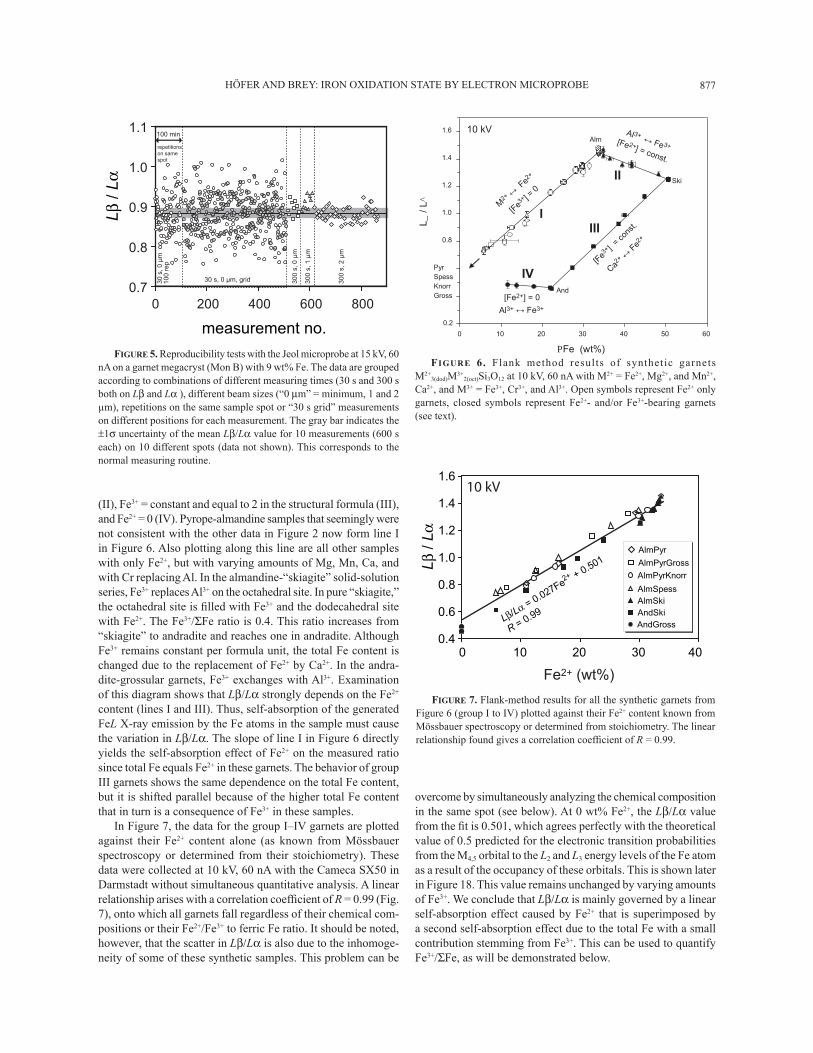
(II), Fe3+ = constant and equal to 2 in the structural formula (III), and Fe2+ = 0 (IV). Pyrope-almandine samples that seemingly were not consistent with the other data in Figure 2 now form line I in Figure 6. Also plotting along this line are all other samples with only Fe2+, but with varying amounts of Mg, Mn, Ca, and with Cr replacing Al. In the almandine-�skiagite� solid-solution series, Fe3+ replaces Al3+ on the octahedral site. In pure �skiagite,� the octahedral site is Þ lled with Fe3+ and the dodecahedral site with Fe2+. The Fe3+/ΣFe ratio is 0.4. This ratio increases from �skiagite� to andradite and reaches one in andradite. Although Fe3+ remains constant per formula unit, the total Fe content is changed due to the replacement of Fe2+ by Ca2+. In the andra-dite-grossular garnets, Fe3+ exchanges with Al3+. Examination of this diagram shows that Lβ/Lα strongly depends on the Fe2+ content (lines I and III). Thus, self-absorption of the generated FeL X-ray emission by the Fe atoms in the sample must cause the variation in Lβ/Lα. The slope of line I in Figure 6 directly yields the self-absorption effect of Fe2+ on the measured ratio since total Fe equals Fe2+ in these garnets. The behavior of group III garnets shows the same dependence on the total Fe content, but it is shifted parallel because of the higher total Fe content that in turn is a consequence of Fe3+ in these samples.
In Figure 7, the data for the group I�IV garnets are plotted against their Fe2+ content alone (as known from Mössbauer spectroscopy or determined from their stoichiometry). These data were collected at 10 kV, 60 nA with the Cameca SX50 in Darmstadt without simultaneous quantitative analysis. A linear relationship arises with a correlation coefÞ cient of R = 0.99 (Fig. 7), onto which all garnets fall regardless of their chemical com-positions or their Fe2+/Fe3+ to ferric Fe ratio. It should be noted, however, that the scatter in Lβ/Lα is also due to the inhomoge-neity of some of these synthetic samples. This problem can be
overcome by simultaneously analyzing the chemical composition in the same spot (see below). At 0 wt% Fe2+, the Lβ/Lα value from the Þ t is 0.501, which agrees perfectly with the theoretical value of 0.5 predicted for the electronic transition probabilities from the M4,5 orbital to the L2 and L3 energy levels of the Fe atom as a result of the occupancy of these orbitals. This is shown later in Figure 18. This value remains unchanged by varying amounts of Fe3+. We conclude that Lβ/Lα is mainly governed by a linear self-absorption effect caused by Fe2+ that is superimposed by a second self-absorption effect due to the total Fe with a small contribution stemming from Fe3+. This can be used to quantify Fe3+/ΣFe, as will be demonstrated below.
0.7
0.8
0.9
1.0
1.1
0 200 400 600 80030
0 s,
0 µ
m
300
s, 2
µm
300
s, 1
µm
30 s, 0 µm, grid
Lβ / Lα
measurement no.
30 s
, 0 µ
m10
0 re
p
100 min
repetitionson same spot
FIGURE 5. Reproducibility tests with the Jeol microprobe at 15 kV, 60 nA on a garnet megacryst (Mon B) with 9 wt% Fe. The data are grouped according to combinations of different measuring times (30 s and 300 s both on Lβ and Lα ), different beam sizes (�0 μm� = minimum, 1 and 2 μm), repetitions on the same sample spot or �30 s grid� measurements on different positions for each measurement. The gray bar indicates the ±1σ uncertainty of the mean Lβ/Lα value for 10 measurements (600 s each) on 10 different spots (data not shown). This corresponds to the normal measuring routine.
FIGURE 6. Flank method results of synthetic garnets M2+
3(dod)M3+2(oct)Si3O12 at 10 kV, 60 nA with M2+ = Fe2+, Mg2+, and Mn2+,
Ca2+, and M3+ = Fe3+, Cr3+, and Al3+. Open symbols represent Fe2+ only garnets, closed symbols represent Fe2+- and/or Fe3+-bearing garnets (see text).
0.4
0.6
0.8
1.0
1.2
1.4
1.6
0 10 20 30 40
Lβ / Lα
Fe2+ (wt%)
AlmPyrGross
AndSkiAlmSki
AlmPyr
AndGross
AlmPyrKnorr
AlmSpess
10 kV
Lβ/Lα = 0.027Fe
2+ + 0.501
R = 0.99
FIGURE 7. Flank-method results for all the synthetic garnets from Figure 6 (group I to IV) plotted against their Fe2+ content known from Mössbauer spectroscopy or determined from stoichiometry. The linear relationship found gives a correlation coefÞ cient of R = 0.99.
0.2
0.8
1.0
1.2
1.4
1.6
0 10 20 30 40 50 60
Fe (wt%)
And
Ski
Alm
PyrSpessKnorrGross
L /
L
[Fe3+ ] =
0
[Fe3+ ] =
cons
t.
Ca2+ ↔
Fe2+
[Fe2+] = const.
M2+ ↔
Fe2
+
Al3+ ↔ Fe3+
Al3+ ↔ Fe3+ [Fe2+] = 0
I
II
III
IV
10 kV
HÖFER AND BREY: IRON OXIDATION STATE BY ELECTRON MICROPROBE878
Effect of self absorption: Enhancing the ß ank method sensitivity
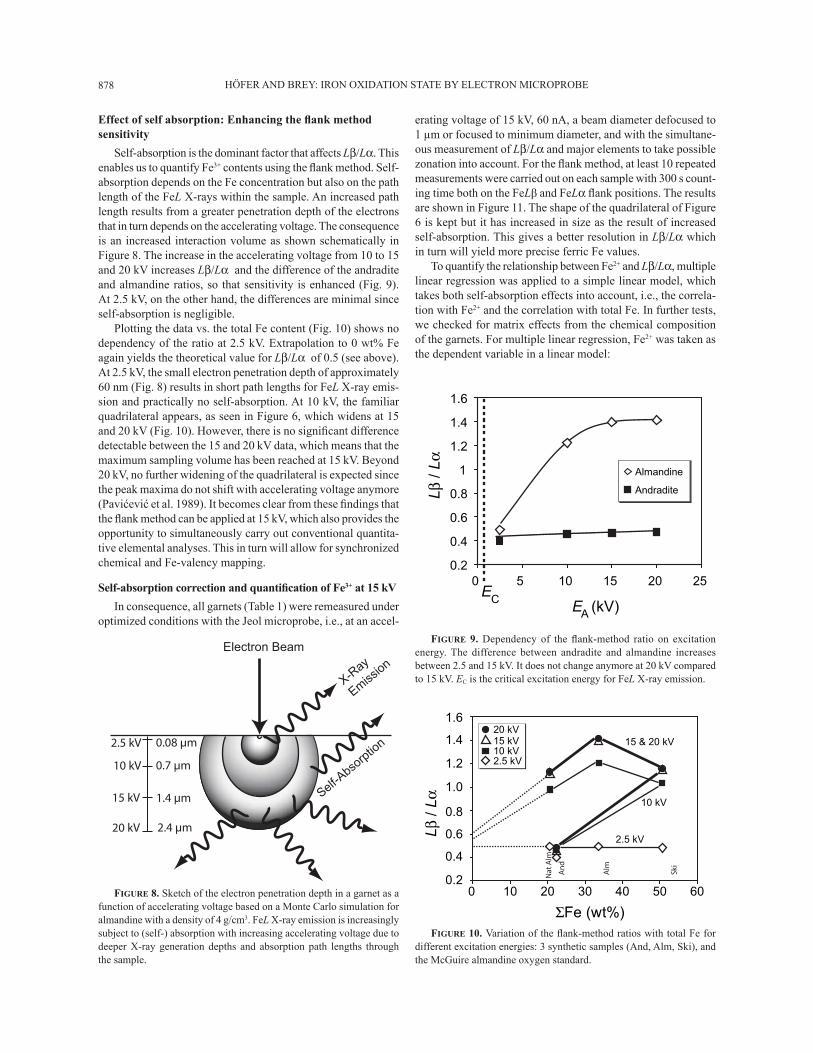
Self-absorption is the dominant factor that affects Lβ/Lα. This enables us to quantify Fe3+ contents using the ß ank method. Self-absorption depends on the Fe concentration but also on the path length of the FeL X-rays within the sample. An increased path length results from a greater penetration depth of the electrons that in turn depends on the accelerating voltage. The consequence is an increased interaction volume as shown schematically in Figure 8. The increase in the accelerating voltage from 10 to 15 and 20 kV increases Lβ/Lα and the difference of the andradite and almandine ratios, so that sensitivity is enhanced (Fig. 9). At 2.5 kV, on the other hand, the differences are minimal since self-absorption is negligible.
Plotting the data vs. the total Fe content (Fig. 10) shows no dependency of the ratio at 2.5 kV. Extrapolation to 0 wt% Fe again yields the theoretical value for Lβ/Lα of 0.5 (see above). At 2.5 kV, the small electron penetration depth of approximately 60 nm (Fig. 8) results in short path lengths for FeL X-ray emis-sion and practically no self-absorption. At 10 kV, the familiar quadrilateral appears, as seen in Figure 6, which widens at 15 and 20 kV (Fig. 10). However, there is no signiÞ cant difference detectable between the 15 and 20 kV data, which means that the maximum sampling volume has been reached at 15 kV. Beyond 20 kV, no further widening of the quadrilateral is expected since the peak maxima do not shift with accelerating voltage anymore (Pavićević et al. 1989). It becomes clear from these Þ ndings that the ß ank method can be applied at 15 kV, which also provides the opportunity to simultaneously carry out conventional quantita-tive elemental analyses. This in turn will allow for synchronized chemical and Fe-valency mapping.
Self-absorption correction and quantiÞ cation of Fe3+ at 15 kVIn consequence, all garnets (Table 1) were remeasured under
optimized conditions with the Jeol microprobe, i.e., at an accel-
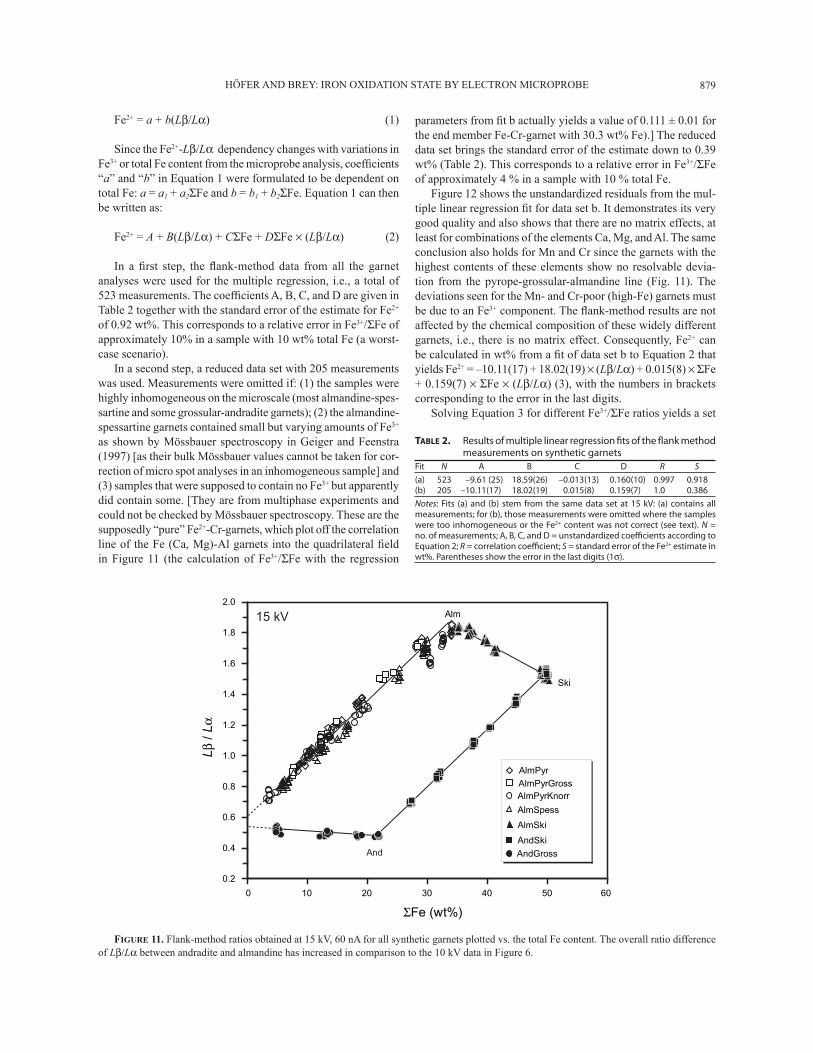
erating voltage of 15 kV, 60 nA, a beam diameter defocused to 1 μm or focused to minimum diameter, and with the simultane-ous measurement of Lβ/Lα and major elements to take possible zonation into account. For the ß ank method, at least 10 repeated measurements were carried out on each sample with 300 s count-ing time both on the FeLβ and FeLα ß ank positions. The results are shown in Figure 11. The shape of the quadrilateral of Figure 6 is kept but it has increased in size as the result of increased self-absorption. This gives a better resolution in Lβ/Lα which in turn will yield more precise ferric Fe values.
To quantify the relationship between Fe2+ and Lβ/Lα, multiple linear regression was applied to a simple linear model, which takes both self-absorption effects into account, i.e., the correla-tion with Fe2+ and the correlation with total Fe. In further tests, we checked for matrix effects from the chemical composition of the garnets. For multiple linear regression, Fe2+ was taken as the dependent variable in a linear model:
2.5 kV
10 kV
15 kV
20 kV 2.4 µm
1.4 µm
0.7 µm
0.08 µm
Electron Beam
Self-Abso
rptio
n
X-Ray
Emission
FIGURE 8. Sketch of the electron penetration depth in a garnet as a function of accelerating voltage based on a Monte Carlo simulation for almandine with a density of 4 g/cm3. FeL X-ray emission is increasingly subject to (self-) absorption with increasing accelerating voltage due to deeper X-ray generation depths and absorption path lengths through the sample.
0.2
0.4
0.6
0.8
1
1.2
1.4
1.6
0 5 10 15 20 25
EA (kV)
Almandine
Andradite
EC
Lβ / Lα
FIGURE 9. Dependency of the ß ank-method ratio on excitation energy. The difference between andradite and almandine increases between 2.5 and 15 kV. It does not change anymore at 20 kV compared to 15 kV. EC is the critical excitation energy for FeL X-ray emission.
0.2
0.4
0.6
0.8
1.0
1.2
1.4
1.6
0 10 20 30 40 50 60
15 & 20 kV
10 kV
2.5 kV
2.5 kV10 kV15 kV20 kV
Lβ / Lα
ΣFe (wt%)
Ski
An
d
Alm
Nat
Alm
FIGURE 10. Variation of the ß ank-method ratios with total Fe for different excitation energies: 3 synthetic samples (And, Alm, Ski), and the McGuire almandine oxygen standard.
HÖFER AND BREY: IRON OXIDATION STATE BY ELECTRON MICROPROBE 879
Fe2+ = a + b(Lβ/Lα) (1)
Since the Fe2+-Lβ/Lα dependency changes with variations in Fe3+ or total Fe content from the microprobe analysis, coefÞ cients �a� and �b� in Equation 1 were formulated to be dependent on total Fe: a = a1 + a2ΣFe and b = b1 + b2ΣFe. Equation 1 can then be written as:
Fe2+ = A + B(Lβ/Lα) + CΣFe + DΣFe × (Lβ/Lα) (2)
In a Þ rst step, the ß ank-method data from all the garnet analyses were used for the multiple regression, i.e., a total of 523 measurements. The coefÞ cients A, B, C, and D are given in Table 2 together with the standard error of the estimate for Fe2+ of 0.92 wt%. This corresponds to a relative error in Fe3+/ΣFe of approximately 10% in a sample with 10 wt% total Fe (a worst-case scenario).
In a second step, a reduced data set with 205 measurements was used. Measurements were omitted if: (1) the samples were highly inhomogeneous on the microscale (most almandine-spes-sartine and some grossular-andradite garnets); (2) the almandine-spessartine garnets contained small but varying amounts of Fe3+ as shown by Mössbauer spectroscopy in Geiger and Feenstra (1997) [as their bulk Mössbauer values cannot be taken for cor-rection of micro spot analyses in an inhomogeneous sample] and (3) samples that were supposed to contain no Fe3+ but apparently did contain some. [They are from multiphase experiments and could not be checked by Mössbauer spectroscopy. These are the supposedly �pure� Fe2+-Cr-garnets, which plot off the correlation line of the Fe (Ca, Mg)-Al garnets into the quadrilateral Þ eld in Figure 11 (the calculation of Fe3+/ΣFe with the regression
parameters from Þ t b actually yields a value of 0.111 ± 0.01 for the end member Fe-Cr-garnet with 30.3 wt% Fe).] The reduced data set brings the standard error of the estimate down to 0.39 wt% (Table 2). This corresponds to a relative error in Fe3+/ΣFe of approximately 4 % in a sample with 10 % total Fe.
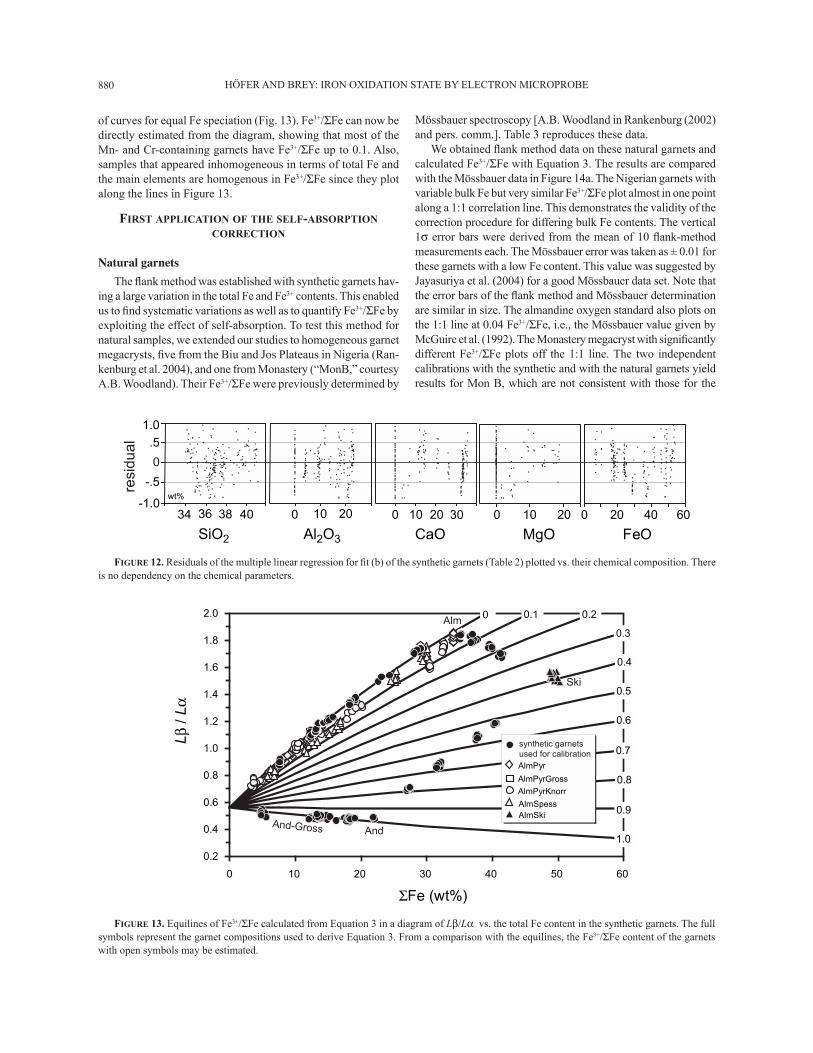
Figure 12 shows the unstandardized residuals from the mul-tiple linear regression Þ t for data set b. It demonstrates its very good quality and also shows that there are no matrix effects, at least for combinations of the elements Ca, Mg, and Al. The same conclusion also holds for Mn and Cr since the garnets with the highest contents of these elements show no resolvable devia-tion from the pyrope-grossular-almandine line (Fig. 11). The deviations seen for the Mn- and Cr-poor (high-Fe) garnets must be due to an Fe3+ component. The ß ank-method results are not affected by the chemical composition of these widely different garnets, i.e., there is no matrix effect. Consequently, Fe2+ can be calculated in wt% from a Þ t of data set b to Equation 2 that yields Fe2+ = �10.11(17) + 18.02(19) × (Lβ/Lα) + 0.015(8) × ΣFe + 0.159(7) × ΣFe × (Lβ/Lα) (3), with the numbers in brackets corresponding to the error in the last digits.
Solving Equation 3 for different Fe3+/ΣFe ratios yields a set
0.2
0.4
0.6
0.8
1.0
1.2
1.4
1.6
1.8
2.0
0 10 20 30 40 50 60
ΣFe (wt%)
Lβ / Lα
15 kV
AlmPyrGross
AndSki
AlmSki
AlmPyr
AndGross
AlmPyrKnorr
AlmSpess
And
Ski
Alm
FIGURE 11. Flank-method ratios obtained at 15 kV, 60 nA for all synthetic garnets plotted vs. the total Fe content. The overall ratio difference of Lβ/Lα between andradite and almandine has increased in comparison to the 10 kV data in Figure 6.
TABLE 2. Results of multiple linear regression fi ts of the fl ank method measurements on synthetic garnets
Fit N A B C D R S
(a) 523 –9.61 (25) 18.59(26) –0.013(13) 0.160(10) 0.997 0.918(b) 205 –10.11(17) 18.02(19) 0.015(8) 0.159(7) 1.0 0.386
Notes: Fits (a) and (b) stem from the same data set at 15 kV: (a) contains all measurements; for (b), those measurements were omitted where the samples were too inhomogeneous or the Fe2+ content was not correct (see text). N = no. of measurements; A, B, C, and D = unstandardized coeffi cients according to Equation 2; R = correlation coeffi cient; S = standard error of the Fe2+ estimate in wt%. Parentheses show the error in the last digits (1σ).
HÖFER AND BREY: IRON OXIDATION STATE BY ELECTRON MICROPROBE880
of curves for equal Fe speciation (Fig. 13). Fe3+/ΣFe can now be directly estimated from the diagram, showing that most of the Mn- and Cr-containing garnets have Fe3+/ΣFe up to 0.1. Also, samples that appeared inhomogeneous in terms of total Fe and the main elements are homogenous in Fe3+/ΣFe since they plot along the lines in Figure 13.
FIRST APPLICATION OF THE SELF-ABSORPTION CORRECTION
Natural garnets
The ß ank method was established with synthetic garnets hav-ing a large variation in the total Fe and Fe3+ contents. This enabled us to Þ nd systematic variations as well as to quantify Fe3+/ΣFe by exploiting the effect of self-absorption. To test this method for natural samples, we extended our studies to homogeneous garnet megacrysts, Þ ve from the Biu and Jos Plateaus in Nigeria (Ran-kenburg et al. 2004), and one from Monastery (�MonB,� courtesy A.B. Woodland). Their Fe3+/ΣFe were previously determined by
Mössbauer spectroscopy [A.B. Woodland in Rankenburg (2002) and pers. comm.]. Table 3 reproduces these data.
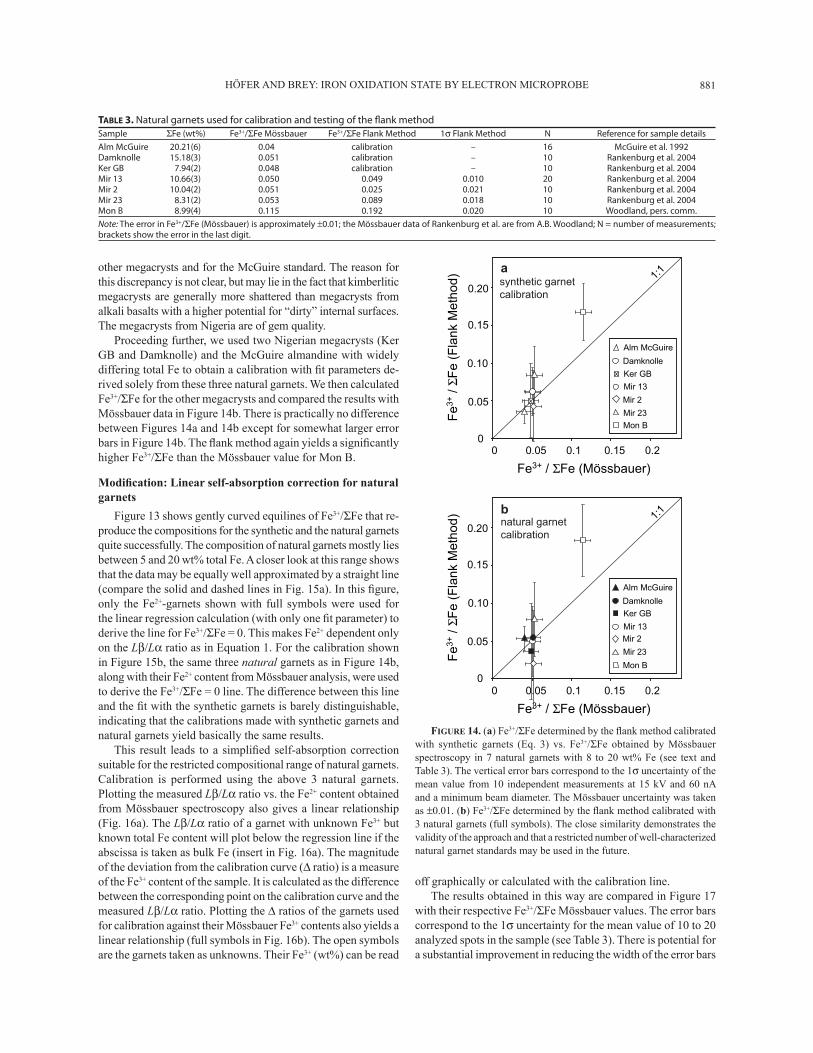
We obtained ß ank method data on these natural garnets and calculated Fe3+/ΣFe with Equation 3. The results are compared with the Mössbauer data in Figure 14a. The Nigerian garnets with variable bulk Fe but very similar Fe3+/ΣFe plot almost in one point along a 1:1 correlation line. This demonstrates the validity of the correction procedure for differing bulk Fe contents. The vertical 1σ error bars were derived from the mean of 10 ß ank-method measurements each. The Mössbauer error was taken as ± 0.01 for these garnets with a low Fe content. This value was suggested by Jayasuriya et al. (2004) for a good Mössbauer data set. Note that the error bars of the ß ank method and Mössbauer determination are similar in size. The almandine oxygen standard also plots on the 1:1 line at 0.04 Fe3+/ΣFe, i.e., the Mössbauer value given by McGuire et al. (1992). The Monastery megacryst with signiÞ cantly different Fe3+/ΣFe plots off the 1:1 line. The two independent calibrations with the synthetic and with the natural garnets yield results for Mon B, which are not consistent with those for the
FeO6040200
MgO100 20
CaO100
Al2O3
100 20 30
SiO2
3634
resi
dual
0
.5
-.5
1.0
-1.02038 40
wt%
0.2
0.4
0.6
0.8
1.0
1.2
1.4
1.6
1.8
2.0
0 10 20 30 40 50 60
0 0.1 0.2
0.3
0.4
0.5
0.6
0.7
0.8
0.9
1.0
ΣFe (wt%)
Lβ / Lα
AlmPyrGross
AlmPyr
AlmPyrKnorr
AlmSpess
synthetic garnetsused for calibration
AlmSki
And
Alm
Ski
And-Gross
FIGURE 12. Residuals of the multiple linear regression for Þ t (b) of the synthetic garnets (Table 2) plotted vs. their chemical composition. There is no dependency on the chemical parameters.
FIGURE 13. Equilines of Fe3+/ΣFe calculated from Equation 3 in a diagram of Lβ/Lα vs. the total Fe content in the synthetic garnets. The full symbols represent the garnet compositions used to derive Equation 3. From a comparison with the equilines, the Fe3+/ΣFe content of the garnets with open symbols may be estimated.
HÖFER AND BREY: IRON OXIDATION STATE BY ELECTRON MICROPROBE 881
other megacrysts and for the McGuire standard. The reason for this discrepancy is not clear, but may lie in the fact that kimberlitic megacrysts are generally more shattered than megacrysts from alkali basalts with a higher potential for �dirty� internal surfaces. The megacrysts from Nigeria are of gem quality.
Proceeding further, we used two Nigerian megacrysts (Ker GB and Damknolle) and the McGuire almandine with widely differing total Fe to obtain a calibration with Þ t parameters de-rived solely from these three natural garnets. We then calculated Fe3+/ΣFe for the other megacrysts and compared the results with Mössbauer data in Figure 14b. There is practically no difference between Figures 14a and 14b except for somewhat larger error bars in Figure 14b. The ß ank method again yields a signiÞ cantly higher Fe3+/ΣFe than the Mössbauer value for Mon B.
ModiÞ cation: Linear self-absorption correction for natural garnets
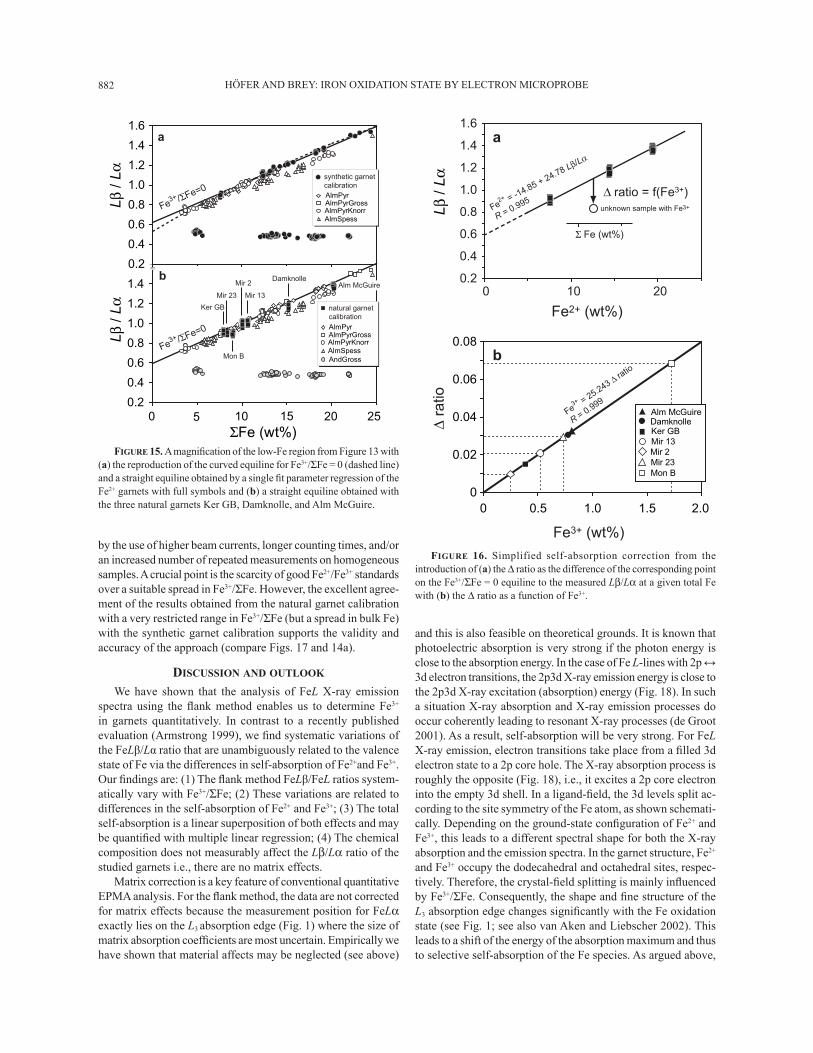
Figure 13 shows gently curved equilines of Fe3+/ΣFe that re-produce the compositions for the synthetic and the natural garnets quite successfully. The composition of natural garnets mostly lies between 5 and 20 wt% total Fe. A closer look at this range shows that the data may be equally well approximated by a straight line (compare the solid and dashed lines in Fig. 15a). In this Þ gure, only the Fe2+-garnets shown with full symbols were used for the linear regression calculation (with only one Þ t parameter) to derive the line for Fe3+/ΣFe = 0. This makes Fe2+ dependent only on the Lβ/Lα ratio as in Equation 1. For the calibration shown in Figure 15b, the same three natural garnets as in Figure 14b, along with their Fe2+ content from Mössbauer analysis, were used to derive the Fe3+/ΣFe = 0 line. The difference between this line and the Þ t with the synthetic garnets is barely distinguishable, indicating that the calibrations made with synthetic garnets and natural garnets yield basically the same results.
This result leads to a simpliÞ ed self-absorption correction suitable for the restricted compositional range of natural garnets. Calibration is performed using the above 3 natural garnets. Plotting the measured Lβ/Lα ratio vs. the Fe2+ content obtained from Mössbauer spectroscopy also gives a linear relationship (Fig. 16a). The Lβ/Lα ratio of a garnet with unknown Fe3+ but known total Fe content will plot below the regression line if the abscissa is taken as bulk Fe (insert in Fig. 16a). The magnitude of the deviation from the calibration curve (∆ ratio) is a measure of the Fe3+ content of the sample. It is calculated as the difference between the corresponding point on the calibration curve and the measured Lβ/Lα ratio. Plotting the ∆ ratios of the garnets used for calibration against their Mössbauer Fe3+ contents also yields a linear relationship (full symbols in Fig. 16b). The open symbols are the garnets taken as unknowns. Their Fe3+ (wt%) can be read
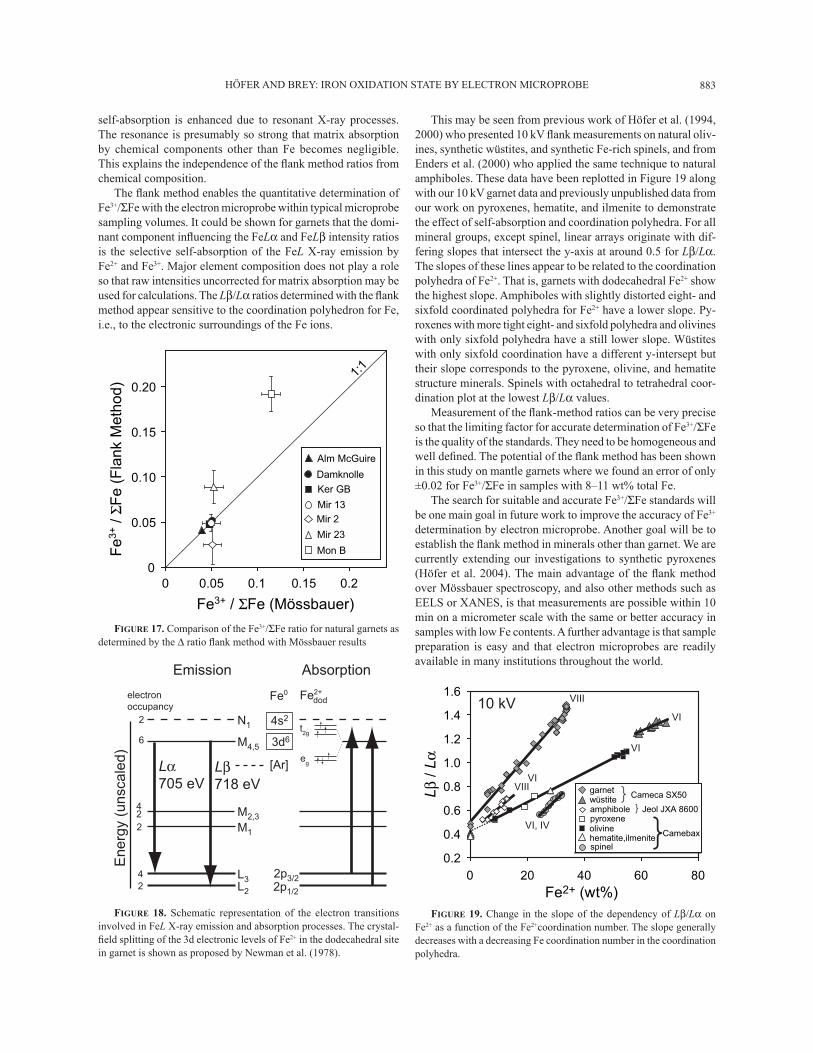
off graphically or calculated with the calibration line. The results obtained in this way are compared in Figure 17
with their respective Fe3+/ΣFe Mössbauer values. The error bars correspond to the 1σ uncertainty for the mean value of 10 to 20 analyzed spots in the sample (see Table 3). There is potential for a substantial improvement in reducing the width of the error bars
TABLE 3. Natural garnets used for calibration and testing of the fl ank method
Sample ΣFe (wt%) Fe3+/ΣFe Mössbauer Fe3+/ΣFe Flank Method 1σ Flank Method N Reference for sample details
Alm McGuire 20.21(6) 0.04 calibration – 16 McGuire et al. 1992Damknolle 15.18(3) 0.051 calibration – 10 Rankenburg et al. 2004Ker GB 7.94(2) 0.048 calibration – 10 Rankenburg et al. 2004Mir 13 10.66(3) 0.050 0.049 0.010 20 Rankenburg et al. 2004Mir 2 10.04(2) 0.051 0.025 0.021 10 Rankenburg et al. 2004Mir 23 8.31(2) 0.053 0.089 0.018 10 Rankenburg et al. 2004Mon B 8.99(4) 0.115 0.192 0.020 10 Woodland, pers. comm.
Note: The error in Fe3+/ΣFe (Mössbauer) is approximately ±0.01; the Mössbauer data of Rankenburg et al. are from A.B. Woodland; N = number of measurements; brackets show the error in the last digit.
0 0.05 0.1 0.15 0.2
Fe3+ / ΣFe (Mössbauer)
1:1
Fe3+
/ ΣF
e (F
lank
Met
hod)
a
Alm McGuire
Mir 23
Mon B
Damknolle
Mir 2
Mir 13
Ker GB
0
0.05
0.10
0.15
0.20synthetic garnet calibration
0 0.05 0.1 0.15 0.2
Fe3+ / ΣFe (Mössbauer)
1:1
Fe3+
/ ΣF
e (F
lank
Met
hod)
b
Alm McGuire
Mir 23
Mon B
Damknolle
Mir 2
Ker GB
Mir 13
0
0.05
0.10
0.15
0.20natural garnet calibration
FIGURE 14. (a) Fe3+/ΣFe determined by the ß ank method calibrated with synthetic garnets (Eq. 3) vs. Fe3+/ΣFe obtained by Mössbauer spectroscopy in 7 natural garnets with 8 to 20 wt% Fe (see text and Table 3). The vertical error bars correspond to the 1σ uncertainty of the mean value from 10 independent measurements at 15 kV and 60 nA and a minimum beam diameter. The Mössbauer uncertainty was taken as ±0.01. (b) Fe3+/ΣFe determined by the ß ank method calibrated with 3 natural garnets (full symbols). The close similarity demonstrates the validity of the approach and that a restricted number of well-characterized natural garnet standards may be used in the future.
HÖFER AND BREY: IRON OXIDATION STATE BY ELECTRON MICROPROBE882
by the use of higher beam currents, longer counting times, and/or an increased number of repeated measurements on homogeneous samples. A crucial point is the scarcity of good Fe2+/Fe3+ standards over a suitable spread in Fe3+/ΣFe. However, the excellent agree-ment of the results obtained from the natural garnet calibration with a very restricted range in Fe3+/ΣFe (but a spread in bulk Fe) with the synthetic garnet calibration supports the validity and accuracy of the approach (compare Figs. 17 and 14a).
DISCUSSION AND OUTLOOK
We have shown that the analysis of FeL X-ray emission spectra using the ß ank method enables us to determine Fe3+ in garnets quantitatively. In contrast to a recently published evaluation (Armstrong 1999), we Þ nd systematic variations of the FeLβ/Lα ratio that are unambiguously related to the valence state of Fe via the differences in self-absorption of Fe2+and Fe3+. Our Þ ndings are: (1) The ß ank method FeLβ/FeL ratios system-atically vary with Fe3+/ΣFe; (2) These variations are related to differences in the self-absorption of Fe2+ and Fe3+; (3) The total self-absorption is a linear superposition of both effects and may be quantiÞ ed with multiple linear regression; (4) The chemical composition does not measurably affect the Lβ/Lα ratio of the studied garnets i.e., there are no matrix effects.
Matrix correction is a key feature of conventional quantitative EPMA analysis. For the ß ank method, the data are not corrected for matrix effects because the measurement position for FeLα exactly lies on the L3 absorption edge (Fig. 1) where the size of matrix absorption coefÞ cients are most uncertain. Empirically we have shown that material affects may be neglected (see above)
and this is also feasible on theoretical grounds. It is known that photoelectric absorption is very strong if the photon energy is close to the absorption energy. In the case of Fe L-lines with 2p ↔ 3d electron transitions, the 2p3d X-ray emission energy is close to the 2p3d X-ray excitation (absorption) energy (Fig. 18). In such a situation X-ray absorption and X-ray emission processes do occur coherently leading to resonant X-ray processes (de Groot 2001). As a result, self-absorption will be very strong. For FeL X-ray emission, electron transitions take place from a Þ lled 3d electron state to a 2p core hole. The X-ray absorption process is roughly the opposite (Fig. 18), i.e., it excites a 2p core electron into the empty 3d shell. In a ligand-Þ eld, the 3d levels split ac-cording to the site symmetry of the Fe atom, as shown schemati-cally. Depending on the ground-state conÞ guration of Fe2+ and Fe3+, this leads to a different spectral shape for both the X-ray absorption and the emission spectra. In the garnet structure, Fe2+ and Fe3+ occupy the dodecahedral and octahedral sites, respec-tively. Therefore, the crystal-Þ eld splitting is mainly inß uenced by Fe3+/ΣFe. Consequently, the shape and Þ ne structure of the L3 absorption edge changes signiÞ cantly with the Fe oxidation state (see Fig. 1; see also van Aken and Liebscher 2002). This leads to a shift of the energy of the absorption maximum and thus to selective self-absorption of the Fe species. As argued above,
Lβ / Lα
0.2
0.4
0.6
0.8
1.0
1.2
1.4
1.6
SPSSAlmPyrGrossAlmPyr
AlmPyrKnorrAlmSpess
synthetic garnetcalibration
ΣFe (wt%)
Lβ / Lα
0.2
0.4
0.6
0.8
1.0
1.2
1.4
≈
AlmPyrGrossAlmPyr
AlmPyrKnorrAlmSpess
natural garnetcalibration
AndGross
a
b
Fe3+ /ΣFe=0
100 20
Damknolle
Mir 13
Mir 2
Mir 23
Ker GB
Mon B
Fe3+ /ΣFe=0
5 15 25
Alm McGuire
FIGURE 15. A magniÞ cation of the low-Fe region from Figure 13 with (a) the reproduction of the curved equiline for Fe3+/ΣFe = 0 (dashed line) and a straight equiline obtained by a single Þ t parameter regression of the Fe2+ garnets with full symbols and (b) a straight equiline obtained with the three natural garnets Ker GB, Damknolle, and Alm McGuire.
0.2
0.4
0.6
0.8
1.0
1.2
1.4
1.6
0 10 20
Δ ratio = f(Fe3+) unknown sample with Fe3+Lβ
/ Lα
Fe2+ (wt%)
a
Fe2+ = -14.85 + 24.78 Lβ/Lα
R = 0.995
Σ Fe (wt%)
0
0.02
0.04
0.06
0.08
0 0.5 1.0 1.5 2.0
Fe3+ (wt%)
Fe3+ = 25.243 Δ ratio
R = 0.999
b
Δ ra
tio
Alm McGuire
Mir 23 Mon B
Damknolle
Mir 2
Ker GBMir 13
FIGURE 16. Simplified self-absorption correction from the introduction of (a) the ∆ ratio as the difference of the corresponding point on the Fe3+/ΣFe = 0 equiline to the measured Lβ/Lα at a given total Fe with (b) the ∆ ratio as a function of Fe3+.
HÖFER AND BREY: IRON OXIDATION STATE BY ELECTRON MICROPROBE 883
self-absorption is enhanced due to resonant X-ray processes. The resonance is presumably so strong that matrix absorption by chemical components other than Fe becomes negligible. This explains the independence of the ß ank method ratios from chemical composition.
The ß ank method enables the quantitative determination of Fe3+/ΣFe with the electron microprobe within typical microprobe sampling volumes. It could be shown for garnets that the domi-nant component inß uencing the FeLα and FeLβ intensity ratios is the selective self-absorption of the FeL X-ray emission by Fe2+ and Fe3+. Major element composition does not play a role so that raw intensities uncorrected for matrix absorption may be used for calculations. The Lβ/Lα ratios determined with the ß ank method appear sensitive to the coordination polyhedron for Fe, i.e., to the electronic surroundings of the Fe ions.
This may be seen from previous work of Höfer et al. (1994, 2000) who presented 10 kV ß ank measurements on natural oliv-ines, synthetic wüstites, and synthetic Fe-rich spinels, and from Enders et al. (2000) who applied the same technique to natural amphiboles. These data have been replotted in Figure 19 along with our 10 kV garnet data and previously unpublished data from our work on pyroxenes, hematite, and ilmenite to demonstrate the effect of self-absorption and coordination polyhedra. For all mineral groups, except spinel, linear arrays originate with dif-fering slopes that intersect the y-axis at around 0.5 for Lβ/Lα. The slopes of these lines appear to be related to the coordination polyhedra of Fe2+. That is, garnets with dodecahedral Fe2+ show the highest slope. Amphiboles with slightly distorted eight- and sixfold coordinated polyhedra for Fe2+ have a lower slope. Py-roxenes with more tight eight- and sixfold polyhedra and olivines with only sixfold polyhedra have a still lower slope. Wüstites with only sixfold coordination have a different y-intersept but their slope corresponds to the pyroxene, olivine, and hematite structure minerals. Spinels with octahedral to tetrahedral coor-dination plot at the lowest Lβ/Lα values.
Measurement of the ß ank-method ratios can be very precise so that the limiting factor for accurate determination of Fe3+/ΣFe is the quality of the standards. They need to be homogeneous and well deÞ ned. The potential of the ß ank method has been shown in this study on mantle garnets where we found an error of only ±0.02 for Fe3+/ΣFe in samples with 8�11 wt% total Fe.
The search for suitable and accurate Fe3+/ΣFe standards will be one main goal in future work to improve the accuracy of Fe3+ determination by electron microprobe. Another goal will be to establish the ß ank method in minerals other than garnet. We are currently extending our investigations to synthetic pyroxenes (Höfer et al. 2004). The main advantage of the ß ank method over Mössbauer spectroscopy, and also other methods such as EELS or XANES, is that measurements are possible within 10 min on a micrometer scale with the same or better accuracy in samples with low Fe contents. A further advantage is that sample preparation is easy and that electron microprobes are readily available in many institutions throughout the world.
0
0.05
0.10
0.15
0.20
0 0.05 0.1 0.15 0.2
Alm McGuire
Mir 23
Mon B
Damknolle
Mir 2
Ker GB
Mir 13
1:1
Fe3+ / ΣFe (Mössbauer)
Fe3+
/ ΣF
e (F
lank
Met
hod)
FIGURE 17. Comparison of the Fe3+/ΣFe ratio for natural garnets as determined by the ∆ ratio ß ank method with Mössbauer results
Ene
rgy
(uns
cale
d)
electronoccupancy
Emission Absorption
N1
M4,5
M2,3
M1
2
6
422
L34
L22
Lα705 eV
Lβ718 eV
Fe0
4s2
3d6
[Ar]
Fe2+dod
t2g
eg
2p3/22p1/2
FIGURE 18. Schematic representation of the electron transitions involved in FeL X-ray emission and absorption processes. The crystal-Þ eld splitting of the 3d electronic levels of Fe2+ in the dodecahedral site in garnet is shown as proposed by Newman et al. (1978).
0.2
0.4
0.6
0.8
1.0
1.2
1.4
1.6
0 20 40 60 80
VIII
}}
}amphibole Jeol JXA 8600
garnet wüstite
spinel
olivine hematite,ilmenite
pyroxene
Cameca SX50
Camebax
Fe2+ (wt%)
Lβ / Lα
10 kV VIII
VI
VI
VI
VI, IV
FIGURE 19. Change in the slope of the dependency of Lβ/Lα on Fe2+ as a function of the Fe2+coordination number. The slope generally decreases with a decreasing Fe coordination number in the coordination polyhedra.
HÖFER AND BREY: IRON OXIDATION STATE BY ELECTRON MICROPROBE884
ACKNOWLEDGMENTSWe are indebted to the sample donators listed in Table 1. Help and assistance
with the Cameca microprobes by B. Schulz-Dobrick (Mainz), S. Weinbruch (Darmstadt), and T. Fehr (München) are thankfully acknowledged. Andrei Girnis is specially thanked for his support in data processing and his continuous advice in various matters. We also thank F. Langenhorst, M. Wilke, and S. Lauterbach as well as the associate editor D. Harlov for their constructive reviews. Margaret Hanrahan helped with polishing up the English.
REFERENCES CITEDAlbee, A.L. and Chodos, A.A. (1970) Semiquantitative electron microprobe deter-
mination of Fe2+/Fe3+ and Mn2+/Mn3+ in oxides and silicates and its application to petrologic problems. American Mineralogist, 55, 491�501.
Armstrong, J.T. (1999) Determination of chemical valence state by X-ray emission analysis using electron beam instruments: Pitfalls and Promises. Analytical Chemistry, 71, 2714�2724.
Bajt, S., Sutton, S.R., and Delaney, J.S. (1994) X-ray microprobe analysis of iron redox states in silicates and oxides using X-ray absorption near edge structure (XANES). Geochimica Cosmochimica Acta, 58, 5209�5214.
Berry, A.J., O�Neill, H.S.C., Jayasuriya, K.D., Campbell, S.J., and Foran, G.J. (2003) XANES calibrations for the oxidation state of iron in a silicate glass. American Mineralogist, 88, 967�977.
Cressey, G., Henderson, C.M.B., and van der Laan, G. (1993) Use of L-edge X-ray absorption spectroscopy to characterize multiple valence states of 3d transition metals; a new probe for mineralogical and geochemical research. Physics and Chemistry of Minerals, 20, 111�119.
de Groot, F.M.F. (2001) High-Resolution X-ray Emission and X-ray Absorption Spectroscopy. Chemical Reviews, 101, 1779�1808.
Delaney, J.S., Dyar, M.D., Sutton, S.R., and Bajt, S. (1998) Redox ratios with relevant resolution; solving an old problem by using the synchrotron micro-XANES probe. Geology, 26, 139�142.
Duncumb, P. (1993) Correction procedures in electron probe microanalysis of bulk samples. 3rd European Workshop of the European Microanalytical Society, p. 25�44, Rimini.
Dyar, M.D., Lowe, E.W., Guidotti, C.V., and Delaney, J.S. (2002) Fe3+ and Fe2+ partitioning among silicates in metapelites: A synchrotron micro-XANES study. American Mineralogist, 87, 514�522.
Enders, M., Speer, D., Maresch, W.V., and McCammon, C.A. (2000) Ferric/fer-rous iron ratios in sodic amphiboles: Mössbauer analysis, stoichiometry-based model calculations and the high-resolution microanalytical ß ank method. Contributions to Mineralogy and Petrology, 140, 135�147.
Fialin, M., Wagner, C., Métrich, N., Humler, E., Galoisy, L., and Bézos, A. (2001) Fe3+/ΣFe vs. Fe Lα peak energy for minerals and glasses: Recent advances with the electron microprobe. American Mineralogist, 86, 456�465.
Fialin, M., Bézos, A., Wagner, C., Magnien, V., and Humler, E. (2004) Quantitative electron microprobe analysis of Fe3+/ΣFe: Basic concepts and experimental protocol for glasses. American Mineralogist, 89, 654�662.
Fischer, D.W. and Baun, W.L. (1968) Band structure and the Titanium LII,III X-ray emission and absorption spectra from pure metal, oxides, nitride, carbide, and boride. Joural of Applied Physics, 30, 4757�4776.
Garvie, L.A.J. and Craven, A.J. (1994) Use of electron-energy loss near-edge Þ ne structure in the study of minerals. American Mineralogist, 79, 411�425.
Geiger, C.A. and Feenstra, A. (1997) Molar volumes of mixing of almandine-pyrope and almandine-spessartine garnets and the crystal chemistry and thermodynamic-mixing properties of the aluminosilicate garnets. American Mineralogist, 82, 571�581.
Geiger, C.A. and Rossman, G.R. (1994) Crystal Þ eld stabilization energies of almandine-pyrope and almandine-spessartine garnets determined by FTIR near infrared measurements. Physics and Chemistry of Minerals, 21, 516�525.
Geiger, C.A., Newton, R.C., and Kleppa, O.J. (1987) Enthalpy of mixing of synthet-ic almandine-grossular and almandine-pyrope garnets from high-temperature solution calorimetry. Geochimica Cosmochimica Acta, 51, 1755�1763.
Glatzel, P. and Bergmann, U. (2005) High Resolution 1s core hole X-ray spectros-copy in 3d transition metal compexes�electronic and structural information. Coordination Chemistry Reviews, 249, 65�95.
Golla, U. and Putnis, A. (2001) Valence state mapping and quantitative electron spectroscopic imaging of exsolution in titanohematite by energy-Þ ltered TEM. Physics and Chemistry of Minerals, 28, 119�129.
Höfer, H.E. (2002) QuantiÞ cation of Fe2+/Fe3+ by electron microprobe analy-sis�New Developments. HyperÞ ne Interactions, 144/145, 239�248.
Höfer, H.E., Brey, G.P., Schulz-Dobrick, B., and Oberhänsli, R. (1994) The deter-mination of the oxidation state of iron by the electron microprobe. European Journal of Mineralogy, 6, 407�418.
Höfer, H.E., Brey, G.P., and Oberhänsli, R. (1995) The determination of the oxida-tion state of iron in synthetic garnets by X-ray spectroscopy with the electron microprobe. Physics and Chemistry of Minerals, 23, 241.
Höfer, H.E., Weinbruch, S., McCammon, C.A., and Brey, G.P. (2000) Comparison of two electron probe microanalysis techniques to determine ferric iron in
synthetic wüstite samples. European Journal of Mineralogy, 12, 63�71. Höfer, H.E., Brey, G.P., and Hibberson, W.O. (2004) Iron oxidation state determina-
tion in synthetic pyroxenes by electron microprobe. Lithos, 73, 551.Jayasuriya, K.D., O�Neill, H.S.C., Berry, A.J., and Campbell, S.J. (2004) A
Mössbauer study of the oxidation state of Fe in silicate melts. American Mineralogist, 89, 1597�1602.
Liefeld, R.J. (1968) Soft X-ray emission spectra at threshold excitation. In D.J. Fabian, Ed., Soft X-ray band spectra and the electronic structure of metals and materials, p. 133�149. Academic Press, London and New York.
McCammon, C.A., Chaskar, V., and Richards, G.G. (1991) A technique for spatially resolved Mössbauer spectroscopy applied to quenched metallurgical slags. Measurement Science and Technology, 2, 657�662.
McCammon, C.A., GrifÞ n, W.L., Shee, S.R., and O�Neill, H.S.C. (2001) Oxidation during metasomatism in ultramaÞ c xenoliths from the Wesselton kimberlite, South Africa: implications for the survival of diamond. Contributions to Mineralogy and Petrology, 141, 287�296.
McGuire, A.V., Francis, C.A., and Dyar, M.D. (1992) Mineral standards for micro-probe analysis of oxygen. American Mineralogist, 77, 1087�1091.
Newman, D.J., Price, D.C., and Runciman, W.A. (1978) Superposition model analysis of the near infrared spectrum of Fe2+ in pyrope-almandine garnets. American Mineralogist, 63, 1278�1281.
O�Neill, H.St.C., Berry, A.J., McCammon, C.A., Jayasuriya, K.D., Campbell, S.J., and Foran, G.J. (2006) An experimental determination of the effect of pres-sure on the Fe3+/ΣFe ratio of ananhydrous silicate melt to 3.0 GPa. American Mineralogist, 404�412.
O�Nions, R.K. and Smith, D.G.W. (1971) Investigations of the LII,III X-ray emission spectra of Fe by electron microprobe. Part 2�The Fe LII,III spectra of Fe and Fe-Ti oxides. American Mineralogist, 56, 1452�1463.
Pavićević, M.K., Amthauer, G., and El Goresy, A. (1989) X-ray L-emission of iron in silicate garnets. Journal of the Serbian Chemical Society, 7, 359�371.
Raeburn, S.P., Ilton, E.S., and Veblen, D.R. (1997a) Quantitative determination of the oxidation state of iron in biotite using X-ray photoelectron spectroscopy: I. Calibration. Geochimica et Cosmochimica Acta, 61, 4519�4530.
��� (1997b) Quantitative determination of the oxidation state of iron in biotite using X-ray photoelectron spectroscopy: II. In situ analysis. Geochimica et Cosmochimica Acta, 61, 4531�4537.
Rankenburg, K. (2002) Megacrysts in volcanic rocks of the Cameroon Volcanic Line - Constraints on magma genesis and contamination, 146 p. PhD Thesis in Mineralogy, University of Frankfurt (in German).
Rankenburg, K., Lassiter, J.C., and Brey, G.P. (2004) Origin of megacrysts in volcanic rocks of the Cameroon volcanic chain�constraints on magma genesis and crustal contamination. Contributions to Mineralogy and Petrol-ogy, 147, 129�144.
Rösler, M. (1989) Bestimmung und Beurteilung von Mineralstandards mit der Elektronenstrahlmikrosonde. Diploma Thesis in Mineralogy, p. 52. University of Tübingen.
Schmid, R., Wilke, M., Oberhänsli, R., Janssens, K., Falkenberg, G., Franz, L., and Gaab, A. (2003) Micro-XANES determination of ferric iron and its application in thermobarometry. Lithos, 70, 381�392.
Tossell, J.A., Vaughan, D.J., Johnson, K.H. (1974) The electronic structure of rutile, wüstite, and hematite from molecular orbital calculations. American Mineralogist, 59, 319�334.
van Aken, P.A. and Liebscher, B. (2002) QuantiÞ cation of ferrous/ferric ratios in minerals: new evaluation schemes of the L23 electron energy near-edge spectra. Physics and Chemistry of Minerals, 29, 188�200.
van Aken, P.A., Liebscher, B., and Styrsa, V.J. (1998) Quantitative determination of iron oxidation state in minerals using FeL23-edge electron energy-loss near-edge structure spectroscopy. Physics and Chemistry of Minerals, 25, 323�327.
van Aken, P.A., Styrsa, V.J., Liebscher, B., Woodland, A.B., and Redhammer, G.J. (1999) Microanalysis of Fe3+/ΣFe in oxide and silicate minerals by investiga-tion of electron energy-loss near-edge structures (ELNES) at the Fe M2,3 edge. Physics and Chemistry of Minerals, 26, 584�590.
Wilke, M., Farges, F., Petit, P.-E., Brown Jr., G.E., and Martin, F. (2001) Oxidation state and coordination of Fe in minerals: An Fe K-XANES spectroscopic study. American Mineralogist, 86, 714�730.
Woodland, A.B. and O�Neill, H.St.C. (1993) Synthesis and stability of Fe3
2+Fe23+Si3O12 garnet and phase relations with Fe3Al2Si3O12-Fe3
2+Fe23+Si3O12
solutions. American Mineralogist, 78, 1002�1015.Woodland, A.B. and Ross II, C.R. (1994) A crystallographic and Mössbauer spec-
troscopy study of Fe32+Al2Si3O12-Fe3
2+Fe23+Si3O12, (Almandine-�Skiagite�) and
Ca3 Fe23+Si3O12-Fe3
2+Fe23+Si3O12 (Andradite-�Skiagite�) garnet solid solutions.
Physics and Chemistry of Minerals, 21, 117�132.
MANUSCRIPT RECEIVED JULY 19, 2006MANUSCRIPT ACCEPTED DECEMBER 18, 2006MANUSCRIPT HANDLED BY DANIEL HARLOV
HÖFER AND BREY: IRON OXIDATION STATE BY ELECTRON MICROPROBE 885
APPENDIX
Summary of measurement procedure
The following gives a practical overview on how to use the ß ank method with either a Cameca or a Jeol microprobe.
(a) Spectrometer calibration (daily procedure)(1) 25 kV, 80 nA: peak search for FeKα (9th order) on Fe
metal (Integral mode; optimize SCA (PHA) conditions of the TAP spectrometer to be used for the ß ank method measurements for this line). For best resolution, always use the smallest available detector slit for this spectrometer (300 μm for Jeol JXA 8900).
(2) Quick qualitative scan over this peak for better deÞ ni-tion of peak maximum (2�3 min).
(3) DeÞ ne the FeKα (9th order) on Fe metal for the Cameca microprobe after (following Höfer et al. 2000, cf. p. 66�67 and Fig. 3). For our Jeol microprobe, we have written a program �PeakFitH,� which automatically runs the routine (4) below. This program can be obtained free of charge from the Þ rst author.
(4) Run the program PeakFitH for the TAP spectrometer with the newly deÞ ned value for the FeKα (9th order) peak maxi-mum: 3 repetitions at 6 spectrometer positions are sufÞ cient, count-ing time per position: 100 s (Jeol; 10 min); or accumulation to a certain number of counts (see Höfer et al. 2000). The 6 measuring positions (�window� values, i.e., the symmetrical distances of fe1 and fe2 around the peak maximum, see Fig. 3 in Höfer et al. 2000) may have to be adjusted to your spectrometer (our values for Jeol: window 52 μm, shift 14 μm; for Cameca: window 25 sinΘ steps, shift 5 sinΘ steps).
(5) Transfer the results (intensities and beam current values) into an Excel spreadsheet; calculate beam current-nor-malized ratios fe1/fe2 (according to Höfer et al. 2000).
(6) Plot the 3 values for fe1/fe2 vs. the spectrometer posi-tion, calculate the corresponding regression line and the spec-trometer shift for fe1/fe2 = 1 for the current measuring day. Note: fe1/fe2 = 1 if the peak is symmetrical in this region, otherwise take another value suitable for your spectrometer. This value also represents an external energy calibration if it is set equal to the theoretical value of FeKα (9th order). The fe1/fe2 value is speciÞ c for every spectrometer and microprobe, and should be maintained as an internal reference and as energy calibration for all ß ank-method measurements.
(7) This complete procedure takes about 30 min.(b) Flank-method measurement(1) After the spectrometer calibration, set the microprobe
to 15 kV, 60 nA.(2) Create the measurement condition Þ le. For a combined
ß ank method and quantitative analysis, load a suitable quantita-tive measurement program. You may increase counting times for
the elements to obtain the best quantitative results since one TAP spectrometer will be busy carrying out ß ank measurements for 10 minutes. Add two �fake� elements for the ß ank method measure-ments, e.g., As for FeLα and Br for FeLβ. Insert the TAP fake �peak� position for the ß ank method measurements by adjusting it with the spectrometer shift value from the above calibration procedure (6) of the day. The fake �peak� measurement positions for FeLα and FeLβ have to be determined only once from differ-ence spectra (Fig. 1) when you begin ß ank measurements with your microprobe. Please ensure that you have gone through the spectrometer calibration procedure beforehand. Allow long mea-suring times for FeLα and FeLβ such as 300 s each, no background measurements, differential mode, narrow energy window to avoid overlaps with higher-order X-ray emission lines, and optimized SCA (PHA) conditions for FeLα on Fe metal.
(3) The statistically more precise method is to set a cer-tain number of counts to be accumulated (Höfer et al. 1994). However, our Jeol microprobe does not allow this for low count rates at present. We therefore resorted to 300 s counting times on each peak. To avoid contamination artifacts, measure Lβ Þ rst and then Lα on the same spectrometer. We also tested longer measuring times of 600 s each that are free of contamination effects. To increase counting statistics, we suggest increasing the number of measurements but not necessarily the counting time. If your sample is homogeneous and you wish to increase the total number of points, you may choose measurement times shorter than 300 s on single points and average the data. But the longer 10 min measurement times (300 s on each position) have the advantage that good quantitative results are achieved simultaneously with the Fe3+/ΣFe determination.
(4) Input the measured points by using the usual quantitative measurement program. Begin by measuring an almandine-rich sample as a reference to monitor the quality of the ß ank-method measurement. One measurement for this is enough. Then measure 2�3 standard samples with different Fe3+/ΣFe and/or total Fe contents. Next, measure your samples (preferably also 10 times or more on different spots). Insert a few measurements on almandine every now and then to check the stability of the spectrometer.
(5) Run the program routinely.(6) For quantitative determination, run an off-line matrix
correction by kicking out the 2 �fake� elements, As and Br.(7) For ß ank-method ratios, run a summary with net in-
tensities of only As and Br. Add the beam current values to the summary. Insert these data into an Excel spreadsheet. Multiply the net intensities (cps/μA) by the beam current to obtain count rates and calculate the ß ank method ratios.
(8) These data can be used for Fe3+/ΣFe determination.