effects of iranian economic reforms on equity in social ... · 1 | p a g e effects of iranian...
TRANSCRIPT
1 | P a g e
Effects of Iranian Economic Reforms on Equity in Social
and Healthcare Financing: A Segmented Regression
Analysis
Hamed Zandian1,2, , Amirhossein Takian2,3, Arash Rashidian2, Mohsen Bayati4, Telma
Zahirian Moghadam5 , Satar Rezaei6 , Alireza Olyaeemanesh2,7*
1. Social Determinants of Health (SDH) Research Center, Ardabil University of Medical Sciences, Ardabil, Iran.
2. Department of Health Management and Economics, School of Public Health, Tehran University of Medical
Sciences, Tehran, Iran.
E-mail: [email protected]
E-mail: [email protected]
3. Department of Global Health and Public Policy, School of Public Health, Tehran University of Medical Sciences,
Tehran, Iran.
E-mail: [email protected]
4. Health Human Resources Research Center, School of Management and Information Sciences, Shiraz University
of Medical Sciences, Shiraz, Iran
E-mail: [email protected]
5. Health Management and Economics Research Center, Iran University of Medical Sciences, Tehran, Iran
E-mail: [email protected]
6. Research Center for Environmental Determinants of Health, Kermanshah University of Medical Sciences,
Kermanshah, Iran
E-mail: [email protected]
7. National Institute of Health Research, Group of Payment and Financial Resources of the Health System, Tehran
University of Medical Sciences, Tehran, Iran
Funding Source: This manuscript was fully sponsored by Tehran University of Medical Sciences (TUMS)
(grant number: 9021557003).
Corresponding author: Alireza Olyaeemanesh, National Institute of Health Research, Group of Payment
and Financial Resources of the Health System, Tehran University of Medical Sciences, Tehran, Iran. E-mail:
Word count for the abstract: 251 Word count for the text: 3612
Number of Tables: 3 Number of Figures: 2
메모 [A1]: Is an author missing from this list? Please check and revise if needed.

2 | P a g e
Abstract
Objectives
One of the main objectives of the Targeted Subsidies Law (TSL) in Iran was to
improve equity in healthcare financing. This study aimed at measuring the effects of
the TSL, which was implemented in Iran in 2010, on equity in healthcare financing.
Methods
Segmented regression analysis was applied to assess the effects of TSL
implementation on the Gini and Kakwani indices of outcome variables in Iranian
households. Data for the years 1977-2014 were retrieved from formal databases.
Changes in the levels and trends of the outcome variables before and after TSL
implementation were assessed using STATA version 13.
Results
In the 32 years before the implementation of the TSL, the Gini index decreased from
0.401 to 0.381. The Gini index and its intercept significantly decreased to 0.362
(P<.001) 5 years after the implementation of the TSL. There was no statistically
significant change in the GDP or inflation rate after TSL implementation. The
Kakwani index significantly increased from −0.02 to 0.007 (P<.001) before the
implementation of the TSL, while we observed no statistically significant change
(P=.813) in the Kakwani index after TSL implementation.
Conclusions
메모 [A2]: Should this be “33” to agree with how this interval is described elsewhere in the paper?
메모 [A3]: Can “and its intercept” be deleted here, since it seems that only the specific value is given?
서식 있음: 글꼴: 기울임꼴
서식 있음: 글꼴: 기울임꼴
서식 있음: 글꼴: 기울임꼴

3 | P a g e
The TSL reform, which was introduced as part of an economic development plan in
Iran in 2010, led to a significant reduction in households’ income inequality.
However, the TSL did not significantly affect equity in healthcare financing. Hence,
while measuring the long-term impact of TSL is paramount, healthcare decision-
makers need to consider the efficacy of the TSL in order to develop plans for
achieving the desired equity in healthcare financing.
Key words: Equity, healthcare financing, income inequality, Social Justice, Targeted
Subsidies Law (TSL), Segmented regression analysis.
Introduction
Spiraling healthcare expenditures, due to expensive modern medical technologies
and citizens’ ever-increasing expectations, may lead to challenges such as
catastrophic health expenditures and inequality in access to healthcare [1]. Health
systems have been attempting to improve and maintain population welfare through
contextually appropriate models of healthcare financing. Nevertheless, financial
shortages have consistently hampered the achievement of these objectives [2].
Ensuring equity in health financing is an important objective of healthcare
systems [3]. Many studies in recent years in developing countries, including Iran,
have emphasized the importance of equity in healthcare financing [4, 5].
The main source of primary healthcare financing in Iran is the public sector. The
private and public sectors simultaneously provide secondary and tertiary service
delivery and financing [4]. Thus, healthcare financing in Iran is complex and
메모 [A4]: Please confirm that this revision accurately matches your intended meaning. The original wording did not make a clear suggestion, so this revision was made to be more specific-sounding without adding unintended implications.

4 | P a g e
multifaceted. Despite reforms to improve equity in healthcare financing, such as the
implementation of a family physician program and, recently, the Health
Transformation Plan [6], the proportion of out-of-pocket healthcare expenditures is
still high [7, 8]. Healthcare financing indicators, such as out-of-pocket and
catastrophic health expenditures, did not show a clear trend or status, and were not
at appropriate levels in Iran during the last decades [9, 10]. For instance,
approximately 58% of health expenditures were out-of-pocket in 2001, and 10
years later, in 2011, this figure decreased to 52% [8]. Moreover, several national-
level studies have shown that the concentration index for capacity to pay and
healthcare payments implied inequality [5, 11] and that annually, healthcare
expenditures caused almost 1.8% percent of the society’s population fall below the
poverty line [12]. The fair financing contribution index in 2006 was approximately
0.854, and it dropped to 0.842 in 2011 [13]. In general, these measures indicate the
complexity and multidimensionality of healthcare financing in Iran.
Recently, the Iranian government has focused attention on ensuring equitable
healthcare financing by developing the Targeted Subsidies Law (TSL). The TSL was
the most important economic reform in Iran after the Islamic Revolution in 1978,
and made Iran the first major oil-exporting country to substantially reduce implicit
energy subsidies [14]. The implementation of the TSL began in 2010, when the
government eliminated energy subsidies (i.e., the subsidy for gas and oil) and
replaced them with cash payments to eligible citizens. As a result of this reform,
메모 [A5]: Please confirm that this figure of 1.8% specifically refers to health care expenditures.

5 | P a g e
domestic energy and agricultural prices increased by up to 20 times [14]. In the first
12 months following TSL implementation (December 2011), approximately USD 30
billion in freely usable cash was distributed to Iranian households, and another USD
10-15 billion will have been advanced to enterprises to finance investment in
restructuring aimed at reducing energy intensity. Additionally, during this time, the
reform planned to raise only an estimated 200 trillion rials (USD 20 billion) in
additional revenues from price increases [14, 15].
One of the main purposes of the TSL was to reduce income inequality by decreasing
the income gap across deciles, aiming to combat and reduce poverty [16]. Paragraph
B of Article 7 of the TSL directly notes the government is bound to implement a
comprehensive social security system for the targeted population, by taking
measures such as: (i) providing and expanding social insurance and healthcare
services, and ensuring and enhancing public health and medical coverage for special
and difficult-to-cure diseases; (ii) providing assistance for financing housing costs,
enhancing resistance of buildings, and creating employment; and (iii) empowering
and implementing social support programs by allocating funds from rising prices for
energy carriers to the health sector in order to ensure equity in healthcare
financing [17].
A qualitative study reported the challenges posed by the unpredictability of
healthcare financing in Iran [18] to be one of the reasons for high out-of-pocket
payments . The government of Iran introduced the TSL to ensure a more
메모 [A6]: Please confirm. Another possibility might be “to compensate for” instead of “from”.
메모 [A7]: Is this from an official translation? If not, I would suggest “structural stability”.

6 | P a g e
sustainable and equitable healthcare financing system, among other goals. Little
evidence is available to demonstrate the impact of the TSL on equity in healthcare
financing in Iran. This study aimed to measure the effects of TSL implementation on
income inequality and equity in healthcare financing in Iran.
Methods and analysis
Study setting
Iran is a middle-income country of almost 80 million citizens that is located in west
Asia. The gross national income per capita for Iran is about 15 and total health
expenditures account for approximately 6.9% of the gross domestic product (GDP).
The total expenditure on health per capita (Intl $, 2014) is 1.082 [19].
Based on what is articulated in upstream documents, such as the Law of the Fourth
Economic, Social, and Cultural Development Plan, improving equity in healthcare
financing is one of the main goals of the Iranian health system [20]. The TSL, which
was implemented in 2010, is considered to be one of the reforms that covered entire
social sectors, such as the healthcare system, with the aim of ensuring equity.
Study design
Segmented regression analysis, a powerful method of interrupted time series
analysis [21], was conducted to estimate the effect of the TSL on income inequality
and equity in healthcare financing. We used segmented regression analysis to assess
the extent to which the TSL brought changes to these indicators immediately during
the intervention period and over a longer time period (1977-2014). In this analysis,
메모 [A8]: Please indicate units.

7 | P a g e
the time of the intervention was considered to be the changing point. We assumed
that the TSL implementation had positive effects on equity in healthcare financing in
Iran.
Variables
In this study, the Gini index and Kakwani index were the main outcome variables,
while the GDP, inflation rate, infant mortality rate, and the proportion of the
population 60 years old and above were the control variables. The data for the years
1977 to 2014 were retrieved from the annual household income-expenditures
survey reports of the National Statistics Center of Iran, the Ministry of Health and
Medical Education, and the World Bank’s official website. The annual household
income-expenditures survey data of the National Statistics Center of Iran are
believed to be of the required quality. These data have also been used by other
studies on healthcare equity and household expenditures on healthcare [4]. The
data include detailed measures of household expenditures on goods and services
such as healthcare, as well as household income. The healthcare expenditure data
distinguish consumer co-payments from health insurance premiums, enabling us to
calculate inequality measures for these 2 items separately, as well as together [4,
12].
The Gini index was computed using the annual household income-expenditures
survey reports and the annual aggregated number of households from 1977 to 2014.
This was carried out as a preliminary analysis to determine the effect of the TSL on

8 | P a g e
income inequality using segmented regression analysis. The Gini index can be
mathematically expressed as follows:
(1)
Where the Gini index represents the aggregated Gini index; yi is the ith decile of
household income, yi+1 is the (i+1)th decile of the next household income, xi is the
number of households, and xi+1 is the number of the next households in the (i+1)th
decile [22].
Furthermore, the Kakwani index, which shows the progressivity of healthcare
financing, was calculated using the following formula.
;
Where CI is the concentration index and GI is the Gini index. The concentration
index, which is a widely applied technique in health economic studies [23], was
calculated to measure the inequality in total household expenditures on healthcare
from 1988 to 2014. This period was used because household expenditures on
healthcare data as deciles were available starting in 1988. This index corresponds to
the area between the concentration curve and the perfect equality line (45°). A
concentration index of 0 shows an absence of inequality between the rich and the
poor; a positive value indicates that the concentration curve lies below the perfect
equality line, implying a pro-rich inequality; and a negative value shows inequality

9 | P a g e
in favor of the poor [24]. Overall, the concentration index can be represented
mathematically as follows [25]:
(2)
Where P represents the cumulative percentage declines in population income and L
household expenditures on healthcare, respectively.
The Kakwani index was calculated from the Gini index and concentration index
models presented in Equations 1 and 2, respectively, as a basis for the segmented
regression analysis. The computed Kakwani index values range from −2 to 1. A value
of −2 shows severely regressive healthcare financing and a value of 1 indicates
strongly progressive healthcare financing [25]. Generally, the area between the
concentration curve and the Lorenz curve represents the Kakwani index [25].
Control variables
The GDP is one of many macroeconomic indicators, and it usually has an effect on
other economic variables [24]. The inflation rate is another independent variable
that can affect other economic variables. The inflation rate in Iran has been very
high during the past 3 decades [26]. High inflation can occur when there is an
imbalance between the availability of commodities in society and the amount of
cash in circulation. It can also be affected by economic reforms. Hence, the annual
GDP and 12-month average inflation rates for the years 1977-2014 were used as
control variables for the analysis.

10 | P a g e
Furthermore, the number of deaths among under-1-year-old children per 1000 live
births (the infant mortality rate) for the years 1977-2014 and the proportion of
people aged 60 years and above for the years 1988-2014 were included in our
analysis as control variables related to health system outcome indicators.
Modeling the segmented regression analysis
We used the backward approach to estimate the effect of the TSL on income
inequality and equity in healthcare financing. Initially, the Gini index was calculated
to estimate the effect of the TSL on total income inequality. This is mathematically
presented as follows:
(3)
Where represents the Gini index at year t, is the Gini index trend before
the intervention, is the change in the intercept of the Gini index after
intervention, is the trend change after the intervention, represents the
gross domestic product, is the inflation rate, and is the random variability
that is not explained by the model.
Furthermore, the Kakwani index was calculated to determine the effect of the TSL
on equity in healthcare financing. This is presented in the equation below.
(4)
메모 [A9]: Can this be changed to tbefore? Unless there is some kind of character limit, it would probably be preferable to use the full word “before” to correspond to “after.”

11 | P a g e
Where is the Kakwani index as an indicator of healthcare financing equity at
year t; is the infant mortality rate, and is the ratio of the population over
the age of 60 years.
Furthermore, the absolute effect of the TSL intervention on income inequality (Gini
index) (Equation 8) was calculated by subtracting the value of Equation 7 from the
value of Equation 6. This is mathematically presented as follows.
(5)
(6)
(7)
Statistical analysis
A segmented regression analysis was carried out on the calculated values of the Gini
index and Kakwani index to determine the effects of the TSL, which was
implemented in 2010. The analysis was conducted to see whether there were
changes in the level and trend of these variables during, before, and after the
implementation of the TSL. The effect of the intervention was detected by
comparing the value of the intercept and trend before and after the
intervention [21]. To detect the effect of an intervention using segmented regression
analysis, at least 3 time series observations before and 3 times series observations
after are required [27]. Accordingly, this analysis applied 33 yearly Gini index
observations before and 5 yearly Gini index observations after the intervention.
Similarly, we used 22 yearly Kakwani index observations before and 5 yearly

12 | P a g e
Kakwani index observations after the intervention. The stepwise elimination
method was used to exclude non-significant independent variable from the fitted
model. Hence, the model from which all non-significant variables were removed
could be considered parsimonious.
The final fitted model was assessed for autocorrelation, co-integration of the
variables, and any spurious regression. Thus, the Durbin-Watson statistic was
estimated on the residuals of the fitted model. Results closer to 2 indicate the
absence of autocorrelation [28]. This test yielded nonstationary results for almost
all the variables [Tables 2 and 3]. The Breusch-Pagan diagnostic test for
heteroscedasticity was also done on the residuals. The null hypothesis (H0) of this
test was that the variances of the variables were same, and the decision was made at
P values less than .05. Finally, the Shapiro-Wilk W test was performed to assess the
normality of the residuals.
The findings are presented as numeric, percentage, and mean values and are
presented graphically and in tables. All analyses were performed using STATA
version 13 (StataCorp, College Station, TX, USA).
Ethics statement
The Research and Ethics Committee of Tehran University of Medical Sciences
approved the protocol of this study on August 12, 2014 (No. 9021557003).
Results
메모 [A10]: Please confirm.
서식 있음: 글꼴: 기울임꼴

13 | P a g e
The Gini index during the time series period (1977 to 2014) had a negative trend
(Table 1). The mean Gini index decreased from 0.401 in the 1980s to 0.381 in 2010,
and then to 0.362 in 2014. The maximum level of the Gini index was 0.401 in the
1990s and the minimum level was 0.362 in 2014. The GDP increased over time
between 1977 and 2014. The average inflation rate increased from 15.5% in 1977-
1980 to 24.03% in 1990-2000, and then decreased to 12.42% during 2000-2010.
The maximum and minimum inflation rates were 24.3% and 12.42%, respectively.
The infant mortality rate decreased over time, while the proportion of people over
the age of 60 years increased, from 3.03% in 1977 to 5.28% in 2014.
Table 1. Trends of the Gini index, concentration index, Kakwani index, gross domestic product
(GDP), inflation rate, infant mortality rate (IMR), and proportion of the population over 60 years,
1977-2014
Furthermore, the concentration Index showed that inequality in healthcare
expenditures decreased from 1988 to 2014. However, the trend of the concentration
index showed considerable oscillation. The highest concentration index was in 2012
and the lowest was in 2014. The Kakwani index also showed fluctuating findings,
although improvements in the indices were noted after 2012. The average Kakwani
index of healthcare financing during the first 10 years (1990-2000) was more
equitable (K=0.025) than was observed in the last 10 years before the
implementation of the TSL (2000-2009, K=−0.021). We found no statistically
significant effect (P>.05) on equity in healthcare financing after the implementation
메모 [A11]: The previous sentence describes this value as being from the 1980s. Please check, and if possible, provide a more specific year.
메모 [A12]: Please confirm that these units are correct.
서식 있음: 글꼴: 기울임꼴

14 | P a g e
of the TSL. Nevertheless, the general trend of the Kakwani index during the TSL
implementation period showed an increase, from −0.05 to 0.001.
The segmented regression analysis estimated the Gini index of the different models,
as shown in Table 2a. The most parsimonious model showing the effect of the TSL
on income inequality was model D. The F statistic value (31.17) and adjusted
coefficient of determination (R2 = 73.3%) in this model were higher than in the
other models. There was a statistically significant (P<.001) decrease in the slope of
the mean Gini index before the intervention (1977 to 2010). Immediately after the
intervention of the TSL, the level of the mean Gini Index dropped by −0.032,
showing a statistically significant (P<.001) immediate reduction in income
inequality, although there was no significant change in the slope of the mean Gini
index during the period after the intervention (2010 to 2014, P=.08) [Table 2b].
Thus, the TSL implementation led to a reduction of the Gini index by 0.08, but the
effect of the TSL on reducing income inequality was very small [Fig. 1].
Table 2. Parameter estimates of segmented regression analysis …
Figure 1. Distribution of the Gini index during the study period (1977-2014)…
Effect of the TSL on equity in healthcare financing
The segmented regression analysis revealed that the TSL did not have any
statistically significant effect on the level or trend of the Kakwani index in either of
서식 있음: 글꼴: 기울임꼴
서식 있음: 글꼴: 기울임꼴
서식 있음: 글꼴: 기울임꼴
메모 [A13]: Please revise the figure legend to correspond to this text (the parts after “2014” need no revision).

15 | P a g e
the models [Table 3]. The F statistic of the Kakwani index model D showed it to be a
well-fitted model (F=31.17, P<.001) and the index before the intervention was
decreasing to a significant extent (P<.001), by 0.07 annually. Our study revealed no
statistically significant (P = .36) change in the trend of Kakwani index after the
implementation of the TSL [Fig. 2]. Over time, there was a negligible but statistically
significant (P<.001) positive effect of the inflation rate on the Kakwani index.
Table 3. Parameter estimates of segmented regression analysis …
Figure 2. Distribution of the Kakwani index during the study period (1988-2014)…
Discussion
The TSL was a recent reform that was implemented in Iran in 2010 [29]. This
reform was part of the economic development plan of the country, the fundamental
aim of which was to reduce income inequality among Iranian households and to
improve equity in healthcare financing by implementing comprehensive social
security [14]. The Gini index, inflation rate, and GDP are indicators that are strongly
influenced by economic conditions [30].
The findings of this study revealed that TSL implementation had a positive effect on
the Gini index in Iran. The Gini index showed a negative trend in income inequality
before the implementation of the TSL, which may indicate a gradual decline in
income inequality over time. However, this was not statistically significant. Income
inequality decreased immediately after the implementation of the TSL. Evidence has
서식 있음: 글꼴: 기울임꼴
서식 있음: 글꼴: 기울임꼴
서식 있음: 글꼴: 기울임꼴
서식 있음: 글꼴: 기울임꼴
메모 [A14]: Please revise the figure legend to correspond to this text (the parts after “2014” need no revision).

16 | P a g e
been found of a correlation between income inequality and healthcare outcomes
[31]. Another study likewise reported a relationship between income inequality and
increased stroke mortality [32].
Our study found no statistically significant relationships between the Gini index and
the inflation rate and GDP after the implementation of the TSL. Although previous
studies have found an increasing inflation rate and a decreasing trend in the
GDP [33], some have reported a positive association between inflation rate and
income inequality [34]. However, the reduction in income inequality may be due to
at least 2 reasons: the effects of the recently introduced TSL reform and the lag of
the effect of the inflation rate on income inequality. The reduction in income
inequality after the implementation of the TSL indicates the conformity of the
reform with its planned objectives of redistributing wealth and reducing income
inequality among citizens. Several other studies have reported that subsidies and
reducing taxation resulted in equitable income distributions [23, 35] .
Equity in healthcare financing is one of the main indicators of sound healthcare
system performance [25]. Our study revealed a progressive healthcare financing
trend over time, which is consistent with progressive healthcare insurance
payments (positive slope of the Kakwani index) [4, 36] . Furthermore, a positive
Kakwani index, indicating improvements in health expenditures, was also
reported [3, 37]. In contrast, studies in Iran and other developing countries have

17 | P a g e
reported regressive healthcare financing, indicating that low-income households
pay more for healthcare than others [36, 38].
The segmented regression analysis in our study did not show a significant effect of
TSL on equity in healthcare financing (Kakwani index). However, this study revealed
a positive trend in the Kakwani index before the introduction of the TSL. This may
have been due to other health sector-related reforms introduced before the TSL
implementation, as well as the lack of proper implementation of the TSL and
insufficient funds paid to the health system [18]. Another study reported that
equity-based healthcare reform significantly reduced income-related inequality [39].
Moreover, studies have shown positive effects of economic or health system reforms
on equity in healthcare financing [40]. Hu et al., in a study of employment practices,
taxation, and workers’ health/welfare benefit coverage in China that evaluated the
effects of the enterprise reform on workers’ healthcare benefits and their financial
burden due to medical expenses, concluded that the reform reduced workers’ out-
of-pocket expenditures [40]. These variations could be related to the focus of our
study on the effects of general economic reforms on healthcare financing, whereas
other studies assessed the effects of reforms that were primarily focused on the
health sector.
This study was based on survey data from a large sample (31,000-36,000
households annually) retrieved from the reports of the Statistical Center of Iran and
other national and international reports for the years 1977-2014. Hence, the

18 | P a g e
findings can be generalized to the entire population of Iran. The Kakwani index was
used in this study, as it is a commonly used indicator for assessing equity in
healthcare financing [4]. Using segmented regression analysis was a strength of this
study, as it is a powerful method of interrupted time series analysis [21]. Segmented
regression analysis requires multiple observations before and after a single
intervention [27]. However, the presence of fewer observations after the TSL
implementation might have limited the detection of the real effect of the TSL on
income inequality and equity in healthcare financing. Additionally, several
additional control variables could have been included in this study, but due to the
lack of access to data on control variables or their incompleteness in the time frame
of the present study (1977-2014), only the inflation rate and GDP were used as
control variables for examining the effect of the TSL on the Gini coefficient, and the
infant mortality rate and the proportion of the population over 60 years old were
used as control variables for examining the effect of the TSL on the Kakwani index.
Conclusion
The study investigated the effects of the TSL on equity in healthcare financing and
on income inequality since 2010 in Iran. The segmented regression analysis
revealed that the TSL did not show a significant effect on equity in healthcare
financing, although income inequality decreased after the implementation of the TSL.
The Kakwani index showed that the equity in healthcare financing has improved
over time. This finding suggests that economic reforms, such as the TSL, may have a

19 | P a g e
progressive effect on equity in healthcare financing. Thus, considering the long-term
effects of the TSL on equity in healthcare financing and other related health system
indicators is of paramount importance for healthcare decision-makers.

20 | P a g e
Acknowledgements
The authors acknowledge all of the academic and administrative entities that helped them
in the design of the study and provided comments useful for finalizing the manuscript.
Authors’ contribution
Conceived and designed the experiments: HZ, AO, AR. Performed the experiments: HZ, AO,
AT. Analyzed the data: HZ, MB, and AO. Contributed reagents/materials/analysis tools: HZ,
AT, MB. Wrote the paper: HZ, MB, AT, AO.

21 | P a g e
References
1.Gerstl S, Sauter J, Kasanda J, Kinzelbach A. Who Can Afford Health Care? Evaluating the Socio-Economic Conditions and the Ability to Contribute to Health Care in a Post-Conflict Area in DR Congo. PloS one 2013;8(10):e77382. 2.Evans DB, Etienne C. Health systems financing and the path to universal coverage. Bulletin of the World Health Organization 2010;88(6):402-403. 3.Khan JA, Ahmed S, Evans TG. Catastrophic healthcare expenditure and poverty related to out-of-pocket payments for healthcare in Bangladesh—an estimation of financial risk protection of universal health coverage. Health Policy and Planning 2017 4.Hajizadeh M, Connelly LB. Equity of health care financing in Iran: the effect of extending health insurance to the uninsured. Oxford Development Studies 2010;38(4):461-476. 5.Mehrolhassani M, Najafi B, Yazdi Feyzabadi V, Haghdoost A, Abolhallaje M, Ansari M, et al. Total Health Expenditures and proportion of Out-of-Pocket payments in Iranian Provinces; 2008-2014. Iranian Journal of Epidemiology 2017;12(5):1-12. 6.Takian A, Rashidian A, Doshmangir L. The experience of purchaser–provider split in the implementation of family physician and rural health insurance in Iran: an institutional approach. Health policy and planning 2015:czu135. 7.Hajizadeh M, Nghiem HS. Out-of-pocket expenditures for hospital care in Iran: who is at risk of incurring catastrophic payments? International journal of health care finance and economics 2011;11(4):267-285. 8.Yazdi Feyzabadi V, Mehrolhassani M, Haghdoost A, Bahrampour M. The Trend of Impoverishing Effects of Out-Of-Pocket Health Expenditure in Iranian Provinces in 2008-2014. Iranian Journal of Epidemiology 2017;12(5):20-31. 9.Mostafavi H, Aghlmand S, Zandiyan H, Alipoori Sakha M, Bayati M, Mostafavi S. Inequitable Distribution Of Specialists And Hospital Beds In West Azerbaijan Province. Payavard Salamat 2015;9(1):55-66. 10.Zandiyan H, Ghiasvand H, Nasimi DR. Measuring Inequality of Distribution of Health Resources: A Case Study. Payesh Journal 2012;6:799- 805. 11.Yazdi Feyzabadi V, Bahrampour M, Rashidian A, Haghdoost A, Abolhallaje M, Najafi B, et al. Incidence and Intensity of Catastrophic Health Expenditures in Iranian Provinces; 2008-2014. Iranian Journal of Epidemiology 2017;12(5):40-54. 12.Davari M, Haycox A, Walley T. Health care financing in iran; is privatization a good solution? Iranian journal of public health 2012;41(7):14. 13.Kavosi Z, Rashidian A, Pourreza A, Majdzadeh R, Pourmalek F, Hosseinpour AR, et al. Inequality in household catastrophic health care expenditure in a low-income society of Iran. Health policy and planning 2012;27(7):613-623. 14.Guillaume DM, Zytek R, Reza Farzin M. Iran-The Chronicles of the Subsidy Reform: International Monetary Fund; 2011, p. 1-28. 15.Salehi-Isfahani D, Wilson Stucki B, Deutschmann J. The reform of energy subsidies in Iran: The role of cash transfers. Emerging Markets Finance and Trade 2015;51(6):1144-1162. 16.Abbasian E, Asadbaygi Z. Targeted communication of energy subsidies and social welfare through economic growth. Social Welfare 2010;12(44):143-173. 17.Zamanzadeh H. Targeted subsidies: Achievements, challenges and costs. Tazehaye Egtesad 2011;9(133):108-116.

22 | P a g e
18.Zandian H, Olyaeemanesh A, Takian A, Rashidian A, Hosseini M. Contribution of Targeted Subsidies Law to the Equity in Health Care Financing in Iran: Exploring the Challenges of Policy Process. Electronic Physician 2016;8(2) 19.Pourasghari H, Jafari M, Bakhtiari M, Keliddar I, Irani A, Afshari M. Analysis of equality in Iranian household healthcare payments during Iran’s fourth development program. Electronic physician 2016;8(7):2645. 20.Doshmangir L, Doshmangir P, Abolhassani N, Moshiri E, Jafari M. Effects of targeted subsidies policy on health behavior in iranian households: A qualitative study. Iranian journal of public health 2015;44(4):570. 21.Wagner AK, Soumerai SB, Zhang F, Ross‐Degnan D. Segmented regression analysis of interrupted time series studies in medication use research. Journal of clinical pharmacy and therapeutics 2002;27(4):299-309. 22.Giles DE. Calculating a Standard Error for the Gini Coefficient: Some Further Results*. Oxford Bulletin of Economics and Statistics 2004;66(3):425-433. 23.Yusuf AA, Resosudarmo BP. Is reducing subsidies on vehicle fuel equitable? A lesson from Indonesian reform experience. Fuel Taxes and the Poor 2011 24.Wagstaff A, O'Donnell O, Van Doorslaer E, Lindelow M. Analyzing health equity using household survey data: a guide to techniques and their implementation: World Bank Publications; 2007 25.O'Donnell OA, Wagstaff A. Analyzing health equity using household survey data: a guide to techniques and their implementation: World Bank Publications; 2008 26.Paya A, Raghfar H, Abdi A, Poor DM, Fadavi-Ardekani M. Social, Economic, Political, and Intellectual Changes in Iran Since 1960s. The State of Social Progress of Islamic Societies: Springer; 2016, p. 211-235. 27.Ramsay CR, Matowe L, Grilli R, Grimshaw JM, Thomas RE. Interrupted time series designs in health technology assessment: lessons from two systematic reviews of behavior change strategies. International journal of technology assessment in health care 2003;19(04):613-623. 28.Hamilton JD. Time series analysis: Princeton university press Princeton; 1994 29.Hassanzadeh E. Recent developments in Iran’s energy subsidy reforms. Policy Brief. International Institute for Sustainable Development. www. iisd. org/gsi/sites/default/files/pb14_iran. pdf 2012 30.Graeff P, Mehlkop G. The impact of economic freedom on corruption: different patterns for rich and poor countries. European Journal of Political Economy 2003;19(3):605-620. 31.Heshmati A. The World Distribution of Income and Income Inequality: A Review of the Economics Literature*. Journal of World-systems research 2015;12(1):61-107. 32.Vincens N, Stafström M. Income Inequality, Economic Growth and Stroke Mortality in Brazil: Longitudinal and Regional Analysis 2002-2009. PloS one 2015;10(9):e0137332. 33.Farzanegan MR, Markwardt G. The effects of oil price shocks on the Iranian economy. Energy Economics 2009;31(1):134-151. 34.Monnin P. Inflation and income inequality in developed economies. CEP Working Paper Series 2014 35. 36.Hajizadeh M, Connelly LB. Equity of health care financing in Iran. Australian Centre for Economic Research on Health 2009;5:1-39. 37.Rezaei S, Fallah R, Kazemi Karyani A, Daroudi R, Zandiyan H, Hajizadeh M. Determinants of healthcare expenditures in Iran: evidence from a time series analysis. Medical Journal of The Islamic Republic of Iran 2016;30(1):6-14. 38.Munge K, Briggs AH. The progressivity of health-care financing in Kenya. Health policy and planning 2014;29(7):912-920. 39.Cabieses B, Cookson R, Espinoza M, Santorelli G, Delgado I. Did Socioeconomic Inequality in Self-Reported Health in Chile Fall after the Equity-Based Healthcare Reform of 2005? A Concentration Index Decomposition Analysis. PloS one 2015;10(9):e0138227.

23 | P a g e
40.Hu TW, Ong M, Lin ZH, Li E. The effects of economic reform on health insurance and the financial burden for urban workers in China. Health Economics 1999;8(4):309-321.

Table 1. Trends of the Gini index, concentration index, Kakwani index, gross domestic product (GDP), inflation rate, infant mortality rate (IMR), and proportion of the population over 60 years, 1977-2014
Year 1977-1980 1980-1990 1990-2000 2000-2009 2010 2011 2012 2013 2014
Gini Index1 0.401 0.401 0.397 0.4014 0.381 0.372 0.365 0.365 0.362
GDP 3 5273.66 14710.8 210864.5 2.10E+06 5.5e+06 5.80E+06 5.80E+06 5.30E+08 5.30E+08
Inflation rate4 15.51 19.53 24.03 14.75 12.42 21.53 30.51 34.74 27.53
IMR5 87.61 58.72 36.62 22.53 16.56 15.74 15.12 14.46 13.71
Population over 605
3.038 2.992 3.710 4.772 5.159 5.198 5.242 5.285 5.286
Concentration index2
- - 0.371 0.381 0.388 0.368 0.389 0.388 0.370
Kakwani index2 - - 0.025* -0.021* 0.007 -0.001 0.024 0.023 0.008
*Mean over 10 years. 1. Source: Iran Statistical Center report, 2014 2. Calculated by authors 3. World Bank Report 2014 4. Central Bank of Iran 5. Deputy of Treatment of Ministry of Health Report 2014
서식 있음: 들여쓰기: 왼쪽: -0.03
cm

Table 2. Parameter estimates of segmented regression analysis models of the effects of TSL implementation on income inequality
(Gini index) in Iran, 1977-2014 (year of intervention, 2010)
Models Explanatory variables Goodness of fit Residual tests
Intercept T
before
CC
after
TC
after
lGDP INF F R¯2 R MST DF NO DW B-P
a.
A .374
<0.001
-.001 0.07
-.008 0.38
-.008 0.03
.003 0.12
-.000 0.76
19.58 <0.001
0.753 .00717 -
4.859 0.967 0.319
1.628 1.08
0.299
B .373
<0.001
-.001 0.06
-.008 0.394
-.008 0.02
.004 0.11
25.15
<0.001 0.753 .00707
-4.793
0.964 0.259
1.604 1.06
0.304
C .405
<0.001
-.0002 0.145
-.017 0.046
-.003 0.11
-.000 0.704
22.83
<0.001 0.734 .00733
-4.613
0.965 0.284
1.510 1.43
0.231
D .404
<0.001
-.0001 0.14
-.016 0.046
-.004 0.08
31.17
<0.001 0.733 .00723
-4.513
0.964 0.266
1.473 1.34
0.246
b. Most
parsimonious
model
.401 <0.001
-.032
<0.001
79.53 <0.001
0.688 .00761 -
3.770 0.886
<0.001 1.472
1.47 0.237
TSL, Targeted Subsidies Law;
DF, stationary of residuals with the Dicky-Fuler test;
NO, normality of residuals with the Shapiro-Wilk W test;
DW, Durbin-Watson test for autocorrelation;
B-P, Breusch-Pagan test for heteroscedasticity;
INF, inflation rate;
lGDP, log gross domestic product.
서식 있음: 글꼴 색: 텍스트 1

Table 3: Parameter estimates of segmented regression analysis models of the effects of TSL implementation on inequality in
healthcare financing (Kakwani index) in Iran, 1988-2014 (year of intervention, 2010)
Models Explanatory variables Goodness of fit Residual tests
Intercept T before CCafter TCafter lGDP IMR Pop
60
INF F R¯2 R MST ST NO DW B-P
A -0.018 0.95
0.009 0.33
0.009 0.67
-0.006 0.53
0.00 0.98
0.000 0.91
-0.06 0.17
0.000 0.13
5.95 <0.001
0.686
0.014 -5.199 0.785
<0.001 2.156
0.37 0.542
B 0.02 0.94
0.009 0.32
0.008 0.62
-0.006 0.37
0.000 0.91
-0.06 0.16
0.000 0.12
7.31 <0.001
0.592
.0142 -5.199 0.784
<0.001 2.156
0.38 0.540
C 0.48 0.57
0.008 0.06
0.009 0.55
-0.006 0.27
-0.06 0.14
0.000 0.11
9.20
<0.001
0.611
.0139 -5.187 0.778
<0.001 2.154
0.34 0.518
D -0.07
<0.001
0.001 <0.001
0.015 0.36
-0.001 0.70
0.000 0.05
31.17 <0.001
0.733
.00723 -4.769 0.808
<0.001 1.967
0.56 0.454
E -0.05
<0.001
0.001 <0.001
0.013 0.41
0.001 0.81
11.68
<0.001
0.552
.0149 -3.371 0.839
<0.001 1.624
0.33 0.564
TSL, Targeted Subsidies Law;
DF, stationary of residuals with the Dicky-Fuler test;
NO, normality of residuals with the Shapiro-Wilk W test;
DW, Durbin-Watson test for autocorrelation;
B-P, Breusch-Pagan test for heteroscedasticity;
INF, inflation rate;
lGDP, log gross domestic product;
Pop60, over-60 population;
IMR, infant mortality rate. 서식 있음: 아래 첨자
서식 있음: 글꼴 색: 텍스트 1

Fig 1
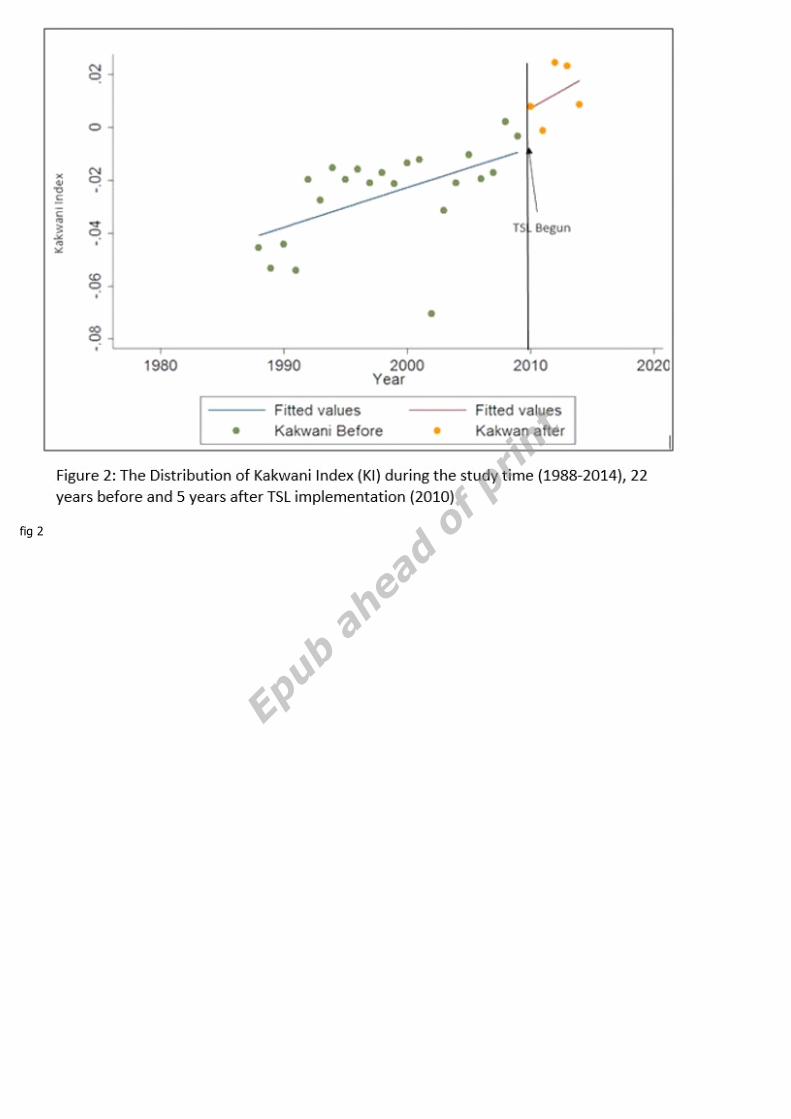
fig 2