labour reforms in indonesia: an agenda for greater … labour reforms in indonesia: an agenda for...
TRANSCRIPT

1
Labour reforms in Indonesia: An agenda for greater equity and efficiency
By Emma Rose Allen and Robert Kyloh1
November 2016
1 The views expressed in this paper are those of the authors. They do not necessarily reflect the policies of the
International Labour Office or the Asian Development Bank. Helpful comments and advice on this report were
received from Janine Berg, Mariya Aleksynska, Patrick Belser, Susan Hayter, Matt Cowgill, Sangheon Lee and Amber Barth.

2
Table of contents
List of figures ........................................................................................................................ 3
List of tables ......................................................................................................................... 5
List of boxes ......................................................................................................................... 5
List of terms and abbreviations .............................................................................................. 6
Notes on the authors .............................................................................................................. 7
1. Introduction ....................................................................................................................... 8
2. Recent economic, social and labour relations developments ............................................ 10
3. Labour reforms under the Widodo Government ............................................................... 43
3.1 The process leading to the 2015 wage reforms ........................................................... 43
3.2 The impact of reforms on wage levels and economic development ............................. 46
3.3 The role of minimum wages and collective bargaining ............................................... 50
3.4 The impact of the 2015 wage reforms on trade unions and the balance of power at the
workplace ........................................................................................................................ 52
4. The long term evolution of labour laws and institutions in Indonesia and their impact on
economic and labour market trends ..................................................................................... 21
4.1 The impact of labour institutions during the “New Order” from 1966 to 1998 ............ 22
4.2. 1997-99 Asian economic crisis and the return of democracy ..................................... 27
4.3. 1999 - 2003 Economic recovery and the foundations of a strong democracy ............. 28
4.4. 2004-2016: Robust economic growth and reasonable labour market outcomes .......... 33
5. The impact of key labour institutions and labour laws in the last decade and
recommendations for reform ............................................................................................... 59
5.1. Minimum wage fixing ............................................................................................... 60
5.2 Multi-employer or sector level collective bargaining .................................................. 67
5.3 Implementation of labour rights ................................................................................. 73
5.4 Employment protection legislation ............................................................................. 83
5.5 Non-standard forms of work and human capital development .................................... 89
5.6 Vocational training, apprenticeships and skill development ........................................ 99
6. Conclusions ................................................................................................................... 107
List of references............................................................................................................... 113
Annex: Minimum wages by province, 1997-2014 ............................................................. 118
Annex: Nominal growth rates for minimum wages by province, 1997-2014 ...................... 119
Annex II: Freedom of Association Case ............................................................................ 120

3
List of figures
Figure 1: Manufacturing value added and employment trends, 2004-2015 ........................... 12
Figure 2: Nikkei Manufacturing Purchasing Managers’ Index, 2014-2016 .......................... 12
Figure 3: Minimum wage growth trends 2010-2016 ............................................................ 47
Figure 4: Minimum wage growth trends 2003 to 2016......................................................... 49
Figure 5: Monthly minimum wages for the top 20 apparel-exporting middle and low income
countries (USD, 01 January 2015) ....................................................................................... 51
Figure 6: GDP growth for Indonesia and the World, 1985-2015 (per cent) .......................... 25
Figure 7: Share of GDP by economic sector, 1985-2015 (per cent) ...................................... 26
Figure 8: Share of employment by economic sector, 1985-2015 (per cent) .......................... 27
Figure 9: Commodity price index for key Indonesian exports in the world market, 2001-2016
........................................................................................................................................... 34
Figure 10: Trends gross fixed capital formation, 1985-2015 (per cent) ................................ 36
Figure 11: Percentage of people living in poverty and the GINI ratio, 1996-2016 ................ 38
Figure 12: Consumption GINI and primary wage inequality for regular employees and all
income earners (2001-2015) ................................................................................................ 39
Figure 13: Status in employment, 2006-2015 ...................................................................... 41
Figure 14: Labour productivity and real wages in Indonesia, 2005-2015 (Index, 2005 = 100)
........................................................................................................................................... 61
Figure 15: Real average wage trends for production workers in manufacturing and non –
managerial wage workers in hotels, 1996-2014 ................................................................... 62
Figure 16: Trends in nominal minimum and average wages for Indonesia, 2001-2015 (Rp). 63
Figure 17: Contract type by union membership for regular employees, February 2016 ........ 72
Figure 18: Union membership density by sector, February 2016.......................................... 73
Figure 19: Percentage of regular employees below and above the provincial minimum wage,
2001-2015 ........................................................................................................................... 74
Figure 20: Regular employees paid below and above the provincial minimum wage, 2001-
2015 .................................................................................................................................... 75
Figure 21: Percentage of workers earning less than the provincial minimum wage, 2001-2014
........................................................................................................................................... 76
Figure 22: Percentage of employees below and above the provincial minimum wage, 2011-
2016 .................................................................................................................................... 77
Figure 23: Percentage of employees below the provincial minimum wage and the primary
wage GINI, 2006-2015 ........................................................................................................ 78
Figure 24: Minimum wage compliance and wage inequality scenario for regular employees
(2001-14) ............................................................................................................................ 80
Figure 25: Percentage of regular employees with social security benefits, February 2016 .... 82
Figure 26: Severance pay entitlement by job tenure for selected countries ........................... 85
Figure 27: Dismissal procedural requirements for dismissal for selected countries .............. 88
Figure 28: Percentage of regular wage employees with social security benefits by contract
type, February 2016 ............................................................................................................ 90
Figure 29: Contract types for wage employees, February 2016 (millions) ............................ 92
Figure 30: Regular employees with less than 36 months of job tenure by sector, 2011-2015 94
Figure 31: Employed people with less than 12 months of job tenure by status in employment,
February 2016 ..................................................................................................................... 95
Figure 32: Participation in certified workplace training by contract formality for all
employees, February 2016................................................................................................... 97

4
Figure 33: Transition rates for production workers across occupations by education
attainment over 12 months .................................................................................................. 98
Figure 34: GDP per person employed (constant 1990 PPP $) for Indonesia and the World 100
Figure 35: Qualification mismatch of employed youth, (per cent) ...................................... 101
Figure 36: Prevalence of apprenticeship and youth unemployment, 2011 .......................... 104

5
List of tables
Table 1: Sector output growth and employment growth, 1990-2014 .................................... 29
Table 2: Trends for regular wage employees in manufacturing ............................................ 42
Table 3: Nominal monthly earnings by status in employment, 2011-2015 ........................... 79
Table 4: Public perception survey of the most important policies for reducing inequality,
2014 .................................................................................................................................... 81
Table 5: Payments applicable to workers at dismissal .......................................................... 86
Table 6: Benefits paid according to reasons for dismissal ................................................... 86
List of boxes
Box 1: Enterprise survey in manufacturing establishments .................................................. 14
Box 2: The “old” minimum wage system in Indonesia prior to Government Regulation 78 of
2015 and ILO criticisms of this system ................................................................................ 44
Box 3: Sector and Industry Level Minimum Wages in Indonesia ......................................... 58
Box 4: The meaning of GINI ................................................. Error! Bookmark not defined.
Box 5: Why is social dialogue desirable? ............................................................................ 67
Box 6: Synchronization of Collective Bargaining and Economic Outcomes ........................ 70
Box 7: Industry's initiative to establish a vocational high school (SMK) ............................ 106
Box 8: Vocational training in Indonesia ............................................................................ 106

6
List of terms and abbreviations
ADB Asian Development Bank
ASEAN Association of Southeast Asian Nations
APINDO Asosiasi Pengusaha Indonesia (The employers’ association of Indonesia)
BAPPENAS National Development Planning Agency
(Badan Perencanaan Pembangunan Nasional)
BPJS Social Security Provider (Badan Penyelenggara Jaminan Sosial)
BPS Badan Pusat Statistik (Statistics Indonesia)
BWI Better Work Indonesia
CPI Consumer Price Index
DWCP Decent Work Country Programme
EPL Employment Protection Legislation
FDI Foreign Direct Investment
G-20 Group of Twenty Finance Ministers and Central Bank Governors
GDP Gross Domestic Product
IDR Indonesian Rupiah
ILO International Labour Organization
IMF International Monetary Fund
ICFTU International Confederation of Free Trade Unions (
ITUC International Trade Union Confederation (ITUC
JCI Jakarta Composite Index
KHL Kebutuhan hidup layak (minimum decent standard of living)
KSBSI The Indonesian Prosperity Trade Union Confederation
(Konfederasi Serikat Buruh Sejahtera Indonesia)
KSPI The Indonesian Trade Union Confederation
(Konfederasi Serikat Pekerja Indonesia)
KSPSI All Indonesian Workers Union Confederation
(Konfederasi Serikat Pekerja Seluruh Indonesia)
MOM Ministry of Manpower
NTB Nusa Tenggara Barat
NTT Nusa Tenggara Timor
OSH Occupational Safety and Health
SDG Sustainable Development Goal
SJSN National Social Security System (Sistem Jaminan Sosial Nasional)
SMEs Small and Medium Enterprises
Sakernas Survei Angkatan Kerja Nasional (National Labour Force Survey)
Susenas Survei Sosial Ekonomi Nasional (National Socioeconomic Survey)
UN United Nations
USD United States Dollar
7
Notes on the authors
Robert Kyloh is a Senior Economic Advisor in the Multilaterals Department of the
International labour Organisation in Geneva. He focuses on the relationship between
macroeconomic policy, employment policy, wage policy and industrial relations.
Emma Rose Allen is the Country Economist at the Asian Development Bank in Jakarta,
Indonesia. Her area of focus is labour market policy, social policy and food security.

8
1. Introduction
In June 2016 the Workers’ group of the International Labour Organization (ILO) argued that:
“… important progress has been made in the post-Suharto transition period in
protecting freedom of association in Indonesia. Unfortunately, that progress came to
an abrupt end with the advent of the Widodo administration.”2
The spokesperson for Workers’ group in the ILO also stated that:
“A return to the 1980s style repression was to be feared.”3
These are serious allegations that warrant careful consideration in any review of recent
industrial relations developments. The Government of Indonesia firmly rejects these claims.
In fact during the same discussion in the ILO a representative on behalf of the Government
reiterated their:
“…. strong commitment to the implementation of the Convention ( on Freedom of
Association and Protection of the Right to Organise), and to the fulfillment of the
rights of workers, including the right to freedom of peaceful assembly and association
in accordance with national laws and regulations.”4
In all democratic market based economies it is recognized that the relationship between the
individual worker and the owner/management of an enterprise is an unequal relationship. It is
further recognized that formal sector product markets in most countries do not conform to the
textbook model of perfect competition. Oligopoly and monopoly are common features of the
private formal sector in most economies. There are thus both economic efficiency and equity
reasons for having labour laws that recognize and compensate for the power imbalances that
would otherwise exist in the workplace.
A basic component of labour law in all democratic market economies is the right to freedom
of association and the promotion of collective bargaining. The notion that workers should
have a right to join together (associate), in organizations of their choice, to protect and
further their interests vis-a- vis the employer is the bedrock of any democratic and fair
industrial relations system. Moreover, with various checks and balances, freedom of
association also includes the right of workers to strike or to take other peaceful industrial
action to further their interests. There exists a large body of international jurisprudence
concerning the implementation and limits on of these basic rights. The right to freedom of
association is universal, but the protection of these rights can be particularly important in
economies with highly concentrated patterns of capital ownership or societies without a well-
established democratic institutions and traditions.
2 International Labour Organisation (ILO), Report of the Committee on the Application of Standards (Part 2),
May-June 2016, p 51. 3 Ibid, p 51
4 Ibid, p 50.

9
This paper focuses on the evolution of industrial relations, labour market policy and wage
developments in Indonesia. This analysis may help to shed light on this important debate
about freedom of association, which is ongoing at both national and international levels,
between the trade union movement and the Government of Indonesia.
In this paper we recall that despite progress in the post-Suharto era, labour relations remained
far from satisfactory in the decade-and-a-half prior to the election of President Widodo.
Indeed the ILO supervisory system has been investigating claims of violence at the
workplace perpetrated by criminal gangs hired by employers, workers and union activists as
well as some State authorities since 2011. We conclude therefore that the industrial relations
environment requires urgent remedial action. The elimination of violence plus fundamental
changes in practices and attitudes are required on all sides.
Assessments about the state of industrial relations are subjective and open to different
interpretations. Consequently, in this paper we argue for a pragmatic way forward rather than
just raking over past mistakes and current problems. While it is impossible to ignore what has
happened in recent years the focus should be on restoring social dialogue and promoting
consensus. In fact we argue that with some modifications to recent wage reforms, and
significant changes to way strikes and demonstrations are handled, Indonesia can regain a
positive international image for labour relations and fundamental labour rights. Moreover, we
make the case for expanding labour reforms into a number of additional areas and doing so
on the basis of genuine social dialogue.
Section 2 of the paper sets the scene. It focuses on very recent economic and labour relations
developments. The latter includes discussions and conclusions on Indonesia by the ILO
supervisory system on International Labour Standards in 2016. Section 3 steps back from
these recent developments and reviews the long term evolution of labour laws, labour
institutions and industrial relations practices in Indonesia over the last half century. This
history is critical to understanding why any suggestion that Indonesia may be reverting to the
practices and policies of a previous era will capture international attention.
Section 4 is devoted to the wage reforms announced on 15 October 2015 and their
repercussions. It considers the likely impact of the reforms on labour costs and the balance of
power at the workplace. Section 5 focuses on a number of other labour market issues and
potential reforms that are relevant today. These include: the future of wages policy; collective
bargaining; labour inspection and the enforcement of minimum wages and labour laws;
employment protection legislation including severance payments and regulations governing
dismissal; the expansion of non-standard forms of work including the use of fixed term
contracts, workers hired through employment agencies and other triangular employment
relationships plus the outsourcing of work to homeworkers and others who are misclassified
as independent contractors when they are actually in a dependent employment relationship;
and finally, skills and human capital development.
This lengthy list of labour market issues have been debated since the early 2000s in Indonesia
and many proposals for reforms have been advanced in the last decade-and-a-half. But up
until now labour market reforms have remained a highly contentious area of policy. At
10
various times labour reforms have often been pursued in a piece meal manner and they have
either been subsequently withdrawn or have engendered massive protests.
Section 6 concludes and advocates a balanced package of reforms that cover all the policy
areas mention above. In so doing care has been taken to propose a combination of changes
that if implemented simultaneously should advance both equity and economic efficiency. The
objective is to promote compromise and sufficient tripartite consensus to make the reforms
politically realistic and enduring. If this consensual approach was adopted it would eliminate
the type of accusations mentioned at the outset of this paper.
2. Recent economic, social and labour relations developments
Like many other emerging economies Indonesia has faced significant economic challenges in
the last few years due to declining commodity prices, the economic slowdown in China and
turmoil in global financial markets. As a result economic growth rates have been on a
gradually downward trajectory since peaking in the December quarter of 2010 at 6.8%.
However the economic challenges confronting Indonesia at present remain modest compared
to those facing many emerging economies and other commodity exporting countries. The
International Monetary Fund recently forecasts GDP growth rates of 4.9% and 5.3% for 2016
and 2017 respectively.5 Both the Asian Development Bank (ADB) and the World Bank are
forecasting marginally higher growth rates in 2016 and similar growth rates for 2017.
Indonesian financial markets also appear to be in good shape compared to many other
countries. A rally in equity markets resulted in the Jakarta Composite Index rising by more
than 20 % over the year to September 2016. The Financial Times newspaper ran a very
upbeat headline declaring the “Indonesian market buoyant amid emerging market caution”.6
A strengthening of the domestic currency (the Rupiah) in the latter months of 2015 and early
months of 2016, after a steady depreciation throughout most of 2015, is another sign of
confidence and strength in the Indonesian economy.
The labour market situation is more problematic. Since mid-2014 there has been much media
attention and political discussion about job losses in the manufacturing sector. There have
been closures of a few high profile multinational enterprises and warnings about mounting
pressures in export markets. The official labour market data compiled by the Indonesian
statistical office (Badan Pusat Statistik, BPS) would suggest that aggregate labour demand
weakened somewhat. But so far there is no evidence of a sharp downturn. Over the year to
February 2016 (latest data available at the time of writing) the aggregate employment level
declined by roughly 200,000. Employment contracted in agriculture and manufacturing year-
on-year, with shifts between urban and rural labour markets helping to moderate job losses.
Employment levels in the service sector remained static. The unemployment rate remains
moderate at 5.5 %, partly because of a decline in labour force participation.
5 International Monetary Fund, World Economic Outlook, October 2016.
6 Financial Times, March 9, 2016.

11
In previous recessions, including the late 1990s Asian economic crisis, Indonesia managed to
maintain aggregate employment and unemployment trends but only by substituting poor
quality jobs in the informal and agriculture sectors for better quality wage employment. At
present there is no concrete evidence of similar trends but there is some suggestion that
workers in low quality jobs may have left the labour market completely. But these trends are
accompanied by evidence of a compositional change towards better quality jobs in capital
intensive manufacturing which is reflected in an expansion of wage employment. The
combination of these trends suggests that a two-speed economy could be emerging in the
Indonesian labour market.
Given the concentration of wage employment, and particularly organised workers, in the
manufacturing sector of Indonesia, much of the previous literature about labour laws and
labour institutions focus on this sector. In this paper we also focus considerable attention on
manufacturing in an effort to decipher how the evolution of minimum wages, non-wage
labour costs and changes in labour laws have influenced employment and the quality of jobs.
Generally speaking the current state of the manufacturing sector is ambiguous. The glass is
either “half full” or “half empty” depending one ones perspective. Despite the deterioration in
global economic conditions since 2012 the performance of the Indonesian manufacturing
sector has remained reasonable. Figure 1 shows that real output from the manufacturing
sector expanded steadily, albeit not spectacularly, and between 2004 and 2015 and total
employment in the sector rose by over 40 % between 2004 and 2012. Thereafter employment
levels in the sector dipped and then recovered slightly. But real output growth in
manufacturing maintained a steady pace in the last few years. This would suggest that labour
productivity should have increased substantially between 2012 and 2015 offsetting the impact
of significant nominal wage increases in this period. A recent report by UNIDO underlined
this positive performance suggesting that Indonesia managed to expand its share of global
manufacturing activity between 2000 and 2015 and is now included within the ten largest
manufacturing countries in the world.7
Recent national accounts data confirms that the manufacturing sector helped keep overall
economic growth at respectable levels. Growth in manufacturing output accelerated to 4.7%
in the second quarter of 2016 (year-on-year). This was the fastest growth rate in this sector
since 2013. The sector contributed 1.0 percentage points to overall GDP growth in the first
half of 2016. As such, manufacturing was the sector making the largest contribution to
growth, it was followed by construction and trade. Subsectors that performed well included
food processing, automotive industries, and electronics. These are among the most unionised
industries in the private sector and these results were achieved despite a significant industrial
relations problems in the last two years. With more harmonious labour relations these sectors
have the potential to make a more significant contribution to sustained and inclusive growth.
7 United Nations Industrial Development Organisation (UNIDO), “International Yearbook of Industrial Statistics”, 2016.

12
Figure 1: Manufacturing value added and employment trends, 2004-2015
Source: BPS (2015) GDP Expenditure Accounts, Badan Pusat Statistik, Jakarta. BPS (2014)
Labour force situation in Indonesia, August 2014, Badan Pusat Statistik, Jakarta.
The recent upturn in manufacturing is support by data from the Nikkei Manufacturing
Purchasing Managers’ Index, which has been in positive territory (above 50) for 5 out of 8
months so far in 2016 (Figure 2). If the trend continues, it should stimulate employment
creation within the sector, along with productivity increases.

13
Figure 2: Nikkei Manufacturing Purchasing Managers’ Index, 2014-2016
Source: Source: Bloomberg (accessed 7 September 2016).
One cannot draw definitive conclusions about the future from these very recent trends. But it
is probably fair to suggest that there are no grounds for panic that the Indonesia
manufacturing sector is in dire straits and requires rapid and radical labour market reforms
that bypass the requirements for consultations and consensus building with the social
partners. On the other hand, there is no room for complacency about the state of
manufacturing given intense international competition in global supply chains. In our
globalised economy labour costs will always be a key factor in determining investment
decisions and the location of labour intensive manufacturing. If Indonesia wants to acquire a
larger share of the global market in these industries it cannot ignore the fact that wage levels
and non-wage labour costs will have a profound impact on investment decisions and the
health of the manufacturing sector.
Indeed there is evidence that many large manufacturing enterprises may be moving, or at
least contemplating a move in response to changes in relative labour costs between different
locations. But, for the moment at least, these relocations are taking place within Indonesia
rather than companies moving off shore. Discussions in August and September 2015, and
again in April 2016, between the authors of this paper and factory managers in several of the
main industrial areas of Java suggested that conditions in labour intensive manufacturing vary
between regions. For example, all managers interviewed in Central Java, where minimum

14
wages remain relatively low, indicated that their factories were at full capacity and they
needed to engage their workforce in regular overtime. The majority of managers in Central
Java also indicated profits had increased in 2014 and 2015 and they had plans to invest in
new capital equipment or factories.8 Many employers in this region report difficulties in
recruiting sufficient workers to meet current orders. For example, discussions with
representatives of the Indonesian Textiles Association in early April 2016 also suggested that
their members in Central Java were facing labour shortages because of rapid expansion of
existing and new enterprises in the region.
By comparison there are industrial areas in West Java, such as Sukabumi, where factory
managers in labour intensive industries reported that increases in the minimum wage over the
last few years were having a significant impact on profitability and the continued viability of
enterprises. Some managers in these regions indicated they were planning, or considering,
moving production to lower cost locations within Indonesia. One important factor inhibiting a
more dramatic move of manufacturing firms to low wage regions are the fixed costs involved
in closing an enterprise. This is particularly true for older companies with managers who try
to respect the labour laws and who have a large labour force with lengthy tenure. For
companies that meet these characteristics the severance payments and other costs they would
legally incur if they closed, and dismissed all workers, are prohibitive.
Discussions held with foreign investors in the garment sector, as part of the ILO Better Work
Program, confirm that multinational companies in the clothing retail sector and their suppliers
see Central Java as the destination of choice for the expansion of their manufacturing
activities. The combination of low labour costs by international standards, a diligent and
disciplined workforce, plus relatively good infrastructure are cited by foreign investors as the
main attributes attracting foreign direct investment into Central Java.
Box 1: Enterprise survey in manufacturing establishments and focus group discussions
with trade union activists
The authors of this paper interviewed a small sample of managers and owners of factories
producing garments and metal products in several Provinces. Questions covered recent trends
in profitability, investment, employment, wages and labour relations in the enterprise. The
latter included questions about strikes, demonstrations and workplace violence. It should be
emphasised that this survey was not random and the sample size was small. Consequently the
results should be treated with caution.
The authors also conducted focus group discussions with trade union leaders and rank and
file union members in the manufacturing sector (clothing, footwear and metal industries) who
have organised or participated in industrial action including strikes and demonstrations.
Again the sample was small and not random. Consequently the results of these interviews
8 ILO survey of factory managers in garment and metal sector conducted in the following cities and regions between August and October 2015.

15
which are reported in this paper should also be treated with caution.
Despite this reasonable track record with manufacturing output and jobs, Indonesia has the
potential to do far better. Given the size of the domestic market, and the geographical
location of Indonesia, the country should be more fully integrated into global production
chains in labour, capital and resource intensive manufacturing.9 Consequently, the expansion
of decent wage employment in the manufacturing sector is a sound objective. The movement
of workers from low paid jobs in the agriculture and informal sectors into higher paid jobs in
manufacturing makes sense from both an economic efficiency and equity perspective.
Structural shifts of this nature should help reduce inequality in the lower half of the income
distribution, although it is unlikely to help reduce the gaps at the other end of the spectrum
between the very wealthy and average worker.
Parts of the Government certainly have ambitious plans to expand labour intensive
manufacturing. For example, the current medium term economic plan produced by Bappanas
( the National Planning Agency) is prefaced on a dramatic expansion of manufacturing as a
proportion of GDP. The government unveiled 13 policy packages from September 2015 to
August 2016 to stimulate investment, strengthen competitiveness, and diversify the economy.
These measures aim to promote growth in manufacturing, construction and some service
sectors, such as tourism. Most of the economic reforms were in areas outside the main focus
of this paper such as tax policy, investment incentives including more rapid approval for
investment plans, increased public expenditure on infrastructure and incentives for special
economic zones.
There is potential however for labour related issues to undermine this economic strategy and
the optimistic outlook for labour intensive manufacturing. In particular a prolonged
deterioration in labour relations, or a major international scandal over labour practices and
human rights in the manufacturing sector, would represent a serious threat to this economic
strategy. Because competition is fierce, foreign investors seeking to tap export markets in
labour intensive industries, like clothing and footwear, are not just concerned about labour
costs. Most of the key multinational companies in the retail sector also carefully consider the
reputation of the country for implementing core International Labour Standards plus
compliance with minimum wages and national labour laws. High profile multinational
companies in more capital intensive industries such as those exporting automobile
components or electronic inputs have very similar concerns.
The potential for a consumer backlash, or boycott in export markets, related to unacceptable
labour practices in supply chains is, along with unit labour costs, a key factor influencing the
location of foreign direct investment and the sourcing decisions of high profile multinationals
that sell manufactured products.
9 Haryo Aswicahyono and Hal Hill, “Survey of recent developments”, Bulletin of Indonesian Economic Studies,
No 3, 2014, pp 338-342. For earlier reviews with similar conclusions see, Haryo Aswicahyono, Douglas Brooks
and Chis Manning, 2Exports and Employment in Indonesia. The decline in labour intensive manufacturing and
the rise in services”, October 2011. Also Haryo Aswicahyono, Hal Hill and Dionisius Narjoko, “Indonesian Industrialization”, UNU-Wider working paper , September 20111.

16
For the last 5 years or more there have been complaints about attacks on workers involved in
peaceful and lawful strikes in Indonesia. There are allegations that the police and other
Indonesian authorities have either participated in these attacks, or failed in their duty to
protect striking workers from such attacks. Within the International Labour Organization
there exists a comprehensive, and well respected, system for reviewing complaints about
infringements of workers’ rights and for monitoring the implementation of International
Labour Standards. This system includes highly acclaimed legal experts (judges, lawyers and
academics specialising in labour law) drawn from all regions of the world who review labour
legislation and national practices. The work of these “experts” is complemented by
committees comprised of employer representatives, trade unionists and government officials
from a wide cross section of countries.10
For several years the various components of this
supervisory system have been making what they call “observations” on Indonesia and calling
for important reforms to laws and practices that are considered not to be in conformity with
the international jurisprudence on Freedom of Association. 11
In June 2016 at the International Labour Conference in Geneva, the relevant committee
composed of Government representatives, employer representatives and trade unions from all
around the world decided that recent developments related to the treatment of striking
workers were of such significance that they included Indonesia in a small select list of
countries in which they called for significant changes to labour laws and practices.
During this discussion the Workers’ group of the ILO argued that:
“In the name of attracting investment, anti-union violence by police or with the
acquiescence of police is once again on the rise, and public demonstrations and
strikes are being suppressed.”
Box 2: Examples of violence against striking workers cited by the ILO Workers’ Group at the
ILO in June 2016
In their submissions to the Committee on the Application of Standards, the Workers’ group
of the ILO drew attention to the following examples of violence against workers:
- On 31 October 2013 an attack by “para-military” organisations on a peaceful
demonstration demanding an increase in the minimum wage and elimination of
outsourcing in Bekasi. It was claimed that police deployed to the site of the
demonstration had not prevented the attacks by thugs armed with knives, iron rods
and machetes. This attack resulted in injuries to 28 workers.
- In November 2014 workers on strike over the minimum wage had been severely
beaten by police in Bekasi.
10 For a detailed description of the ILO supervisory system see: http://www.ilo.org/global/about-the-ilo/how-the-
ilo-works/ilo-supervisory-system-mechanism/lang--en/index.htm
11 ILO, Committee on Freedom of Association Case No. 3050 and Case No. 3176. See also Observations by the
ILO Committee of Experts on the Application of International Labour Standards in relation to ILO Convention No 87, in Indonesia.

17
- In November 2014 workers in Bataam had been dispersed by tear gas and water
cannons that had been positioned in advance by police
- In Bintam, police attacked and injured several workers who were meeting in order to
march to the local government employment office.
- On 30 October 2015, a lawful protest by 35.000 workers in front of the Presidential
palace has been dispersed by police with water cannons and tear gas. It was claimed
that 23 workers were arrested.
- Heavily armed thugs were hired by employers’ organisations to intimidate workers in
the Medan North Sumatra region.
- In Jawa Timur members of the Federation of Indonesian Metalworkers had been
beaten unconscious by police.
- In the lead up to the national strike planned for 24-27 November police had occupied
offices of the KSPI union in North Jakarta and put KSPI and The metal workers union
branch offices under surveillance.
- On 25 November 2015 police had arrested five union leaders in the Bakasi Industrial
Estates.
- In early 2016 rallies and demonstrations had been banned in several regions by local
authorities.
Source: ILO Report of the Committee on the Application of Standards, (Part 2), May-June
2016.
The wave of strikes and demonstrations in late 2015 and early 2016 were in response to the
wage reforms discussed later in this paper. The Indonesian trade union movement
commenced a protest campaign on 1 September, 2015, in anticipation of the reforms with a
mass rally of workers on the main streets of Jakarta and other key cities. A further mass
demonstration was conducted on October 15, 2015 when the wage reforms were officially
announced. On October 30, 2015 further demonstrations took place in Jakarta and other
cities. Press reports indicated that a number of demonstrators were arrested in Jakarta at the
demonstration and police used tear gas and water cannons to disperse demonstrators.12
There
are also claims that the striking workers provoked the security forces into such action by
extending their demonstrating beyond the time period that had been prearranged with the
police authorities. Subsequently a significant number of trade union members and leaders
were charged with criminal offences for disobeying orders from police officials.13
The
International Trade Union Confederation (ITUC) has claimed that seven labour activists from
the North Sumatra Workers Alliance were badly injured with stab wounds at another
demonstration in October 2015 related to the minimum wage reforms.14
Demonstrations and strikes escalated in November 2015. National strikes were held between
24 and 27 November 2015 and the trade union movement has claimed that the police used
violence to repress workers in several regions and a number of workers suffered injuries.15
12 Elyda, C. (2015) Workers stage protest against new wage formula, Jakarta Post, 31/10/2015. 13 Budiari, I. (2015) Thousands of workers to hold strikes across Greater Jakarta, Jakarta Post, 24/11/2015. 14 Letter from Sharan Burrow, General Secretary of the ICTU to Guy Ryder, Director General of the ILO, 10
November 2015. 15 Letter from Said Iqbal, President of KSPU, to Guy Ryder, Director General of the ILO, 30 November 2015.

18
Meanwhile APINDO ( the National Employers’ association) has claimed that this national
strike was illegal. In early February 2016 a number of international trade union leaders
participated in large public demonstrations in Jakarta against the minimum wage reforms.
The international trade union movement has pledged ongoing support for Indonesian workers
in their battle to rescind the October 2015 wage reforms.
In the last year the ILO Committee of Experts on the Application of Conventions and
Recommendations ( the expert legal body referred to above) made several important
observations in respect of ILO Convention 87 on Freedom of Association and Protection of
the Right to Organise in Indonesia. With regard to violence against trade unionists that had
occurred in 2011, 2012 and 2014 the ILO Experts urged the Government of Indonesia:
“to ensure, by means of appropriate measures such as education and training of the
police as well as police accountability, that the use of excessive violence in trying to
control demonstrations is avoided, that arrests are made only where perpetrators
have committed serious violence or other criminal acts, and that the police are called
in strike situations only where there is a genuine and imminent threat to public
order”.16
When this report from the ILO Experts was discussed in June 2016 by the ILO tripartite
Committee on the Application of Standards, the international trade union movement raised a
number of new allegations against the Government. In particular the trade unions have
claimed that the Government has been progressively expanding their definition and
interpretation of legislation that prohibits strikes in industrial areas that are considered
“national vital object areas”.17
Regulations on this matter date back to 2004 when Presidential
Decree No 43 authorised the use of the police and military to protect certain vital companies
or industrial areas that were threatened by industrial action. In 2014 the Ministry of Industry
issued Decree No 466/2014 that added another 49 national industries and 14 industrial estates
to the list of “national vital objects” that are afforded this protection. One trade union
representative at the International Labour Conference in June 2016 stated that these
regulations had “undermined all industrial action and threatened union organisation by
authorizing military intervention against workers”. 18
In mid-2015 the authors of this paper interviewed various government officials about the
likely implications of the wage reforms that were still under negotiation at that time. In
response to questions about how the Government planned to respond if the wage reforms led
to an upsurge in strikes and demonstrations an official from the Coordination Board of
National Investment stated that his organisation had signed a memorandum of understanding
with the national police force and the state intelligence agency to monitor the activities of
expected strike perpetrators. It was further claimed that a “hot line” had been established for
16General Report and observations concerning particular countries of the Committee of Experts on the
Application of Conventions and Recommendations to the 2016 International Labour Conference, Observation
2015/86 concerning Indonesia. 17 ILO, Report of the Committee on the Application of Standards (Part 2), May-June 2016, pp51-55. 18 ILO, Report of the Committee on the Application of Standards (Part 2), May-June, 2016, p 53. See statement by the representative of the Industrial Global Union Federation.

19
employers to contact police and have them intervene with striking workers at short notice to
prevent strikes and protests.
Several high profile trade union leaders in Indonesia told the authors of this paper that they,
and their families, have been subjected to physical threats in the last year. Interviews were
also conducted with young workers who have been on the front line in many of the
demonstrations referred to above. They provided the authors with graphic accounts of
beatings they received from criminal gangs hired by employers to intimidate workers from
taking industrial action and also claimed they had been attacked by police officers.
Workers are not the only victims of workplace violence related to strikes and demonstrations
in Indonesia. Many employers also reported to the authors that they have been subjected to an
increasing number of attacks on themselves and their property by striking workers.
Furthermore, employers in Indonesia regularly complain that their staff are intimidated by
trade union representatives to participate in industrial action such as demonstrations and
strikes. Employers’ also complain that trade union members are often responsible for
damage to equipment or facilities within factories or other workplaces when trying to
advance their demands for wage increases or other improvements in working conditions.
During the discussions in the ILO Committee on the Application of Standards in June 2016,
the Government of Indonesia alleged that unions engage in a process called “sweeping”
whereby union leaders arrive at factories and other workplaces and demand that a proportion
of the workforce joins those participating in a demonstration. It was further alleged that
unions threaten to damage factories and others forms of violence if these demands are not
complied with.19
Furthermore the Government representative argued that:
“… trade unions should not carry out sweeping activities, block roads, carry weapons
or other sharp devices that might harm others, or commit acts of anarchy.”20
It was not possible for the authors to independently verify all the accounts of workplace
violence provided by workers and employers but we also have no reason to doubt the veracity
of reports by either of the social partners. Importantly neither the employers nor the workers
we interviewed denied the accounts we had heard from the other side. In short both
employers and workers acknowledged they had been involved in practices that involved
significant breaches of freedom of association.
Violence at the workplace is a not a new development in Indonesia. The tactics used by
employers and trade unions that are described above have existed for many years, including
throughout the Yudhoyono Presidency. However, based on our interviews with the social
partners and the information provided to the ILO supervisory system, it would seem fair to
conclude that the October 2015 reforms to the minimum wage fixing system, which are
discussed later in this paper, have exacerbated the level of strikes and worker demonstrations
in Indonesia. This was the opposite impact of what the Government wished to achieve. Both
19 ILO, Report of the Committee on the Application of Standards, (Part 2), May-June, 2016, p50. See comments
by the representative of the Government of Indonesia. 20 ILO, Report on the Committee on the Application of Standards, (Part2), May-June 2016, p 50.

20
APINDO and the Government have defended the wage reforms by pointing to the level of
protests and strikes that have historically taken place during minimum wage negotiations.
They have argued that an automatic annual adjustment to the minimum wage would eliminate
these disruptions to production and provide greater political and industrial stability.
Indonesia needs to significantly improve industrial relations and develop more harmonious
relationships at the workplace. Unfortunately it seems that in industries and regions where
workers are organised the current trend is the opposite of that required and violence in the
workplace is on the increase. Significant changes in attitudes and practices are required from
employers’, trade unions and Government officials. Demonstrations and strikes by workers
should be handled in a very sensitive manner and with full respect for Freedom of
Association, and the jurisprudence related to this core ILO Convention. In June 2016 the ILO
tripartite Committee on the Application of Standards, after hearing interventions from trade
unions, employers and the Government of Indonesia issued the following conclusions:
“The Committee expressed deep concern regarding numerous allegations of anti-union
violence and limitations on the rights protected by the Convention (on Freedom of
Association) by national legislation. Taking into account the discussion of the case, the
Committee urged the Government to:
- Ensure that workers are able to engage freely in peaceful actions in law and
practice without sanctions,
- With regard to violence against trade unionists by private actors or public
officials, ensure the immediate establishment of independent judicial inquiries or
determine responsibility and to punish those responsible. The Government should
also investigate allegations of police inaction in the face of these violent acts and
ensure that those who fail to carry out their official duty to protect workers from
harm are sanctioned…..” 21
The Committee also urged the Government to amend or pass legislation on various topics to
promote freedom of association and to also accept “a direct contacts mission to develop a
roadmap to implement these conclusions.”
In responding to the above conclusions the Government send some mixed messages. First, a
representative from the Foreign Ministry indicated that they had taken note of the discussion
and he “emphasised that the future promised better implementation of the Convention.
Indonesia stood ready to cooperate with the Committee of Experts.”22
However later in the proceedings a representative from the Manpower Ministry of Indonesia
took the floor. The record of the meeting contains the following statement:
“She deeply regretted that the Committee’s conclusions were based on one-sided
allegations and had been drawn without taking into account the explanations of her
21 Ibid, p 55.
22 Ibid, p 55

21
Government and the actual discussion within the Committee. She called on the
Committee to work in a more transparent and impartial manner. ”23
Despite the somewhat contradictory statements by the Government representatives, the
decision by the tripartite ILO Committee on the Application of Standards means that labour
relations in Indonesia are now under close international scrutiny. Strikes, worker
demonstrations and the responses to such actions will now be closely monitored by the
international community in the years ahead. To preserve the reputation Indonesia has
established since 1998 as a tolerant modern democracy that respects workers’ rights the
Government would be well advised to fully comply with the above mentioned conclusions.
Ensuring full respect for Freedom of Association is not just a political and social matter. As
we argue below it may also have longer term implications for Indonesian involvement in
global supply chains in the manufacturing sector. Multinational companies producing
manufactured products have become highly sensitive to consumer pressure and campaigns
centred on infringements of labour rights. The record of a country on freedom of association
can therefore have important implications for foreign direct investment, employment and
economic growth. Decisions about the location of foreign investment in labour intensive
manufacturing are also heavily influenced by wage developments and unit labour costs.
Indonesia needs to carefully balance the requirements for globally competitive labour costs
and a sound record on key labour rights.
We now turn to review the long term evolution of labour laws and labour relations in
Indonesia and their impact on economic trends to explain why there is considerable
international interest in the recent labour developments.
3. The long term evolution of labour laws and institutions in Indonesia and their impact
on economic and labour market trends
Discussions about the impact of labour laws and institutions on economic and labour market
trends in Indonesia depend, to a degree, on interpretations of economic history in the country.
For over a decade some economists writing about Indonesia have lamented decisions made
about labour laws and institutions in the early years of democratic reform.24
Between 1998 and 2004 Indonesia revised most of its labour laws, established independent
trade unions and consolidated institutions such as the minimum wage fixing system.25
The
new labour laws and institutions replaced the repressive labour market practices that had
existed for the previous 32 years. They helped ensure a minimum level of equity and social
cohesion at a time when critical political and economic reforms were being implemented. But
these labour laws and institutions have also been blamed for halting the very rapid expansion
of the manufacturing sector that had occurred in the decade or so prior to democracy, and for
hindering the transfer of workers from low productivity activities in the agriculture sector and
23
Ibid, p 55.
24 Manning, C. (2008) “ The political economy of reform: labour after Soeharto”, University of Sydney, Sydney. 25 Quinn, P. (2003) Freedom of Association and Collective Bargaining: A study of Indonesian experience 1998-2003, International Labour Organization, Geneva.

22
informal economy to higher productivity jobs in manufacturing and the services sector since
the millennium.26
To put the current debate about the minimum wage fixing system and other labour market
reforms in context, it is useful to review the longer term evolution of labour market
institutions in Indonesia and, where possible, examine the relationship between these
institutions and economic or labour market developments.
3.1 The impact of labour institutions during the “New Order” from 1966 to 1998
Throughout the 32 year period of the “New Order, beginning in 1967 under President
Suharto, freedom of association and other hallmarks of a sound industrial relations system in
a democratic nation were absent. During this period the Armed Forces played a key role in
both Government and important parts of the commercial sector. In addition, many retired
senior members of the Forces became responsible for human resources and industrial
relations within enterprises. Thus when workers raised grievances at the workplace it was
common practice for companies to call the police or the military for support.27
The local
police or military would receive bribes from employers and if intimidation was not sufficient
they were prepared to use whatever force was required against the workers to end disputes
and maintain discipline at the workplace.28
Although Indonesia had a detailed labour code, which borrowed heavily from Dutch labour
legislation and had ratified ILO Convention No 98 on the Right to Organise and Collective
Bargaining in 1956, during the New Order period a number of high profile labour activists
were imprisoned and attempts to establish independent unions were harshly repressed. There
was one official trade union, the All Indonesian Trade Unions (FSPSI) which provided a
transmission mechanism for Government policy.29
Retired civil servants, military officers and
politicians often held senior positions within this State controlled trade union. The Minister of
Manpower occupied a seat on the Consultative Council of the FSPSI and the Manpower
Ministry collected union dues from workers and then transferred them to the union. At the
factory level leaders of FSPSI affiliates had no credibility because they were selected by
employers. 30
This long history of worker and trade union repression explains why even today the
involvement, or the threat of involvement, of the police and security forces to prevent strikes
or worker demonstrations is a highly symbolic and controversial. This is why the recent
decisions in the ILO Committee on the Application of Standards (see Section 2 above) has
26 Manning, C. (2008) The political economy of reform: labour after Soeharto, University of Sydney, Sydney. 27 Embassy of the United States of America, “Country report on human rights practices for Indonesia” , Jakarta,
1997. 28 Quinn, P. (2003) Freedom of Association and Collective Bargaining: A study of Indonesian experience 1998-
2003, International Labour Organization, Geneva. 29 This trade union has undergone a few name changes. For some time it was called Federasi Serikat Pekerja
Indonesia (FSPSI) and today is called Konfederasi Serikat Pekerja Seluruh Indonesia (KSPSI). 30 Peggy Kelly, “Promoting democracy and peace through social dialogue: A study of the social dialogue institutions and processes in Indonesia”, ILO, 2002, p 8.

23
such importance and could exercise a critical influence on the international image of
Indonesia.
Within this restricted framework there was however an attempt, mainly by the ILO, to
develop methods for determining wage rates. A 1958 ILO report on Indonesia had
recommended that: “the ultimate goal of wages policy should be to ensure that all wage
earners earn at least a living wage from their principal employment.”31
The notion of
ensuring that minimum wages are adequate to meet the “decent living needs” of a worker
stem from this period in the 1950s and can be traced back to ILO policy advice.
The Suharto regime maintained tight centralized control over minimum wages and kept real
wages low, but from time to time, the Government used adjustments to the minimum wage as
a way to provide some benefit to workers and prevent social unrest. In response to
international criticism about the treatment of workers, from the mid-1980s the Suharto
regime started to take some limited action to boost minimum wages and ensure minimum
wage levels were enforced.32
The creation of a pension fund for workers in the formal sector
and a national social security system also went some way towards improving the welfare of
workers. In 1996, immediately prior to the economic and political crisis, the Government
surprisingly passed legislation that dramatically increased severance payments ( by around
100% according to some estimates) and expanded their application to cover workers who
were dismissed without “just cause”.33
The first two decades of the Suharto Government were a period of major economic reform
with a focus on orthodox policies aimed at achieving macroeconomic stability. Public
investment in infrastructure and education increased rapidly.34
The oil boom and high
commodity prices during the 1970s and early 1980s provided expanding public revenues to
fund such investments. From the mid-1960s to the mid-1980s industry policy was geared
towards import substitution. When oil prices crashed in the mid-1980s, Indonesian policy
makers were keen to find new drivers of economic growth. Indonesia adopted some key
components of the “Washington consensus” policy package, including the liberalization of
international trade and greater support for foreign direct investment, although the
Government was careful not to acknowledge that it was following this liberal economic
agenda.35
These policy shifts resulted in significant and rapid structural changes within the
manufacturing sector, with export orientated labour intensive manufacturing industries like
31 Tjandra, S. and Klaveren, M. (2015) “Indonesia” in Klaveren, M., Gregory, D. and Schulten, T. (eds)
Minimum Wages, Collective Bargaining and Economic Development in Asia and Europe, Palgrave, London. 32 Tjandra, S. and Klaveren, M. (2015) “Indonesia” in Klaveren, M., Gregory, D. and Schulten, T. (eds)
Minimum Wages, Collective Bargaining and Economic Development in Asia and Europe, Palgrave, London. 33
Ministry of Manpower Law No. 3 of 1996. See Chris Manning, “Labour policy and employment creation: An
emerging crisis?”, paper prepared for Bappenas, June 2003. See in particular Table 4.2.
34 Hill 1997 35 Manning, C. (2008) The political economy of reform: labour after Soeharto, University of Sydney, Sydney.

24
textiles, garments, footwear, electronics, furniture and sporting goods recording roughly
double digit growth rates between the mid-1980s and the mid-1990s.36
Employment expanded rapidly in new factories that were created in industrial processing
zones on Java, particularly on the outskirts of Jakarta and around Bandung. As a result from
the late 1980s an urban industrial workforce began to emerge and there were some attempts
to form independent unions.37
Disputes at the workplace became more regular and intense in
the early 1990s. The Government responded aggressively with several union leaders
imprisoned and police used to break up protests. The brutal rape and murder of young female
union activist in retaliation for leading a strike at her factory attracted international
condemnation of the Government.38
Following a complaint lodged by the International Confederation of Free Trade Unions
(ICFTU) with the ILO in 1994, the Government permitted the establishment of enterprise
trade unions (SPTPs), but because they were not allowed to form federations outside the
official Government sanctioned trade union structure, they remained weak. By 1997 it is
estimated that there were around 1000 of these enterprise level unions operating in
Indonesia.39
In theory these SPTPs could act as representatives of workers in collective
bargaining at the factory level, but it was the prerogative of the employer to recognise, or not
recognise, these factory level unions as their counterpart in the bargaining process.40
Official
Government statistics indicated that around 80% of enterprises with factory level unions had
collective agreements. But these agreements never went beyond the minimum standards
established in laws and regulations. In almost all cases the agreements were drawn up my
management and presented to union officials for signing without any negotiations. The
legacy of these practices linger today, making the balance of power at the enterprise level
very uneven and the prospects of good faith collective bargaining slim.
The Indonesian economy continued to expand rapidly between 1990 and 1997, with real GDP
expanding at annual rates or around 7% to 8 % (Figure 3). In this period the contribution of
manufacturing to total output expanded significantly while the share of agriculture continued
to decline (Figure 4). The share of employment in the agriculture sector fell sharply with
formal sector employment growing rapidly up until the Asian economic crisis (Figure 5).
New job opportunities in the service sector were increasing by around 1.3 percentage points
per year between 1990 and 1997. The construction sector was the main recipient of FDI and
underwent an unsustainable boom in the lead up to the Asian economic crisis, with output
annual growth rates of around 14 % and double-digit job growth rates in the period prior to
1998 (Table 1).
36 Aswicahyono, Hill and Narjoko (2011) Indonesian Industrialization: A latecomer adjusting to crisis, UNU-
Wider working paper No 2011/53, World Institute for Development Economics Research, Helsinki. 37 Hadiz, V. (1997) Workers and the State in New Order in Indonesia, Routledge, London. 38 Quinn, P. (2003) Freedom of Association and Collective Bargaining: A study of Indonesian experience 1998-
2003, International Labour Organization, Geneva. 39 Quinn, P. (2003) Freedom of Association and Collective Bargaining: A study of Indonesian experience 1998-
2003, International Labour Organization, Geneva. 40 Peggy Kelly, op cit, 9 9.

25
Manufacturing was also expanding very rapidly with output and employment recording
annual rates of growth or around 11 % and 6 % respectively prior to the economic and
political crisis (Table 1) with sectors like textiles, clothing and metals doing particularly well.
Compositional shifts in the labour market, resulting from workers moving from agriculture to
the better paying jobs in industry and services sectors, helped reduce aggregate income
inequality and had the effect of boosting average wages up until 1997.
Although labour institutions such as trade unions, collective bargaining and minimum wage
fixing remained heavily constrained throughout the New Order period, the slight
strengthening of these institutions in the last decade of the regime occurred simultaneously
with the emergence of labour intensive manufacturing and very rapid growth in the service
sector. As a result the transfer of labour from low productivity activities in the agriculture
sector to wage employment in the industry and the service sectors accelerated rapidly. This
was reflected in a substantial increase in non-agriculture employment and formal
employment. There was no indication that more rapid wage increases and the slightly more
lenient attitude towards independent union activity and collective bargaining in the decade
prior to 1998 hindered this economic transformation.
Figure 3: GDP growth for Indonesia and the World, 1985-2015 (per cent)
Source : World bank (2015) World development indicators, World Bank, Washington D.C.

26
Figure 4: Share of GDP by economic sector, 1985-2015 (per cent)
Source: World bank (2015) World development indicators, World Bank, Washington D.C.

27
Figure 5: Share of employment by economic sector, 1985-2015 (per cent)
Source: World Bank (2015) World development indicators, World Bank, Washington D.C.
3.2. 1997-99 Asian economic crisis and the return of democracy
In August 1997 the Asian financial crisis hit Indonesia. Rapid capital outflows generated
panic and a massive devaluation of the domestic currency occurred. 41
Major parts of the
banking sector were insolvent, many companies went bankrupt or closed temporarily and
mass layoffs occurred in the industry and the services sectors. In 1998 real GDP declined by
13 % and inflation approached triple digits. Real median wages declined by roughly one third
between 1997 and 1999. The Government turned to the IMF for balance of payments support
in early 1998 and the subsequent loans came with conditions that required harsh austerity
measures. Rapid increases in electricity, fuel and transport costs plus budget cuts led to
widespread public protests. Other conditions included the privatisation of various publically
owned enterprises and public sector job cuts that exacerbated deteriorating social conditions.
Despite depression like conditions some key indicators of the labour market gave the
appearance of normality. For example, the aggregate employment to population ratio
remained virtually constant between 1996 and 1999 and the unemployment rate remained in
the 5% to 6 % range. However these indicators masked major structural changes as job losses
41 The rupiah fell from 2450/US dollar in June 1997 to 14,900/US dollar a year later.

28
were concentrated in industry and service sectors. Many of the labour intensive
manufacturing jobs which had expanded rapidly in the previous decade disappeared. As
normal in a developing country, in the absence of an adequate social safety net, desperate
workers returned to the rural and informal sectors in order to survive. These trends are
evident in Figure 7. The share of agriculture jobs in total employment had been on a
sustained and relatively rapid downward trend between the mid-1980s and 1997. However
between 1998 and 2003 this trend was reversed and the relative importance of agriculture
activities in total employment picks up. Yet from Figure 6 it is apparent that the contribution
of agriculture to total output maintained its long term downward trend, apart from a
temporary upward blip during 1998. The key labour market issue therefore became
underemployment and low productivity.
The economic crisis rapidly turned into a political crisis. The protest movement (Reformasi)
issued political demands for democracy and campaigned for an end to “corruption, collusion
and nepotism”. A number of trade unions broke away from FSPSI to join Reformasi and the
fight for democracy. The ILO supervisory system for International Labour Standards, that has
recently voiced stern criticisms of Indonesian labour practices, played a significant role in
advancing political reforms during this critical period. In November 1997 the ILO’s
Committee on Freedom of Association adopted conclusions calling on the Government to:
eliminate the requirements for union registration which impeded the right to organise; grant
registration to the Indonesian Prosperity Trade Union (SBSI) which had been force to operate
clandestinely up until that time; drop criminal charges against Mr. Pakpahan ( Chair of SBSI)
and release him from goal; institute an independent judicial inquiry into the murder of a trade
unionist; and reinstate trade unionists who had been dismissed for carrying out their duties.
In May 1998, after a 32 year dictatorship, the Suharto regime collapsed. A period of social
instability followed with violent ethnic clashes. The economic and political crisis of 1997 and
1998 was a catalyst for industrial relations reform. One month after the fall of Suharto, the
new Government led by President Habibi recognised the SBSI trade union, released Mr.
Pakpahan from prison and ratified ILO Convention No 87 on Freedom of Association and
Protection of the Right to Organise. In August 1998 the ILO sent a “direct contacts mission”
to Indonesia composed of a group of experts to provide advice to the new Government on the
legal and institutional reforms required to meet its obligations under ILO Convention 87.
During the course of the next year Indonesia ratified several other core Conventions of the
ILO.
3.3. 1999 - 2003 Economic recovery and the foundations of a strong democracy
Economic stabilisation was achieved relatively quickly. Inflation returned to single digits by
1999 and the decline in output was arrested. Between 1999 and 2003 real GDP growth
recovered and averaged 4.7% per year. This was somewhat better than the growth
performance in Thailand and the Philippines, but less impressive than Malaysia. Many of the
manufacturing establishments that had closed in 1997 and 1998 reopened in the next two

29
years. After the economy stabilised in the early 2000s, the manufacturing sector returned to
reasonable, but not spectacular economic growth rates.
However, the employment performance of manufacturing growth deteriorated significantly
for a number of years prompting talk of “deindustrialisation” and raising concerns about
labour market flexibility. In fact as can be seen from the Table 1, output in manufacturing had
expanded at a very rapid 11% a year in the period prior to the crisis. In the period between
2000 and 2008 manufacturing output growth was back expanding at annual rates above 5 % ,
but the employment picture was far less bright. Employment growth had averaged 6 % a year
prior to the crisis, but between 2000 and 2008 the rate of job growth did not even reach 1% a
year.
This deterioration in the manufacturing employment performance after the Asian economic
crisis continues to feature in much of the important economic literature about Indonesia
today. For example, in late 2015 influential observers of the Indonesian economy were
claiming that “manufacturing has been held back by labour-market policies and low levels of
labour productivity”.42
Consequently this paper focus considerable attention on the historical
job trends in manufacturing and their interaction with changes in labour laws and institutions.
This is why Table 1 contains data from overlapping time periods. Columns three and four in
Table 1 update the information in the first two columns that has strongly influenced policy
debates in the past. The picture that emerges is somewhat mixed. While it is clear that both
economic and employment growth rates in the manufacturing sector never recaptured the
very rapid pace that was evident between 1990 and 1996, the employment intensity of growth
in manufacturing ( or employment elasticity) did get back to pre- crisis levels by around the
mid-2000s.
It is also evident from Table 1 that in parts of the largely non-unionised service sector there
was a similar slowdown in employment growth and decline in the employment elasticity in
the early 2000s. This certainly seems to be the case in the transport, storage and
communication sector and to a lesser degree in the wholesale and retail trade sector. These
developments in the service sector of Indonesia, and similar trends in other parts of South
East Asia, have been studied closely by a number of academics and the decline in the
employment intensity of growth can be attributed largely to technological change and
economies of scale in these industries.43
Table 1: Sector output growth and employment growth, 1990-2014
GDP growth (average % p.a)
1990-
1996
2000-
2008 2005-2009
2010-
2014
Agriculture, Forestry, Hunting and Fishery 3.1 3.9 3.9 4.2
Mining and Quarrying 5.3 1.5 2.2 2.4
Manufacturing 11.2 5.2 3.8 5.2
Electricity, Gas and Water N/A N/A 10.3 6.4
42 Arief Anshory Yusuf and Andy Summer, “Growth, poverty and inequality under Jokowi”, Bulletin of
Indonesian Economic Studies, Vol 51, No. 3, 2015, p 335. 43 Aswicahyono, H., Hill, H. and Narjoko, D. (2012) Industrialization: Patterns, issues and constraints, in Hill,
H., Khan, M and Zhuang, J (eds) Diagnosing the Indonesian economy: Towards inclusive and green growth, Asian Development Bank, Manila.

30
Construction 13.7 6.5 7.9 7.2
Wholesale Trade, Retail Trade, Restaurant and Hotels 8.9 5.8 5.8 6.2
Transportation, Storage and Communication 8.2 10.1 15.2 9.4
Financing, Insurance, Real Estate and Business Services N/A N/A 6.7 7.4
Community, Social, and Personal Services N/A N/A 6.3 5.8
Other activities 6.4 5.8 N/A N/A
Total 7.9 5.3 5.6 5.7
Employment growth ( average % p.a)
1990-
1996
2000-
2008 2005-2009
2010-
2014
Agriculture, Forestry, Hunting and Fishery -1.7 0.2 0.2 -1.6
Mining and Quarrying 6 3.7 6.3 2.7
Manufacturing 6 0.9 1.8 2.0
Electricity, Gas and Water N/A N/A 3.5 4.3
Construction 10.8 5.7 4.7 5.4
Wholesale Trade, Retail Trade, Restaurant and Hotels 6.5 1.7 5.2 2.0
Transportation, Storage and Communication 9.4 3.9 2.0 -1.9
Financing, Insurance, Real Estate and Business Services N/A N/A 6.8 11.7
Community, Social, and Personal Services N/A N/A 7.9 2.9
Other activities 4.6 3.6 N/A N/A
Total 2.3 1.7 2.8 1.5
Implied Employment Elasticities
1990-
1996
2000-
2008 2005-2009
2010-
2014
Agriculture, Forestry, Hunting and Fishery -0.6 0.1 0.0 -0.4
Mining and Quarrying 1.1 2.6 2.9 1.1
Manufacturing 0.5 0.2 0.5 0.4
Electricity, Gas and Water N/A N/A 0.3 0.7
Construction 0.8 0.9 0.6 0.8
Wholesale Trade, Retail Trade, Restaurant and Hotels 0.7 0.3 0.9 0.3
Transportation, Storage and Communication 1.1 0.4 0.1 -0.2
Financing, Insurance, Real Estate and Business Services N/A N/A 1.0 1.6
Community, Social, and Personal Services N/A N/A 1.2 0.5
Other activities 0.7 0.6 N/A N/A
Total 0.3 0.3 0.5 0.3
Source: BPS (2015) National Accounts, Badan Pusat Statistik, Jakarta; Aswicahyono, H.,
Hill, H. and Narjoko, D. (2012) Industrialization: Patterns, issues and constraints, in Hill,
H., Khan, M and Zhuang, J (eds) Diagnosing the Indonesian economy: Towards inclusive
and green growth, Asian Development Bank, Manila. Notes: Based on CAGR; 2010-2014
GDP growth based on gross value added; 2011-2014 employed data based on revised
population weights; 2010-2014 GDP at 2010 constant prices; 2000-2009 GDP at 2000
constant prices.
However the failure of Indonesia to recapture the progress that had been evident prior to the
crisis in transferring labour from low productivity agriculture to wage employment in
manufacturing, once the economic recovery was underway, cannot really be explained by
technological change. Difficulties in acquiring land, the industrial zoning of land, inadequate
infrastructure and burdensome licensing requirements are among the many factors that have
hindered manufacturing performance. In addition some academics and institutions focused
attention on the changes to labour laws and institutions in the early 2000s as a possible factor

31
explaining “jobless growth” in manufacturing.44
The main components of the labour reforms
in this period were the:
- Trade Union Act which was passed in 2000;
- Manpower Act, adopted in February 2003; and the
- Industrial Relations Disputes Settlement Act, adopted in 2004.
Each of these major pieces of labour legislation required a number of Government
regulations, Ministerial Decisions and/or Presidential Decrees to spell out the details and
make the legislation operational. As a consequence the new legislative framework was not
really in place until the mid-2000s. It is therefore difficult to attribute economic and labour
market developments between 1999 and 2003 to the new labour legislation, but other labour
related factors may have exerted an influence.
For example, the establishment of new independent trade unions did progress more rapidly.
By February 2003, there were some 66 trade union federations registered nationally and more
than 11,000 enterprise level unions registered locally. New trade union confederations (such
as KSPI and SBSI) also emerged and the old Government controlled trade union
confederation restructured itself in 2002. Despite the rapid proliferation of trade unions, the
impact on trade union density was far less dramatic. Accurate estimates of trade union
membership are often difficult to establish as trade unions have a vested interest in
exaggerating their strength to secure the right to collective bargaining or membership of
committees and organisations that require them to be “representative”. Taking these factors
into account, an ILO report in 2003 suggested that “given the difficult economic
circumstances for much of the past five years, it is perhaps unlikely that overall union
membership is higher than it was before 1998”.45
One labour market institution that did have an unambiguously stronger impact in the
immediate aftermath of the political crisis was the minimum wage fixing machinery. As
mentioned above, the key components of minimum wage fixing system, including the
requirement for adjustments to take into account “minimum physical needs” of a single
worker had existed for several decades. This was changed to “minimum living needs” after
the political crisis and subsequently to “decent living needs”.
The methodology for calculating the “needs” of a single worker in Indonesia has been
relatively scientific compared to the way minimum wages are adjusted in many other
countries. In Indonesia it has involved determining a consumption basket composed of food
and non-food items that are considered essential, and then undertaking a survey to assess
changes in the costs of these items in traditional markets. Throughout the period from the
1950s to 2000, different minimum wage levels existed for each Province, as living costs
varied significantly from region to region. But up until 2000 the final decision regarding the
minimum wage level for each Province was centralised in the hands of the Manpower
44 Manning, C. (2008) The political economy of reform: labour after Soeharto, University of Sydney, Sydney. 45 Quinn, P. (2003) Freedom of Association and Collective Bargaining: A study of Indonesian experience 1998-2003, International Labour Organization, Geneva.

32
Minister. In making this decision, the Minister took into account recommendations from the
Provinces.
As part of a much wider reform to decentralise political power and administrative control to
the regions, the final responsibility for determining minimum wage increases was transferred
to the Provincial level in 2000. For the next 15 years it was the Provincial Governor who
made the final decision, sometimes based on recommendations from the district level
authorities. The decentralisation of decision making, combined with central Government
support for income redistribution after generations of repression and the dramatic real wage
declines in 1998, resulted in some significant minimum wage increases in the early 2000s.
For example, the nominal minimum wage in the Jakarta Province rose by 21 % and 39 % in
2001 and 2002 respectively. The simple average increase for all Provinces was 16 % and 17
% in 2001 and 2002 respectively (see Annex for details). However by 2003 wage moderation
had been restored.
Employment protection legislation was also subjected to some important changes in this
period. In 2000 the Government increased severance payments again and made some further
changes to the rules that curtailed access to these benefits for those workers dismissed after
committing what the legislation terms a “major offense”.46
The combination of rapidly rising
minimum wages, higher severance payments and better enforcement of employment
protection legislation would have had a significant impact on the economic cost of dismissal,
particularly given that severance payments are expressed as multiple of the monthly wage
rate.
As noted above the failure of manufacturing and service sectors to recapture the rapid pace of
employment growth they had exhibited in the pre-crisis period has promoted some observers
to suggest that the new labour laws passed between 2000 and 2004, the rise of independent
trade unions and rapid minimum wage increases retarded investment and discouraged hiring
in the non-agriculture sector. Of these three factors the most significant was probably the
rapid minimum wage increases that were concentrated in 2001 and 2002.
However, attributing the more modest labour market outcomes in the early 2000s to the
strengthening of labour market institutions ignores the political and administrative upheavals
that were taking place in Indonesia through this period. For example, between 1998 and 2004
there were five national Presidents. In this period the role of the Parliament and the civil
service were fundamentally reformed and the power of these institutions vis-a–via the
President were strengthened. On top of this, Provincial and district level government
structures were completely revised and strengthened as the process of decentralisation took
place in an effort to hold the nation together. There was also a significant threat of terrorism,
as the Bali bombing in October 2002 underlined.
The impact of this political transformation on business confidence, foreign direct investment
and the willingness of local entrepreneurs to enter into long term financial commitments must
46 Chris Manning, “Labour Policy and employment creation: An emerging crisis?”, paper prepared for
Bappenas, June 2003, pp 79-84.

33
be taken into account when reviewing the general economic and labour market performance
of the period. Changes in labour laws and institutions were an important aspect of the
transition to democracy, and this transition was neither smooth or without short term
economic consequences. But one could hardly expect any other outcome when the fourth
most populated country in the world moves from autocratic rule to a modern democratic
nation.
3.4. 2004-2016: Robust economic growth and reasonable labour market outcomes
After 2004 the democratic process was strengthened further through popular elections for
heads of Provinces, cities and districts. At national level, President Bambang
SusiloYudhoyono served two full terms without any major political crisis.47
The country was
unified by the tragedy of the 2004 tsunami and efforts to address terrorism. This period of
increased political stability coincided with more robust economic growth, declining poverty
and an expansion of regular wage employment.
International economic developments supported these more positive domestic outcomes.
Back in 2001 China had gained entry to the World Trade Organisation. This was to have a
profound impact on the world economy and particularly the economies that could satisfy the
rapid expansion in Chinese demand for commodities. By late 2003 and early 2004 the
upsurge in world commodity prices was underway. Global prices for coal, crude oil, rubber
and crude palm oil increased roughly three fold between the early 2000s and 2011 (see Figure
6).
47 Edward Aspinall, Marcus Mietzner and Dirk Tomsa ( editors), The Yudhoyono Presidency : Indonesia’s Decade of Stability and Stagnation, Institute of Southeast Asian Studies, 2015.

34
Figure 6: Commodity price index for key Indonesian exports in the world market, 2001-
2016
Source: IMF (2015) International financial statistics, International Monetary Fund,
Washington, D.C.
By 2004 annual GDP growth was back up to 5 % and growth rates remained roughly in the 5
% to 7 % range for the next decade (see Figure 3). Even when the global economic crisis hit
in 2007 and 2008 the impact on Indonesian economic growth was modest. Exports fell
sharply for a period but recovered quickly thanks to robust demand from China. Robust
economic growth throughout the decade from 2004 to 2014 was partly the result of
reinvesting wealth derived from primary industries, such as coal and palm oil, into urban
construction, the expansion of the services sector and domestic consumption.
The increased incomes and wealth generated by the global commodities boom fuelled rising
investment in the non-traded goods sector. Private construction investment in urban centres
boomed. In fact by 2012 building investment accounted for 85 % of total fixed investment.
Moreover, these trends resulted in gross fixed capital formation as a share of GDP increasing
from a low of around 19 % of GDP in the period from 1999 to 2003 up to a peak of around
32 % in the period from 2010 to 2014 (see Figure 7). The contribution of total investment to
GDP in recent years has significantly exceeded the levels reached in the period before the
Asian economic crisis at the end of the 1990s.

35
Clearly there has been no shortage of private investment in recent years. However, legitimate
questions can be asked about whether private investment in the decade up to 2014 was
flowing into the most productive sectors of economy or rather contributing to unsustainable
“bubbles” in the non- traded goods sector. The employment generation effects of these
investment flows was also less than optimal.
As suggested previously the end of the global commodities boom since 2012 has forced
policy makers to be more proactive in trying to direct FDI into manufacturing and in
particular labour intensive manufacturing. These efforts have intensified since mid 2015.
Private investment in these sectors is obviously more sensitive to labour costs and labour
institutions. And while there has been a lot of concern in the last two years about labour
rigidities deterring FDI in labour intensive sectors new investors have continued to establish
factories.
Indeed at least some surveys of private investment intentions rate Indonesia as the country
most likely to attract FDI in the future. For example, a 2014 Economist Intelligence Unit
survey of foreign owned manufactures in South East Asia suggested that the number of
foreign manufacturing plants in Indonesia was expected to increase by some 68 % over the
next 5 years. This was roughly double the rate of expansion in other parts of Southeast Asia. 48
Moreover the most recent “Investment Climate Monitoring Survey” highlighted
macroeconomic instability, logistical costs and regulatory uncertainty as the main obstacles to
doing business.49
Labour issues were relevant but did not feature among the top concerns of
the business community responding to this survey. Interviews by the authors with enterprise
managers in labour intensive manufacturing in July to September 2015 also suggested that
labour costs, skill shortages and labour unrest could potentially influence investment and
employment decisions. But these issues were far less significant than trade policy,
infrastructure and other macroeconomic factors.
48Economist Intelligence Unit, “Re-drawing the ASEAN map. How companies are crafting new strategies in
Southeast Asia”, 2014. 49 LPEM-FEUI (2014) Investment Climate Monitoring Survey, Institute for Economic and Social Research, Faculty of Economics, University of Indonesia, Jakarta.

36
Figure 7: Trends gross fixed capital formation, 1985-2015 (per cent)
Source: World Bank (2014) World development indicators, World Bank, Washington D.C.
Since mid-2015 public investment in critical infrastructure, such as communication networks,
airports, shipping ports and roads has become the overwhelming priority of Government
policy. This commitment is strongly supported by both the general public and those
commenting on economic policy because Indonesia has lagged well behind other middle
income and emerging economies in terms of infrastructure investment. This point was
recognised by the Government when it made a commitment in early 2015 to use much of the
fiscal space generated by cutting fuel subsidies for critical infrastructure investment.
Translating this commitment into practice took time but by late 2015 progress was becoming
evident. In fact higher Government investment in infrastructure was a key factor driving the
5.3 % increase in fixed capital investment in the first six months of 2016.
The other main engine of growth throughout the period from 2004 to 2016 was private
consumption expenditure, reflecting the wealth effects of the commodity boom, rising asset
prices and sharp increases in real wages in particular periods like 2003 and again in 2013.
National accounts data suggest that private consumption has held up well in the last few years
despite increasing economic uncertainty and volatile asset prices. One long term factor
underpinning the private construction boom and rising consumption has been rapid rural-
urban migration. Indeed, Indonesia is leading the world in terms of the expansion of

37
urbanization and it is expected that as much as 68 % of the population may reside in urban
areas by 2035 which greatly exacerbates the public infrastructure deficit.50
The distribution of the benefits of growth have dominated much of the political-economy
debates in the last two decades and particularly since the early 2000s. Increased prosperity
did “trickle down” to the poor during much of this period. At least there was an impressive
reduction in measured poverty levels. Consumption based indicators of poverty declined from
24 % to 12 % between the late 1990s and 2012 (Figure 8). Improvements in poverty
reduction programs, substantial increases in minimum wages between 1998 and 2002 and
less volatility in food prices contributed to this result.
Rising income inequality emerged as a major challenge confronting Indonesia in the 2000s
and continues to feature prominently in both popular discourse and policy discussions.
Interestingly all sides in the economic debate cite rising income inequality as a reason to
support their policy prescriptions. The Gini index, based on consumption expenditure, is a
widely used measure of inequality where a value of 0 represents complete equality and 1
equals complete inequality. In Indonesia this measure was relatively stable for long periods
prior to the Asian economic crisis at the end of the 1990s. During the late 1990s the index fell
because the value of the financial and property assets held by the very wealthy plummeted
while low and middle income groups experienced less dramatic declines in expenditure.
Consequently in 2000 the index was at around 0.3 (Figure 8).
Then as political and economic stability was restored the index rose rapidly, albeit with some
fluctuations, to reach 0.41 in 2011. For income inequality to shoot up by more than one-third
in just over a decade is a dramatic outcome. The increase in inequality in Indonesia through
this period was similar to the experience in China and in stark contrast to a number of other
countries in the region like Malaysia, Thailand and Vietnam which either reduced or
stabilised their inequality levels. In the last five years the Gini indicator for Indonesia would
suggest that inequality has stabilised at a very high level (Figure 8).
The sharp rise in inequality took place after the political reforms in the late 1990s and the
decision to decentralise many aspects of government authority to Provincial and district
authorities. The rapidly widening of the gap between rich and poor was inconsistent with
stated Government policy and the expectations of the general public in the new democratic
Indonesia. Rising inequality not only undermines social justice objectives but can also have
adverse economic consequences.51
This helps explain why in the last few years there is
considerable attention devoted to rising inequality in Indonesia. In late 2015 the World Bank
released an impressive report on the subject and highlighted that economic growth over the
past decade has benefitted the richest 20 % of the population while the remaining 80 % have
50 World Bank (2014) Indonesia Economic Quarterly, March 2014: Investment in flux, World Bank Country
Office for Indonesia, Jakarta. 51 Ostry, J., Berg, A., and Tsangarides, C. (2014) Redistribution, inequality and growth, International Monetary
Fund, Washington, D.C.; ESCAP (2013) The Economic and Social Survey of Asia and the Pacific 2013.
Bangkok: ESCAP; ESCAP (2014) The Economic and Social Survey of Asia and the Pacific 2014. Bangkok: ESCAP.

38
been left behind. The World Bank warned that rising income inequality may lead to slower
growth and an increased risk of conflict. 52
Figure 8: Percentage of people living in poverty and the GINI ratio, 1996-2016
Source: BPS (2015) Poverty statistics, Badan Pusat Statistic, Jakarta.
It is generally recognised that the official data on expenditure based measures of income
inequality in Indonesia (such as that in Figure 8) significantly understate the true gap between
the incomes of the rich and poor. There are several reasons for this including the fact that
many wealthy citizens simply refuse to participate in official Government surveys of
household expenditure because they fear being caught for tax evasion. Figure 9 compares
trends in the Gini coefficient using expenditure data and a measure of inequality based on
primary wage data for all employees. The first point to note is that the primary wage
inequality measure is significantly higher than the standard consumption Gini throughout the
period under review. Second, it is evident that the wage inequality indicator declined
somewhat between 2001 and 2003, but then increased rapidly over the next 6 years, peaking
around 2008. Between 2009 and 2011 this indicator of wage inequality fluctuated and then
remained flat over the last three years. The data on consumption inequality also suggests a
general upward trend after the early 2000s and a more distinct upward jump between 2008
and 2011. Consumption based inequality then stabilises at this high level.
52 World Bank (2015) Indonesia’s Rising Divide: why inequality is rising, why it matters and what can be done. Jakarta: World Bank.

39
Figure 9: Consumption GINI and primary wage inequality for regular employees and
all income earners (2001-2015)53
Source: BPS (2014) SUSENAS and SAKERNAS (selected years), Badan Pusat Statistik,
Jakarta.
During the period from 2003 to 2012 the growth in nominal minimum wages was moderate
and average real wage levels of blue collar workers either declined or remained flat. For
much of this period both measures of inequality suggest that the gap between the rich and the
poor was expanding rapidly. This prolonged period of real wage moderation subsequently led
to pressure for wage “catch-up” and nominal minimum wages jumped sharply between 2012
and 2014, leading to significant real wage increases. In this latter period the upward surge in
inequality plateaued according to both the consumption based Gini and the primary wage
data. There are many factors impinging on income inequality, including the impact of the
commodity boom, tax policy, educational attainment and the degree of gender equality. But
the observed trends are consistent with the view that increases in real minimum wages might
be one way to contain excessive income inequality.
Given relatively robust economic growth in the last decade and a half, one would expect to
see signs that the job market improved over this period. And indeed the economic recovery
was reflected in an improved labour market performance. In particular, the trends in non-
53 All income earners refers to own account workers, regular employees and casual employees, which accounts
for approximately 65% of the labour force. Income data is not available for employers assisted by casual employees and unpaid family workers, employers of permanent employees, and unpaid family workers.

40
agriculture employment and formal sector employment returned to steady growth rates.
Within the formal sector, job growth was concentrated in the services sector (Figure 5). At
the same time, employment in agriculture returned to its long term declining trend, as
workers who had turned to their extended families in rural areas as a survival strategy during
the economic crisis were able to resume their lives in urban communities and re-establish
themselves in more decent jobs.
Between 2004 and 2014, the share of total employment in the agriculture sector declined
from 43 % to 34 %.That is a decline of almost one quarter over the course of a decade.
Nevertheless, the pace at which workers were making the move from agriculture to the
service and manufacturing sectors was less specular than the progress achieved in the early to
mid-1990s. Moreover, with roughly one third of all workers still in the agriculture sector
today, there is still plenty of scope to accelerate the transformation from low productivity
activities to higher productivity and better paid job opportunities in manufacturing and
services.
That said, the strengthening of the labour market since the mid-2000s has received
insufficient attention in the discussions about labour market reforms. Since 2010 Indonesia
has accelerated the expansion of regular wage employment and somewhat reduced reliance
on employment forms that are closely associated with the informal economy, such as own
account workers and unpaid workers (Figure 10). It is notable that these trends have been
maintained in the last two years despite suggestions that labour demand in manufacturing was
starting to soften. In fact, in 2004 there were 25.4 million workers employed as regular
employees, and by 2015 this had increased to 44.4 million. As a result the ratio of regular
employment to total employment has risen in recent years.54
One medium term factor behind the increase in regular wage employment is the structural
transformation of the economy, with wage employment expanding in the manufacturing and
services sectors. More precisely, of the 17.0 million additional regular wage jobs created
between 2004 and 2014, 3.1 million were in the manufacturing sector, 3.2 million were in the
trade, hotels and restaurants sector, and 5.7 million were in the community, social and
personal services sector.
54 Allen, E. (2015) Labour and social trends in Indonesia 2014-2015: Strengthening competitiveness and productivity through decent work, ILO Country Office for Indonesia and Timor-Leste, Jakarta.

41
Figure 10: Status in employment, 2006-2015
Source: BPS (2015) SAKERNAS (selected years), Badan Pusat Statistik, Jakarta.
From Table 1, it can be seen that the growth of output and jobs in the manufacturing sector in
the late 2000s and early 2010s was robust, but not specular. Annual growth in manufacturing
output in the period 2005 to 2009 was 3.8 % and this accelerated to 5.2 % in the period from
2010 to 2014. Thus manufacturing output growth never recaptured the “golden age” that
prevailed prior to the Asian economic crisis when it was roughly double the level achieved
recently.
The more modest growth in manufacturing output in the last decade was not confined to
Indonesia. These trends were either worse or very similar throughout the region, including in
competitor countries like Thailand and Malaysia where trade unions and labour institutions
are less potent. An important explanation for the more modest outcomes in export orientated
Indonesian manufacturing after the early 2000s was the competitive advantage of Chinese
exporters and the impact of currency appreciation in Indonesia as the commodities boom took
hold. It is probably fair to conclude that Indonesia caught a mild dose of the “Dutch disease”
through this period.
However, the employment intensity of growth in the manufacturing sector did improve after
the early 2000s. Between 2005 and 2009, the implied employment elasticity of manufacturing
was back at the level that had existed in the boom period prior to the Asian economic crisis.
Moreover, it remained very close to that level in the period 2010 to 2014 (see Table 1).

42
Table 2 provides more detail on labour market trends in the manufacturing sector. It depicts
trends for regular employment in the labour intensive, resource intensive and capital intensive
industries within the manufacturing sector.55
It is evident that regular wage employment in all
three sub sectors of manufacturing was relatively stable in the period between 2004 and 2009.
However wage employment, in all three sub sectors of manufacturing expanded fairly rapidly
in the period from 2009 to 2014. In fact, over this most recent period wage employment in
labour intensive manufacturing rose by 42 % and wage employment in all manufacturing
jumped by an impressive 49 %.
Again it is interesting, but not necessarily conclusive, to compare these manufacturing
employment trends with minimum wage and average wage developments. For example, in
the mid to late 2000s minimum wages growth was very modest and real wages for employees
in both the manufacturing and service sectors were either flat or declining. This was also a
period in which manufacturing employment levels were stagnant. The more recent rapid
expansion in wage employment in manufacturing between 2009 and 2014 coincided with
fairly rapid minimum wage increases between 2012 and 2014 and a significant hike in real
wages in this sector.
A closer look at trends in labour intensive, resource intensive and capital intensive industries
within the manufacturing sector reveals that wage growth in labour intensive industries has
been more moderate than in the capital and resource intensive industries. Over time wages in
labour intensive manufacturing have hovered close to the minimum wage, while workers in
the capital intensive and resource intensive manufacturing sub sectors have enjoyed a
substantial wage premium. In 2014 the average wage for an employee in capital intensive
manufacturing was roughly 60 % higher than that paid to an employee in labour intensive
manufacturing. The corresponding wage differential in resource intensive manufacturing was
roughly 30 %. These wage differentials make sense given skill requirements and labour
productivity across the sub-sectors.
Overall these results suggest that the “old” minimum wage system was compatible with
robust employment growth across manufacturing in the last half decade and also that the
system of wage differentials across sub sectors of manufacturing was sufficient to encourage
up-skilling and labour mobility from low skilled labour intensive activities to higher skilled
capital intensive industries.
Table 2: Trends for regular wage employees in manufacturing
Manufacturing sub-sector 2004 2009 2014
Number of regular employees (millions)
Labour intensive 3.4 3.1 4.4
Resource intensive 2.8 2.9 3.6
Capital intensive 0.7 0.8 2.1
Total manufacturing employees 6.9 6.8 10.1
Total employees in all sectors 25.4 29.1 42.4
55 Aswicahyono, H., H. Hill and D. Narjoko. (2010) Industrialisation after a Deep Economic Crisis: Indonesia, Journal of Development Studies, 46 (6): 1084–1108.

43
Average wages for regular employees (IDR millions)
Labour intensive 0.7 1.0 1.4
Resource intensive 0.7 1.2 1.8
Capital intensive 0.9 1.4 2.2
Total manufacturing employees 0.7 1.1 1.7
Total employees in all sectors 0.7 1.3 2.0
Simple average minimum wage 0.5 0.8 1.5
Source: BPS (2014) Sakernas (selected years), Badan Pusat Statistik, Jakarta.
Over the last decade manufacturing exports have expanded, largely due to the resource
intensive and labour intensive manufacturing industries. They suffered a setback at the outset
of the global financial crisis but expanded again between 2009 and 2011. In the last few years
slow growth in advanced economies and more recently increasing uncertainty in large
emerging economies has started to weigh on manufacturing exports from Indonesia.
Agricultural exports have been relatively flat, while mining, oil and gas exports have declined
since the end of the commodity boom. In 2015 export performance did weaken due to
declining demand from China, Japan and ASEAN countries. But given there has been no
recent strengthening of labour market institutions or laws this very recent performance should
not be attributed to labour market rigidities. It is however worth emphasizing that there is
tremendous potential for expanding merchandise trade in the future. Indonesia currently only
accounts for 1% of merchandise trade exports and gains are needed to improve the ease of
doing business in order to optimize trade potential.
4. Labour reforms under the Widodo Government
4.1 The process leading to the 2015 wage reforms
There have been many proposals to reform the minimum wage fixing system in the last few
decades but until recently there was never sufficient consensus, or commitment from the
Government, to push through far reaching reforms. This changed with the election of
President Joko “Jokowi” Widodo in 2014. Perhaps in a bid to distinguish itself from the
previous Administration, the new Government rapidly announced reforms to fuel subsidies
that the World Bank and other economic institutions had long championed. The planning of
labour reforms was also initiated in the very early period of the new Administration.
In fact officials from the Coordination Board for National Investment (BKPM) were in
contact with officials from the ILO Jakarta Office in 2014 about potential reforms to the
minimum wage system. BKPM sought ILO cooperation in securing trade union support for
the reforms.56
The ILO subsequently organised a number of workshops for trade union
representatives in the months that followed to explore potential wage reforms. ILO officials
also issued reports, and made presentations that included significant criticisms of the old
minimum wage system.57
But these arguments failed to influence the main independent trade
unions. In fact the union movement was heavily committed to retaining the “KHL” process
56 Based on discussions between the authors and the Director of the ILO Jakarta Office in 2014. 57 ILO, “Indonesia: Trends in productivity and wages”, January 2015
44
described in the Box 3. The only reform the trade union movement supported was an
expansion in the number of items included in the basket of goods used to calculate the KHL
estimate.
Box 3: The “old” minimum wage system in Indonesia prior to Government Regulation
78 of 2015 and ILO criticisms of this system
Indonesia has a long history with minimum wage fixing and a comprehensive system of
Provincial, district and sector level minimum wages. Prior to October 2015 minimum wages
were adjusted annually based on decisions by Provincial Governors. In the old minimum
wage system there was considerable input into the decision making process from district level
wage councils that included representatives of local trade unions, local employers and local
government representatives from the Manpower Office. This tripartite wage council was
responsible for estimating the wage needed for a single worker to achieve a “minimum decent
standard of living” or the “kebutuhan hidup layak” (KHL) in that particular district.
The process of estimating the KHL involved undertaking a price survey of a “basket” of food
and other basic commodities. In the past there were often disputes in the wage council over
the methodology for implementing this survey. Arguments centred on the number of items
required in the “basket”, the quality of the goods and services to be measured as well as the
price movements. Consequently trade unions and employers often undertook separate surveys
and arrived at significantly different estimates of the KHL. They were then required to
engage in dialogue and negotiation designed to reach consensus on an official KHL estimate.
The wage council would then present recommendations to the Governor of the Province, and
the decision on the minimum wage level was ultimately in the hands of this democratically
elected regional politician. In many cases the Governor was presented with competing
estimates from trade unions and employers and also received input from Mayors and district
level leaders. The Governor was thus required to arbitrate between different estimates of the
required minimum wage.
The above process varies somewhat between Provinces. For example in Java different
minimum wage rates apply at the district level whereas in some other Provinces there is one
minimum wage. Minimum wage differentials between districts and Provinces can be very
substantial.
Despite the lack of trade union support for reform the Government decided to move ahead in
planning for a new minimum wage fixing system under the political leadership of the highly
experienced and well respected Vice President, Jusuf Kalla. The Vice President has strong
links to the national and international business community in Indonesia. The technical team
supporting this initiative was composed of senior staff from within the Office of the Vice
President in consultation with officials from the Economic Coordination Ministry (
MENKO), the Planning Ministry (BAPPENAS), the Manpower Ministry, the Coordination
Board for National Investment and a few international economic advisors. The reformers
were thus a mixed group of highly trained economists and a few people with more hands on
experience in the world of work. None of them had strong links to the trade union movement
45
and several had been party to previous failed attempts to reform the labour market. It is
understood that each of these Government institutions were invited to submit proposals about
how the minimum wage system should be reformed. The trade unions also submitted a
proposal in writing, which was to maintain the “old” minimum wage system with an
expanded range of goods used to calculate the KHL.
The internal discussions on the reforms dragged on, and it was not until October 2015 that
Government Regulation 78 of 2015 was made public. Under this regulation, all provincial,
district and municipal minimum wage levels should be adjusted annually to reflect the
percentage increase in the national CPI and the annual percentage increase in GDP.58
This
formula replaced the process described in Box 3, thus making adjustments to the minimum
wage automatic and eliminating the complex tripartite negotiations, and erratic adjustments,
that many have criticised in the past. In addition, for Provinces with minimum wage levels
that are currently below the level deemed adequate to meet “decent living needs”, the new
system provided scope for a further adjustment over the next four years until that threshold is
reached.59
The Government and the main employers’ organisation in Indonesia (APINDO) claimed that
the minimum wage reforms would depoliticise the process, provide greater certainty for
business about future labour cost trends and help eliminate the strikes and protests that have
traditionally accompanied annual minimum wage negotiations. Proponents of the reforms
have emphasised that they would produce a more “fair, simple and reliable” minimum wage
system. The World Bank has given the new minimum wage system a fairly positive review.
After highlighting the large nominal wage adjustments that took place in 2013 the World
Bank described the new approach as “promising”, but also argued that:
“…it fails to address productivity and still allows discretionary adjustments by
provincial Governors, continuing the uncertainty”.60
While most trade unions and employers understand the basic intention of the reforms was to
link annual minimum wage adjustments directly to official government data on national real
economic growth and inflation, there is still considerable confusion about various provisions
in the Regulation that go beyond the formula. For example, the Regulation also contains
provisions concerning wages scales and sector minimum wage levels that have not yet been
clarified in more detailed Ministerial decrees. In theory these provisions offer considerable
58 More precisely Article 44 (2) of Government Regulation 78 of 2015 provides a formula whereby the
minimum wage increase in all Provinces and all districts for 2016 would be based on the percentage increase in
the national CPI over the year to the September quarter of 2015 plus the percentage increase in real national
GDP over the year to the June quarter of 2015. This means that minimum wage decisions, that historically have
been discussed and determined in the latter part of the year and early part of the new year, will take into account
the most recently available date from the national accounts ( for real GDP) and CPI movements. Government
regulation 78 of 2015 envisages that this formula will apply for the next 5 years and thus minimum wages will
be adjusted annually to reflect recorded increases in the national CPI and real national GDP movements. 59 Regulation 78/2015, Chapter 9, Article 63 (a). 60 World Bank, “Indonesia’s Rising Divide: why inequality is rising, why it matters and what can be done”, November 2015, p 31.

46
flexibility, which if utilised carefully, would greatly influence the impact and acceptance of
the minimum wage reforms.
4.2 The impact of reforms on wage levels and economic development
Given the increase in real national GDP over the year to the June quarter of 2015 and CPI
movements over the year to the September quarter of 2015, the formula provided by the
Government would imply that minimum wage levels in most Provinces (those currently with
minimum wage levels above the decent living standard) should have increased by 11.5% in
early 2016. This is substantially less than the minimum wage increases many workers were
expecting prior to the reforms. For example, in Jakarta, during the last few months of 2015
trade unions were campaigning for a nominal minimum wage increase of 22 % for 2016. This
expectation was based on the survey they conducted of price movements in the basket of
goods used for measuring a “decent living standard” (KHL).61
The very large difference
between the official national inflation rate ( as measured by the consumer price index) and
the KHL, which is suppose to be a measure of inflation experienced by working families, can
be partly explained by rapid increases in food prices which make up a high proportion of the
KHL consumption basket.
In reality it seems that strict implementation of the new wage formula was delayed and
compromises were reached in many Provinces. For example, in late October 2015 the
Governor of Jakarta went ahead and announced a minimum wage increase for his Province of
14.8 % for 2016. This falls somewhere between the level suggested by the new minimum
wage formula and the demands from the trade unions. One of the highest increases to the
minimum wage in 2016 was the 17.2% increase in the Province of Gorontalo. The Province
of East Nusa Tenggara (NTT) also announced an increase substantially above that implied by
the formula (the increase was 14.0 %). The Manpower Ministry has reported that 17
Provinces have implemented minimum wage adjustments for 2016 that are not fully in
conformity with the new wage regulations. Part of the explanation for the variation observed
so far is that “decent living standard” surveys and tripartite negotiations over the 2016
minimum wage adjustment were well advanced in the Provincial wage councils prior to the
15 October 2015 announcement. It is therefore difficult to be precise about the impact the
recent reforms will have on minimum wage levels in 2016.
It is therefore easier to look backwards, rather than forwards, in trying to assess the likely
impact of the wage reforms. Figure 11 provides an indication of the impact of the reforms on
wage levels. It depicts actual past minimum wage trends in the Provinces of Jakarta and DI
Yogyakarta, as well as the simple average of minimum wages across all Provinces. These
actual outcomes are compared over the last 6 years with what would have happen to
minimum wages had they been adjusted by the new formula. It can be seen that use of the
formula would have significantly lowered minimum wage levels in Jakarta. The vast bulk of
the gap between the actual minimum wage outcome, and what would have transpired if the
formula had been in place, occurred in 2013. In that year the nominal minimum wage in the
Jakarta Province jumped 44 %. This underscores one important advantage of the new
61 Elyda, C. (2015) Workers stage protest against new wage formula, Jakarta Post, 31/10/2015.

47
formula: it will help smooth out large nominal wage increases that have occurred from time
to time in particular Provinces.
Looking at the simple average of minimum wages across all Provinces it can be seen that
actual outcomes were very slightly below what the formula would have produced between
2010 and 2012. It is only in the last three years that the actual average minimum wage for all
Provinces exceeds what would have occurred if the formula had been applied. Finally, Figure
11 shows that the application of the new minimum wage formula in a traditionally low wage
Province, such as DI Yogyakarta, would have produced minimum wage levels over the last 5
years that are well above the actual outcomes, with the gap expanding gradually over the
period.62
Figure 11: Minimum wage growth trends 2010-2016
Source: Authors calculations based on BPS data.
If we undertake the same exercise but look back over a longer time period it becomes
apparent that the application of the new minimum wage formula could have led to
substantially greater wage-push inflation in most Provinces over the last decade. Figure 12
62 The calculation about the impact that the new minimum wage formula would have had on wage trends over
the last 5 years in DI Yogyakarta does not take into account the provision in Article 63 (a) of Regulation 78
which allows for wage increases beyond what the standard formula would imply in Provinces with minimum
wages below the “decent living standard”. Thus application of the new formula may have pushed up minimum wages in DI Yogyakarta even faster than is suggested in Figures 2 and 3.

48
depicts actual minimum wage levels and compares this to what would have happened if the
formula was applied from 2003 onwards.
The “old” minimum wage fixing system generated very modest adjustments between 2003
and 2012 in most Provinces. This was a period in which real GDP growth was in the 5 % to 7
% range and the average annual increase in the CPI was 7.3%. Consequently, application of
the formula would have generated annual nominal minimum wage increases of between 12 %
and 15 % throughout this decade, and for most of the period the increases would have been at
the higher end of this spectrum. Consequently, as can be seen in Figure 12, even in a high
wage Province like Jakarta, the application of the minimum wage formula would have led to
significantly higher minimum wage levels throughout the entire period from 2004 to 2012. It
is only since 2013 that the actual minimum wage in Jakarta very marginally exceeds what the
formula would have generated. For a low wage Province, like DI Yogykarta, application of
the new formula would have produced a substantially higher minimum wage in every year
from 2004 to 2015. Moreover the gap would have progressively widened over time.
It therefore seems reasonable to conclude that the application of the minimum wage formula
would have led to higher nominal wage levels in most regions and most years during the last
decade compared to what actually occurred. This was a period when the Indonesian
authorities battled to contain inflationary pressures and decided to exercise restraint with both
monetary and fiscal policy to achieve macroeconomic stability. The Indonesian authorities
may have faced a much tougher challenge, and perhaps been inclined to apply even more
restrictive macroeconomic policies, if the minimum wage formula contained in Regulation 78
of 2015 had been operational in this period.

49
Figure 12: Minimum wage growth trends 2003 to 2016
Source: ILO calculations based on BPS data.
The counterfactual information depicted in Figures 11 and 12 should be treated with caution
because it is unlikely that the new formula, linking minimum wage increases to increases in
GDP and the CPI, would not have been supported by policy makers in the 2000s. This was a
period of relatively high inflation and policy makers in the key economic Ministries would
have been concerned about generating a price-wage-price spiral. On the other hand, the
counterfactual evidence does help to demonstrate that the recent minimum wage reforms are
rather generous towards the workers. This is particularly so in regions where wages have
traditionally lagged behind the pace setter Provinces like Jakarta. These low wage Provinces
are where trade union membership is low and unions are politically weak, such as Central
Java, DI Yogyakarta, NTT and NTB.
It is well known that many of the key economic Ministries and Bank Indonesia, would have
preferred a less generous minimum wage formula in 2015. For example, some important
participants in the internal Government debate are known to have favoured linking nominal
minimum wage adjustments to productivity improvements only. Those responsible for
macroeconomic policy are known to have argued that avoiding a link between minimum
wage adjustments and the CPI would have helped eliminate any price-wage-price spiral.
Other participants in the internal debate are known to have argued that an inflation
adjustment was warranted, but that the link to GDP should have been more modest. For
example, there were versions of the formula, that were eventually rejected, that included a

50
coefficient of between 0.2 and 0.6 in front of the GDP variable. These types of argument
would have carried even more weight during the mid to late 2000s when inflation was higher
than today.
It is probably fair to say that the formula adopted in Regulation 78 of 2015 was a compromise
between what the economists favoured and what was considered politically justifiable.
Looking forward, from a purely economic perspective, adjusting all minimum wages
annually by the full value of real GDP plus CPI movements in the previous year - regardless
of general economic circumstances - may be problematic. Particularly if the objective of the
reforms is to promote the international competitiveness of Indonesian labour intensive
manufacturing. As mentioned above many foreign investors in the clothing and footwear
sectors have indicated that they were interested in expanding their factories, or opening new
production facilities in Central Java and other low wage Provinces. This is mainly because
wage levels in these regions are very competitive with countries like Vietnam and Cambodia.
Indeed current wage levels in Central Java are not much higher than Bangladesh (Figure 13)
but this margin will probably increase in the future with the application of the new minimum
wage formula.
Looked at from this perspective, the likely economic impact of the minimum wage reforms
might vary from region to region. While the reforms will help eliminate very large nominal
wage increases in certain years the impact over the medium to longer term could be
inflationary. As mentioned above, the proponents of the minimum wage reforms have
emphasized that a formula based approach will produce more “fair, simple and reliable”
outcomes. Providing enterprises with the ability to make reliable assumptions about future
labour costs is important for encouraging business confidence, investment and job growth.
Thus the formula approach might well be seen as desirable for business providing that the
wage outcomes generated by the formula preserve, or enhance, the international
competitiveness of domestic producers. Of course if the formula being used results in
investors being able to calculate, with a high degree of certainty, that wage costs in Indonesia
will accelerate more rapidly than in competitor countries, this may not be conducive for
business confidence and investment. In short, simplicity and increased certainty about wage
outcomes are desirable, but only if they point in the right direction.
3.3 The role of minimum wages and collective bargaining
The Government has clearly indicated that it will not reopen the debate about the minimum
wage reforms in the short term. However the Government is committed to review the
reforms after 5 years. With this in mind there are many issues to consider when constructing
a sustainable long term wages policy. The role of minimum wages in the overall wage fixing
system in any nation depends to a large degree on what other mechanisms exist for adjusting
wages. If for example, there is a comprehensive system of collective bargaining at enterprise
level that genuinely reflects the principles of “good faith” bargaining over wage levels, and/or
a similar system at industry or multi-employer level, the burden on the minimum wage
system is reduced. But in countries where the system of collective bargaining is

51
underdeveloped, or non-existent, we believe the minimum wage system needs to provide
more than a “floor” to the wage structure.
Not all economists would support this view. In fact many economists see intervention
through minimum wage fixing as a rigidity that interferes with “market forces”. Others might
concede there could be a minor role for minimum wages to set a very basic floor to the wage
structure but beyond this wages should be established without any government or third party
intervention.
There are a number of more structural and industrial relations issues to consider in designing
a desirable wage fixing system. For example, the “old” Indonesian minimum wage system
(that is the system prior to October 2015) has been criticised by the ILO and others because it
generated very large geographical differentials in minimum wages. The ratio of the highest to
lowest Provincial minimum wage in 2014 was around 2.7 to 1. This differential is very high
when compared to other countries with a regional minimum wage fixing system. Some
observers might therefore suggest it would be better to have either a single national minimum
wage or at least more modest minimum wage differences across Provinces.
Other observers argue that the existing minimum wage differentials across Provinces largely
reflect the vast differences in living costs in this diverse country. Price differentials between
cities like Jakarta and locations in Central Java are very substantial despite being
geographically fairly close. One advantage of these large differentials was that the system
provided flexibility to tailor wage levels to the needs of local industry, and the economic
strategy of the region. Heterogeneous minimum wage levels across regions enabled local
government and the social partners the discretion to use wage policy as an instrument of
industry and labour market policy. For example, it allowed the representatives of workers,
employers and local Government in Central Java scope to gear their annual wage increases to
the needs of labour intensive manufacturing. It enabled them to slightly under-cut wage levels
in other countries, like Cambodia and Vietnam, who are very competitive in the low labour
cost clothing and footwear export sector. Figure 13 compares minimum wages in Central
Java with the top 20 middle and low income countries with a substantial clothing export
sector. As can be seen in early 2015, Central Java had a minimum wage below a hundred US
dollars per month. There were only three other countries with a minimum wage below this
threshold. This helps explain why much of labour intensive manufacturing in Indonesia is
moving, or contemplating a move to this part of the country.
Figure 13: Monthly minimum wages for the top 20 apparel-exporting middle and low
income countries (USD, 01 January 2015)

52
Source: ILO (2015) Minimum wages in the global garment industry: Update for 2015, ILO
Regional Office for Asia and the Pacific, Bangkok. Note: Lowest relevant rate applicable to
unskilled garment workers. Figures for Indonesia are those applying in Central Java.
By contrast in a Province such as Jakarta, which has undergone a dramatic transition in the
last twenty years to become the main hub for the financial and trade components of the
service sector, a very different wage policy is required. This is a region where income
differentials in the top half of the income distribution are very substantial. In Jakarta, wage
policy needs to play an active role in containing the income gap between the elite, who
engage in conspicuous consumption, and the vast mass of workers with incomes around or
below the minimum wage. It might therefore be argued that the promotion of social inclusion
and political stability warrant a higher priority, than say international competitiveness, when
determining wage outcomes in places like Jakarta. The resource rich regions, such as Papua
and Sulawesi, also require wage policies that are more tailored to their specific economic
context.
3.4 The impact of the 2015 wage reforms on trade unions and the balance of power at the
workplace
The independent trade union movement in Indonesia has expressed grave concerns about the
new minimum wage system. They would dispute the assertion in this paper that the new
formula based system could be considered generous from a worker perspective. In criticising
the reforms, trade unions have highlighted the importance of social dialogue and the need for
$0
$100
$200
$300
$400
$500
$600
Sri L
anka
Ban
glad
esh
Ind
ia
Ind
on
esia
Pak
ista
n
Vie
t N
am
Cam
bo
dia
Tun
isia
Ph
ilip
pin
es
Mex
ico
Ch
ina
Egyp
t
El S
alva
do
r
Mal
aysi
a
Thai
lan
d
Per
u
Mo
rocc
o
Gu
atem
ala
Ho
nd
ura
s
Turk
ey
Un
ited
Sta
tes
Do
llars

53
the stakeholders of the economy to play a role in determining wage policy.63
Leaders of
several large national trade union confederations have set out in writing their reasons for
rejecting the reforms.64
They claimed that provisions of the National Constitution have been
breached in this process because, in their view, the link of the minimum wage to “decent
living standards” has been severed.65
The international trade union movement has strongly
supported the criticisms made by national trade unions in Indonesia.66
Trade unions have also drawn attention to ILO Convention No 131 concerning minimum
wage fixing which states:
“Provision shall be made, in connection with the establishment, operation and
modification of such (minimum wage) machinery, for full consultation with
representative organisations of employers and workers concerned…”
There has been considerable debate about whether “full consultation” with both social
partners took place in Indonesia prior to reforms being announced on 15 October 2015. As
indicated above the Government attempted, in the early stages of the reform process, to use
the ILO as a bridge to the trade unions. But this process was unsuccessful because the trade
unions were not prepared to contemplate a departure from their traditional reliance on market
surveys ( the KHL process) and social dialogue to determine what level of minimum wage
was required to provide a decent living standard.
Also as noted above, debate about the minimum wage reforms did take place over a period of
many months between various Ministries and Government Agencies with the technical
support of international organisations and academics. It is also recognised that the main
employers’ association in Indonesia (APINDO) played a significant role in these discussions.
However for much of this period the mandate for the national tripartite committee had
expired and therefore the official forum for tripartite consultation was not functioning. The
extent to which informal discussions with trade unions took place, and the extent to which
this included all the recognised trade union confederations, remains a moot point. For their
part the independent trade unions deny being invited by the Government to either formal or
informal consultations.
An essential aspect of the wage reforms was limiting the scope for negotiations over the
minimum wage within the wage councils that have existed for this purpose, and curtailing the
scope for regional political figures (Governors, Regents and Mayors) to influence the final
decision about minimum wage adjustments. The Government has suggested that the reforms
related to these two aspects is what will guarantee greater certainty for both business and
63 This approach is in line with Indonesia’s 1990 commitment to ILO Convention Number 144 on Tripartite
Consultation (1976). This Convention requires tripartite consultation in relation to the formulation of labour and
employment policies, including wage formulation. At the time of negotiating the reforms, the mandate for the
national tripartite committee had expired, and therefore an official forum for tripartite consultation on
employment policy was not functioning. 64 The English translation of this document is titled “Reasons Indonesia trade union rejected draft of
Government regulation in minimum wage only based on inflation and economic growth”. 65 http://sp.beritasatu.com/nasional/buruh-desak-pemerintah-tunda-pengesahan-rpp-pengupahan-jadi-pp/98670 66 ITUC press release 16 October 2015, “….”

54
workers about future wage levels. However this approach might be inconsistent with a key
provision in ILO Convention 131 concerning Minimum Wage Fixing. Article 4.3 of
Convention 131 states:
“Wherever it is appropriate to the nature of the minimum wage fixing machinery,
provision shall also be made for the direct participation in its operation of
representatives of organisations of employers and workers concerned…”
The ILO recommends a number of criteria, or indictors, that should be considered when
adjusting minimum wages. ILO Recommendation No. 135 concerning Minimum Wage
Fixing, provides the following list of criteria for this purpose:
- the needs of workers and their families;
- the general level of wages in the country;
- the cost of living and changes there in;
- social security benefits;
- the relative living standards of other social groups, and,
- economic factors including the requirements of economic development, levels of
productivity and the desirability of attaining and maintaining a high level of
employment.
A minimum wage adjustment formula that takes into account both national real GDP and CPI
movements would be consistent with some, but not all, of the above mentioned criteria. In
particular, the formula adopted in Indonesia would seem to provide an inadequate recognition
of the needs of the worker and their families, and also the relative living standards of other
social groups or the general level of wages in the country.
An important issue with the wage reforms is the impact they will have on the balance of
power at the workplace. Trade union leaders have traditionally utilised minimum wage
negotiations to raise their public profile, demonstrate their ability to win wage increases and
recruit members. Key leaders of the independent trade union movement in Indonesia claim
that making the minimum wage process automatic, through the introduction of a formula,
will deprive the unions of a key weapon in their power struggle with employers. This view is
supported by academics that have studied trade unions and industrial relations in Indonesia. A
recent study concluded that:
“First and foremost, it should be noted that minimum wage setting is the only forum
on which Indonesia’s trade unions can actually show what they are doing to defend
their members and the workers in general. Modern industrial relations remain in
their infancy and collective bargaining is weakly developed, not least because unions
willing to bargain meet with a number of serious legal constraints…” 67
67 Tjandra, S. and Klaveren, M. (2015) “Indonesia” in Klaveren, M., Gregory, D. and Schulten, T. (eds) Minimum Wages, Collective Bargaining and Economic Development in Asia and Europe, Palgrave, London.

55
Strong labour market institutions, such as trade unions and minimum wages, are essential in a
country where economic and political power remains highly concentrated. One estimate
suggested that around 60 % of listed corporate assets was controlled by just 10 families in the
mid-1990s.68
Since that time, economic diversification and foreign investment should have
reduced the concentration of ownership. However, a recent review of the data on ownership
patterns concluded that by 2008 the decline in ownership concentration was relatively modest
and in fact “the concentration of ownership by dominant families remained very high”,
although many of the key families are different today from those who controlled big business
in the 1990s.69
Moreover in Indonesia the close nexus between corporate and political power
means that the individual worker faces a massive power imbalance in the factory, on the
construction site or in any of the mega retail outlets that dominate the Jakarta skyline.
There has been some suggestion that a more restricted use of minimum wages, along the lines
of the recent reforms, would allow greater scope for collective bargaining. However, the
notion that free collective bargaining between equal partners would take place if only the
intrusive minimum wage system was curtailed is highly optimistic. There are some examples
of good collective bargaining at the enterprise level particularly in multinational companies
that regularly engage in collective bargaining in other parts of the world. However, the vast
majority of employers in Indonesia remain reluctant to engage in negotiations over wages and
working conditions that go beyond the minimum standards reflected in labour laws and
regulations.70
For example, all minimum wages in Indonesia are only supposed to apply to workers with
less than one year of work experience in an enterprise. For workers with longer tenure the
law has stated for many years that there should be a “wage scale” with rising wages to reflect
greater experience. This is an issue that would have been suitable for industry or enterprise
collective bargaining in the past. However the vast majority of enterprises in Indonesia have
no wage scale or, if they do, it is determined unilaterally by management. This means that in
practice workers with many years of tenure within an enterprise, and those with advanced
skills, receive wage rates around the minimum wage. Trade unions claim that attempts to
initiate collective bargaining on wage scales, or any other issue, often results in dismissal of
the union delegate, or the person being transferred to another function or intimidated in some
other way. Another common response is for trade union members to be denied access to
training programmes, scholarships and other opportunities to support career progression.71
This, combined with very high rates of minimum wage non-compliance, explain why in
Indonesia the ratio of the minimum wage to the average wage is high compared to many
other countries. Some observers focus on the ratio between the minimum and average wage,
68 Claessens, S. and Djankov S. (2000) “The separation of ownership and control in East Asian corporations”,
Journal of Financial Economics, Issue 1-2, pages 81-112. 69 Richard W. Carney and Natasha Hamilton-Hart, “What do changes in corporate ownership in Indonesia tell
us?”, Bulletin of Indonesian economic Studies, Vol 51, No 1, 2015, p 142. 70 Puraka, Y. (2008) Situation of the automotive industry & the role of automotive trade unions representatives
in Indonesia, Friedrich Ebert Stiftung, Indonesia Office, Jakarta. 71 Puraka, Y. (2008) Situation of the automotive industry & the role of automotive trade unions representatives in Indonesia, Friedrich Ebert Stiftung, Indonesia Office, Jakarta.
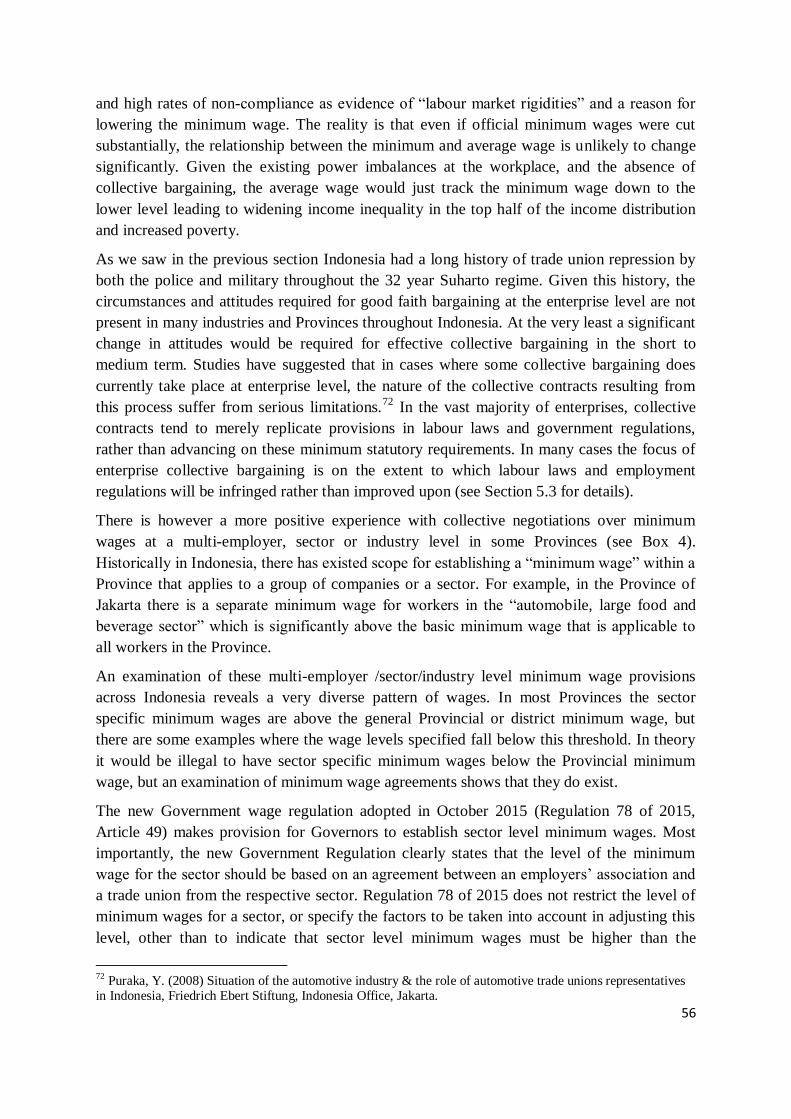
56
and high rates of non-compliance as evidence of “labour market rigidities” and a reason for
lowering the minimum wage. The reality is that even if official minimum wages were cut
substantially, the relationship between the minimum and average wage is unlikely to change
significantly. Given the existing power imbalances at the workplace, and the absence of
collective bargaining, the average wage would just track the minimum wage down to the
lower level leading to widening income inequality in the top half of the income distribution
and increased poverty.
As we saw in the previous section Indonesia had a long history of trade union repression by
both the police and military throughout the 32 year Suharto regime. Given this history, the
circumstances and attitudes required for good faith bargaining at the enterprise level are not
present in many industries and Provinces throughout Indonesia. At the very least a significant
change in attitudes would be required for effective collective bargaining in the short to
medium term. Studies have suggested that in cases where some collective bargaining does
currently take place at enterprise level, the nature of the collective contracts resulting from
this process suffer from serious limitations.72
In the vast majority of enterprises, collective
contracts tend to merely replicate provisions in labour laws and government regulations,
rather than advancing on these minimum statutory requirements. In many cases the focus of
enterprise collective bargaining is on the extent to which labour laws and employment
regulations will be infringed rather than improved upon (see Section 5.3 for details).
There is however a more positive experience with collective negotiations over minimum
wages at a multi-employer, sector or industry level in some Provinces (see Box 4).
Historically in Indonesia, there has existed scope for establishing a “minimum wage” within a
Province that applies to a group of companies or a sector. For example, in the Province of
Jakarta there is a separate minimum wage for workers in the “automobile, large food and
beverage sector” which is significantly above the basic minimum wage that is applicable to
all workers in the Province.
An examination of these multi-employer /sector/industry level minimum wage provisions
across Indonesia reveals a very diverse pattern of wages. In most Provinces the sector
specific minimum wages are above the general Provincial or district minimum wage, but
there are some examples where the wage levels specified fall below this threshold. In theory
it would be illegal to have sector specific minimum wages below the Provincial minimum
wage, but an examination of minimum wage agreements shows that they do exist.
The new Government wage regulation adopted in October 2015 (Regulation 78 of 2015,
Article 49) makes provision for Governors to establish sector level minimum wages. Most
importantly, the new Government Regulation clearly states that the level of the minimum
wage for the sector should be based on an agreement between an employers’ association and
a trade union from the respective sector. Regulation 78 of 2015 does not restrict the level of
minimum wages for a sector, or specify the factors to be taken into account in adjusting this
level, other than to indicate that sector level minimum wages must be higher than the
72 Puraka, Y. (2008) Situation of the automotive industry & the role of automotive trade unions representatives in Indonesia, Friedrich Ebert Stiftung, Indonesia Office, Jakarta.

57
Provincial minimum wage. The formula approach therefore does not apply at this level and
free collective bargaining is foreseen.
The new minimum wage regulations also state that the Provincial and district wage councils
will have a role in providing the Governor “advice and considerations on the leading sectors”
when sector minimum wages are set. Prima facie, these provisions in the new Government
wage regulation provide considerable flexibility and might be used to establish a more
comprehensive and coordinated sector level collective bargaining system. Article 50 of
Government Regulation 78 states that “further provisions on the provincial, district and
municipal minimum wages are to be set out in Ministerial regulations”. These Ministerial
regulations have not yet been announced. They will be critical to the further evolution of
industrial relations in Indonesia.
Government Regulation 78 of 2015 also makes provision for the development of wage scales
within enterprises. Article 42 (2) states that : “wages for employees with one year of service
or longer shall be negotiated bipartitely between employees and the employer in the company
concerned”. However Article 14 (2) states that “the wage structure and scale…..shall be
prepared by the employer by taking into account category, position, length of employment,
education and competence.” These provisions have generated considerable confusion. The
former refers to negotiations between employees and employers without making reference to
any role for trade unions, while the latter appears to suggest that wage scales will result from
unilateral action by the employer.
At the time of writing the Government is yet to issue the detailed Ministerial decrees that will
spell out more precisely how these provisions in the Government Regulation are to be
implemented. If the Ministerial decrees were to make it clear that trade unions should have a
role in establishing wage scales in those industries and enterprises where they have a
presence, and wherever possible collective bargaining should be used to set wages scales, this
would help overcome some of the trade union concerns with Government Regulation 78.
These issues, and recommendations about a possible way forward, are taken up in Sections
5.1 and 5.2 of this paper.

58
Box 4: Sector and Industry Level Minimum Wages in Indonesia
Sector minimum wages exist in many, but not all, Provinces throughout Indonesia. For
example, Central Java and D.I. Yogyakarta do not have sector minimum wages as yet. The
system for sector minimum wages has largely developed through a bottom up process,
where trade unions in various industries have organized and bargained for wages higher
than the district or Provincial minimum wage over time. For instance, in Tangerang
District sector minimum wages are set 5%, 10% and 15% higher than the district minimum
wage for various industries or groups of industries. As the system of minimum wage
bargaining developed within the context of political decentralization, and with this bottom-
up approach, the structure of sector wages is diverse. For example, in Purwakarta District
the overall district minimum wage was IDR 2.6 million per month in 2015 and five sector
minimum wage levels existed for workers in selected industries that were both above and
below this minimum wage, as follows:
IDR 2.1 million for workers in the clothing, toy, hat and leather goods industries
that have less than 5 years’ work experience or workers employed by enterprises
that have operated for less than 5 years.
IDR 2.3 million for workers with more than 5 years’ experience in the clothing, toy,
hat and leather goods sectors.
IDR 2.9 million for workers in the paint, digital medical equipment, welding
electrodes and injection mouldings sectors.
IDR 3.2 million for workers in the rayon and viscose sector.
IDR 3.4 million for workers in the automotive and large food and beverage sector.
It is interesting that workers in the clothing sector within this district receive a wage that is
well below the district minimum wage. Moreover, there is a clause that specifics that
workers with less than five years of experience in the clothing sector are entitled to a wage
of IDR 2.1 million, while workers with more than five years of experience in the same
industry are entitled to a wage of IDR 2.3 million, both of which are still below the district
minimum wage of IDR 2.6 million. It is evident that the minimum wage is not really used
as a “floor” for wage structure but rather represents a standard wage which is applied to
workers with many years of experience. At the other end of the scale workers in the
automobile, large food and beverage sector were receiving a minimum wage that was
roughly 30 % above the district minimum wage.
In Bekasi District the minimum wage was IDR 2.9 million per month in 2015 and four
sector minimum wage levels existed for workers in selected industries that were both
above and below this minimum wage, as follows:
IDR 2.5 million for workers in the paramedic and health clinic sector.
IDR 3.3 million for workers in the oil and gas, beer, paper, chemical, rubber,
asbestos, machinery and equipment, electronics, automotive, toy and construction
sectors.
IDR 3.1 million for workers food and beverage, textiles, print media, glass, metal,

59
compressors, telephones and cables, and light bulb sectors.
IDR 2.9 million for workers in the milk processing, clothing, leather, and
warehousing sectors.
These sectors are very heterogeneous and the various industries within each sector may
face diverse economic circumstances.
In Bekasi District there is a special exception from the minimum wage made for workers in
the paramedic and health clinic sector, with workers in this sector being entitled to a
minimum wage of IDR 2,470,000 instead of the district minimum wage of IDR 2,925,000.
The 2016 minimum wage negotiations in Bekasi resulted in the district minimum wage
rising in line with the formula provided in Government Regulation 78 of 2015 ( 11.5%
increase). The district retained its four sector level minimum wage levels and the more
capital intensive sectors managed to secure wage adjustments slightly about (1 to 2
percentage points above)the adjustment applied to the district minimum.
The case of Sumedang District is also noteworthy. In Sumedang they have minimum
wages for two sectors as follows:
IDR 2.0 million for workers in sub-districts including Jatinangor, Tanjungsari,
Cimanggung and Pemulihan which have industrial processing zones, as well as for
workers who work for enterprises with their headquarters office situated outside the
district.
IDR 1.3 million for all other workers.
Therefore, in Sumedang sector wages are influenced by industrial zoning.
Generally speaking, the definition of a sector for the purpose of minimum wage fixing has
been very ad hoc in the past. As the above examples demonstrate many of the sectors
combine capital intensive and labour intensive industries. The sectors are often so broad
that they combine enterprises with vastly different levels of labour productivity, skills,
investment levels, employment costs per output and other labour market indicators.
Based on the small sample of sector minimum wages examined by the authors it appears
that sector minimum wages can be up to 30 % higher than the district minimum wage and
up to 15 % lower than the district minimum wage.
5. The impact of key labour institutions and labour laws in the last decade and
recommendations for reform
We know try and assess how the evolution of key labour market institutions impacted on the
economy and the labour market in the last decade. This section includes recommendations
about labour reforms that could be the subject of national level tripartite dialogue in
Indonesia

60
5.1. Minimum wage fixing
Appendix 1 shows minimum wage levels and annual percentage adjustments for all Provinces
and the simple national average for the period from 1997 to 2014. As noted previously the
pace of minimum wage adjustments has historically been very uneven, with rapid real
increase in some years, followed by lengthy periods of real wage restraint. For example, in
DKI Jakarta, which has always been a minimum wage pace setter, the average annual
nominal increase in the minimum wage in the period from 1997 to 2002 was 29 %. However
this was followed by an eight year period, from 2003 to 2010, when the average annual
nominal adjustment was just 8 %. This was less than the national inflation rate for much of
this period.
Given the absence of both collective bargaining and wage scales in most enterprises, the
minimum wage system in Indonesia has always exercised a major impact on the general wage
level and labour costs throughout the economy. Minimum wage restraint in the mid to late
2000s and early 2010s thus led to very moderate increases in average real wages.
Figure 14 shows trends in average real wages for Indonesia as a whole over the period 2005
to 2015. Two different deflators are used: the national CPI and the GDP implicit price
deflator and they provide vastly different outcomes. It is common practice to use the CPI
deflator when estimating the purchasing power of wages, while the GDP deflator is more
relevant when trying to gage labour costs and assessing the implications for economic
competitiveness.
When average nominal wages are deflated by the CPI the result is a fairly steady long term
upward trend from 2005 to 2013 and then a sharp dip in 2014 and 2015. But, most
importantly, the growth in average real wages using this indicator never exceeds the growth
in labour productivity ( broadly measured) at any stage in this period. Real wage increases in
line with productivity improvements should not be considered excessive since this means
workers are merely receiving their fair share of the growth dividend.
When the GDP deflator is used to obtain real average wage trends a very different picture
emerges. It is evident that from Figure 14 that real wages declined sharply between 2006 and
2008 and only regained their 2005 level after 2012. This measure depicts a sharp increase in
real average wages in 2013, but this jump is not nearly sufficient to make up for the
productivity improvements that had taken place in the previous 8 years. Real average wages
then decline somewhat in 2014 and 2015. On this measure the gap between real average
wages and productivity improvements is very significant throughout the entire period 2005 to
2015.
Figure 14 illustrates that the indicator used to gauge inflation is extremely important in
deciphering what has been happening to real wages and labour costs in the last decade. The
common belief that real wages have been growing strongly, and this has threatened the
international competitiveness of Indonesian industry, is not consistent with all the evidence.
One explanation for the dramatic difference in real wage trends using these two deflators is
the impact of food prices. Food price inflation has been significant in the last decade and

61
there are many observers who believe the CPI fails to adequately reflect the impact of food
prices, particularly for the low paid. This is why trade unions have been keen to participate in
the price surveys ( KHL estimates) that were previously used to adjust minimum wages.
Figure 3: Labour productivity and real wages in Indonesia, 2005-2015 (Index, 2005 =
100)
Source: BPS (2014) Labourer situation in Indonesia: August 2014, Badan Pusat Statistik,
Jakarta; ILO staff calculations based on revised population weights and backcast for 2011-
2014. ILO staff calculations based on BPS, National Accounts (February 2015).
To take this analysis further and consider the impact of the minimum wage system on real
wages in labour intensive sectors of the economy, Figure 15 examines real average wage
trends for production workers in manufacturing and non-managerial workers in the hotels
component of the services sector. The deflator used in Figure 15 is the CPI not the GDP
deflator. This indictor shows that in the manufacturing sector real wages for production
workers declined between late 2003 and 2011, and then increased sharply in 2012 and 2013
before dipping again. In the services sector real wages for non-managerial workers declined
slightly between late 2003 and late 2012. They then rose sharply in 2013. If the GDP deflator

62
was used, instead of the CPI, the increases in real wages for these two occupational groups
would be far more moderate throughout this period.
Figure 4: Real average wage trends for production workers in manufacturing and non –
managerial wage workers in hotels, 1996-2014
Source: BPS (2014) SAKERNAS (selected years), Badan Pusat Statistik, Jakarta.
With real average wages either declining slightly or stagnating for most of the period between
2003 and 2012, this meant that workers did not receive their share of productivity
improvements and real unit labour costs must have declined. During this decade of real wage
restraint up until 2013 the ratio of the minimum wage to the average wages was creeping up (
Figure 16). This was the result of two factors: first, the absence of any real collective
bargaining over wages and the absence of wage scales for workers with more then one year
of tenure; and second, high levels of non-compliance with minimum wage laws. This lengthy
period of real wage restraint eventually led to pressure for wage “catch-up” and the
substantial increases in the minimum wage in 2013. This drove the ratio of the minimum
wage to average wages significantly higher. Figure 16 illustrates that in 2001 the simple
average national minimum wage for Indonesia was 58.5% of the national average wage and
by August 2015 this ratio had increased to 82.9%. The ratio of the minimum wage to the
average wage is now high by international standards. This is often cited as evidence of labour
market “rigidities” in Indonesia. In fact it is evidence that labour market institutions, such as
collective bargaining and labour inspection.
100
150
200
250
300
350
400
19
96
Jun
-97
Dec
-97
Jun
-98
Dec
-98
Jun
-99
Dec
-99
Jun
-00
Dec
-00
Jun
-01
Dec
-01
Jun
-02
Dec
-02
Jun
-03
Dec
-03
Jun
-04
Dec
-04
Jun
-05
Dec
-05
Jun
-06
Dec
-06
Jun
-07
Dec
-07
Jun
-08
Dec
-08
Jun
-09
Dec
-09
Jun
-10
Dec
-10
Jun
-11
Dec
-11
Jun
-12
Dec
-12
Jun
-13
Dec
-13
Jun
-14
Dec
-14
Rea
l wag
e ID
R, C
PI 1
99
6 =
10
0
Real Wage for Production Workers in Manufacturing Below Supervisory Level Real Wage for Production Workers in Hotels Below Supervisory Level

63
Figure 5: Trends in nominal minimum and average wages for Indonesia, 2001-2015
(Rp)
Source: BPS (2015) SAKERNAS, Badan Pusat Statistik, Jakarta.
It is evident from the trends discussed above that the Indonesian minimum wage fixing
system, was able to deliver a period of sustained real wage restraint from 2003 to 2012. This
possibly contributed to the sustained, albeit not spectacular, recovery in the manufacturing
sector after the devastation of the Asian economic crisis. These outcomes are critical to any
assessment about labour reform priorities today.
This extended period of wage restraint was, in part, a consequence of the 2003 Manpower
Act that has been the subject of criticism for injecting “inflexibility” into the labour market
and the complex process of social dialogue that was used to set minimum wage prior to
October 2015.
40.00%
50.00%
60.00%
70.00%
80.00%
90.00%
0
500,000
1,000,000
1,500,000
2,000,000
2,500,000
2001 2002 2003 2004 2005 2006 2007 2008 2009 2010 2011 2012 2013 2014 2015
Pe
rce
nta
ge o
f th
e m
inim
um
wag
e t
o t
he
ave
rage
wag
e
Ind
on
esi
an r
up
iah
Simple average national minimum wage Average net wages per month for employees Percent of minimum wage to average net wages
64
In 2010 the World Bank appears to have reached a similar conclusion, when they stated that:
“ Increases in minimum wages began to level off following the passage of the
Manpower Law (No 13/2003), and since 2005, have grown more slowly than average
wages….. The slow-down may not be entirely related to the introduction of the new
law. Wage councils, instituted already in 2001, possible played a greater role limiting
the growth of real minimum wages by negotiating nominal minimum wage increases
on the basis of price surveys rather than negotiations. In addition, tripartite level
discussions may have benefited from learning through experience, as parties engaged
in more constructive minimum wage negotiations and took economy-wide
considerations into account”. 73
Based the above quote it would seem reasonable to conclude that in 2010 the World Bank
had a favourable opinion of social dialogue, and favoured trade unions and employers having
a hands on role in the minimum wage fixing process.
As noted previously the Government plans to review the new minimum wage fixing system
in 5 years. When this review takes place consideration might be given to reintroducing some
elements of the old minimum wage system. For example, under the “old” minimum wage
system (that is the system prior to October 2015) trade unions and local level employer
representatives in Indonesia had been gaining some basic experience in collective
negotiations and general economic debate precisely because they were engaged in the
complex minimum wage fixing process at Province and district level. Trade unions and local
level employers in Indonesia had been progressively developing important economic skills
and, as the World Bank recognised in 2010, appreciating the need to consider the wider
public interest because of their participation in the wage councils.
As we have seen under this “old” system, the trade unions and employers had to regularly
implement a cost of living survey to get their estimate of what wage increase was required to
achieve, or maintain, a decent living standard ( their so-called KHL estimate). In so doing,
there has often been considerable tripartite discussion about the basket of goods and services
that are necessary to provide a decent living standard. At times this debate has focused on the
number of items that should be included in the basket, and what standard of quality the goods
and services need to meet. In some of the literature on minimum wages in Indonesia,
including reports by the ILO, this debate within the wage council has been portrayed as
undesirable.
Yet similar debates take place in many countries when the social partners are negotiating
what constitutes a “living wage”. This is similar to the requirement in the Indonesian
legislation that the minimum wage should provide a “decent living standard”. In any wage
system with such a requirement, it is necessary to consider at least two key issues. First, is the
base, or starting point, for minimum wage negotiations appropriate? For example, in current
circumstances in Indonesia one would need to ascertain whether or not minimum wage levels
that prevailed in 2015 provided a “decent living standard”. If the answer to that question was
73 World Bank (2010) Indonesian Jobs Report: Towards Better Jobs and security for All, World Bank Jakarta.

65
definitely yes, then the second issue which must be addressed is what level of minimum wage
increase would be required in 2016 to maintain a “decent living standard”.
In some circumstances a formula might be a useful starting point for addressing the second
question. But it would be very difficult to design a formula to help resolve the first question.
The notion of a “decent living standard” or a “living wage” calls for subjective judgements. It
therefore seems strange to criticise a process of social dialogue and collective negotiations for
entering into debates about measurement issues where there is bound to be space for
subjective judgements.
Under the “old” minimum wage system in Indonesia, after establishing an estimate or
competing estimates of the KHL, the social partners were, in theory at least, required to
engage in an economic debate within their local wages councils with officials from the local
Manpower Office, the central statistical office and other government agencies. The actual
practice in these wage councils probably varied from region to region with some taking their
responsibilities more seriously than others. However a forum did exist where the regional
social partners and local government agencies could consider key variables like local
economic growth trends, productivity, investment levels, indicators of enterprise profitability
and various labour market indicators. In all probability the level of economic discourse may
have been less than optimal in many wage councils but, rather than abolishing this process,
thought could have been given to upgrading the technical skills of the participants and
providing them with access to expert advice.
From the above explanation it is evident that the “old” minimum wage system had features
that resemble minimum wage fixing systems found in other countries but it also included a
few unique characteristics. It may be helpful to think of the Indonesian system as a hybrid
that combined minimum wage fixing with aspects that could be found in sector, industry or
regional level collective bargaining systems. On top of this there was an element of
compulsory arbitration. The combination of these elements made the system complex to
outsiders but it does not necessarily make it unfair or, as we have seen, economically
inefficient.
One of the more controversial aspects of the old Indonesian minimum wage fixing model was
that the task of compulsory arbitration was assigned to a democratically elected local
politician, the Provincial Governor. In the recent debate the involvement of this elected
official, to make the final decision on minimum wage levels, has often been portrayed as a
negative factor. This is because in the lead up to local elections, Governors have had at least
one eye on their own popularity and have had a tendency to be generous towards the workers
and award substantial nominal minimum wage adjustments. This helps explain the pattern of
modest real wage increases for several years followed by sharp upward jumps.
But the Indonesian system was not unique. In many minimum wage fixing systems around
the world the final decision about adjustments rest with democratically elected officials,
either the full Government, the President or a Minister, often after receiving advice from a
tripartite or expert body. It might be argued that arbitration by a group of people or a person
who is elected by the entire adult population of a country or region can have a desirable

66
impact on the critical “insider–outside” problem that labour economists are often concerned
about. This is an issue the World Bank in Indonesia has highlighted previously. In 2010 the
World Bank stated that:
“The main issue revolves around who are the winners and losers when minimum
wages increase. While unions and business associations are able to represent their
own interests, poor and informal workers have little political voice and are not
represented in the current debate.”74
It is arguable that the Governor of a Province is in fact well placed to reflect and balance the
interests of employers, those currently in wage employment, plus those in the informal sector
or the agriculture sector who are seeking a move into wage employment in a factory or the
formal service sector. Because the proportion of workers, and voters, in the agriculture sector
and the informal economy will often exceed the number of workers in formal non-agriculture
wage employment, the Governor should give considerable weight to the impact of his or her
arbitrated decision on the employment prospects of the "outsiders". Thus, in theory at least,
there are grounds for thinking that the “old” minimum wage system should have been more
fair, and economically rationale, than an alternative system that merely tries to balance the
interests of organised workers and big capital, or a system that provides for automatic
increases in minimum wages based on a formula that sums GDP and CPI movements without
considering other economic and social variables.
As we have seen there were some features of the old minimum wage fixing system that were
desirable and others that were not. When the five year period expires, and it comes time to
review Regulation 78 of 2015, the Government and social partners in Indonesia might want
to consider trying to incorporate the beneficial features of the old minimum wage system with
greater certainty about future labour costs and less volatile fluctuations in minimum wage
levels that reliance on a formula provides. This could involve providing at least some scope
for social dialogue about local economic and social conditions and ways of gearing wage
outcomes to the specific needs of the region and its main economic activities. For example,
this might involve retaining the current formula whereby minimum wages are increased by
the combined percentage increase in real GDP and the CPI for the previous year as the
starting point. The formula would thus still be an important guide for minimum wage
adjustments in all Provinces and districts. But there could be some discretion, perhaps within
predetermined bounds, for the tripartite wage councils to engage in social dialogue and
modify the minimum wage increase suggested by the formula to reflect local economic
conditions. The adjustment factor resulting from the dialogue could be either positive or
negative and might be limited to say plus or minus 3 percentage points. This would bring
the minimum wage fixing system in Indonesia more into conformity with ILO Convention
131.
74 World Bank (2010) Indonesian Jobs Report: Towards Better Jobs and security for All, World Bank Jakarta.

67
Box 2: Why is social dialogue desirable?
Social dialogue over key economic and social policies is desirable for many reason. First and
foremost participation by employers and trade unions in defining the rules and policies that
directly imping on profits and the living standards of workers helps establish commitment
from both sides to these norms and outcomes. For example, if trade unions have at least some
input into the process that determines the minimum wage level then workers are more likely
to see the outcome as fair. The same usually applies to employers. Notions of fairness play a
critical role in industrial relations and their absence is likely to lead to disputes and
demonstrations that impinge on economic confidence, investment levels and many key
economic variables. At the firm level, in the absence of social dialogue and a sense of
fairness about how wages and employment conditions have been determined, tensions are
likely to rise and productivity will decline. Ideally space will be provided for employers and
trade unions to have an input into subject matters that go well beyond minimum wages.
Tripartite dialogue over labour laws, social protection, training and employment policies as
well as broader economic policy is desirable.
5.2 Multi-employer or sector level collective bargaining and the impact of trade unions
In the past, both the World Bank and the ILO have strongly recommended that the role of
collective bargaining in influencing wage levels and wage relativities be enhanced. While
there may be a significant number of collective agreements in Indonesia, it is well recognised
that bargaining plays a negligible role in determining wages, other conditions of employment
or worker rights that go beyond the legal minimum. As mentioned above this is a key reason
explaining the high minimum wage to average wage ratio in Indonesia.
To the extent that firm level collective bargaining takes place, it is often about the
implementation of existing rights, or more precisely the extent to which rights will be
infringed. For example, in respect of wages, collective bargaining often takes place about
how long the employer will be allowed to avoid paying the latest minimum wage increase. In
respect of employment protection legislation, collective bargaining often takes place over
what proportion of the legally mandated severance payments will actually be paid.
Bargaining also often takes place over the extent to which the regulations governing working
time and payments for over time will be infringed. In the vast majority of cases the outcomes
of such bargaining will not be reflected in a written collective contact but it will have a
pervasive impact on work practices in the enterprise. A situation in which the main purpose
of collective bargaining is to determine the extent to which labour laws and minimum labour
standards are undermined is highly dysfunctional.
A review of 101 written enterprise level collective contracts recently undertake for the ILO
revealed that only 6 agreements contained any mention of job titles or pay scales.75
Moreover, only 56 % of the collective agreements that were examined contained a clause
75 “Collective agreements in Indonesia”, ILO memo, 2016, unpublished

68
specifying which minimum wage that was to be paid. The majority of clauses in the sample
of collective contracts reviewed related to issues such as overtime payments and premiums
for working on Sunday which are specified in laws and regulations.
The imbalance of power between workers and employers at the enterprise level in the private
sector is an important reason why good faith collective bargaining about wages and
employment conditions, that are above the legal minimum, is largely absent from the
Indonesian industrial relations scene in the private sector. The structure of industry, which is
dominated by myriad small and medium sized enterprises alongside a small number of very
large enterprises, also helps explain the absence of real collective bargaining. For example, in
the manufacturing sector, it is estimated that there are close to 4 million firms, of which 3.7
million are micro and small firms and less than 25,000 are medium and large firms. Given
this context, it is inconceivable that the trade union movement in this vast and diverse country
could ever realistically hope to organise and represented the majority of workers through
plant level negotiations. If collective bargaining is confined to the firm level the best one
could expect are collective contracts covering multinational enterprises and some of the very
large domestically owned companies. The vast majority of workers would remain uncovered
and would have their wages and employment conditions determined unilaterally by
management.
These structural factors and power relationships are what make hopes of spontaneous genuine
good faith enterprise level bargaining, in the wake of recent minimum wage reforms,
completely unrealistic. If the objective is comprehensive collective bargaining coverage than
institutional arrangements will be required that go beyond firm level collective bargaining. In
the past the compulsory requirement for employers’ organisation and regional trade union
centres to participate in wage councils deliberating Provincial and district minimum wage
levels helped compensate for this power imbalance at the workplace. It also helped mitigate
the challenge unions face in representing workers spread between millions of micro and
medium sized firms.
There are also sound economic reasons for developing collective bargaining at a higher level,
such as industry or national level. There is a vast literature devoted to the economic impact
of collective bargaining at different levels. Suffice to say at this stage that international
experience over many decades has suggested that more encompassing and comprehensive
systems of collective bargaining produce general economic and market impacts that are
superior to less encompassing systems.76
Fortunately, Indonesia has some relevant experience and legal scope for developing industry
or multi-employer collective bargaining. In Section 4 of this paper it was suggested that
Indonesian had some positive experience in negotiating sector level minimum wage
agreements in particular Provinces. Box 4 provides details about some of these agreements.
Also, as pointed out previously, Government Regulation Number 78 of 2015, retains scope
for sector level minimum wages and appears to have increased the flexibility inherent in this
system. In the past Government Regulation 1 of 1999 governed sector level minimum wage
76 Susan Hayter, “The role of collective bargaining in the global economy”, ILO, 2011.

69
fixing. Under this regulation sector minimum wages could be established but they could only
be 5 % to 10 % above the Provincial or district minimum wage, but in practice we have
observed that there was much greater flexibility with differentials ranging from 10% below to
30 % above the Provincial minimum wage. This legal limitation on the extent to which sector
minimum wages can exceed the Provincial minimum wage has been abolished, thereby
bringing law and practice into closer conformity.
Importantly, the formula that strictly links Provincial minimum wage adjustments to past
economic growth and price movements does not apply to sector level minimum wages.
Rather, the regulation provides scope for sector level employers’ associations and sector level
trade unions to freely negotiate wage increases at this level. The new regulation states that the
Governor will implement agreements reached through this bi-partite bargaining process.
Regulation 78 of 2015 also makes it clear that the Provincial wage council will have the
authority to determine which industries, groups of industries, or groups of enterprises
constitute a sector for the purpose of bi-partite collective negotiations. Using this authority
wisely will be important. A review of past sector level minimum wage experience reveals
that the sectors, or groups of enterprises were decided in a very ad hoc manner and industries
were combined that had few common economic characteristics. For example, in Box 4
mention is made of a sector minimum wage in Bekasi covering “food and beverage, textiles,
print media, glass, metal, compressors, telephones and cables, and light bulb manufactures”.
This is a very diverse group of manufacturing industries that may have very different profit
and productivity levels as well as vastly different skill levels and capital/labour ratios. When
implementing the new regulations it would be more rational to define the different sectors
more narrowly and precisely, based on their levels of capital intensity and/or the occupations
and skill levels of the core workers within the sector. Wages levels and employment
conditions that emerge from sector level bargaining can then be geared more closely to
economic performance of the industry.
Regulation 78 of 2015 also makes provision for wage scales that could reflect tenure, skills
levels and other appropriate variables. Similar provisions have existed in the legislation
governing wages in the past but were rarely implemented. In fact, for many decades the
minimum wage in Indonesia was supposed to only apply to workers with one year or less
tenure within an enterprise. In theory as workers acquired more experience and skills their
wages were supposed to reflect these attributes. But in reality the vast majority of workers
have remained on, or below, the minimum wage throughout most of their working lives in the
formal economy.
Wage scales could be developed at industry or firm level. But a system that used both levels
may be the best way forward. In would make sense to set the broad parameters for wages
scales at industry level and then allow some flexibility for refinement at enterprise level.
These are issues on which the Government and social partners in Indonesia might wish to
seek detailed technical advice.
The key thing to recognise at this stage is that scope does exist under the new laws for
collective bargaining over wage agreements at the sector level with the only constraint being

70
that the wage levels must be above the Provincial minimum wage. It is possible to envisage
different collective wage agreements for labour intensive, capital intensive and resource
based industries at the Provincial level. Box 6 discusses international trends related to
collective bargaining at the sector level and the economic implications of such agreements.
Box 3: Synchronization of Collective Bargaining and Economic Outcomes
Much of the literature on the economic impact of collective bargaining relates to the
centralisation and coordination of wage bargaining or what several authors referred to as
“corporatism” in a previous era. Other authors have used the term synchronization of
bargaining to convey a related concept that includes the centralisation and coordination of
bargaining plus indicators of union concentration and authority at different levels.
Economists have long been interested in this subject because of the potential for unions and
employers in more synchronized bargaining systems to take into account the wider
implications of agreements they reach and avoid any detrimental economic impact.
It has been suggested that the benefits of synchronized bargaining systems are most clear
cut in countries where the State provides a legal framework that enhances trust between
unions and employers and deters wage drift.77
Ensuring that collective agreements are
legally binding, that enforcement mechanisms are in place including well resourced labour
inspection and labour courts plus the existance of “peace clauses” that prohibit additional
claims or interests disputes while a collective agreement is in force are examples of
institutions that appear important to improve the “governability” of highly sychronized
bargaining systems.
Given that the new wage regulation does not in any way restrict the factors that sector level
unions and employers’ associations should take into account during their negotiations, scope
would exist to incorporate consideration of “decent living needs”, along with other economic
and labour market indicators in the negotiations. Indeed the parties would appear free to
undertake surveys, such as those used in the past to establish a KHL estimate, if they choose
to do so.
An important barrier to implementing the flexibility in the new regulation for sector level
bargaining is the absence of sector level employers’ organisations at the Provincial level. For
example, there are no employers’ organisations at the Provincial level for specific industries
such as the metal industry or electronics industry with experience in collective negotiations.
APINDO could however help establish such organisations and provide technical assistance to
them. Outside assistance might also be sought if there was a genuine desire to develop
comprehensive multi-employer or industry level collective bargaining.
77 Traxler, F. and Kittel, B. “The Bargaining System and Performance: A Comparison of 18 OECD Countries”
Comparative Political Studies, Vol. 33, No. 9, November 2000, pp. 1154-1190.

71
The experience of several European countries and other advanced economies with long
histories in multi-employer or industry level collective bargaining could be drawn upon. In
these systems “extension mechanisms” often play a critical role in ensuring that collective
bargaining coverage is comprehensive. There is also often an important leadership role for
industries in the traded goods sector. Industries that need to remain internationally
competitive are often the “pace setters” with agreements in these exposed sectors establishing
a pattern that is subsequently followed in industries that produce for the domestic market.
Research has demonstrated that these coordinated or centralised collective bargaining
systems generate highly desirable economic outcomes in terms of employment, inflation,
economic growth, income inequality and other critical economic variables.78
If good faith collective bargaining at the sector level was to expand rapidly, and the
Government was seen to be strongly supporting this move through additional legislation if
required and support for new institutions, this may reduce the pressure on the minimum wage
system and ameliorate the industrial relations tensions and strikes. Compromises may be
possible that involve retaining the formula approach to minimum wage setting in return for
the very rapid introduction of comprehensive and coordinated good faith collective
bargaining. Discussion and consensus building on this topic would appear to be in the
interests of all parties.
Given the under-developed nature of collective bargaining it is interesting to ponder why
workers choose to join a trade union and pay union dues out of their low salaries. One reason
for join a union is probably that this provides access to legal advice and support services in
“Interest disputes” with the employer over unfair dismissal, non-payment of minimum wages
and other benefits that are legally mandated.
There is some evidence to support the view that being a union member is be beneficial to the
worker. In a recent labour force survey 22.5% of regular employees reported that they were a
member of a union. This amounts to 8.6% of total employment. Union members were more
likely to have either a permanent or fixed term contract rather than a verbal contract or not to
know what sort of contract they were working under ( Figure 17). Union members were also
more likely to have social security provided by their employer. Over 80 % of union members
have health insurance provided by their employers, while only one third of non-union
members have health insurance provided by their employers.
78International Trade Union Confederation, Frontlines Spring 2013, “Ideology without economic evidence: The troika, trade unions and collective bargaining”.
72
Figure 6: Contract type by union membership for regular employees, February 2016
Source: BPS (2016) SAKERNAS, Badan Pusat Statistik, Jakarta.
From Figure 18 it is evident that employees who are organized in unions are concentrated in
the manufacturing, education, and public administration sectors. Within the private sector
union membership is quite limited outside of manufacturing. These trends are relevant to the
discussion that follows on the enforcement of labour rights and the possibility of a more
significant role for trade unions in encouraging compliance with labour laws.

73
Figure 7: Union membership density by sector, February 2016
Source: BPS (2016) SAKERNAS, Badan Pusat Statistik, Jakarta.
5.3 Implementation of labour rights
The Indonesian labour force survey provides some data that can be used to monitor
compliance with minimum wage levels, social security programs, and the coverage of
collective contracts.
Minimum wage non-compliance is high in Indonesia and has been increasing over time. In
August 2001 roughly 21 % of regular wage employees received wages that were below the
lowest wage that was permissible by law. By August 2015 the comparable figure was 47 %.
(Figure 19). The very high level of non-compliance means that minimum wage levels in
Indonesia do not really represent a wage floor. Some observers have suggested that high
levels of non-compliance are evidence that minimum wages have increased too rapidly and
that minimum wage levels are excessive. However, as can be seen from the Figure 19, non-
compliance with minimum wages rose sharply between 2003 and 2008 when nominal
minimum wage adjustments were very modest and real wages for wage workers were
declining or stagnating. Non-compliance then dipped somewhat before increasing again after

74
2013. There would appear to be no clear relationship between the rate of increase in the
minimum wage and implementation of the law.
Figure 8: Percentage of regular employees below and above the provincial minimum wage,
2001-2015
Source: BPS (2015) SAKERNAS (selected years), Badan Pusat Statistik, Jakarta.
In Section 3 of this paper it was noted that the proportion of workers in regular wage
employment was improving over time and the proportion of workers in forms of
employment closely associated with the informal economy had diminished somewhat. But
just because a worker is in regular wage employment is no guarantee that they will receive
the minimum wage or other benefits to which they are legally entitled. Figure 20 compares
trends in regular employment and whether or not these workers were paid above or below the
minimum wage. It can be seen that the number of workers in wage employment has risen
steadily since 2003. But in the period between 2003 and 2009 the increase in wage
employment did not lead to improved compliance with minimum wage levels. Between 2008
and 2013 the data would suggest that minimum wage compliance improved somewhat with at
least a proportion of the workers joining the ranks of regular wage employees receiving the
minimum wage they were legally entitled to benefit from. But after 2013 the situation
deteriorated again.
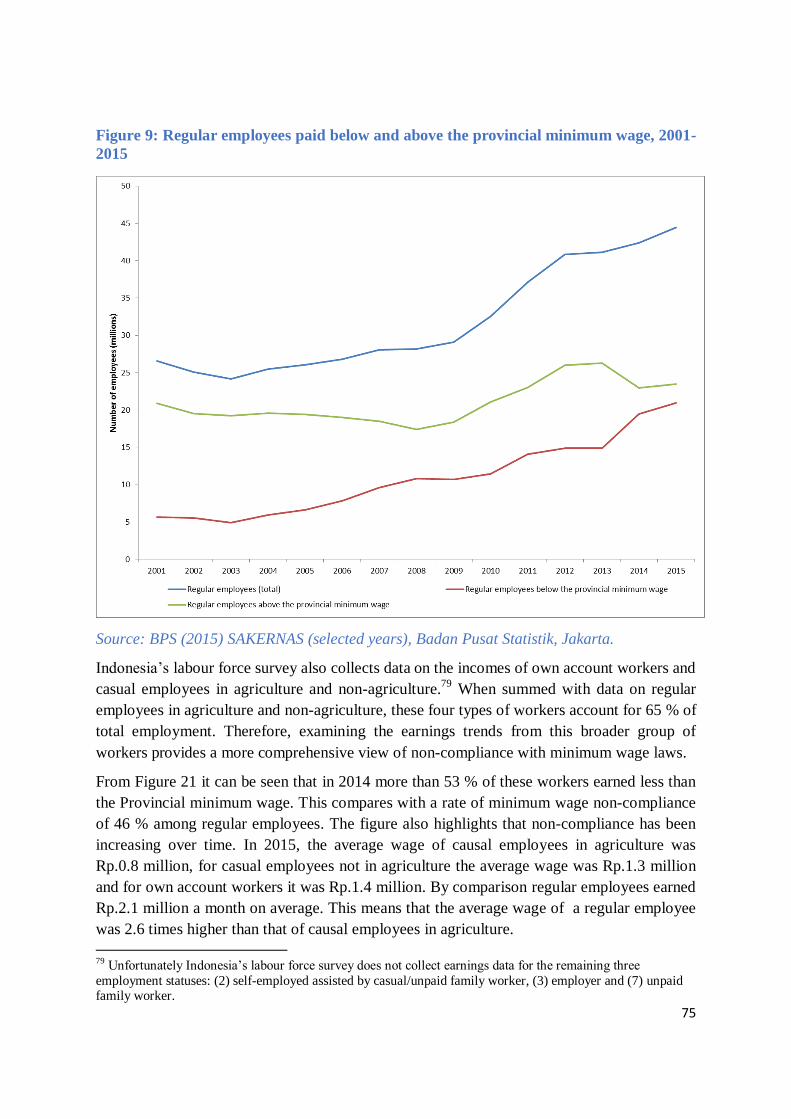
75
Figure 9: Regular employees paid below and above the provincial minimum wage, 2001-
2015
Source: BPS (2015) SAKERNAS (selected years), Badan Pusat Statistik, Jakarta.
Indonesia’s labour force survey also collects data on the incomes of own account workers and
casual employees in agriculture and non-agriculture.79
When summed with data on regular
employees in agriculture and non-agriculture, these four types of workers account for 65 % of
total employment. Therefore, examining the earnings trends from this broader group of
workers provides a more comprehensive view of non-compliance with minimum wage laws.
From Figure 21 it can be seen that in 2014 more than 53 % of these workers earned less than
the Provincial minimum wage. This compares with a rate of minimum wage non-compliance
of 46 % among regular employees. The figure also highlights that non-compliance has been
increasing over time. In 2015, the average wage of causal employees in agriculture was
Rp.0.8 million, for casual employees not in agriculture the average wage was Rp.1.3 million
and for own account workers it was Rp.1.4 million. By comparison regular employees earned
Rp.2.1 million a month on average. This means that the average wage of a regular employee
was 2.6 times higher than that of causal employees in agriculture.
79 Unfortunately Indonesia’s labour force survey does not collect earnings data for the remaining three
employment statuses: (2) self-employed assisted by casual/unpaid family worker, (3) employer and (7) unpaid family worker.

76
Figure 10: Percentage of workers earning less than the provincial minimum wage, 2001-
2014
Source: BPS (2015) SAKERNAS (selected years), Badan Pusat Statistik, Jakarta.
There is also a clear cyclical pattern to minimum wage compliance levels within the year.
Minimum wage non-compliance peaks early in the year and gradually improves during the
course of the year (Figure 22). For example, in February 2015 minimum wage non-
compliance broke all records with 52 % of regular wage employees not receiving the
minimum wage to which they are legally entitled. This is because under the existing laws
employers can make an application to postpone, from early in the new year to later in the
same year, implementation of the annual minimum wage adjustment in their workplace.80
This is a unique feature of minimum wage fixing in Indonesia and helps explain the cyclical
variation with implementation within the year. This cannot however explain the general trend
of extremely high non-compliance over prolonged periods.
80 Regulation 231/103, Article 90.
53.3
45.9
0.0
10.0
20.0
30.0
40.0
50.0
60.0
2001 2002 2003 2004 2005 2006 2007 2008 2009 2010 2011 2012 2013 2014
Pe
r ce
nt
All income earners Regular employees

77
Figure 11: Percentage of employees below and above the provincial minimum wage,
2011-2016
Source: BPS (2015) SAKERNAS (selected years), Badan Pusat Statistik, Jakarta.
Figure 23 presents trends in minimum wage non-compliance and the primary wage Gini for
regular employees. There would appear tentative grounds for thinking there may be a
relationship between these two variables. Between 2006 and 2009 non-compliance with
minimum wages grew rapidly and wage inequality also expanded sharply. Thereafter
compliance improved somewhat and wage inequality fluctuated before both variables rose
sharply between 2013 and 2014. This would suggest that stronger measures to ensure that
minimum wage laws are respected could help moderate the very high levels of income
inequality observed in Indonesia.

78
Figure 12: Percentage of employees below the provincial minimum wage and the
primary wage GINI, 2006-2015
Source: BPS (2014) SAKERNAS (selected years), Badan Pusat Statistik, Jakarta.
Indeed, the distribution of earnings is highly skewed in Indonesia. Median wages for regular
employees tend to be substantially lower than average wages for these workers. The average
wage was 1.4 times higher than the median wage for regular employees in August 2015. The
situation is similar for own account workers, but less extreme for casual workers. Further
analysis of the distribution of earnings indicates that the highest paid regular employee earns
3 to 4 times more than the highest paid casual worker (Table 3). Own account workers and
regular employees in the 95th
percentile have earnings that are 24 times higher than those in
the bottom 5th
percentile. However, casual employees in the 95th
percentile have earnings that
are only 8 times higher than those in the bottom 5th
percentile.

79
Table 3: Nominal monthly earnings by status in employment, 2011-2015
Year Status in employment Mean Median Percentile
05
Percentile
25
Percentile
75
Percentile
95
Percentile
99
2011 Own account workers 1,041,926 750,000 105,000 450,000 1,300,000 2,800,000 5,000,000
Regular employees 1,552,456 1,105,000 240,000 665,000 1,890,000 3,890,000 7,825,000
Casual employees in agriculture 547,993 450,000 125,000 300,000 700,000 1,200,000 2,000,000
Casual employees not in agriculture 865,973 800,000 190,000 500,000 1,100,000 1,700,000 2,500,000
2012 Own account workers 1,072,304 800,000 70,000 450,000 1,400,000 3,000,000 5,000,000
Regular employees 1,641,451 1,200,000 285,000 725,000 1,950,000 4,175,000 7,850,000
Casual employees in agriculture 590,932 500,000 150,000 325,000 750,000 1,305,000 2,000,000
Casual employees not in agriculture 944,744 855,000 200,000 560,000 1,200,000 1,825,000 2,852,000
2013 Own account workers 1,188,372 900,000 100,000 500,000 1,500,000 3,000,000 6,000,000
Regular employees 1,917,152 1,500,000 300,000 800,000 2,400,000 4,950,000 8,121,600
Casual employees in agriculture 612,282 500,000 150,000 320,000 750,000 1,470,000 2,100,000
Casual employees not in agriculture 975,786 886,000 200,000 550,000 1,250,000 2,000,000 3,000,000
2014 Own account workers 1,339,916 1,000,000 350,000 620,000 1,500,000 3,000,000 6,000,000
Regular employees 1,952,589 1,425,000 250,000 750,000 2,375,000 4,950,000 9,700,000
Casual employees in agriculture 772,840 672,000 350,000 500,000 942,857 1,500,000 2,400,000
Casual employees not in agriculture 1,155,689 1,050,000 400,000 750,000 1,500,000 2,100,000 3,000,000
2015 Own account workers 1,451,326 1,000,000 150,000 600,000 1,750,000 3,600,000 8,000,000
Regular employees 2,069,306 1,500,000 224,000 750,000 2,500,000 5,500,000 11,000,000
Casual employees in agriculture 794,394 650,000 200,000 425,000 1,000,000 1,770,000 2,600,000
Casual employees not in agriculture 1,332,710 1,200,000 300,000 780,000 1,700,000 2,500,000 3,600,000
Source: BPS (2015) SAKERNAS, Badan Pusat Statistik, Jakarta.
A simple way of looking further into this issue is by creating a scenario that considers the
reduction in income inequality that could be achieved if minimum wage compliance was
improved. Two scenarios are provided to shed light on this issue: one that considers regular
wage employees only, and one that considers all income earners. The key question is: what
would have happened to the level of wage inequality if the level of minimum wage
compliance reached 100 %.
Figure 24 depicts the scenario for regular wage employment only. Two versions of the Gini
are presented. The first one is the primary wage Gini for regular employees. In the second
one, a new Gini index is calculated assuming that the level of minimum wage compliance
reaches 100 %. For this, the wage levels for those workers receiving less than the Provincial
minimum wage are increased to the legal threshold. Figure 24 shows that in 2014 the wage
inequality Gini would have been reduced from 0.46 to 0.35. This would suggest that wage
inequality could be reduced by nearly one-quarter just by ensuring that all regular wage
employees received the wage to which they were legally entitled. Looking at the longer term
average over the period 2001 to 2014, full minimum wage compliance would have reduced
the primary wage Gini for regular employees by 16 %. If we look at the trend over the period
2007 to 2014, complete minimum wage compliance would flatten the wage inequality graph
at the Gini index of around 0.35.

80
Figure 13: Minimum wage compliance and wage inequality scenario for regular
employees (2001-14)
Source: Calculated from Sakernas and ILO database
The above exercises highlight that improving minimum compliance has considerable
potential to reduce wage and income inequality. By definition improving performance on
compliance would increase the incomes of those at the lower end of income distribution. As
those receiving low wages tend to spend most of their income on locally produced products
and services the policy should provide a stimulus for the domestic economy. On the other
hand, the above exercises assume that there is no negative impact on employment levels
when full compliance with the minimum wage is achieved. If some very low paid workers
become unemployed when minimum wage compliance is enforced this will have a negative
impact on economic activity and income inequality.
While there may be some potential to reduce income inequality through improving outcomes
on minimum wage compliance, a survey of public perception found that in the eyes of the
public the key policy for reducing income inequality was expanding social protection
programs, creating more jobs, providing free education and improving access to credit (Table
4). Increasing the minimum wage was identified by 17% of the survey population as one of
their top 3 programs for reducing income inequality. However, this survey did not explore
public opinion about improving minimum wage compliance as a strategy for reducing
inequality. Evidence presented thus far suggests that improving compliance with existing
labour laws and regulations has the potential to make a significant contribution to more
inclusive and equitable growth.
0.462
0.346
0.30
0.32
0.34
0.36
0.38
0.40
0.42
0.44
0.46
0.48
2001 2002 2003 2004 2005 2006 2007 2008 2009 2010 2011 2012 2013 2014
GIN
I Co
eff
icie
nt
Primary wage GINI for regular employees Gini_with 100% min. wage compliance

81
Table 4: Public perception survey of the most important policies for reducing
inequality, 2014
Policy Percentage reporting in their top 3
Social protection programs 49
Creating more jobs 48
Eradicating corruption 37
Free education for all 30
SME credit 27
Free healthcare for all 17
Increasing the minimum wage 17
Infrastructure improvements (roads, power, etc.) 14
More subsidies (e.g., for agriculture, fuel, etc.) 14
Improving schools 10
Source: World Bank (2016) Indonesia Economic Quarterly March 2016. Jakarta: World
Bank, Jakarta.
Hard evidence about levels of compliance with most labour laws and worker rights are
difficult to obtain. But one can speculate that the implementation of many labour laws and
worker rights may be well below acceptable standards. Despite the complex system of
Provincial, district and sector level minimum wages, most workers in Indonesia know the
minimum wage they are entitled to receive. Even workers with limited education follow the
discussions about the annual minimum wage increase very closely. This is understandable
given that these are decisions that will determine the ability of a family to put rice on the
kitchen table and cloth the children. Yet roughly one out of every two wage workers is still
being cheated because they do not receive the minimum wage they are legally required to
receive. In respect of other worker entitlements, where the laws are more detailed and the
information flow is less transparent, compliance levels are probably far worse.
For example, Figure 25 provides some data on the proportion of regular employees receiving
social security benefits that should be universal. It shows that 46.2 % of regular employees
have health insurance provided by their employer, 32.0% have workplace accident insurance,
19.8% have the access to a provident fund (old age savings), 18.7% have a private pension,
19.0% have life insurance, and 21.4% have access to severance pay entitlements.

82
Figure 14: Percentage of regular employees with social security benefits, February 2016
Source: BPS (2015) SAKERNAS, Badan Pusat Statistik, Jakarta.
Policies to improve the implementation of labour laws and upgrade minimum wage
compliance are desperately required. This must include strengthening labour market
institutions and ensuring they are transparent and fair. In particularly the system of labour
inspection and the labour courts need upgrading. Indonesia, like many developing and middle
income countries, has invested heavily in improving the tax collection system to enhance
simplicity, remove corruption and improve compliance. Similar investments are required in
the labour inspection and labour courts system.
There should also be a stronger role for trade unions in assisting and defending workers who
have had their legal rights infringed. As we saw in Section 5.2 workers who are trade union
members are more likely to receive the benefits to which they are legally entitled. Providing
trade unions with a legal right to enter and inspect enterprises where a prima facie case is
established involving abuse of workers’ rights would be a step in the right direction. Also
supporting, rather than hindering, the organisation of workers in trade unions would help
promote compliance with labour laws.

83
5.4 Employment protection legislation
In Indonesian debates about labour market flexibility over the last decade the issue that
received the most attention was employment protection legislation (EPL) and, in particular,
the level of severance payments required when dismissing “permanent” employees. In fact in
2010 the World Bank stated that:
“The debate around reform of labour law has been vigorous, focusing largely on the
controversial hiring and firing regulations. Previous government attempts to improve
the flexibility of the labour market by reforming these regulations, once in 2006 and
again in 2007, failed. As, a result, Indonesia’s labour regulations continue to be
among the most rigid in the region. This stalemate is constraining Indonesia’s ability
to accelerate the pace of good job creation.”81
While minimum wage issues have dominated the headlines in recent years, disputes about
severance payments, dismissal laws and the high incidence of non-standard forms of work
have been bubbling just below the surface. Attention has recently been returning to this inter-
linked set of issues that caused considerable controversy in the mid- 2000s.
Dismissals had in fact been tightly regulated even prior to the political reforms in 1998. Law
No 12 of 1964 on Employment Termination required employers to get approval for both
individual and mass dismissals regardless of the reasons for terminating employment. As a
consequence, even in the 1990s, employers regularly complained that dismissal procedures
were overly complicated and time consuming. However, throughout the New Order period
the cost of dismissal to the employer in terms of severance payments was very low, and
enforcement of the law regarding prior approval for dismissal was extremely lax.
Aspects of this situation changed in the late 1990s. Job cuts during and after the Asian
economic crisis, combined with the absence of unemployment insurance scheme, focused
attention on this issue. The new independent trade unions made better employment protection
legislation a priority. In 2000 the Government introduced legislation which included a
complex set of rules about who was entitled to severance payments and different levels of
payment depending on length of service and the reasons for termination. Generally speaking,
for workers with 3 or more years of service the new regulation raised severance payments by
roughly 10 %. A few years later the Manpower Law (No 13/2003) made additional
adjustments to these rules and increased severance payments further for workers with 10 or
more years of service. Other payments were also added.
Pressure from employers, a number of academics and the World Bank after the 2003
Manpower Law went into force resulted in the Manpower Ministry reviewing and making
recommendations for far reaching reforms to severance payments.82
These labour market
reforms were also strongly supported by a number of Economic Ministries and were
incorporated into a larger package of tax, investment and trade reforms being promoted by
81 World Bank (2010) Indonesian Jobs Report: Towards Better Jobs and security for All, World Bank Jakarta. 82 The World Bank co-hosted a major international conference on employment protection legislation with the Indonesian Chamber of Commerce (KADIN) in November 2005.

84
the Coordinating Ministry for Economic Affairs. However, when the recommendations to
weaken employment protection were publicly released in early 2006, the trade union
movement organised a number of mass demonstrations culminating in a protest involving
around 100,000 workers on May 1, 2006 in Jakarta. In response to these vocal and intense
public protests, President Yudhoyono announced that the labour reforms would be
withdrawn. He established a commission of academics to review severance payments and
other ways to promote labour market flexibility. But under the Yudhoyono Government the
findings of this commission were never followed up and controversial labour reforms were
eschewed.
The issue resurfaced in 2010 when the World Bank claimed that severance payments
represented a “hiring tax” equal to roughly one third of a workers’ salary and that no other
country in the Asian region had dismissal costs as high as those in Indonesia.83
Employment protection legislation (EPL) is one of the most controversial labour market
issues is most regions of the world. Over the last few decades much of the analytical work
related to “labour market flexibility” and employment outcomes has focused on EPL or some
aspects of this legislation. Unfortunately this analytical work has been hampered by
inadequate data. Most attempts to code legislation in this domain and give it a numerical
value, which is necessary for quantitative analysis, have suffered from two key defects: first,
most of the data relates only to advanced economies, and second, only some components of
EPL are covered in most databases.
To help rectify these shortcomings the ILO recently established a database on EPL indicators
for 95 countries covering eight subcomponents of laws related to worker termination at the
initiative of the employer.84
These eight categories are based on the issues that are addressed
in ILO Convention No. 158 concerning Termination of Employment. They are also the issues
most commonly addressed in national legislation related to this subject. The eight issues are:
valid grounds for dismissal, prohibited grounds for dismissal, probationary period, procedural
notification requirements for dismissal, notice periods, severance pay, redundancy pay and
avenues for redress when workers wish to contest dismissal.85
Based on the content of the
national legislation the ILO has assigned a value between 0 and 1 to each of the above
mentioned issues with higher values reflecting stronger protection for the worker.
Based on a simple average of these 8 indicators Indonesia does have, in aggregate terms, a
high degree of protection for workers against individual dismissal. A key concern is the cost
to the employer when job separations take place. Article 156 of the Manpower Law Act 2003
states that “termination of the employment relationship gives rise to termination payments
that include severance pay and/or long service pay”. If employers were only required to meet
the severance payments, the financial burden would not be excessive in comparison to other
countries in the region. In fact as can be seen from Figure 26 severance payments in
83 World Bank (2010) Indonesian Jobs Report: Towards Better Jobs and security for All, World Bank Jakarta. 84 ILO EPLex Indicators. See ILo “Employment protection legislation: summary indicators in the area of
terminating regular contracts (individual dismissals)”, 2015. 85 ILO, Inwork Issue Brief No.8, “Employment protection legislation: New approaches to measuring the institution”, 2015.

85
Indonesia are roughly in line with those in Thailand and Viet Nam and only slightly higher
than those applying in Cambodia. For employees with more than 5 years of tenure severance
payments in Indonesia are well below those applicable in China.
Figure 15: Severance pay entitlement by job tenure for selected countries
Source: ILO (2015) Employment protection legislation database, International Labour
Organization, Geneva.
But as mentioned above the law also makes provision for other benefits, including a reward
for length of service. This benefit is often referred to as a “gratuity” in Indonesia and is
shown in the middle column of Table 5. It amounts to one month’s pay for every 3 years of
employment up to a maximum of 10 months wages for 24 years of service. If the severance
payments and long service benefits (the gratuity) are combined, the cost to the employer is
significantly higher than most countries in the region.
Whether or not this “long service benefit” should be considered a severance payment remains
a moot point. Many countries have similar arrangements with workers either receiving a
monetary reward or some other benefit, like extra holidays, as an incentive for long tenure. In
most countries such benefits would be available to the worker after a lengthy period of
continuous employment in the one enterprise, or on termination of their employment and not
just for those who are dismissed at the discretion of the employer. Thus if an employee were
to quit and take up a new job with another employer they should still be entitled to this long
service benefit. This is not the case in Indonesia since workers who resign receive neither the
severance payment nor the long service benefit (Table 6).
0
5
10
15
20
25
Cambodia China Indonesia Thailand Viet Nam
Mo
nth
s
Severance pay entitlements by job tenure
1 year 2 years 5 years 10 years 20 years

86
Table 5: Payments applicable to workers at dismissal
Severance Pay Long service benefit ( gratuity ) Compensation Pay
Years of Services Entitlement Years of Service Entitlement Entitlement
< 1 years 1 x monthly salary 3 - 6 years 2 x monthly salary Compensation for
unused leave 1 - 2 years 2 x monthly salary 6 - 9 years 3 x monthly salary
2 - 3 years 3 x monthly salary 9 - 12 years 4 x monthly salary Relocation
compensation 3 - 4 years 4 x monthly salary 12 - 15 years 5 x monthly salary
4 - 5 years 5 x monthly salary 15 - 18 years 6 x monthly salary Reimbursements of
medical expenses 5 - 6 years 6 x monthly salary 18 - 21 years 7 x monthly salary
6 - 7 years 7 x monthly salary 21 - 24 years 8 x monthly salary Other compensations
stated on workers
contract 7 - 8 years 8 x monthly salary > 24 years 10 x monthly salary
> 8 years 9 x monthly salary
Source: UU No. 13/2003 on Manpower Article 156
In addition, the Manpower Act No. 13/2003 makes provisions for “compensation pay” when
workers are dismissed. Compensation pay depends on the benefits specified in their
employment contract, and as can be seen from Table 5 includes compensation for unused
leave and other benefits. This is standard practice in most countries.
The Manpower Act No. 13/2003 also establishes different benefit levels depending on the
reasons for the dismissal (Table 6). The key point to note is that no benefits are paid if the
worker has reached the end of their contact. This creates a very important distinction between
workers on contacts without limit of time (permanent contacts) and workers on temporary or
fixed term contracts. The law thus creates a major financial incentive for the employer to use
workers on a series of short term contacts and avoid any chance of incurring the significant
costs that should apply if they need to dismiss a worker on a contact without limit of time.
This issue is taken up in the next section.
Table 6: Benefits paid according to reasons for dismissal
Reasons for severance Benefits
Resignation only compensation pay
End of contract No benefit
Fired because of workers errors 1 times of severance pay, 1 times of gratuity, and compensation pay.
Fired because of employers mistakes 2 times of severance pay, 1 times of gratuity, and compensation pay
Lay-offs during company losses 1 times of severance pay, 1 times of gratuity, and compensation pay.
Lay-offs during mergers 1 times of severance pay, 1 times of gratuity, and compensation pay.
Company bangkruptcy 1 times of severance pay, 1 times of gratuity, and compensation pay.
Source: UU No. 13/2003 on Manpower
Under the current system, both the severance pay and the long service payment should be
made available to the dismissed (permanent) worker in a lump sum payment immediately
after termination of the employment contract. In situations of mass dismissal this can present
financial challenges. Provisions in the Statement of Financial Accounting Standard in
Indonesia (PSAK 24) regulate these severance and gratuity (long service) payments and are
supposed to ensure that all enterprises have made sufficient long term provisions to avoid
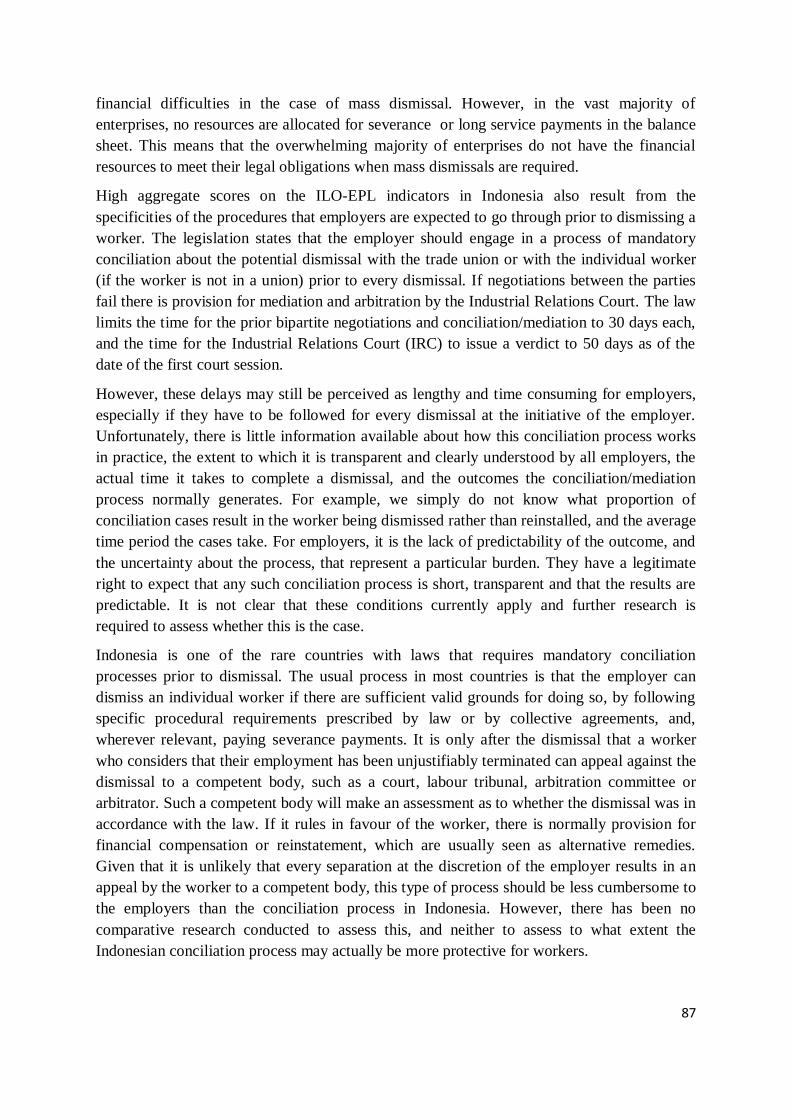
87
financial difficulties in the case of mass dismissal. However, in the vast majority of
enterprises, no resources are allocated for severance or long service payments in the balance
sheet. This means that the overwhelming majority of enterprises do not have the financial
resources to meet their legal obligations when mass dismissals are required.
High aggregate scores on the ILO-EPL indicators in Indonesia also result from the
specificities of the procedures that employers are expected to go through prior to dismissing a
worker. The legislation states that the employer should engage in a process of mandatory
conciliation about the potential dismissal with the trade union or with the individual worker
(if the worker is not in a union) prior to every dismissal. If negotiations between the parties
fail there is provision for mediation and arbitration by the Industrial Relations Court. The law
limits the time for the prior bipartite negotiations and conciliation/mediation to 30 days each,
and the time for the Industrial Relations Court (IRC) to issue a verdict to 50 days as of the
date of the first court session.
However, these delays may still be perceived as lengthy and time consuming for employers,
especially if they have to be followed for every dismissal at the initiative of the employer.
Unfortunately, there is little information available about how this conciliation process works
in practice, the extent to which it is transparent and clearly understood by all employers, the
actual time it takes to complete a dismissal, and the outcomes the conciliation/mediation
process normally generates. For example, we simply do not know what proportion of
conciliation cases result in the worker being dismissed rather than reinstalled, and the average
time period the cases take. For employers, it is the lack of predictability of the outcome, and
the uncertainty about the process, that represent a particular burden. They have a legitimate
right to expect that any such conciliation process is short, transparent and that the results are
predictable. It is not clear that these conditions currently apply and further research is
required to assess whether this is the case.
Indonesia is one of the rare countries with laws that requires mandatory conciliation
processes prior to dismissal. The usual process in most countries is that the employer can
dismiss an individual worker if there are sufficient valid grounds for doing so, by following
specific procedural requirements prescribed by law or by collective agreements, and,
wherever relevant, paying severance payments. It is only after the dismissal that a worker
who considers that their employment has been unjustifiably terminated can appeal against the
dismissal to a competent body, such as a court, labour tribunal, arbitration committee or
arbitrator. Such a competent body will make an assessment as to whether the dismissal was in
accordance with the law. If it rules in favour of the worker, there is normally provision for
financial compensation or reinstatement, which are usually seen as alternative remedies.
Given that it is unlikely that every separation at the discretion of the employer results in an
appeal by the worker to a competent body, this type of process should be less cumbersome to
the employers than the conciliation process in Indonesia. However, there has been no
comparative research conducted to assess this, and neither to assess to what extent the
Indonesian conciliation process may actually be more protective for workers.
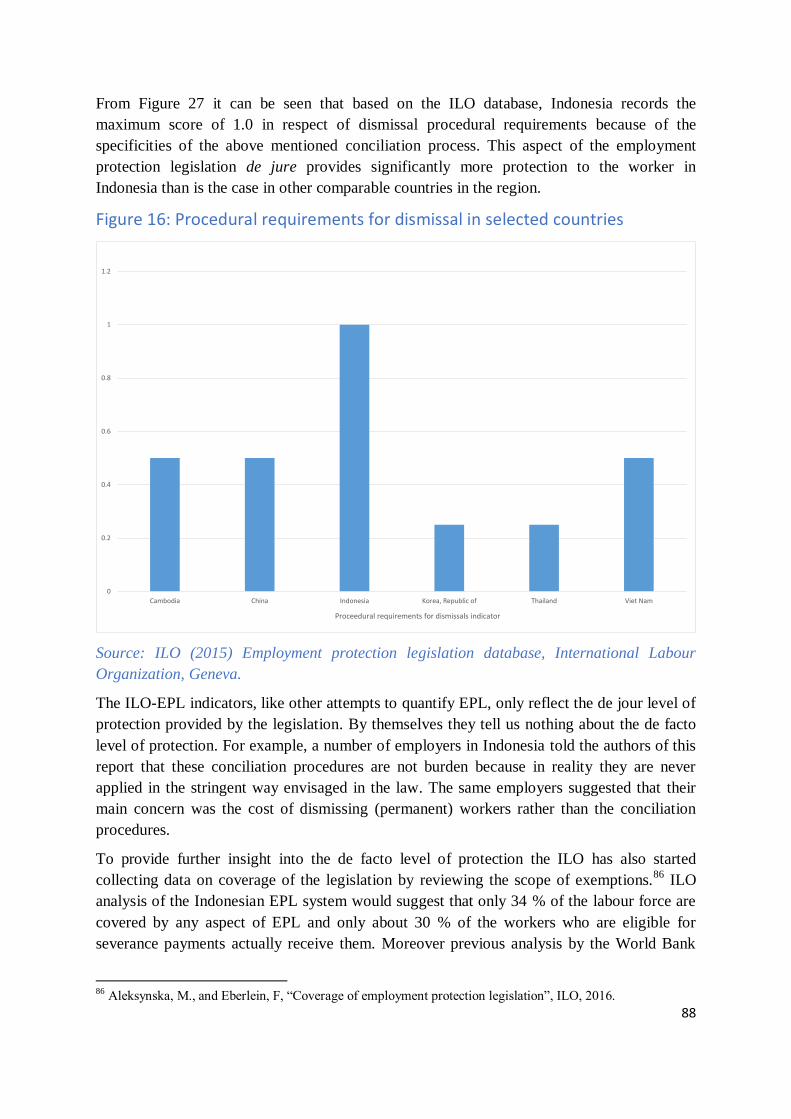
88
From Figure 27 it can be seen that based on the ILO database, Indonesia records the
maximum score of 1.0 in respect of dismissal procedural requirements because of the
specificities of the above mentioned conciliation process. This aspect of the employment
protection legislation de jure provides significantly more protection to the worker in
Indonesia than is the case in other comparable countries in the region.
Figure 16: Procedural requirements for dismissal in selected countries
Source: ILO (2015) Employment protection legislation database, International Labour
Organization, Geneva.
The ILO-EPL indicators, like other attempts to quantify EPL, only reflect the de jour level of
protection provided by the legislation. By themselves they tell us nothing about the de facto
level of protection. For example, a number of employers in Indonesia told the authors of this
report that these conciliation procedures are not burden because in reality they are never
applied in the stringent way envisaged in the law. The same employers suggested that their
main concern was the cost of dismissing (permanent) workers rather than the conciliation
procedures.
To provide further insight into the de facto level of protection the ILO has also started
collecting data on coverage of the legislation by reviewing the scope of exemptions.86
ILO
analysis of the Indonesian EPL system would suggest that only 34 % of the labour force are
covered by any aspect of EPL and only about 30 % of the workers who are eligible for
severance payments actually receive them. Moreover previous analysis by the World Bank
86 Aleksynska, M., and Eberlein, F, “Coverage of employment protection legislation”, ILO, 2016.
0
0.2
0.4
0.6
0.8
1
1.2
Cambodia China Indonesia Korea, Republic of Thailand Viet Nam
Proceedural requirements for dismissals indicator

89
suggested that employers very rarely meet their full financial obligations when dismissing
worker and that on average the small number of workers who get severance payments
receive less than 40 % of the total payment they were legally entitled to receive.87
The small ILO survey of employers conducted by the authors in manufacturing
establishments supported this conclusion. Even employers in large multinational companies
explained to the authors of this report that they would not comply with all aspects of the
legislation and would normally enter into negotiations with the dismissed worker with a view
to paying only a proportion of the legally mandated benefits. Clearly in many small and
medium sized enterprises the dismissed worker receives no financial compensation. So in
reality the relatively restrictive de jour laws are not the burden on employers that they
appear.
5.5 Non-standard forms of work and human capital development
Previously it was noted that Indonesia has had considerable success in expanding wage
employment. In fact by February 2016 roughly 38 % of all employed persons were classified
as regular wage employees. This trend is a clear sign of economic development and reflects
the relative advance of formal non-agriculture sector activities. Most observers would agree
that this trend needs to accelerate further.
However, it would be misleading to assume that all wage employment is homogenous, or that
all wage employment is “decent”. Within the broad general category of wage employment
there are a number of sub-sets. First, this includes a relatively small number of jobs that come
with employment contracts without limit of time. These are often referred to as “permanent”
jobs in Indonesia. These “permanent” jobs in factories or the service sector are what most
Indonesian workers, with low or moderate levels of education aspire to. Employment
contracts without limit of time tend to be better paid and come with a range of employment
benefits compared to other manual or low skilled jobs. As we saw in the previous section
these so-called “permanent” jobs also benefit from legal protection against dismissal
including access to severance payments and the long service benefit. Workers with contracts
without limit of time are likely to be less intimidated by management and more likely to join
a trade union or engage in strikes and other forms of industrial action. They are also more
likely to take legal action if they do not receive the minimum wage they are entitled to
receive or have other worker rights infringed.
Second, a large proportion of wage employment is composed of workers on fixed term
contracts. According to the law these workers should benefit from wage levels and
employment benefits that are comparable to those received by “permanent” employees they
work alongside in the factory or enterprise. By law the big difference between a “permanent”
and a fixed term worker centres on employment security. As we will see below in reality the
type of contact also has an important impact on wage rates and various other employment
conditions (Figure 28). But there are other less tangible but critical differences between these
two categories of workers. For example, the pressure on the worker with a short or fixed term
87 World Bank, Enterprise survey in Indonesia, 2015.

90
contact to secure an extension of their tenure within the enterprise is likely to have
important implications for work intensity, discipline at the workplace and trade union
membership. In addition workers who cycle through a series of fixed term contacts, mixed
with periods of casual day labour in the agriculture sector or informal economy when fixed
term contracts are not forthcoming, are less likely to take legal or industrial action when they
are not paid the minimum wage or are forced to work extremely long hours without
compensation for overtime, or have some other rights infringed.
Figure 17: Percentage of regular wage employees with social security benefits by
contract type, February 2016
Source: BPS (2016) SAKERNAS, Badan Pusat Statistik, Jakarta.
Finally, there is a very significant proportion of wage employment and non-wage
employment that is commonly referred to as “outsourced” workers in Indonesia. In fact there
are two very different types of worker covered by the broad term “outsourcing” in Indonesia.
This term often refers to the outsourcing of tasks that are performed in informal enterprises or
by workers in their own homes on behalf of enterprises in the formal sector. These tasks are
normally performed on a piece-rate basis and the worker normally receives a very low
income and no employment benefits. The vast majority of workers in this situation are
female. These workers are often part of the supply chain producing inputs for large Indonesia,
or even multinational firms, yet they receive wages and conditions that are far inferior to

91
these enjoyed by either permanent or fixed term workers within the parent company. The law
in Indonesia would classify most workers in this situation as self-employed and not covered
by the protection of labour law or entitled to social benefits that are associated with an
employment relationship. However, in many cases these workers are economically dependent
on the parent company distributing the work. Thus it could be argued that these workers are
in a form of “disguised” employment relationship and should be granted the benefits that
apply to wage employees in the parent company. Many countries around the world have
altered the tests that they apply to establish the existence of an employment relationship
placing greater emphasis on economic dependency and less emphasis on control or
subordination of the worker by management.88
There is a strong case for a similar review and
revision to the test applied to establish an employment relationship in Indonesia.
In Indonesia the term “outsourced worker” is also commonly used to refer to workers who
undertake their activities within a formal enterprise but who are engaged through private
employment agencies or labour supply firms. These workers are in a triangular employment
relationship and often receive lower wages and inferior employment benefits compared to the
permanent and contract workers who are engaged directly by the parent enterprise. Their
precarious employment situation will also have important implications for their relationship
with management, trade union membership and ability to secure their legal entitlements.
Many countries are revising their labour legislation, or are using case law, to ensure that
workers in this type of triangular relationship can legally seek compensation from the parent
company if the private employment agency (or labour supply firm) fails to provide the wages
and benefits to which the employee is legally entitled.89
There are strong grounds for similar
reforms in Indonesia.
The high incidence of fixed term contracts and “outsourcing” has been a very controversial
issue in Indonesia for many years. Not surprising trade unions have campaigned vigorously
against the expansion of all forms of precarious work over the last two decades, while
employers argue that these forms of work are necessary to provide the flexibility to meet
fluctuations in demand and the required degree of discipline at the workplace.
The BPS recently started collecting data that should help monitor trends in precarious work in
the future. According to the latest labour force survey, as of February 2016, 20 % of regular
wage employees claimed they had written work contracts without limit of time ( these would
be classified as “permanent” workers in Indonesia), 30 % claimed they were on were on fixed
term contracts, and the remaining 50 % told the BPS they either had no contract (agreement),
a verbal contract ( agreement) or they did not know what type of employment contract they
held (Figure 29). The 50 % of wage workers that are neither permanent nor on fixed term
contacts would include most of the “outsourced” workers. As is evident from Figure 28 wage
88 Janine Berg, ILO, forthcoming major report on non-standard for of work. See in particular Chapter 6 on
“Addressing decent work deficits in non-standard forms of work”.
89 Ibid.

92
employees who are neither permanent nor have a fixed term contact are very unlikely to
receive health insurance, provident fund, pensions or other benefits.
Workers on fixed term contracts, outsourced workers and those without a formal contact are
examples of non-standard forms of work that have become prevalent in most countries.90
This
data would suggest that up to 80 % of all wage workers in Indonesia are in non-standard
forms of work. Recalling that wage employment represents less than 40 % of total
employment and the vast majority of those not in wage employment are engaged in the
informal economy or work in agriculture it is apparent that, despite recent progress, their
remain major decent work deficits.
Figure 18: Contract types for wage employees, February 2016 (millions)
Source: BPS (2016) SAKERNAS, Badan Pusat Statistik, Jakarta.
There have been some important attempts to regulate and limit the spread of non-standard
forms of work in Indonesia. For example, legislation concerning fixed term contracts usually
covers at least three aspects: the maximum duration of a fixed term; the possibility for
renewal; and regulations about the type of work that is permitted under a fixed term contract.
In order to curb the growing number of temporary contracts, the Manpower Act of 2003
90 “Non-standard forms of employment” is an ILO term that refers to (1) temporary employment; (2) contractual
arrangements involving multiple parties, including temporary agency work; (3) ambiguous employment
relationships, including dependent self-employment and disguised employment relationships; and (4) part-time employment. For further details see Janine Berg, ILO, forthcoming.

93
reduced from 5 years to 3 years the time limit on fixed term contracts. More specifically the
law provided for fixed term contracts of 2 years with the possibility of one extension for
another 12 month period.
However, the 2003 reforms failed to reduce the ratio of fixed term contracts to total
employment, because employers merely replaced workers when the 3 year time limit expired
and re-hired them at a later date on another fixed term contract rather than granting them a
contact without limit of time. In general, experience in other countries also suggests that
when the use of fixed-term contracts is wide-spread, legal reforms that reduce time limits
may have limited capacity to reduce their use by merely reducing the time limits. This is
because many employers have already adopted their production structures and processes to
meet the requirements of workers on fixed-term contracts.
The Indonesian legislation also contains provisions concerning the type of work that is
permitted under fixed term contracts. But the wording of these provisions is rather vague and
includes, among other permitted reasons, any work “which is temporary in nature”. Quite
likely, this provision has encouraged a wide interpretation about the scope for fixed term
contracts and hence further facilitated their use.
As a result, since the 2003 reforms were introduced, the ratio of employees with contracts of
3 years duration or less has remained high, with close to 40 % of all regular employees
having a job tenure of 36 months or less. In some sectors like wholesale and retail trade the
proportion of wage employees on fixed term contracts was around 54% in 2015 (Figure
30).91
91 36 months is the maximum contract duration that can be offered to a regular employee on a short term contract.

94
Figure 19: Regular employees with less than 36 months of job tenure by sector, 2011-
2015
Source: BPS (2014) SAKERNAS (selected years), Badan Pusat Statistik, Jakarta.
While the law may allow fixed terms of up to 3 years it would be incorrect to assume that this
is the standard length of a contract. In February 2016 14.9% of regular employees (6.9
million people) had job tenure which was 12 months or less (Figure 31). As we will see
below the heavily reliance on short term contacts is one factor inhibiting human capital
development in Indonesia.

95
Figure 20: Employed people with less than 12 months of job tenure by status in
employment, February 2016
Source: BPS (2016) SAKERNAS, Badan Pusat Statistik, Jakarta.
There have been some efforts to limit the “outsourcing” of activities by restricting the type of
work and the types of jobs that enterprises can legally sub-contract to another enterprise.
Under the existing law, the contracting out of activities is limited to non-core functions of the
primary enterprise. More specifically according to Regulation No. 19/2012, the
subcontracting of work must meet the following requirements:
The management and the implementation of the outsourced work must be
conducted separately from the main activities of the company providing the work;
The work must be performed by direct order or indirect order from the user
company for the purpose of providing clarity on how to perform the work so that
it is consistent with the standards of the user company;
The work must be a supporting activity, i.e. the work is necessary to support and
facilitate the implementation of the main activities according to the flow chart of
the work implementation process stipulated by the relevant sectorial business
association; and,
The work must not directly hinder the production process, i.e. the work must be an
additional activity and if not performed the production process will still continue
as normal.

96
All these conditions are cumulative, so if one of them is not fulfilled, the concerned activity
cannot be outsourced. According to the law outsourcing is only permitted to formally
registered companies, however, in reality work that is outsourced is often undertaken by
entities in the informal economy or by homeworkers.
The Indonesian authorities have also attempted to regulate the scope of triangular
employment relationships to a few non-core jobs. Regulation No. 19/2012 allows enterprises
to “outsource” the following five activities to employment agencies or labour hire companies:
1. Cleaning services;
2. Catering services for employees;
3. Security services;
4. Support services in the mining and oil sector; and
5. Transportation services for employees.
The regulations require that the labour supply or employment services companies are
formally registered. According to the law workers who have a permanent contract with a
labour hire company or employment service are entitled to severance payments, health
insurance, pensions, and annual leave. However, this rarely applies in practice and the wages
actually received by workers engaged through these triangular relationships are often very
low because the employment agency deducts fees from the worker rather than charging the
employer.
Breaches of the laws regulating fixed term contracts and outsourcing are extremely common
and workers engaged in these non- standard forms of work have legitimate grievances
because they are frequently the workers who do not get the minimum wage or other benefits
they are legally entitled to receive. This is a major cause of friction and conflict in the labour
market.
An excessive reliance on non-standard forms of work also can have a negative impact on
efficiency and productivity because it discourages investment in new skills and human capital
development. For employers who hire workers on fixed term contracts, the time horizon is
often not sufficient for the firm to accrue a rate of return that off-sets the cost of training.
Figure 32 illustrates this point. Employees with a permanent contract are more likely to have
participated in certified workplace training than employees on fixed or informal contracts.
Because the vast majority of enterprises throughout the formal sector in Indonesia face this
same incentive structure, the outcome is a chronic under investment by management in
training.
A similar dysfunctional incentive structure exists for the worker. Because a very large
proportion of workers do not expect to remain in the same enterprise for lengthy periods, the
incentive to acquire firm specific skills is diminished.

97
Figure 21: Participation in certified workplace training by contract formality for all
employees, February 2016
Source: BPS (2016) SAKERNAS, Badan Pusat Statistik, Jakarta.
The high concentration of precarious forms of work and the absence of income protection for
the unemployed leads to excessive levels of labour market “churning” in Indonesia. In the
absence of unemployment insurance, or any State provided benefits, unemployed workers –
particularly those with lower levels of education attainment - tend to shift between formal
sector fixed term contracts, work in the agricultural informal economy and then, if they are
lucky, they return to the formal sector for another fixed term job. For example a recent ILO
survey of production workers in manufacturing, found that over a 12 month period only 65%
of the sample were still working as production workers. The other 35 % had been forced to
take up employment as an agricultural labourer or had left the labour force (Figure 33). It was
rare for these workers to climb the career ladder and graduate into more highly skilled
occupations.

98
Figure 22: Transition rates for production workers across occupations by education
attainment over 12 months
Source: BPS (2016) SAKERNAS (selected years), Badan Pusat Statistik, Jakarta.
There are therefore both equity and efficiency grounds for examining the incentive structures
and regulations that encourage an excessive reliance on fixed term contracts and other non-
standard forms of work. The legislation that might be relevant in any such review are the
regulations governing dismissal procedures that do appear cumbersome for the employer
and the complex set of rules related to severance and long service payments. The regulations
that have been introduced to limit fixed term contacts and outsourcing have not been
effective. In the absence of a major reforms to the labour inspection system and the labour
courts system it is unlikely that further legal restrictions on the use of fixed term contracts
and outsourcing will have the desired impact. It may be more effective to adjust financial
incentives rather than tightening these laws.
In 2010 the World Bank proposed a “grand bargain” for Indonesia that involved lowering
severance payments in exchange for introducing unemployment benefits.92
Based on the
above analysis an effective bargain might need to cover a broader range of issues. This could
involve revising the existing legislation concerning the procedures prior to individual
dismissal ( the conciliation process) with the aim of making this process more transparent,
clearly understood, faster and predictable. This might involve a move away from conciliation
92 World Bank (2010) Indonesian Jobs Report: Towards Better Jobs and security for All, World Bank Jakarta.

99
prior to dismissal and towards greater reliance on the right of workers to contest, before a
tribunal, whether the dismissal was fair after termination. It might also involve revisiting the
provisions related to long service payments ( or gratuity) that, based on the current
legislation, are only applicable to workers who are dismissed at the discretion of the
employer. In reviewing these provisions careful attention should be paid to the evidence on
the de facto level of benefits paid and not just the de jour levels specified in legislation.
The quid pro quo for such changes could be an increase in the remuneration received by
regular wage employees who do not have a contact without limit of time. All wage
employees on fixed term contacts or workers supplied through a labour supply companies or
employment agencies could be paid a premium on the minimum wage. For example, workers
with contacts of this nature might be eligible to receive 15 % above the provincial, district or
sector minimum wage that would be applicable at the parent enterprise where they work. A
simple rule like this might be more effective than trying to further tighten the complicated
regulations that attempt to curtail the time limits, occupations or other characteristics of non-
standard work contracts.
It would also be essential to strengthen enforcement mechanisms as to ensure that any
revised legislation is properly implemented. The details of the reforms and the trade-offs
between the different aspects should be the subject of detailed tripartite discussions. In
addition, further efforts and incentive systems may be needed from the government to drive
shifts in the culture of workplace training in Indonesia. This will be further explored in the
following section.
5.6 Vocational training, apprenticeships and skill development
Long run labour productivity trends, broadly defined as GDP per person employed, show that
Indonesia is not currently on the path to convergence with global norms (Figure 33). Back in
1991 Indonesian labour productivity was 54 % of global labour productivity. By 2012 the
comparable figure was just 60 %. That represents a six percentage point improvement over a
23 year period in which Indonesia joined the ranks of middle income countries. One factor
retarding more rapid convergence with productivity levels in high income countries is the
quality of human capital in Indonesia.

100
Figure 23: GDP per person employed (constant 2011 PPP $) for Indonesia and the
World
Source: World Bank (2015) World Development Indicators, World Bank, Washington D.C.
The structural transformation of the Indonesian economy, that has accompanied sustained
economic growth over the past decade, has had a profound impact on the labour market.
Workers with advanced levels of education and skill are in high demand and can command
significant rewards. Rapidly widening wage premiums for university graduates is often cited
as indirect evidence of a skill shortage problem in Indonesia. Indeed, analysis of job flows by
the level of educational attainment between 2012 and 2014 highlights that once workers with
university degrees become employees they rarely become unemployed again. These trends
are expected to accelerate over the next two decades. An important question is to what extent,
and how rapidly, the Indonesian education and training systems can respond to these changes
and equip the existing workforce, and youth who will enter the labour market, with the
required combination of hard and soft skills.
There is always a significant time lag between the changes in the demand for new skills and
adaption of education and training programmes to meet these new trends. In the meanwhile a
skills mismatch emerges in the labour market. Data compiled by the ILO would suggest that
roughly 44 % of youth in Indonesia are under qualified for the work that is available ( Figure

101
34). This ratio is significantly higher than the comparable figure for the Philippines and even
exceeds the level in Cambodia. In Indonesia low education attainment and poor career
guidance, mean that nearly half the young people leaving school, enter the workforce with
qualifications that do not match the needs of employers. With an under qualified workforce,
the productivity performance of Indonesia is unlikely to make the leap required for economic
convergence and the pace of structural transition to higher value added activities will remain
restrained.
Figure 24: Qualification mismatch of employed youth, (per cent)93
ILO (2015) Asia Pacific Labour Market Updates, October 2015, ILO Regional Office,
Bangkok.
Reducing the lead time that education and training institutions take to meet the changing
demand of the labour market is the solution. But this is easier said than done. Assessing the
current skills gap and anticipating future skills need, revising the existing or designing new
education and training courses, re-training teachers and instructors, building necessary
93 This metric of qualification mismatch is based upon aligning educational attainment levels according to the
International Standard Classification of Education (ISCED) with occupational groups according to the
International Standard Classification of Occupations (ISCO). ISCO occupational groups 1, 2, and 3 are
considered high-skill and align with ISCED-97 levels 5 and 6. ISCO groups 4, 5, 6, 7 and 8 are considered
medium-skill occupations and align with ISCED levels 3 and 4. ISCO group 9 of low-skill occupations
correspond with ISCED levels 1 and 2. Following this normative approach, workers whose occupation match
the assigned education attainment level are considered adequately qualified. Those with a higher level of
education are considered overqualified and those with a lower level are classified as underqualified. Together,
the overqualified and underqualified are considered mismatched. That is, their education levels are not in line with job requirements.
0% 10% 20% 30% 40% 50% 60% 70% 80% 90% 100%
Philippines
Pakistan
Indonesia
India
Cambodia
Underqualified Adequately qualified Overqualified

102
facilities and purchasing equipment all requires significant financial resources, technical
capacity and well-coordinated public policy.
While the message is clear - “invest in skills or lose out”94
- it is important to invest in “hard
skills” as well as “soft skills”. In particular, dialogue is needed between employers, workers
and government to ensure that investments in training institutions are the ones that are needed
to drive forward growth. Further development of human resource managerial strategies
within firms is also required. The type of soft skills that workers and employers require
relate to communication, negotiation and team work. Strengthening skills in human resource
management provides a platform for working together better and builds skills to engage in
constructive dialogue for workplace development. This is an important factor in
competitiveness. Evaluations from the ILO Better Work activities in Indonesia confirm that
better human resource source management strategies and increased compliance with labour
laws and international labour standards go hand in hand. 95
The Government of Indonesia has increased its financial commitments to education. The
level of expenditure on education has been rising rapidly for well over a decade. By 2012
public expenditure on education amounted to 18 % of total government expenditure, or 3.6%
of GDP. However because tax levels and public expenditure levels in Indonesia remain low
by international standards, the proportion of GDP devoted to education still remains below
the global average of 4.7% of GDP.
The issue is not just a matter of resources. In fact, the central problem is the lack of clarity
and consistency in public policy towards education and training and a failure to ensure
efficient implementation of public policy in these domains. Overlap and competition between
different Ministries and a lack of coordination between central, regional and local
government are the main challenges hindering the implementation of public policy in the
fields of education, vocational training and skill development.
One possible solution to the aforementioned problem lies in greater collaboration among the
education and labour authorities, companies and trade unions in enhancing the quality and the
relevance of education and training. The Government can play a catalytic role in bringing
education and training providers, employers and workers closer together to create greater
synergies for human capital investment. Dialogue and collaboration among the parties can
lead to better identification of skills needs, enhance the relevance of education and training,
and improve the jobs prospects of the youth.
At present however employers are under investing in their workforce. According to data from
the World Bank in 2009 only a very small proportion of firms (4.7%) offered formal training
to their employees. Over time this ratio may have declined. The Institute for Economic and
Social Research at the University of Indonesia in conjunction with the World Bank and the
Coordinating Ministry for Economic Affairs has been conducting regular investment climate
monitoring surveys in Indonesia. The most recent survey was conducted in 2014 and the
94 http://jakartaglobe.beritasatu.com/news/ilo-warns-indonesia-invest-skilled-labor-lose/ 95 TUFTS (2014) Better Work Indonesia impact assessment: Managers report, ILO Country Office for Indonesia and Timor-Leste, Jakarta.

103
results were released in mid-2015. The survey found that in manufacturing the proportion of
firms that provide “guidance and assistance to enhance the skill of new workers” remained
constant between 2010 and 2014 but in the service sector this ratio declined.96
Workers with low levels of education very rarely participate in certified workplace training
programs. For example, 1 in 4 people with university degrees participated in certified
workplace training, while only 1 in 10 people with high school qualifications and 1 in 100
people with junior high or less qualifications participated in certified workplace training. This
is not an efficient way to develop human capital. Skill shortages and mismatches are well
recognised as a major factor inhibiting faster economic and employment growth in Indonesia.
The development of an extensive high quality apprenticeship system has been proposed by
many observers as an efficient way to ameliorate the skill shortage problem. Apprenticeships
systematize collaboration by combining school-based learning and workplace-based training.
It effectively taps into existing training resources and equips youth with knowledge and skills
for their future occupations. In an apprenticeship model, companies provide practical training
at the enterprise using their equipment, and experienced workers transfer technical know-how
to the youth.
Apprenticeship is a unique form of vocational education, combining on-the-job training and
school-based learning, for specifically defined competencies and work processes. It is
regulated by law and based on a written employment contract with a compensatory payment
and standard social protection coverage. Apprenticeships usually last longer than one year
and in some countries they last four years. The ILO’s approach to quality apprenticeship
emphasizes social dialogue, clear definition of roles and responsibilities, legal framework and
shared-financing arrangement. A quality apprenticeship is a sophisticated learning
mechanism based on mutual trust and collaboration among the stakeholders: youth, labour
and education authorities, employers and workers.97
Promoting the development of the apprenticeship system is timely in Indonesia for two
reasons: facilitating youth in their school-to-work transition and fulfilling G20 policy
consensus. Quality apprenticeship systems have a good track record. Advanced economies
that invested heavily in comprehensive apprenticeship schemes tend to have lower rates of
youth unemployment (Figure 35). For example, in the midst of the global financial and
economic crisis, which saw youth employment outcomes deteriorate, countries with
apprenticeship systems were able to better support the labour market attachment of youth.
This is because apprenticeships bridge school education with the world of work. Noting the
positive impact of apprenticeship in reducing youth unemployment, the G20 Labour and
Employment Ministers took a decision to promote apprenticeships, highlighting the
importance of:
96 Institute for Economic and Social research, 2Final report: Investment Climate Monitoring Survey (2014), 97 ILO (Forthcoming) Quality Apprenticeships: Bridging training to productive and Decent Work, Skills for Employment Policy Brief, International Labour Office, Geneva.
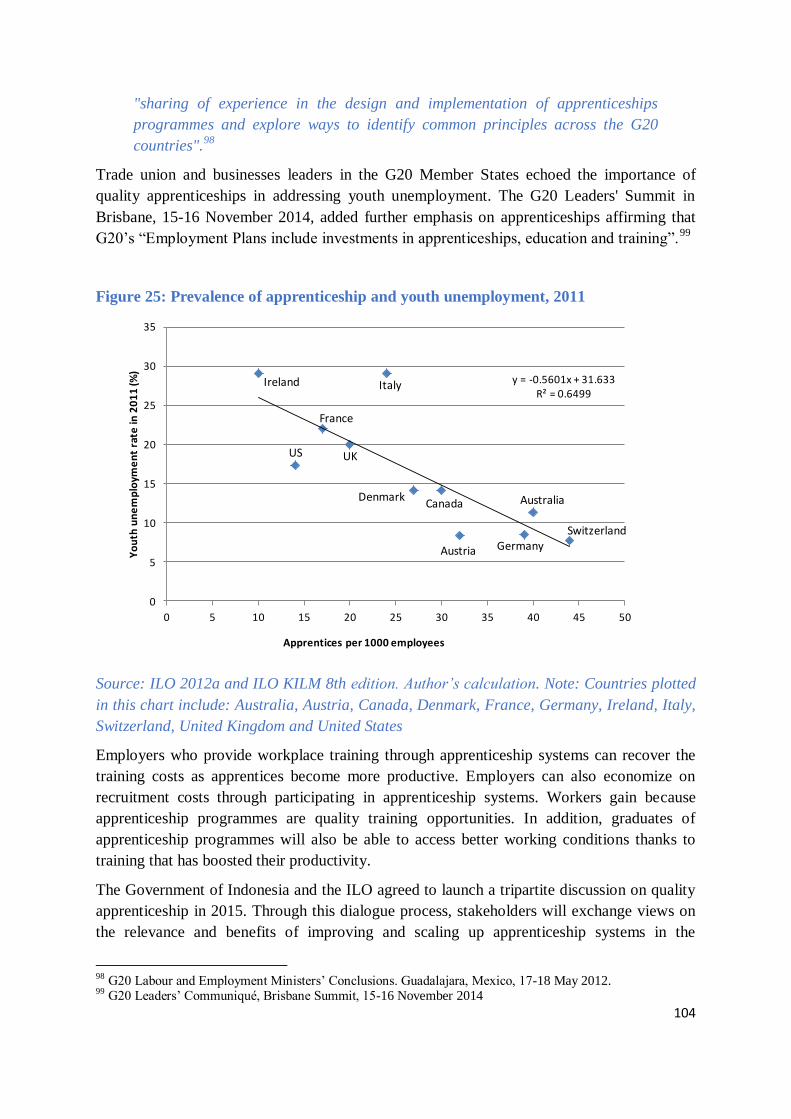
104
"sharing of experience in the design and implementation of apprenticeships
programmes and explore ways to identify common principles across the G20
countries".98
Trade union and businesses leaders in the G20 Member States echoed the importance of
quality apprenticeships in addressing youth unemployment. The G20 Leaders' Summit in
Brisbane, 15-16 November 2014, added further emphasis on apprenticeships affirming that
G20’s “Employment Plans include investments in apprenticeships, education and training”.99
Figure 25: Prevalence of apprenticeship and youth unemployment, 2011
Source: ILO 2012a and ILO KILM 8th edition. Author’s calculation. Note: Countries plotted
in this chart include: Australia, Austria, Canada, Denmark, France, Germany, Ireland, Italy,
Switzerland, United Kingdom and United States
Employers who provide workplace training through apprenticeship systems can recover the
training costs as apprentices become more productive. Employers can also economize on
recruitment costs through participating in apprenticeship systems. Workers gain because
apprenticeship programmes are quality training opportunities. In addition, graduates of
apprenticeship programmes will also be able to access better working conditions thanks to
training that has boosted their productivity.
The Government of Indonesia and the ILO agreed to launch a tripartite discussion on quality
apprenticeship in 2015. Through this dialogue process, stakeholders will exchange views on
the relevance and benefits of improving and scaling up apprenticeship systems in the
98 G20 Labour and Employment Ministers’ Conclusions. Guadalajara, Mexico, 17-18 May 2012. 99 G20 Leaders’ Communiqué, Brisbane Summit, 15-16 November 2014
y = -0.5601x + 31.633R² = 0.6499
0
5
10
15
20
25
30
35
0 5 10 15 20 25 30 35 40 45 50
Yo
uth
un
em
plo
yme
nt
rate
in 2
01
1 (%
)
Apprentices per 1000 employees
Switzerland
Australia
GermanyAustria
CanadaDenmark
Italy
UKUS
France
Ireland

105
countries in the contexts of G20 policy coherence and Indonesia’s manoeuver to avoid
middle-income trap. In Indonesia the Manpower Act (2003, No. 13) provides the legal
framework for apprenticeship (pemagangan) and tasks the central government and local
governments to develop apprenticeships (Article 29).
The Indonesian word “pemagangan” can be translated into English as “internship” or
“apprenticeship”. But these two systems of training are very different. The vast majority of
“pemagangan” schemes in Indonesia equate more closely with internship arrangements rather
than genuine apprenticeship schemes. Most schemes are short term and fail to combine on the
job training with class room based technical education. A major shortcoming of the current
legislation is that it only requires employers to pay certain allowances to young people who
are engaged under the “pemagangan” legal framework. The absence of a proper wage has
been highly criticized by the trade unions and has led to unions describing these schemes as
“slave labour” that is used to undermine existing labour standards. The shortcomings in the
legislation have polarized the debate about apprenticeships in Indonesia and are a major
barrier to creating schemes that can make a real contribution to improving the human capital
stock.

106
Box 4: Industry's initiative to establish a vocational high school (SMK)
Facing recruitment challenges, a group of human resources managers from factories in an
industry park in Cikarang, a suburb of Jakarta, established an SMK in 2011. The school
clearly demonstrates the impact of industry involvement in vocational education in terms of
the relevance of curriculum, workshop equipment and educational outcomes. Companies in
the industry park have donated school buildings and workshop equipment. They also send
their workers to the school as instructors. While following the national guidelines and
regulations, the education programmes of this school reflects the human resource needs of the
companies. In addition to the technical competencies that are developed through this
programme, this system also fosters development of soft skills, such as discipline and a
positive work attitude, that are needed in the workplace.
The school environment of this SMK imitates a real workplace environment. For instance,
passages are marked in green as they are in a factory and admission to the school resembles
recruitment process of a company. The first batch of the students undertook practical
fieldwork or internship (PKL). According to feedback received by the school, the students
performed better than students from other schools. Indeed, many companies have already
expressed their intention of hiring the students upon their graduation. The school
management expects a high employment rate among its graduates, which is particularly
encouraging as in general unemployment tends to be highest among senior high school
graduates.
The school founders feel that the duration of PKL (usually one to three months) should be
longer. A longer PKL would permit students to learn more while building their productivity.
They view that the regulatory framework on vocational education and PKL could leave more
leeway for industry’s involvement in vocational education.
Source: Interview with the school managers on 29 September 2014 by ILO staff.
Box 5: Vocational training in Indonesia
There are several public and private avenues for provision of vocational training in
Indonesia. In particular, the Government offers vocational education under the Ministry of
Education’s senior vocational secondary schools, while the Ministry of Manpower (along
with several other ministries) operates a number of vocational training colleges that
provide competence based training programmes as well as apprenticeship programmes that
combine classroom learning with on-the-job training. Several large companies in the
private sector have also developed their own training centres for meeting their specialized
training needs.
The Indonesian apprenticeship system has had a chequered history and was severely
impacted by the Asian Financial Crisis as well as processes associated with democratic

107
transition. In recent years there has been a reinvigoration of the apprenticeship system.
However, the current framework for apprenticeships is closer to a traineeship model and
there are several conceptual issues associated with the concept in Indonesia. For example,
the Indonesian term “pemagangan” covers a range of terms including “traineeship”,
“learnership”, “internship” and “apprenticeship”, despite the conceptual differences in the
various training programmes. It is generally acknowledged that an apprentice requires
several years of training, work experience and mentoring in order to consolidate their skills
base. While the word “apprentice” is sometimes used to describe a “beginner” it should not
be misconstrued in its actual meaning within the context of skills and trades. It usually
encompasses a thorough understanding and ability to perform the multiple tasks required in
a trade. In Indonesia apprenticeships are often only 3 to 6 months in duration and by law a
maximum of 12 months for apprenticeships, as per the regulations provided by the
Ministry of Manpower.100
The Minister of Manpower has the mandate for regulation of apprenticeships in Indonesia,
however, there are many barriers to its effective operation. For example, several ministries
operate their own programmes in absence of an adequate equivalency certification
framework to support skills recognition. In addition, there are several companies in the
private sector that have established their own training centres, however, certification from
such training programmes is often not recognized beyond the immediate employer. These
challenges raise issues on skills portability, with the lack of coordination potentially
impacting upon the mobility of trained workers through increasing retention and reducing
competition for skilled workers.
6. Conclusions
The model that delivered robust economic growth and social cohesion since the removal of
President Suharto and the Asian economic crisis in 1997-98 has been under threat from a mix
of external and internal forces in the last few years. In particular, the economic slowdown in
China and the end of the commodities “super-cycle” has damaged the profitability of
Indonesian plantations and the extractive sector. More recently, as in other emerging
economies, investor and consumer confidence are being tested. The currency experienced
heightened volatility in mid 2015 but has been more stable in recent months.101
Despite these head winds in the global economy, Indonesia has maintained annual real
economic growth rates around the 5 % mark. The labour market situation also remains
reasonable compared to trends in other emerging economies. On the plus side there are signs
100 In 2005 the Minister for Manpower issued Ministerial Regulation No.21/MEN/X/2005 on the
implementation of the apprenticeship program, and in in 2007, the government issued Government Regulation
No.31/2006 in an attempt to support renewal of the program by laying the groundwork for the National
Apprenticeship System (SISLATKERNAS). The current system is known as the Enterprise based
Apprenticeship System and consists of apprenticeships of 3-6 months duration, based on a contract between the
apprentice and employer. The maximum time allowed for an apprenticeship is 12 months. 101 Based on data from Bank Indonesia on the foreign exchange rate reference from the Jakarta interbank, where USD 1 = IDR 12,188 on 01 Oct 2014 and USD 1 = IDR 14,654 01 Oct 2015.

108
that the quality of jobs may have improved somewhat given that the proportion of workers in
wage employment continues to rise and now constitutes slightly less than 40 % of all jobs,
although not all wage employment can be considered decent.
This is not the time for panic or rash decision making. Economic growth rates and labour
market indicators of this magnitude would delight policy makers in most other economies
that depend heavily on the export of commodities. The Government has taken a range of
measures to reinforce macroeconomic stability and encourage structural change. In the period
ahead the real test will be whether the manufacturing sector can expand while improving
productivity performance and moving up the “value chain”. Similarly, the services sector also
needs to show rapid gains in employment quality to absorb the youthful and more educated
labour force of the future.
There is broad consensus that a stronger, and more diversified, manufacturing sector should
play a more prominent role in driving growth in Indonesia. Debate continues about the right
mix of policies to achieve this goal. Indonesian has considerable experience, and comparative
advantage, in various labour intensive manufacturing activities. These parts of the economy
have performed much better than is commonly believed in recent years. In terms of output
growth, productivity and employment, the record of labour intensive manufacturing has been
robust. Low labour costs, a diligent and reasonably well trained workforce, particularly in
Central Java, has increasingly made this Province of Indonesia a destination of choice in the
Asian region for foreign investors and multinational companies in the clothing, footwear and
related industries. The fact that Indonesia had a sound record on freedom of association and
respect for fundamental International Labour Standards after 1998 has reinforced foreign
investor decisions and encouraged high profile multinational companies, who jealousy guard
the reputation of their supply chain, to source from Indonesia.
Nevertheless there remains scope to significantly expand employment in the manufacturing
and high end service sectors. Moving more workers from low productivity activities in the
agriculture and informal economy into better paying and higher productivity jobs in
manufacturing and services is a sensible and realistic objective.
Public policy also needs to support capital and resource intensive manufacturing activities. So
far Indonesia has failed to capture its fair share of foreign direct investment in capital
intensive manufacturing. Given the size of the domestic market, very competitive labour
costs and the geographical location of Indonesia, one would expect far greater integration in
global supply chains centred on capital intensive manufacturing. On the plus side there have
been indications that large multinational firms in the automobile and electronics industries are
looking favourable at expanding production in Indonesia. Policies already adopted by the
Government to improve infrastructure and reduce the bureaucratic burdens that investors
face will help to secure such foreign direct investments.
The Government can do more to encourage high end manufacturing and better quality
services by improving the quality of existing public investment on skills and training. There
is broad consensus that Indonesia faces a significant skills deficit, but public policy in this
domain is constrained by the lack of coordination across Government Departments and

109
Provincial authorities. Private investment in skills and training is discouraged due to an
underdeveloped apprenticeship system, the heavy reliance on fixed term contract workers and
other forms of precarious work and possible some aspects of the existing employment
protection legislation.
In any economy the wage system can be used to complement industry policy in an attempt to
bring about structural change. It is usually difficult to design a wage fixing system that
simultaneously supports industries that want to complete with low wage clothing and
footwear producers and high tech manufacturing products. However, the Indonesian system
of Provincial and district level minimum wages, with differentials of 270 % between the
highest and lowest Provincial minimum wages, does provide scope to support a very
diversified economic structure.
The collapse in global commodity prices and recent moderation in domestic economic growth
rates has reignited old policy debates about labour market institutions and laws. It was used to
justify controversial reforms to the minimum wage fixing system in mid-October 2015. The
economic rationale for these reforms remains unclear. Protagonists of the new “formula”
approach to minimum wage fixing, which eliminates any social dialogue and reduces the
emphasis on “decent living needs”, claim this new approach is “fair, simple and reliable”.
The new system is supposed to result in all minimum wages being adjusted annually to
reflect the combined value of real GDP growth and the percentage increase in the national
CPI in the previous year.
This system is simpler than the old system, which involved detailed surveys of changes in
living costs and rigorous economic debate at the Provincial level between government
officials, employers and trade unions. This Report has however raised questions about the
likely medium to longer term impact of the reforms on wage levels, inflation and eventually
macroeconomic policy. The “old” minimum wage system delivered a prolonged period of
real wage restraint between 2003 and 2012. While it lacked the reliability of the formula,
analysis presented in Section 4 of this Report demonstrated that wage costs would have been
lower in most Provinces, and in most years since 2003, with the “old” minimum wage system
than with the new formula approach.
It is also true that the “old” minimum wage fixing system generated substantial nominal
minimum wage increases immediately before, and again after, the “great wage moderation”.
When we put minimum wage trends aside, we see that average real wages have not kept pace
with productivity improvements over the long term, inflation has declined, the proportion of
good jobs in the labour market has grown and Indonesian manufactured goods remain
competitive in international markets.
The impact of recent reforms on social cohesion is a reason for concern. Since October 2015
Indonesia has witnessed an upsurge in strikes and demonstrations against the minimum wage
reforms. Moreover, during 2016 industrial tensions have intensified. In June 2016 the ILO
Committee on the Application of Standards issued far reaching recommendations for reforms
to both laws and industrial relations practices in Indonesia. The Committee composed of
employers, governments and trade unions from around the world decided that the situation

110
was sufficient grave to send a “direct contacts missions”, which is a team of international
legal experts, to Indonesia to assist the Government revise its laws and practices. The last
time this happened in Indonesia was in 1998.
If industrial relations continue to deteriorate in Indonesia this will deter both foreign and local
investors at a time when Indonesia needs to attract investors leaving China in search of new
competitive locations. As things stand, Indonesia has a comparative advantage in low labour
costs over many other key competitors in Asia. What it lacks is the required reliability of
production, an efficient logistics system, a sufficient skill base and sound industrial relations.
The smart strategy would be to tackle the areas in deficit without sacrificing the advantages
that currently exist. Indonesia has worked hard to establish a good reputation on Freedom of
Association and related human rights since 1998. This should not be sacrificed at this time.
While it may be tempting for some to dress debates about minimum wage fixing in
sophisticated economic arguments, this is really a fight about the balance of power in the
workplace. No one denies that the former minimum wage fixing system was politicised and
could result in sudden upward jumps in labour costs, which in an ideal world, would be
smoothed out over time. Nor can it be ignored that observed differences in minimum wage
rates between Provinces and districts may at times be inconsistent with economic
fundamentals. But these arguments ignore the fact that trade unions in Indonesia have used
the minimum wage fixing system as a powerful organising tool. Campaigns around the
minimum wage are simple, easy to communicate and widely supported. Workers, without
distinction whatsoever, know and care about their minimum wage despite the complexities
and inconsistencies in the system. Workers have joined unions in large numbers because
union leaders are identified with high profile campaigns that have had a tangible impact on
living standards.
The unions realise that reforming the minimum wage fixing system in accordance with
Government Regulation 78 of 2015, to make adjustments automatic and in line with past CPI
and GDP movements, will rob them of their most prized organising weapon. Why would any
worker join a trade union if their wages are regularly adjusted according to a mathematical
formula?
That is unless the trade unions have an alternative and equally powerful organising tool. That
tool cannot be enterprise collective bargaining. Given the structure of the economy no union
can adequately service and bargain on behalf of workers in the multitude of micro
enterprises. However, industry level collective bargaining might be feasible in key sectors
and may be sufficiently attractive to tempt the trade union movement to reconsider their
objections to the recent minimum wage reforms. Article 49 of the new wage regulation
concerns sector level “minimum wages”. This Article would appear to provide the necessary
flexibility to at least start a constructive tripartite dialogue about industry level collective
bargaining. It may be feasible to establish, over time, a comprehensive industry level
collective bargaining system in which the trade goods sector is a “pacesetter” for wage
adjustments. In which case there would be a high probability that international
competitiveness would be maintained and there would exist sufficient incentives for

111
employers in the manufacturing sector to reinvest in the capital required to move up the value
chain.
The World Bank has previously proposed a grand bargain of labour reforms. This idea has
merit. In addition to minimum wages and collective bargaining there are a range of other
labour laws and institutions that should be reviewed in a high level tripartite forum. For
example, although reforms to employment protection legislation remain controversial, a
focus on this topic may be desirable. Section 5.4 of this Report has suggested that the
conciliation process required prior to an individual dismissal in Indonesia is unusual by
international standards and time consuming for employers. It was also suggested that the
complex combination of benefits that a dismissed worker is legally entitled to receive ( which
includes severance payments, long service benefits and some additional compensation for
accrued rights) should be reviewed. In so doing two considerations are highly relevant: first,
long service benefits should not be confused with severance payments and should be
available to all workers after a suitable period of tenure; and second, the payments specified
in laws for severance, long service and related benefits are very rarely paid. In the best of
circumstances workers receive a proportion of their legal entitlements. Bring the laws and
actual practice into closer accord through a combination of adjustments to the laws and
improved enforcement would enhance both equity and efficiency.
In Indonesia the rules governing the maximum length and grounds for using fixed term
contacts and the regulations governing the outsourcing of work are very rarely enforced.
This explains the high incidence of nonstandard forms of work. Past attempts to legally
curtail the incidence of fixed term contracts and outsourcing have not been successful. In the
absence of fundamental improvements in the labour inspection system and the labour courts
further tightening of the laws governing non-standard forms of work are unlikely to have any
significant impact. It may therefore make more sense to maintain the existing laws and
gradually improve enforcement, while making an immediate adjustment to the financial
incentives facing entrepreneurs when they make decisions about their labour inputs.
Employers argue that they need the flexibility that non-standard forms of work provide to
meet fluctuations in demand for their output. But it is also evident that workers in a
precarious employment relationship are less likely to join a union or demand their legal
rights. A high concentration of fixed term contracts and outsourcing thus contributes to the
imbalance of power at the workplace. As things stand at the moment, by using a high
proportion of fixed term and outsourced workers, employers have shifted much of the risk
that results from the normal business cycle and other unanticipated fluctuations in demand
from themselves to their workers. There is therefore an argument for adjusting this equation
by requiring employers to compensate workers in precarious situations for the insecurity they
face. For example, consideration might be given to applying a wage premium, of say 15 %, to
all workers who do not enjoy a contract without limit of time. A simple rule like this might
stand a better chance of being enforced then additional complex rules that define either the
length of fixed term contracts or the type of work that can be outsourced.

112
By reducing the financial incentives for an excessive concentration of fixed term contract
work and encouraging longer job tenure, it becomes more economically viable for firms to
invest in skills development. Reforms that would encourage large firms to invest in genuine
long term vocational training programmes that combine on-the- job training with structured
courses in state of the art vocational training facilities would make good sense.
Young employees benefiting from such schemes also need to make a contribution and be
prepared to accept wage rates below those paid to fully qualified trades people. Apprentices
that follow structured training and receive quality mentoring are very likely to improve their
employability and future earning capacity. Therefore participating in such a program can be
seen as an investment in longer term prosperity. But these young workers should not be
treated as slave labour, which is the current trade union perception of apprenticeship and
internship schemes in Indonesia.
Finally, the issue of compliance with minimum wages, social security programmes, and
labour laws needs to be urgently addressed. Indonesia has a very poor record at enforcing the
minimum wage with roughly one in two workers not receiving the wage to which they are
legally entitled. The record with enforcement of other norms and labour laws is equally poor
or worse. Indonesia requires a system of labour inspection and labour courts that are well
resourced and transparent. Greater cooperation between tax and labour law enforcement
would be highly desirable.
Going forward, the Government and social partners in Indonesia need to genuinely accept
that compromises and trade-offs are required to make the labour market more equitable and
efficient. All parties should commit to the adoption of a comprehensive and balanced package
of labour market reforms that will serve the interests of the majority. This package would
include measure to enhance skills, the enforcement of minimum wages and labour rights,
adjustments to employment protection legislation and the pay rates of non-permanent wage
employees, as well as the changes to minimum wage adjustment process and the promotion
of sector level collective bargaining through the provisions contained in Government
Regulation 78 of 2015.

113
List of references
ADB (2015) Asian Development Outlook 2015 Update, Asian Development Bank, Manila.
Aidt, T. and Tzannotas, Z. (2002) Unions and Collective Bargaining - economic effects in a
global environment, World Bank, Washington D.C.
Aidt, T. and Tzannotas, Z. (2008) “Trade unions, collective bargaining and macroeconomic
performance: a review”, Industrial Relations Journal, Vol. 39, Issue 4, July 2008, p.
278.
Allen, E. (2013) Labour and social trends in Indonesia 2013: Reinforcing the role of decent
work in equitable growth, ILO Country Office for Indonesia and Timor-Leste,
Jakarta.
Allen, E. (2015) Labour and social trends in Indonesia 2014-2015: Strengthening
competitiveness and productivity through decent work, ILO Country Office for
Indonesia and Timor-Leste, Jakarta.
Asra A (2000) Poverty and inequality in Indonesia: estimates, decomposition and key issues,
Journal of the Asia Pacific Economy 5(1/2): 91-111.
Aswicahyono, H., H. Hill and D. Narjoko. (2010) Industrialisation after a Deep Economic
Crisis: Indonesia, Journal of Development Studies, 46 (6): 1084–1108.
Aswicahyono, H., Hill, H. and Narjoko, D. (2012) Industrialization: Patterns, issues and
constraints, in Hill, H., Khan, M and Zhuang, J (eds) Diagnosing the Indonesian
economy: Towards inclusive and green growth, Asian Development Bank, Manila.
Aswicahyono, Hill and Narjoko (2011) Indonesian Industrialization: A latecomer adjusting to
crisis, UNU-Wider working paper No 2011/53, World Institute for Development
Economics Research, Helsinki.
Bank Indonesia (2015) Indonesian financial statistics: External sector, Bank Indonesia,
Jakarta
BPJS (2014) Annual Report 2014, Badan Penyelenggara Jaminan Sosial, Jakarta.
BPS (2014) Labour force situation in Indonesia, August 2014, Badan Pusat Statistik, Jakarta.
BPS (2014) Labourer situation in Indonesia: August 2014, Badan Pusat Statistik, Jakarta
BPS (2015) Data sosial ekonomi: November 2015, Badan Pusat Statistik, Jakarta.
BPS (2015) GDP Expenditure Accounts, Badan Pusat Statistik, Jakarta.
BPS (2015) Manufacturing statistics, Badan Pusat Statistik, Jakarta.
BPS (2015) Poverty statistics, Badan Pusat Statistic, Jakarta.
Budiari, I. (2015) Thousands of workers to hold strikes across Greater Jakarta, Jakarta Post,
24/11/2015.
Calmfors L. and Driffill J. (1988) Bargaining structure, corporatism and macroeconomic
performance, Economic Policy, Vol. 6, pp. 13-61.

114
Chen Y (2013) China’s “above warning level” income gap shows inequality. Global Times,
January 19. Retrieved from http://www.globaltimes.cn/content/756786.shtml
Claessens, S. and Djankov S. (2000) The separation of ownership and control in East Asian
corporations, Journal of fnancial economics, Issue 1-2, pages 81-112.
Cobham A and Sumner A (2013) ‘Putting the Gini back in the bottle? “The Palma” as a
policy-relevant measure of Inequality.
https://www.kcl.ac.uk/aboutkings/worldwide/initiatives/global/intdev/people/Sumne
r/Cobham-Sumner-15March2013.pdf.
Driffill, J. "The Centralization of Wage Bargaining Revisited: What Have we Learnt?,"
Journal of Common Market Studies, Wiley Blackwell, Vol. 44, November 2006, pp.
731-756.
Elyda, C. (2015) Workers stage protest against new wage formula, Jakarta Post, 31/10/2015.
ESCAP (2013) The Economic and Social Survey of Asia and the Pacific 2013. Bangkok:
ESCAP.
ESCAP (2014) The Economic and Social Survey of Asia and the Pacific 2014. Bangkok:
ESCAP.
Flanagn, R. J. (1999) Macroeconomic Performance and Collective Bargaining: An
International Perspective, Journal of Economic Literature, Vol. 37, Issue 3, pp.
1150-1195.
Hadiz, V. (1997) Workers and the State in New Order in Indonesia, Routledge, London.
G20 (2012) Labour and Employment Ministers’ Conclusions, Group of Twenty Finance
Ministers and Central Bank Governors, Guadalajara, Mexico, 17-18 May 2012.
G20 (2014) Leaders’ Communiqué, Brisbane Summit, Group of Twenty Finance Ministers
and Central Bank Governors, 15-16 November 2014.
ILO (1970) ILO Convention Number 131 on Minimum wage fixing, International Labour
Organization, Geneva.
ILO (1976) ILO Convention Number 144 on Tripartite Consultation (1976), International
Labour Organization, Geneva.
ILO (2013) Global wage report 2012/13: Wages and equitable growth. Geneva: International
Labour Office.
ILO (2015) Asia Pacific Labour Market Updates, October 2015, ILO Regional Office,
Bangkok.
ILO (2015) Governing Body November 2015, International Labour Organization, Geneva.
ILO (2015) Minimum wages in the global garment industry: Update for 2015, ILO Regional
Office for Asia and the Pacific, Bangkok.

115
ILO (2015) Survey of factory managers in garment and metal sector on Java and in Batam,
ILO Country Office for Indonesia and Timor-Leste, Jakarta (unpublished data).
ILO (Forthcoming) Quality Apprenticeships: Bridging training to productive and Decent
Work, Skills for Employment Policy Brief, International Labour Office, Geneva.
IMF (2015) Economic Outlook, October 2015, International Monetary Fund, Washington
D.C.
ITUC (2015) Indonesia: Minimum Wage Changes Unacceptable, International Trade Union
Confederation, Brussels, 16/10/2015.
Lagarde, C. (2015) Poised for take-off: Unleashing Indonesia’s Economic Potential,
International Monetary Fund, University of Indonesia, Jakarta.
LPEM-FEUI (2014) Investment Climate Monitoring Survey, Institute for Economic and
Social Research, Faculty of Economics, University of Indonesia, Jakarta.
Luebker, M. (2010) Inequality, income shares and poverty: The practical meaning of Gini
coefficients, Travail policy brief no. 3, International Labour Office, Geneva.
Manning, C. (2008) The political economy of reform: labour after Soeharto, University of
Sydney, Sydney.
Ministry of Manpower (2015) Government Regulation 78 of 2015 on Remuneration, Ministry
of Manpower, Jakarta.
Ostry, J., Berg, A., and Tsangarides, C. (2014) Redistribution, inequality and growth,
International Monetary Fund, Washington, D.C.
Palma, J.G. (2011) Homogeneous middles vs. heterogeneous tails, and the end of the
‘inverted-U’: It’s all about the share of the rich, Development and Change, 42(1):
87–153.
Puraka, Y. (2008) Situation of the automotive industry & the role of automotive trade unions
representatives in Indonesia, Friedrich Ebert Stiftung, Indonesia Office, Jakarta.
Quinn, P. (2003) Freedom of Association and Collective Bargaining: A study of Indonesian
experience 1998-2003, International Labour Organization, Geneva.
Republic Indonesia (2000) Act No. 21 of 2000 on Trade Unions, Government of the Republic
of Indonesia, Jakarta.
Republic Indonesia (2003) Act No. 13 of 2003 on Manpower, Government of the Republic of
Indonesia, Jakarta.
Republic Indonesia (2004) Act No. 2 of 2004 on Industrial Relations Dispute Settlement,
Government of the Republic of Indonesia, Jakarta.
Soskice, D. (1999) Wage Determination: The Changing Role of Institutions in Advanced
Industrialized Countries, Oxford review of economic policy Vol. 6, Issue 4, pp. 36-
61;
116
Tadjoeddin, M.Z. (2015) Earnings, productivity and inequality in Indonesia, Economic and
Labour Relations Review, forthcoming.
Tadjoeddin M.Z., Yumna, A., Gultom, S.E., Rakhmadi, M.F., Hidayat, M.F. and Suryahadi,
A. (2015) Inequality and stability in democratic and decentralized Indonesia.
SMERU Working Paper, SMERU Research Institute, Jakarta.
Tadjoeddin, Z. and Auwalin, I. (2015) Wage and productivity at the firm level: A study on
micro, small, medium and large firms in Indonesia’s manufacturing sector, ILO
Country Office for Indonesia and Timor-Leste, Jakarta.
Tjandra, S. and Klaveren, M. (2015) “Indonesia” in Klaveren, M., Gregory, D. and Schulten,
T. (eds) Minimum Wages, Collective Bargaining and Economic Development in
Asia and Europe, Palgrave, London.
Traxler, F. and Kittel, B. (2000) The Bargaining System and Performance: A Comparison of
18 OECD Countries, Comparative Political Studies, Vol. 33, No. 9, pp. 1154-1190.
TUFTS (2014) Better Work Indonesia impact assessment: Managers report, ILO Country
Office for Indonesia and Timor-Leste, Jakarta.
World Bank (1993) The East Asian Miracle: Economic Growth and Public Policy, World
Bank, Washington, DC.
World Bank (2010) Indonesian Jobs Report: Towards Better Jobs and security for All, World
Bank Jakarta.
World Bank (2014) Indonesia Economic Quarterly, March 2014: Investment in flux, World
Bank Country Office for Indonesia, Jakarta.
World Bank (2015) Indonesia economic quarterly, October 2015: In times of global
volatility, World Bank, Jakarta.
World Bank (2015) East Asia and Pacific economic update, October 2015, World Bank,
Washington D.C.
World Bank (2015) Indonesia’s Rising Divide: why inequality is rising, why it matters and
what can be done. Jakarta: World Bank.
World bank (2015) World development indicators, World Bank, Washington D.C.
UN (2012). Addressing inequalities: The heart of the post-2015 agenda and the future we
want for all. Thematic think piece. New York: UN System Task Team on the Post-
2015 UN Development Agenda, United Nations.
UN (2015) Sustainable development goals, United Nations, New York.
Yang L (2013) Gini coefficient release highlights China's resolve to bridge wealth gap.
Xinhuanet, January 21. Retrieved from
http://news.xinhuanet.com/english/china/2013-01/21/c_132116852.htm.
Yusuf AA (2014) Has prosperity been for all? Revisiting the trend of various dimension of
inequality in Indonesia. Jakarta: INFID.

117

118
Annex: Minimum wages by province, 1997-2014
Province 1997 1998 1999 2000 2001 2002 2003 2004 2005 2006 2007 2008 2009 2010 2011 2012 2013 2014
Aceh 115,283 170,482 230,824 307,603 300,000 330,000 425,000 550,000 620,000 820,000 850,000 1,000,000 1,200,000 1,300,000 1,350,000 1,400,000 1,550,000 1,750,000
Sumatera Utara 132,557 194,315 227,675 261,000 340,500 464,000 505,000 537,000 600,000 737,794 761,000 822,205 905,000 965,000 1,035,500 1,200,000 1,375,000 1,505,850
Sumatera Barat 114,372 165,442 203,554 251,712 250,000 385,000 435,000 480,000 540,000 650,000 725,000 800,000 880,000 940,000 1,055,000 1,150,000 1,350,000 1,490,000
Riau 156,893 222,430 235,330 251,000 329,000 394,000 437,500 476,875 551,500 637,000 710,000 800,000 901,600 1,016,000 1,120,000 1,238,000 1,400,000 1,700,000
Jambi 130,180 191,566 242,463 215,463 245,000 304,000 390,000 425,000 485,000 563,000 658,000 724,000 800,000 900,000 1,028,000 1,142,500 1,300,000 1,502,230
Sumatera Selatan 135,626 191,167 239,595 251,575 255,000 331,500 403,500 460,000 503,700 604,000 662,000 743,000 824,730 927,825 1,048,440 1,195,220 1,630,000 1,825,600
Bengkulu 132,377 191,379 194,400 210,162 240,000 295,000 330,000 363,000 430,000 516,000 644,838 690,000 735,000 780,000 815,000 930,000 1,200,000 1,350,000
Lampung 132,395 187,824 190,400 220,500 240,000 310,000 350,000 377,500 405,000 505,000 555,000 617,000 691,000 767,500 855,000 975,000 1,150,000 1,399,037
Kepulauan Bangka Belitung - - - - - 345,000 379,500 447,923 560,000 640,000 720,000 813,000 850,000 910,000 1,024,000 1,110,000 1,265,000 1,640,000
Kepulauan Riau - - - - - - - - 557,000 760,000 805,000 833,000 892,000 925,000 975,000 1,015,000 1,365,087 1,665,000
DKI Jakarta 173,349 254,251 340,630 351,263 426,250 591,266 631,554 671,550 711,843 819,100 900,560 972,604 1,069,865 1,118,009 1,290,000 1,529,150 2,200,000 2,441,000
Jawa Barat 142,695 206,317 242,329 244,475 245,000 280,779 320,000 366,500 408,260 447,654 516,840 568,193 628,191 671,500 732,000 780,000 850,000 1,000,000
Jawa Tengah 123,115 173,776 217,000 235,750 245,000 314,500 340,400 365,000 390,000 450,000 500,000 547,000 575,000 660,000 675,000 765,000 830,000 910,000
DIYogyakarta 119,281 172,767 227,901 227,064 237,500 321,750 360,000 365,000 400,000 460,000 500,000 586,000 700,000 745,694 808,000 892,660 947,114 988,500
Jawa Timur 120,235 172,951 229,055 202,748 220,000 245,000 274,000 310,000 340,000 390,000 448,500 500,000 570,000 630,000 705,000 745,000 866,250 1,000,000
Banten - - - - - 360,000 475,000 515,000 585,000 661,613 746,500 837,000 917,500 955,300 1,000,000 1,042,000 1,170,000 1,325,000
Bali 141,381 204,701 286,075 288,000 309,750 341,000 410,000 425,000 447,500 510,000 622,000 682,650 760,000 829,316 890,000 967,500 1,181,000 1,542,600
Nusa Tenggara Barat 108,654 160,679 192,413 257,150 240,000 320,000 375,000 412,500 475,000 550,000 645,000 730,000 832,500 890,775 950,000 1,000,000 1,100,000 1,210,000
Nusa Tengggara Timur 134,741 186,926 200,707 237,425 275,000 330,000 350,000 400,000 450,000 550,000 600,000 650,000 725,000 800,000 850,000 925,000 1,010,000 1,150,000
Kalimantan Barat 137,618 202,604 257,178 255,707 304,500 380,000 400,000 420,000 445,200 512,000 560,000 645,000 705,000 741,000 802,500 900,000 1,060,000 1,380,000
Kalimantan Tengah 162,202 231,354 283,430 355,442 362,000 362,000 425,000 482,250 523,698 634,260 665,973 765,868 873,089 986,590 1,134,580 1,327,459 1,553,127 1,723,970
Kalimantan Selatan 118,538 175,295 270,000 233,721 295,000 377,500 425,000 482,212 536,300 629,000 745,000 825,000 930,000 1,024,500 1,126,000 1,225,000 1,337,500 1,620,000
KalimantanTimur 162,717 234,278 312,199 317,704 300,000 500,000 540,000 572,652 600,000 701,640 766,500 889,654 955,000 1,002,000 1,084,000 1,177,000 1,752,073 1,886,315
Sulawesi Utara 126,455 182,155 282,144 248,706 372,000 438,000 495,000 545,000 600,000 713,500 750,000 845,000 929,500 1,000,000 1,050,000 1,250,000 1,550,000 1,900,000
Sulawesi Tengah 123,659 181,172 263,291 240,000 245,000 350,000 410,000 450,000 490,000 575,000 615,000 670,000 720,000 777,500 827,500 885,000 995,000 1,250,000
Sulawesi Selatan 129,291 190,083 267,122 257,035 300,000 375,000 415,000 455,000 510,000 612,000 673,200 740,520 905,000 1,000,000 1,100,000 1,200,000 1,440,000 1,800,000
Sulawesi Tenggara 130,644 192,407 260,291 254,250 275,000 325,000 390,000 470,000 498,600 573,400 640,000 700,000 770,000 860,000 930,000 1,032,300 1,125,207 1,400,000
Gorontalo - - - - - 375,000 410,000 430,000 435,000 527,000 560,000 600,000 675,000 710,000 762,500 837,500 1,175,000 1,325,000
Sulawesi Barat - - - - - - - - - 612,000 691,464 760,500 909,400 944,200 1,006,000 1,127,000 1,165,000 1,400,000
Maluku 154,259 223,968 230,000 230,000 230,000 285,000 370,000 450,000 500,000 575,000 635,000 700,000 775,000 840,000 900,000 975,000 1,275,000 1,415,000
Maluku Utara - - - - 230,000 322,000 370,000 400,000 440,000 528,000 660,000 700,000 770,000 847,000 889,350 960,498 1,200,622 1,440,746
Papua Barat - - - - - - - - - 822,500 987,000 1,105,500 1,180,000 1,210,000 1,410,000 1,450,000 1,720,000 1,870,000
Papua 193,789 286,186 237,756 331,579 400,000 530,000 600,000 650,000 700,000 822,500 987,000 1,105,500 1,216,100 1,316,500 1,403,000 1,585,000 1,710,000 2,040,000
Average 141,953 205,112 252,996 265,721 308,460 362,743 414,715 458,499 507,697 602,702 672,480 745,709 841,530 908,824 988,829 1,088,903 1,296,908 1,584,391

119
Annex: Nominal growth rates for minimum wages by province, 1997-2014
Province 1997 1998 1999 2000 2001 2002 2003 2004 2005 2006 2007 2008 2009 2010 2011 2012 2013 2014
Aceh
47.9% 35.4% 33.3% -2.5% 10.0% 28.8% 29.4% 12.7% 32.3% 3.7% 17.6% 20.0% 8.3% 3.8% 3.7% 10.7% 12.9%
Sumatera Utara
46.6% 17.2% 14.6% 30.5% 36.3% 8.8% 6.3% 11.7% 23.0% 3.1% 8.0% 10.1% 6.6% 7.3% 15.9% 14.6% 9.5%
Sumatera Barat
44.7% 23.0% 23.7% -0.7% 54.0% 13.0% 10.3% 12.5% 20.4% 11.5% 10.3% 10.0% 6.8% 12.2% 9.0% 17.4% 10.4%
Riau
41.8% 5.8% 6.7% 31.1% 19.8% 11.0% 9.0% 15.6% 15.5% 11.5% 12.7% 12.7% 12.7% 10.2% 10.5% 13.1% 21.4%
Jambi
47.2% 26.6% -11.1% 13.7% 24.1% 28.3% 9.0% 14.1% 16.1% 16.9% 10.0% 10.5% 12.5% 14.2% 11.1% 13.8% 15.6%
Sumatera Selatan
41.0% 25.3% 5.0% 1.4% 30.0% 21.7% 14.0% 9.5% 19.9% 9.6% 12.2% 11.0% 12.5% 13.0% 14.0% 36.4% 12.0%
Bengkulu
44.6% 1.6% 8.1% 14.2% 22.9% 11.9% 10.0% 18.5% 20.0% 25.0% 7.0% 6.5% 6.1% 4.5% 14.1% 29.0% 12.5%
Lampung
41.9% 1.4% 15.8% 8.8% 29.2% 12.9% 7.9% 7.3% 24.7% 9.9% 11.2% 12.0% 11.1% 11.4% 14.0% 17.9% 21.7%
Kepulauan Bangka Belitung
10.0% 18.0% 25.0% 14.3% 12.5% 12.9% 4.6% 7.1% 12.5% 8.4% 14.0% 29.6%
Kepulauan Riau
36.4% 5.9% 3.5% 7.1% 3.7% 5.4% 4.1% 34.5% 22.0%
DKI Jakarta
46.7% 34.0% 3.1% 21.3% 38.7% 6.8% 6.3% 6.0% 15.1% 9.9% 8.0% 10.0% 4.5% 15.4% 18.5% 43.9% 11.0%
Jawa Barat
44.6% 17.5% 0.9% 0.2% 14.6% 14.0% 14.5% 11.4% 9.6% 15.5% 9.9% 10.6% 6.9% 9.0% 6.6% 9.0% 17.6%
Jawa Tengah
41.1% 24.9% 8.6% 3.9% 28.4% 8.2% 7.2% 6.8% 15.4% 11.1% 9.4% 5.1% 14.8% 2.3% 13.3% 8.5% 9.6%
DIYogyakarta
44.8% 31.9% -0.4% 4.6% 35.5% 11.9% 1.4% 9.6% 15.0% 8.7% 17.2% 19.5% 6.5% 8.4% 10.5% 6.1% 4.4%
Jawa Timur
43.8% 32.4% -11.5% 8.5% 11.4% 11.8% 13.1% 9.7% 14.7% 15.0% 11.5% 14.0% 10.5% 11.9% 5.7% 16.3% 15.4%
Banten
31.9% 8.4% 13.6% 13.1% 12.8% 12.1% 9.6% 4.1% 4.7% 4.2% 12.3% 13.2%
Bali
44.8% 39.8% 0.7% 7.6% 10.1% 20.2% 3.7% 5.3% 14.0% 22.0% 9.8% 11.3% 9.1% 7.3% 8.7% 22.1% 30.6%
Nusa Tenggara Barat
47.9% 19.7% 33.6% -6.7% 33.3% 17.2% 10.0% 15.2% 15.8% 17.3% 13.2% 14.0% 7.0% 6.6% 5.3% 10.0% 10.0%
Nusa Tengggara Timur
38.7% 7.4% 18.3% 15.8% 20.0% 6.1% 14.3% 12.5% 22.2% 9.1% 8.3% 11.5% 10.3% 6.3% 8.8% 9.2% 13.9%
Kalimantan Barat
47.2% 26.9% -0.6% 19.1% 24.8% 5.3% 5.0% 6.0% 15.0% 9.4% 15.2% 9.3% 5.1% 8.3% 12.1% 17.8% 30.2%
Kalimantan Tengah
42.6% 22.5% 25.4% 1.8% 0.0% 17.4% 13.5% 8.6% 21.1% 5.0% 15.0% 14.0% 13.0% 15.0% 17.0% 17.0% 11.0%
Kalimantan Selatan
47.9% 54.0% -13.4% 26.2% 28.0% 12.6% 13.5% 11.2% 17.3% 18.4% 10.7% 12.7% 10.2% 9.9% 8.8% 9.2% 21.1%
KalimantanTimur
44.0% 33.3% 1.8% -5.6% 66.7% 8.0% 6.0% 4.8% 16.9% 9.2% 16.1% 7.3% 4.9% 8.2% 8.6% 48.9% 7.7%
Sulawesi Utara
44.0% 54.9% -11.9% 49.6% 17.7% 13.0% 10.1% 10.1% 18.9% 5.1% 12.7% 10.0% 7.6% 5.0% 19.0% 24.0% 22.6%
Sulawesi Tengah
46.5% 45.3% -8.8% 2.1% 42.9% 17.1% 9.8% 8.9% 17.3% 7.0% 8.9% 7.5% 8.0% 6.4% 6.9% 12.4% 25.6%
Sulawesi Selatan
47.0% 40.5% -3.8% 16.7% 25.0% 10.7% 9.6% 12.1% 20.0% 10.0% 10.0% 22.2% 10.5% 10.0% 9.1% 20.0% 25.0%
Sulawesi Tenggara
47.3% 35.3% -2.3% 8.2% 18.2% 20.0% 20.5% 6.1% 15.0% 11.6% 9.4% 10.0% 11.7% 8.1% 11.0% 9.0% 24.4%
Gorontalo
9.3% 4.9% 1.2% 21.1% 6.3% 7.1% 12.5% 5.2% 7.4% 9.8% 40.3% 12.8%
Sulawesi Barat
13.0% 10.0% 19.6% 3.8% 6.5% 12.0% 3.4% 20.2%
Maluku
45.2% 2.7% 0.0% 0.0% 23.9% 29.8% 21.6% 11.1% 15.0% 10.4% 10.2% 10.7% 8.4% 7.1% 8.3% 30.8% 11.0%
Maluku Utara
40.0% 14.9% 8.1% 10.0% 20.0% 25.0% 6.1% 10.0% 10.0% 5.0% 8.0% 25.0% 20.0%
Papua Barat
20.0% 12.0% 6.7% 2.5% 16.5% 2.8% 18.6% 8.7%
Papua
47.7% -16.9% 39.5% 20.6% 32.5% 13.2% 8.3% 7.7% 17.5% 20.0% 12.0% 10.0% 8.3% 6.6% 13.0% 7.9% 19.3%
Average
44.5% 23.3% 5.0% 16.1% 17.6% 14.3% 10.6% 10.7% 18.7% 11.6% 10.9% 12.8% 8.0% 8.8% 10.1% 19.1% 22.2%

120
Annex II: Freedom of Association Case