effects of interactions among social capital, income and learning from experiences of natural...
TRANSCRIPT
This article was downloaded by: [USM University of Southern Mississippi]On: 12 September 2014, At: 14:38Publisher: RoutledgeInforma Ltd Registered in England and Wales Registered Number: 1072954 Registered office: MortimerHouse, 37-41 Mortimer Street, London W1T 3JH, UK
Regional StudiesPublication details, including instructions for authors and subscription information:http://www.tandfonline.com/loi/cres20
Effects of Interactions among Social Capital, Incomeand Learning from Experiences of Natural Disasters:A Case Study from JapanEiji Yamamura aa Department of Economics , Seinan Gakuin University , 6-2-92 Sawaraku Nishijin,Fukuoka, 814-8511, JapanPublished online: 09 Mar 2010.
To cite this article: Eiji Yamamura (2010) Effects of Interactions among Social Capital, Income and Learningfrom Experiences of Natural Disasters: A Case Study from Japan, Regional Studies, 44:8, 1019-1032, DOI:10.1080/00343400903365144
To link to this article: http://dx.doi.org/10.1080/00343400903365144
PLEASE SCROLL DOWN FOR ARTICLE
Taylor & Francis makes every effort to ensure the accuracy of all the information (the “Content”) containedin the publications on our platform. However, Taylor & Francis, our agents, and our licensors make norepresentations or warranties whatsoever as to the accuracy, completeness, or suitability for any purpose ofthe Content. Any opinions and views expressed in this publication are the opinions and views of the authors,and are not the views of or endorsed by Taylor & Francis. The accuracy of the Content should not be reliedupon and should be independently verified with primary sources of information. Taylor and Francis shallnot be liable for any losses, actions, claims, proceedings, demands, costs, expenses, damages, and otherliabilities whatsoever or howsoever caused arising directly or indirectly in connection with, in relation to orarising out of the use of the Content.
This article may be used for research, teaching, and private study purposes. Any substantial or systematicreproduction, redistribution, reselling, loan, sub-licensing, systematic supply, or distribution in anyform to anyone is expressly forbidden. Terms & Conditions of access and use can be found at http://www.tandfonline.com/page/terms-and-conditions
Effects of Interactions among Social Capital,Income and Learning from Experiences of Natural
Disasters: A Case Study from Japan
EIJI YAMAMURADepartment of Economics, Seinan Gakuin University, 6-2-92 Sawaraku Nishijin Fukuoka 814-8511, Japan.
Email: [email protected]
(Received August 2008: in revised form March 2009)
YAMAMURA E. Effects of interactions among social capital, income and learning from experiences of natural disasters: a case study
from Japan, Regional Studies. This paper explores how and the extent to which social capital has an effect on the damage resulting
from natural disasters. It also examines whether the experience of a natural disaster affects individual and collective protection
against future disasters. There are three major findings. (1) Social capital reduces the damage caused by natural disasters.
(2) The risk of a natural disaster makes people more apt to cooperate and, therefore, social capital is more effective to prevent
disasters. (3) Income is an important factor for reducing damage, but hardly influences it when the scale of a disaster is small.
Social capital Learning Natural disaster
YAMAMURA E. L’effet de l’interaction entre le capital social, le revenu, et l’apprentissage des experiences des desastres naturels:
etude de cas du Japon, Regional Studies. Cet article cherche a examiner comment et jusqu’a quel point le capital social a un
effet sur les degats qui resultent des desastres naturels. On examine aussi si, oui ou non, l’experience d’un desastre naturel
touche la protection individuelle et collective contre les desastres futurs. On en a tire trois conclusions importantes. (1) Le
capital social reduit les degats dus aux desastres naturels. (2) La menace d’un desastre naturel rend les gens plus susceptibles de coop-
erer et, par la suite, le capital social s’avere plus efficace pour empecher les desastres. (3) Le revenu est important pour la reduction
des degats, mais n’est guere important au moment ou l’echelle du desastre est faible.
Capital social Apprentissage Desastre naturel
YAMAMURA E. Die Effekte von Wechselwirkungen zwischen Sozialkapital, Einkommen und Lernen aus den Erfahrungen von
Naturkatastrophen: Eine Fallstudie aus Japan, Regional Studies. In diesem Beitrag wird analysiert, wie und in welchem Ausmaß sich
Sozialkapital auf den Schaden durch Naturkatastrophen auswirkt. Ebenso wird untersucht, ob sich die Erfahrung einer Naturka-
tastrophe auf den individuellen und kollektiven Schutz vor kunftigen Katastrophen auswirkt. Im Wesentlichen gibt es hierbei drei
Ergebnisse. (1) Das Sozialkapital verringert den Schaden durch Naturkatastrophen. (2) Das Risiko einer Naturkatastrophe erhoht
die Bereitschaft zur Zusammenarbeit, weshalb das Sozialkapital starker zur Pravention von Katastrophen beitragen kann. (3) Das
Einkommen stellt einen wichtigen Faktor zur Verringerung von Schaden dar, hat aber kaum einen Einfluss darauf, wenn der
Umfang der Katastrophe gering ausfallt.
Sozialkapital Lernen Naturkatastrophen
YAMAMURA E. Efectos de las interacciones entre el capital social, los ingresos y las lecciones aprendidas de desastres naturales:
estudio del caso de Japon, Regional Studies. En este artıculo analizamos como y en que medida tiene el capital social un efecto
en los danos causados por desastres naturales. Tambien examinados si la experiencia de un desastre natural afecta a la proteccion
individual y colectiva contra futuros desastres. En general, existen tres resultados principales. (1) El capital social reduce el dano
causado por desastres naturales. (2) El riesgo de un desastre natural aumenta la predisposicion de las personas a cooperar y, por
Regional Studies, Vol. 44.8, pp. 1019–1032, October 2010
0034-3404 print/1360-0591 online/10/081019-14 # 2010 Regional Studies Association DOI: 10.1080/00343400903365144http://www.regional-studies-assoc.ac.uk
Dow
nloa
ded
by [
USM
Uni
vers
ity o
f So
uthe
rn M
issi
ssip
pi]
at 1
4:38
12
Sept
embe
r 20
14

tanto, el capital social es mas eficaz para prevenir desastres. (3) Los ingresos representan un factor importante a la hora de reducir los
danos pero apenas influyen cuando la escala de un desastre es pequena.
Capital social Lecciones Desastre natural
JEL classifications: H41, P16, Z13
INTRODUCTION
A growing number of empirical work in the socialsciences, including economics, has attempted to investi-gate issues regarding natural disasters (for example,ALBALA-BERTRAND, 1993; BURTON et al., 1993;GARRET and SOBEL, 2003; and TOL and LEEK, 1999).1
One feature of natural disasters is that they cannot beperfectly forecasted since they are related to variousunderlying causes. This uncertainty obviously increasesthe potential economic risks. Hence, SAWADA andSHIMIZUTANI (2007) explored consumption insuranceagainst natural disasters. Such an exogenous shock islikely to have a tremendous effect on the degree ofinvestment in physical and human capital, therebyaffecting economic growth (SKIDMORE and TOYA,2002).2 Because of these features, humans fail tocontrol for the occurrence of a natural disaster.Recent research, however, provides evidence that thedegree of economic development, captured by thequality of institutions, social heterogeneity, socialcapital, and per-capita income, has an important effecton the outcomes of natural disasters, although itcannot prevent them (for example, ANBARCI et al.,2005; BOLIN, 1982; BURTON et al., 1993; ERIKSON,1994; ESCALERAS et al., 2007; FUKUYAMA, 2001;GROOTAERT, 1998; KAHN, 2005; TOL and LEEK,1999; and TOYA and SKIDMORE, 2007).
Public sector corruption leads contractors to ignore acountry’s building codes and so buildings often fall shortof the appropriate construction standards. This is a reasonwhy public sector corruption is positively associated withearthquake deaths (ESCALERAS et al., 2007). Institutionalquality seems to be reflected in the degree to which acountry is based on democracy. The evidence presentedby KAHN (2005) shows that countries with a moredemocratic political system suffer fewer deaths fromnatural disasters. ANBARCI et al. (2005) suggest thateconomic inequality hampers the collective actionrequired to save lives when a natural disaster occurs. Asa consequence, economic inequality has a detrimentaleffect on mitigating disaster damage. On the otherhand, the present paper focus on the social capital thatis defined herein as ‘a broad term encompassing thenorm and networks facilitating collective action formutual benefit’ (WOOLCOOK, 1998, p. 155). Hence,social capital is likely to promote people to participatein civic life and so take collective action, resulting ineconomic benefit.3 Social capital is found to be moreeasily formed in a society where economic and ethnic
heterogeneity is smaller (ALESINA and LA FERRARA,2000; COSTA and KAHN, 2003; VIGDOR, 2004,YAMAMURA, 2008b).4 As a result, social capital isexpected to mitigate the damage caused by disasters viathe enhancement of collective action. Previous workshave not, however, conducted quantitative analysis toinvestigate the role of social capital in alleviatingdamage from a natural disaster.
Before natural disasters, people with a great amountof relevant information are less likely to suffer seriousdamage than those with less knowledge.5 Reports( JOVANOVIC, 1982; JOVANOVIC and NYARKO, 1996;LUCAS, 1993) note that learning from past experiencepossibly enhances the accumulation of human capital,leading to economic growth. Such a learning mechan-ism is also considered to be applicable to the way inwhich natural disasters are dealt with.6 That is to say,people who have experienced natural disasters canobtain correct information about protecting againstsuch events or getting out of them (ANBARCI et al.,2005; ESCALERAS et al., 2007).7
Experience of disasters appears to be helpful formitigating disaster damage, not only at individual andgovernment levels, but also at the community level.People seem to learn from their experiences of disastersand obtained relevant information about how a com-munity member can take collective action to protectagainst them, and how the degree to which cooperativebehaviour benefits an individual by reducing damage.Therefore, prior information about protection againstdisasters is considered to have an important effect onthe efficacy of social capital to reduce disaster damage.Nevertheless, studies dealing with the determinants ofdamage arising from natural disasters do not pay muchattention to how social capital is associated with thecollective learning effect. The purpose of this paper isto examine the extent to which social capital and theexperience of natural disasters reduce damage. It alsoexamines whether experience leads social capital to bemore effective in mitigating damage. Furthermore,although Japan is a developed country, Japanesesociety remains relatively homogeneous and socialcapital deeply accumulated; therefore, people are moreinclined to take collective action (YAMAMURA,2008b). Such a feature of Japan allows one to test howand the extent to which social capital is effective in adeveloped country. In addition to social capital andlearning, this paper also explores how income level isassociated with damage resulting from natural disasters.
1020 Eiji Yamamura
Dow
nloa
ded
by [
USM
Uni
vers
ity o
f So
uthe
rn M
issi
ssip
pi]
at 1
4:38
12
Sept
embe
r 20
14

This is the degree to which earthquake-resistant build-ings are constructed and the development of anti-earthquake equipment depends on economic conditions.
The paper is organized as follows. The secondsection briefly surveys relationships between socialcapital and natural disasters, and advances a testablehypothesis. The third section presents a simple econo-metric framework. The fourth section discusses theresults of the estimations. The final section offersconcluding observations.
SOCIAL CAPITAL AND NATURAL
DISASTERS
Occurrences of natural disasters are unequally distributedaround the world. As they are over-concentrated insome areas, the importance of disaster measures differsbetween countries. According to the CABINET OFFICE,GOVERNMENT OF JAPAN (2007), 21% of earthquakes ofmagnitude 6 and over occurred in Japan, although Japan’slandmass is only 0.25% of world’s total.8 This impliesthat compared with other countries, Japan should fre-quently suffer earthquake-related natural disasters and,therefore, economic loss resulting from these should berecognizable. Therefore, protection against such damageis considered a central issue of economic policy.
Compared with countries bordered byother countries,Japan’s island condition is a natural limiting factor on theinflow of foreigners and influences from other cultures.9
From an economic point of view, before the rapid econ-omic growth period, there was a sufficiently large labourforce in Japan. Hence, there was no excess of demandrequiring immigrant labour. Therefore, Japanese societycontinues to be relatively homogeneous. The morehomogeneous is a society, the easier it is for collectiveaction to take place, and the more profoundly peopletrust each other (ALESINA and LA FERRARA, 2000,2002). Ethnic and economic fragmentation are reportedto have detrimental effects on damage arising fromnatural disasters, leading to increases in the numbers offatalities (ANBARCI et al., 2005; KAHN, 2005). If this isthe case, it is cogent to examine how Japan, characterizedby a homogeneous society and frequent earthquakes,copes with natural disasters (HORWICH, 2000; SAWADA
and SHIMIZUTANI, 2007).10 That is to say, under con-ditions where the population is racially homogenous,this research allows one to investigate how and theextent to which differences of age and the structure ofwealth have effects on the outcomes of natural disasters.Information about how people and government becomebetter at coping with disasters, an ability that is obtainedthrough experience, is considered to play a critical rolein mitigating the damage arising from a disaster(ANBARCI et al., 2005; ESCALERAS et al., 2007). Anexample is the Kobe earthquake (1995) in Japan:
The earthquake struck a community, almost no member of
which expected it. It has been almost a millennium since an
event of comparative magnitude had occurred in the Kansai
(Kobe–Osaka–Kyoto). Even business and agencies that
had previously drawn up emergency plans were caught by
surprise and were unable to implement them.
(HORWICH, 2000, p. 529)
Under such conditions, local government agencies wereunprepared and so failed to coordinate the inflow ofgoods and services from outside the stricken area(HORWICH, 2000).11 This was in part because of thelack of experience of a natural disaster in Kobe.12
Delays in the initial response by the local governmentsystem were singled out for criticism in the aftermath ofthe Kobe earthquake. On the other hand, much atten-tion was given to the role of informal cooperativeactivity such as voluntary disaster control organizationsin reducing the damage arising from that natural disaster(TIERNEY and GOLTZ, 1997). This is probably becausevoluntary organizations are thought to play importantroles in coordinating collective action to reducedamage.13 An area where people are more inclined toparticipate in voluntary activity is, hence, consideredto have deeply accumulated social capital (PUTNAM,2000).14 There appear to be channels through whichexperiencing disasters affects social capital and therebyinfluences victims of disasters. An area that tends regu-larly to suffer from natural disasters has more inclinationto diffuse information concerning preventive measuresamong its communities; therefore, it reinforces thefunctions of social capital to cope with risk throughcollective learning.15 As a consequence, social capitalplays a greater role in mitigating damage from disastersif community members frequently experience suchdisasters.16 From the above discussion, two hypothesescan be derived:
Hypothesis 1: An area with highly accumulated social
capital has a tendency to have fewer victims of natural
disasters.
Hypothesis 2: Prior experience of a disaster reinforces the
function of social capital through a learning process,
resulting in a reduction in the number of victim.17
DATA AND METHOD
Data and model
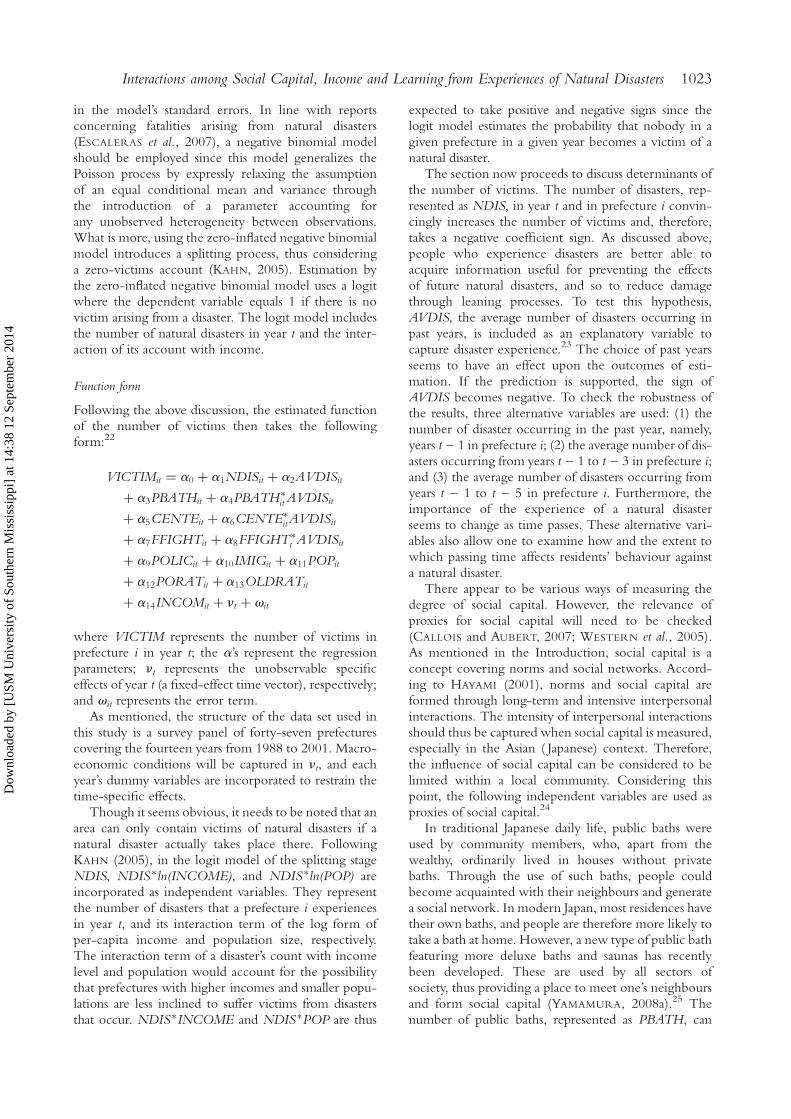
The data set used in this study was a survey panel offorty-seven prefectures covering fourteen years from1988 to 2001. Table 1 includes variable definitions,means, standard deviations, coefficients of variation,and maximums and minimums of analysed data.
The variables are discussed below. The number ofvictims, numbers of natural disasters, per-capitaincome, the number of fire-fighting teams, and thenumber of immigrants were derived from INDEX
CORPORATION (2006).18 Data about the numbers ofnatural disasters used in this research comprised thenumbers of roads, bridges, banks that suffered from
Interactions among Social Capital, Income and Learning from Experiences of Natural Disasters 1021
Dow
nloa
ded
by [
USM
Uni
vers
ity o
f So
uthe
rn M
issi
ssip
pi]
at 1
4:38
12
Sept
embe
r 20
14
disasters, and the numbers of landslides, all of which canbe viewed as outcomes of earthquakes and hurricanes.In this research, under constraints of data limitations, anatural disaster was empirically defined as above.19
Therefore, the magnitude of an earthquake and theintensity of a hurricane were considered to be reflectedin the ‘number of victims’. There is a wide range ofintensities of natural disasters such as earthquakes andhurricanes. For instance, earthquakes occur every day,but most are too weak to be perceived and, therefore,have no impact on people. Accordingly, the author con-fronted a difficulty in counting natural disasters accu-rately. The method of counting seems to affect theresults and so causes an estimation bias. This is thereason why observable outcomes of a ‘natural disaster’were considered to be disasters.20 The total populationnumber and the population subgroup over seventy yearsold, the number of those receiving public assistance, thenumber of policemen, and the numbers of houses,public baths, and community centres were taken fromASAHI NEWSPAPER (2004). Some variables, includingthe numbers of public baths, community centres, andfire-fighting teams were divided by the population toobtain per-capita values. The proportions of elderlyand those receiving public assistance were calculatedfrom the number over seventy years of age, and thenumber receiving public assistance divided by thetotal population number, respectively.
Several reports have investigated fatalities in naturaldisasters (ANBARCI et al., 2005; ESCALERAS et al.,2007; KAHN, 2005); however, these cover only aportion of the victims of disasters and so do notaccurately reflect the full damage caused.21 Thus, thispaper considers all victims as observed at the momentof an event. VICTIM, for which this paper attemptsto examine determinants, is a non-negative count
of victims of natural disasters. As such, a basic, andappropriate, estimation method is the Poisson model.However, a shortcoming of the Poisson model for thisanalysis is its assumption of an equal conditional meanand variance for the dependent variable. That is, to beappropriate in the present case, the Poisson modelrequires the conditional mean of VICTIM to be equalto its variance. As such, the Poisson model is bestapplied in conditions where there is limited variationin the dependent variable. However, Table 1 showsthat maximum and minimum values are 62 085 andzero, respectively, and the standard deviation is 4314,indicating that the variation of the dependent variableis clearly large. In addition, an over-dispersion of thenumber of victims is manifest in Table 2, showingthe percentile rank.
The numbers of victims in the lowest percentile, thetenth, is one, whereas that of the highest is 1645. TakingTable 1 into account, the mean value, 914, is above theeightieth percentile. Hence, careful attention must bepaid to the over-dispersion of dependent variableswhen estimations are conducted. In such a situation,the use of a Poisson process causes a downward bias
Table 2. Distribution of victims
Percentile
10 1
20 5
30 12.7
40 26.6
50 67
60 139
70 266
80 594
90 1645
Table 1. Variable definitions and descriptive statistics
Variable Definition Mean
Standard
deviation
Coefficient
of variation Maximum Minimum
VICTIM Number of victims 914 4314 4.71 62 085 0
NDIS Number of natural disasters 91 262 2.85 4898 0
AVNDIS
(1 year)
Number of disasters during the past year 102 289 2.83 4898 0
AVNDIS
(3 years)
Average number of disasters during the
past three years
103 169 1.63 1708 1
AVNDIS
(5 years)
Average number of disasters during the
past five years
124 270 2.17 3516 1.6
PBATH Per-capita number of public baths 0.21�1023 0.07�1023 0.33 0.49�1023 0.09�1023
CENTE Per-capita number of community centres 0.22�1023 0.17�1023 0.77 0.90�1023 0.07�1023
FFIGHT Per-capita number of fire-fighting teams 0.31�1023 0.14�1023 0.45 0.62�1023 0.04�1023
POLIC Number of policemen 4763 6536 1.37 42 197 1069
IMIG Share of immigrants from other prefecturesa 21�1023 5�1023 0.26 42�1023 10�1023
POP Population numbersa 2648 2393 0.90 11 900 616
PORAT Share of those receiving public assistance 7.45�1023 4.52�1023 0.606 28.6�1023 1.77�1023
OLDRAT Share of the elderly over seventy years of age 0.11 0.02 0.24 0.19 0.05
INCOM Per-capita incomeb 2838 408 0.14 4.813 1.915
Notes: aExpressed in thousands.bExpressed in thousands of yen.
1022 Eiji Yamamura
Dow
nloa
ded
by [
USM
Uni
vers
ity o
f So
uthe
rn M
issi
ssip
pi]
at 1
4:38
12
Sept
embe
r 20
14
in the model’s standard errors. In line with reportsconcerning fatalities arising from natural disasters(ESCALERAS et al., 2007), a negative binomial modelshould be employed since this model generalizes thePoisson process by expressly relaxing the assumptionof an equal conditional mean and variance throughthe introduction of a parameter accounting forany unobserved heterogeneity between observations.What is more, using the zero-inflated negative binomialmodel introduces a splitting process, thus consideringa zero-victims account (KAHN, 2005). Estimation bythe zero-inflated negative binomial model uses a logitwhere the dependent variable equals 1 if there is novictim arising from a disaster. The logit model includesthe number of natural disasters in year t and the inter-action of its account with income.
Function form
Following the above discussion, the estimated functionof the number of victims then takes the followingform:22
VICTIMit ¼ a0 þ a1NDISit þ a2AVDISit
þ a3PBATHit þ a4PBATH�it AVDISit
þ a5CENTEit þ a6CENTE�itAVDISit
þ a7FFIGHTit þ a8FFIGHT�t AVDISit
þ a9POLICit þ a10IMIGit þ a11POPit
þ a12PORATit þ a13OLDRATit
þ a14INCOMit þ nt þ vit
where VICTIM represents the number of victims inprefecture i in year t; the a’s represent the regressionparameters; nt represents the unobservable specificeffects of year t (a fixed-effect time vector), respectively;and vit represents the error term.
As mentioned, the structure of the data set used inthis study is a survey panel of forty-seven prefecturescovering the fourteen years from 1988 to 2001. Macro-economic conditions will be captured in nt, and eachyear’s dummy variables are incorporated to restrain thetime-specific effects.
Though it seems obvious, it needs to be noted that anarea can only contain victims of natural disasters if anatural disaster actually takes place there. FollowingKAHN (2005), in the logit model of the splitting stageNDIS, NDIS�ln(INCOME), and NDIS�ln(POP) areincorporated as independent variables. They representthe number of disasters that a prefecture i experiencesin year t, and its interaction term of the log form ofper-capita income and population size, respectively.The interaction term of a disaster’s count with incomelevel and population would account for the possibilitythat prefectures with higher incomes and smaller popu-lations are less inclined to suffer victims from disastersthat occur. NDIS�INCOME and NDIS�POP are thus
expected to take positive and negative signs since thelogit model estimates the probability that nobody in agiven prefecture in a given year becomes a victim of anatural disaster.
The section now proceeds to discuss determinants ofthe number of victims. The number of disasters, rep-resented as NDIS, in year t and in prefecture i convin-cingly increases the number of victims and, therefore,takes a negative coefficient sign. As discussed above,people who experience disasters are better able toacquire information useful for preventing the effectsof future natural disasters, and so to reduce damagethrough leaning processes. To test this hypothesis,AVDIS, the average number of disasters occurring inpast years, is included as an explanatory variable tocapture disaster experience.23 The choice of past yearsseems to have an effect upon the outcomes of esti-mation. If the prediction is supported, the sign ofAVDIS becomes negative. To check the robustness ofthe results, three alternative variables are used: (1) thenumber of disaster occurring in the past year, namely,years t – 1 in prefecture i; (2) the average number of dis-asters occurring from years t – 1 to t – 3 in prefecture i;and (3) the average number of disasters occurring fromyears t – 1 to t – 5 in prefecture i. Furthermore, theimportance of the experience of a natural disasterseems to change as time passes. These alternative vari-ables also allow one to examine how and the extent towhich passing time affects residents’ behaviour againsta natural disaster.
There appear to be various ways of measuring thedegree of social capital. However, the relevance ofproxies for social capital will need to be checked(CALLOIS and AUBERT, 2007; WESTERN et al., 2005).As mentioned in the Introduction, social capital is aconcept covering norms and social networks. Accord-ing to HAYAMI (2001), norms and social capital areformed through long-term and intensive interpersonalinteractions. The intensity of interpersonal interactionsshould thus be captured when social capital is measured,especially in the Asian ( Japanese) context. Therefore,the influence of social capital can be considered to belimited within a local community. Considering thispoint, the following independent variables are used asproxies of social capital.24
In traditional Japanese daily life, public baths wereused by community members, who, apart from thewealthy, ordinarily lived in houses without privatebaths. Through the use of such baths, people couldbecome acquainted with their neighbours and generatea social network. In modern Japan, most residences havetheir own baths, and people are therefore more likely totake a bath at home. However, a new type of public bathfeaturing more deluxe baths and saunas has recentlybeen developed. These are used by all sectors ofsociety, thus providing a place to meet one’s neighboursand form social capital (YAMAMURA, 2008a).25 Thenumber of public baths, represented as PBATH, can
Interactions among Social Capital, Income and Learning from Experiences of Natural Disasters 1023
Dow
nloa
ded
by [
USM
Uni
vers
ity o
f So
uthe
rn M
issi
ssip
pi]
at 1
4:38
12
Sept
embe
r 20
14

thus serve as a proxy for social capital. Therefore, thesigns of PBATH are predicted to be negative. Peopleare more likely to trust each other and then take collec-tive action if there is a place where they can communi-cate with each other and if the community is wellorganized (PUTNAM, 2000). CENTE, which is thenumber of community centres, is a proxy for socialcapital. Hence, the signs of CENTE are expected tobe negative.
Earthquakes, as one of their results, are likely to entailfires as secondary events. Modern Japanese society isrooted in a system of group responsibility within a com-munity. For instance, the community fire-fightingteam, represented as FFIGHT, originated in the Edo(Tokugawa) period (1603–1868) and continues today(GOTO, 2001). Community fire-fighting teams, infor-mal institutions, are still called for today because ofthe scarcity of public fire-stations, which are regardedas formal institutions, and hence act as substitutes forpublic fire-stations. What is more, these teams play animportant role, not only in deterring fire, but also ingenerating social capital through interpersonal com-munication in a cooperative protective activity againstdisaster (GOTO, 2001). Hence, fire-fighting teams arethought to have an important disaster prevention role.As a consequence, the signs of FFIGHT are expectedto be negative.
As noted above, experience of a natural disaster pro-vides useful information concerning protection againstfuture natural disasters, and then reinforces the functionof social capital to take collective action to mitigatedamage from a disaster. To test this hypothesis, whichis the primary focus of this paper, cross terms betweenproxies of social capital and experience of disastersneed to be checked. That is to say, the signs ofPBATH�AVDIS, CENTE�AVDIS, and FFIGHT�
AVDIS are given careful attention and are predictedto become negative.
Police are considered to be the emergency firstresponder to a natural disaster and, therefore, POLICis expected to take a negative sign.
Frequent movers weaken community ties; therefore,communities with higher rates of residential turnoverare less well integrated. This is why residential mobilitytends to undermine community-based social capital(PUTNAM, 2000), thereby hampering the collectiveaction required to alleviate damage from a disaster.Hence, it is possible that the coefficients of IMIG,which is the number of immigrants from other prefec-tures arriving during the last year, take a positive sign.
The number of victims is expected to becomegreater in areas where a larger number of residentslive if the scale of the natural disaster is of the same mag-nitude. Accordingly, the sign of POP, representing totalpopulation, is predicted to become positive. Lower-income people are more likely to suffer from a naturaldisaster since they appear to live in more humble resi-dences. The proportion of poor people thus increases
the number of victims of disasters. In Japan, individualsliving below a poverty threshold can be in receipt ofpublic assistance so that the proportion of those whoare in receipt of public assistance, which is denoted asPORAT, is regarded to proxy for the poor peoplerate. In addition, it seems reasonable that elderlypeople cannot make a quick response in an emergency,leading them to become victims. OLDRAT, whichstands for the proportion of those over seventy yearsof age, is incorporate to capture such an effect. Accord-ingly, PORAT and OLDRAT will also take a positivesign.
INCOM, representing per-capita income, is used tocapture economic conditions. The number of victims isexpected to become greater in areas where a largernumber of residents live if the scale of the natural disas-ter is of the same magnitude. Areas with higher incomeare convincingly more able to build earthquake-resistantbuildings and provide anti-earthquake equipment.Accordingly, the signs of INCOM are predicted tobecome negative.
RESULTS
Tables 3 and 4 present the results of the zero-inflatednegative binomial estimations. In both tables, columns(1), (4), (7), and (10) show the results when thenumber of disasters occurring in the past year is usedas AVDIS. Columns (2), (5), (8), and (11) show theresults when the average number of disasters occurringin the past three years is used as AVDIS. Columns (3),(6), (9), and (12) show the results when the averagenumber of disasters occurring in the past five years isused as AVDIS. To compare the results properly,values presented in the upper panel are the elasticity,which is evaluated at the sample mean values of thedependent and each independent variable. The resultsof Table 3 were estimated using all samples: 658 obser-vations. As explained above, the zero-inflated negativebinomial model is employed to take into account theeffect of outliers; thus, it seems reasonable to askwhether the outcomes of estimations are at leastsomewhat influenced by outliers. As discussed forTables 1 and 2 in the previous section, the sample isindeed skewed. To take this into account and to checkthe robustness of the outcome presented in Table 4,re-estimations are conducted when samples arerestricted to those under 100 victims and therefore thenumber of observations becomes 356.
Logit estimation
The bottom part of both Tables 3 and 4 report the resultsof the logit model of the splitting stage. The cross term ofNDIS and POP shows a negative sign for the coefficientin all estimations. Furthermore, the results of Tables 3and 4 indicate statistical significance at the 1% level in
1024 Eiji Yamamura
Dow
nloa
ded
by [
USM
Uni
vers
ity o
f So
uthe
rn M
issi
ssip
pi]
at 1
4:38
12
Sept
embe
r 20
14
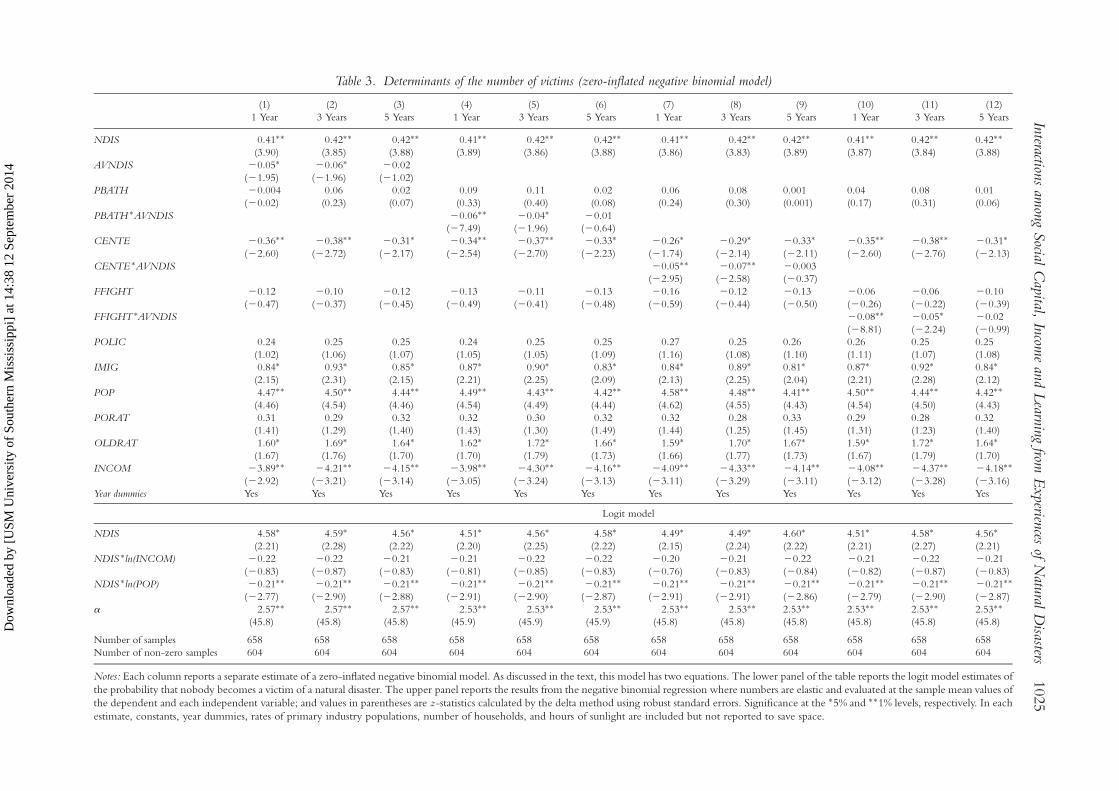
Table 3. Determinants of the number of victims (zero-inflated negative binomial model)
(1) (2) (3) (4) (5) (6) (7) (8) (9) (10) (11) (12)
1 Year 3 Years 5 Years 1 Year 3 Years 5 Years 1 Year 3 Years 5 Years 1 Year 3 Years 5 Years
NDIS 0.41�� 0.42�� 0.42�� 0.41�� 0.42�� 0.42�� 0.41�� 0.42�� 0.42�� 0.41�� 0.42�� 0.42��
(3.90) (3.85) (3.88) (3.89) (3.86) (3.88) (3.86) (3.83) (3.89) (3.87) (3.84) (3.88)
AVNDIS 20.05� 20.06� 20.02
(21.95) (21.96) (21.02)
PBATH 20.004 0.06 0.02 0.09 0.11 0.02 0.06 0.08 0.001 0.04 0.08 0.01
(20.02) (0.23) (0.07) (0.33) (0.40) (0.08) (0.24) (0.30) (0.001) (0.17) (0.31) (0.06)
PBATH �AVNDIS 20.06�� 20.04� 20.01
(27.49) (21.96) (20.64)
CENTE 20.36�� 20.38�� 20.31� 20.34�� 20.37�� 20.33� 20.26� 20.29� 20.33� 20.35�� 20.38�� 20.31�
(22.60) (22.72) (22.17) (22.54) (22.70) (22.23) (21.74) (22.14) (22.11) (22.60) (22.76) (22.13)
CENTE �AVNDIS 20.05�� 20.07�� 20.003
(22.95) (22.58) (20.37)
FFIGHT 20.12 20.10 20.12 20.13 20.11 20.13 20.16 20.12 20.13 20.06 20.06 20.10
(20.47) (20.37) (20.45) (20.49) (20.41) (20.48) (20.59) (20.44) (20.50) (20.26) (20.22) (20.39)
FFIGHT �AVNDIS 20.08�� 20.05� 20.02
(28.81) (22.24) (20.99)
POLIC 0.24 0.25 0.25 0.24 0.25 0.25 0.27 0.25 0.26 0.26 0.25 0.25
(1.02) (1.06) (1.07) (1.05) (1.05) (1.09) (1.16) (1.08) (1.10) (1.11) (1.07) (1.08)
IMIG 0.84� 0.93� 0.85� 0.87� 0.90� 0.83� 0.84� 0.89� 0.81� 0.87� 0.92� 0.84�
(2.15) (2.31) (2.15) (2.21) (2.25) (2.09) (2.13) (2.25) (2.04) (2.21) (2.28) (2.12)
POP 4.47�� 4.50�� 4.44�� 4.49�� 4.43�� 4.42�� 4.58�� 4.48�� 4.41�� 4.50�� 4.44�� 4.42��
(4.46) (4.54) (4.46) (4.54) (4.49) (4.44) (4.62) (4.55) (4.43) (4.54) (4.50) (4.43)
PORAT 0.31 0.29 0.32 0.32 0.30 0.32 0.32 0.28 0.33 0.29 0.28 0.32
(1.41) (1.29) (1.40) (1.43) (1.30) (1.49) (1.44) (1.25) (1.45) (1.31) (1.23) (1.40)
OLDRAT 1.60� 1.69� 1.64� 1.62� 1.72� 1.66� 1.59� 1.70� 1.67� 1.59� 1.72� 1.64�
(1.67) (1.76) (1.70) (1.70) (1.79) (1.73) (1.66) (1.77) (1.73) (1.67) (1.79) (1.70)
INCOM 23.89�� 24.21�� 24.15�� 23.98�� 24.30�� 24.16�� 24.09�� 24.33�� 24.14�� 24.08�� 24.37�� 24.18��
(22.92) (23.21) (23.14) (23.05) (23.24) (23.13) (23.11) (23.29) (23.11) (23.12) (23.28) (23.16)
Year dummies Yes Yes Yes Yes Yes Yes Yes Yes Yes Yes Yes Yes
Logit model
NDIS 4.58� 4.59� 4.56� 4.51� 4.56� 4.58� 4.49� 4.49� 4.60� 4.51� 4.58� 4.56�
(2.21) (2.28) (2.22) (2.20) (2.25) (2.22) (2.15) (2.24) (2.22) (2.21) (2.27) (2.21)
NDIS �ln(INCOM) 20.22 20.22 20.21 20.21 20.22 20.22 20.20 20.21 20.22 20.21 20.22 20.21
(20.83) (20.87) (20.83) (20.81) (20.85) (20.83) (20.76) (20.83) (20.84) (20.82) (20.87) (20.83)
NDIS �ln(POP) 20.21�� 20.21�� 20.21�� 20.21�� 20.21�� 20.21�� 20.21�� 20.21�� 20.21�� 20.21�� 20.21�� 20.21��
(22.77) (22.90) (22.88) (22.91) (22.90) (22.87) (22.91) (22.91) (22.86) (22.79) (22.90) (22.87)
a 2.57�� 2.57�� 2.57�� 2.53�� 2.53�� 2.53�� 2.53�� 2.53�� 2.53�� 2.53�� 2.53�� 2.53��
(45.8) (45.8) (45.8) (45.9) (45.9) (45.9) (45.8) (45.8) (45.8) (45.8) (45.8) (45.8)
Number of samples 658 658 658 658 658 658 658 658 658 658 658 658
Number of non-zero samples 604 604 604 604 604 604 604 604 604 604 604 604
Notes: Each column reports a separate estimate of a zero-inflated negative binomial model. As discussed in the text, this model has two equations. The lower panel of the table reports the logit model estimates of
the probability that nobody becomes a victim of a natural disaster. The upper panel reports the results from the negative binomial regression where numbers are elastic and evaluated at the sample mean values of
the dependent and each independent variable; and values in parentheses are z-statistics calculated by the delta method using robust standard errors. Significance at the �5% and ��1% levels, respectively. In each
estimate, constants, year dummies, rates of primary industry populations, number of households, and hours of sunlight are included but not reported to save space.
Interaction
sam
ong
Social
Capital,
Incom
ean
dL
earnin
gfrom
Experien
cesof
Natu
ralD
isasters1025
Dow
nloa
ded
by [
USM
Uni
vers
ity o
f So
uthe
rn M
issi
ssip
pi]
at 1
4:38
12
Sept
embe
r 20
14
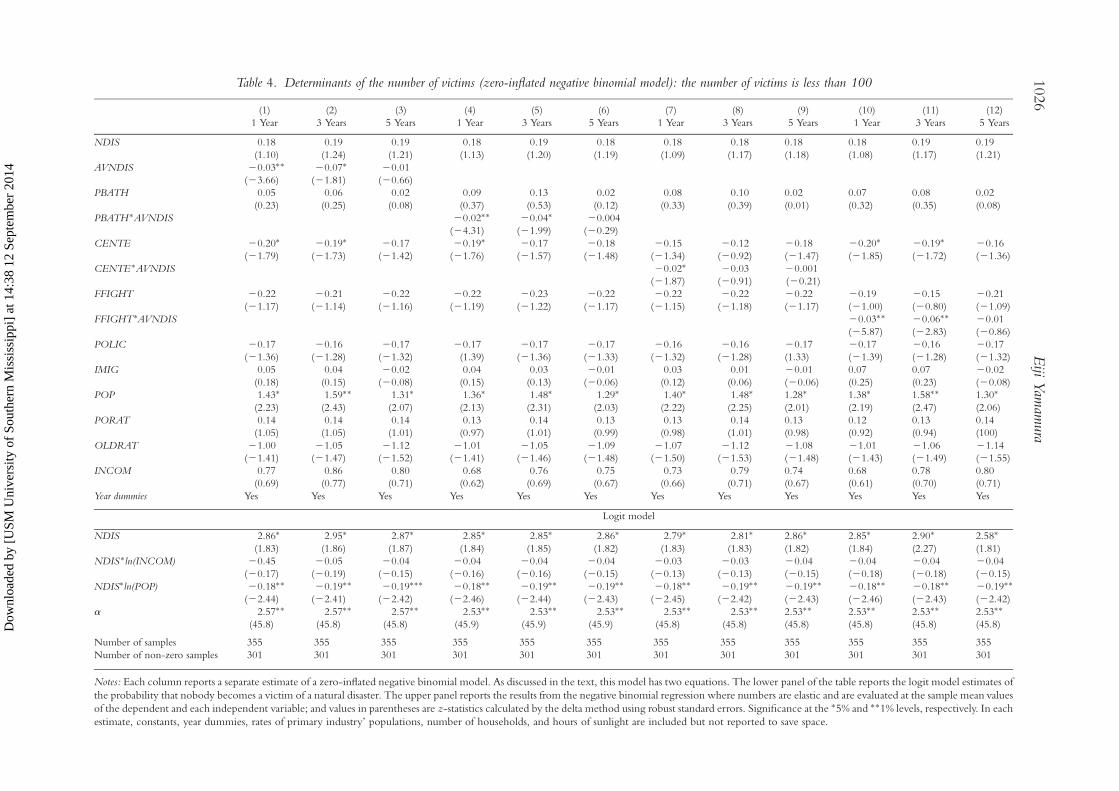
Table 4. Determinants of the number of victims (zero-inflated negative binomial model): the number of victims is less than 100
(1) (2) (3) (4) (5) (6) (7) (8) (9) (10) (11) (12)
1 Year 3 Years 5 Years 1 Year 3 Years 5 Years 1 Year 3 Years 5 Years 1 Year 3 Years 5 Years
NDIS 0.18 0.19 0.19 0.18 0.19 0.18 0.18 0.18 0.18 0.18 0.19 0.19
(1.10) (1.24) (1.21) (1.13) (1.20) (1.19) (1.09) (1.17) (1.18) (1.08) (1.17) (1.21)
AVNDIS 20.03�� 20.07� 20.01
(23.66) (21.81) (20.66)
PBATH 0.05 0.06 0.02 0.09 0.13 0.02 0.08 0.10 0.02 0.07 0.08 0.02
(0.23) (0.25) (0.08) (0.37) (0.53) (0.12) (0.33) (0.39) (0.01) (0.32) (0.35) (0.08)
PBATH�AVNDIS 20.02�� 20.04� 20.004
(24.31) (21.99) (20.29)
CENTE 20.20� 20.19� 20.17 20.19� 20.17 20.18 20.15 20.12 20.18 20.20� 20.19� 20.16
(21.79) (21.73) (21.42) (21.76) (21.57) (21.48) (21.34) (20.92) (21.47) (21.85) (21.72) (21.36)
CENTE�AVNDIS 20.02� 20.03 20.001
(21.87) (20.91) (20.21)
FFIGHT 20.22 20.21 20.22 20.22 20.23 20.22 20.22 20.22 20.22 20.19 20.15 20.21
(21.17) (21.14) (21.16) (21.19) (21.22) (21.17) (21.15) (21.18) (21.17) (21.00) (20.80) (21.09)
FFIGHT�AVNDIS 20.03�� 20.06�� 20.01
(25.87) (22.83) (20.86)
POLIC 20.17 20.16 20.17 20.17 20.17 20.17 20.16 20.16 20.17 20.17 20.16 20.17
(21.36) (21.28) (21.32) (1.39) (21.36) (21.33) (21.32) (21.28) (1.33) (21.39) (21.28) (21.32)
IMIG 0.05 0.04 20.02 0.04 0.03 20.01 0.03 0.01 20.01 0.07 0.07 20.02
(0.18) (0.15) (20.08) (0.15) (0.13) (20.06) (0.12) (0.06) (20.06) (0.25) (0.23) (20.08)
POP 1.43� 1.59�� 1.31� 1.36� 1.48� 1.29� 1.40� 1.48� 1.28� 1.38� 1.58�� 1.30�
(2.23) (2.43) (2.07) (2.13) (2.31) (2.03) (2.22) (2.25) (2.01) (2.19) (2.47) (2.06)
PORAT 0.14 0.14 0.14 0.13 0.14 0.13 0.13 0.14 0.13 0.12 0.13 0.14
(1.05) (1.05) (1.01) (0.97) (1.01) (0.99) (0.98) (1.01) (0.98) (0.92) (0.94) (100)
OLDRAT 21.00 21.05 21.12 21.01 21.05 21.09 21.07 21.12 21.08 21.01 21.06 21.14
(21.41) (21.47) (21.52) (21.41) (21.46) (21.48) (21.50) (21.53) (21.48) (21.43) (21.49) (21.55)
INCOM 0.77 0.86 0.80 0.68 0.76 0.75 0.73 0.79 0.74 0.68 0.78 0.80
(0.69) (0.77) (0.71) (0.62) (0.69) (0.67) (0.66) (0.71) (0.67) (0.61) (0.70) (0.71)
Year dummies Yes Yes Yes Yes Yes Yes Yes Yes Yes Yes Yes Yes
Logit model
NDIS 2.86� 2.95� 2.87� 2.85� 2.85� 2.86� 2.79� 2.81� 2.86� 2.85� 2.90� 2.58�
(1.83) (1.86) (1.87) (1.84) (1.85) (1.82) (1.83) (1.83) (1.82) (1.84) (2.27) (1.81)
NDIS�ln(INCOM) 20.45 20.05 20.04 20.04 20.04 20.04 20.03 20.03 20.04 20.04 20.04 20.04
(20.17) (20.19) (20.15) (20.16) (20.16) (20.15) (20.13) (20.13) (20.15) (20.18) (20.18) (20.15)
NDIS�ln(POP) 20.18�� 20.19�� 20.19��� 20.18�� 20.19�� 20.19�� 20.18�� 20.19�� 20.19�� 20.18�� 20.18�� 20.19��
(22.44) (22.41) (22.42) (22.46) (22.44) (22.43) (22.45) (22.42) (22.43) (22.46) (22.43) (22.42)
a 2.57�� 2.57�� 2.57�� 2.53�� 2.53�� 2.53�� 2.53�� 2.53�� 2.53�� 2.53�� 2.53�� 2.53��
(45.8) (45.8) (45.8) (45.9) (45.9) (45.9) (45.8) (45.8) (45.8) (45.8) (45.8) (45.8)
Number of samples 355 355 355 355 355 355 355 355 355 355 355 355
Number of non-zero samples 301 301 301 301 301 301 301 301 301 301 301 301
Notes: Each column reports a separate estimate of a zero-inflated negative binomial model. As discussed in the text, this model has two equations. The lower panel of the table reports the logit model estimates of
the probability that nobody becomes a victim of a natural disaster. The upper panel reports the results from the negative binomial regression where numbers are elastic and are evaluated at the sample mean values
of the dependent and each independent variable; and values in parentheses are z-statistics calculated by the delta method using robust standard errors. Significance at the �5% and ��1% levels, respectively. In each
estimate, constants, year dummies, rates of primary industry’ populations, number of households, and hours of sunlight are included but not reported to save space.
1026
Eiji
Yam
amura
Dow
nloa
ded
by [
USM
Uni
vers
ity o
f So
uthe
rn M
issi
ssip
pi]
at 1
4:38
12
Sept
embe
r 20
14

all estimations. Although contrary to the prediction, thesigns of the cross terms of NDIS and INCOM becomenegative, but are not statistically significant in all esti-mations. Overall, these results are consistent with theprediction that larger population areas are more likelyto have victims when a disaster occurs.
Estimation results using all samples
This sub-section now discusses the results of thenegative binomial model after the splitting stage inTable 3. The significant positive signs of NDIS in allestimations of Table 3 are compatible with the predic-tion. With respect to AVDIS, all results show negativesigns. As shown in the second row of columns (1) and(2), the fact that AVDIS is statistically significant,reveals that the learning effect makes a contribution todecreasing the number of victims. Nevertheless,column (3) is insignificant statistically, and its absolutevalue of 0.02 is remarkably smaller than those of (1)and (2). It follows from this that past experiencereduces victim numbers, but its effect diminishes astime passes.
With respect to the proxies for social capital, incolumns (1), (2), and (3), CENTE, PBATH, andFFIGHT take the anticipated negative sign ofCENTE. In particular, CENTE is significant at the1% level. This indicates that social capital alleviatesdamage from disasters. Any insignificance of PBATHand FFIGHT are likely to be driven by potentialshortcomings such as the skewness of the samplecaused by outliers.26 To investigate the learningeffect through the experience of a disaster on theeffectiveness of social capital, the results of the crossterm of AVNDIS are checked with proxies of socialcapital such as PBATH �AVNDIS, CENTE �AVNDIS,and FFIGHT �AVNDIS. As predicted previously, in allthe interaction terms, their signs become negative.They become statistically significant when pastexperience is measured by the number of disastersoccurring in the past year and in the past three years,but they become insignificant in the case using thenumbers in the past five years. Furthermore, as shownin column (6), the absolute value of PBATH �AVDIS,
which is 0.01 for both, is distinctly smaller than incolumns (4) and (5), which are 0.06 and 0.04,respectively. The same tendency is observed concerningCENTE �AVDIS in columns (7), (8), and (9), andFFIGHT �AVDIS in columns (10), (11), and (12),indicating that the absolute values when AVDIS iscalculated by the natural disasters in the past five yearsare by far smaller than the other values. Restrictingattention to the results in the case that AVNDIS is cal-culated by data from the past year and the past threeyears, the absolute values of AVDIS and its interactionterms are between 0.04 and 0.08, indicating that theirelasticity is relatively modest. In line with the predic-tion, these results imply that the experience of a disaster
accumulates the human capital necessary to protectagainst a future one; this then reinforces the functionof social capital to coordinate collective action when adisaster occurs. Nevertheless, such an interactioneffect has a tendency to disappear as time passes.
Contrary to the prediction, the signs of POLICbecome positive, though insignificant, meaning thatthe police did not make a contribution to a reductionin the number of victims. In all estimations, the signifi-cant negative signs of IMIG suggested that a decay ofsocial capital causes impediments to the success of col-lective action, thereby increasing the number of victims.
Consistent with the prediction, in all estimationsPOP takes significant predicted signs and its values arelarger than 4. Also, PORAT and OLDRAT take theiranticipated signs, although PORAT is not significant,indicating that poor and old individuals are moreinclined to suffer from disasters. INCOM take theirsignificant predicted signs and their values are largerthan 3. From this the fact that the economic conditiontremendously affects the number of victims can bederived, especially the fact that if income rises by 1%,the number of victims decreases by about 4%. Thisreflects the fact that areas with higher incomes can toa large extent afford to protect against disasters.
Estimation results with the victims restriction
The determinants of the number of victims appear todepend on the magnitude of the disaster, while theskewness of the sample seems to influence the results,as argued by ESCALERAS et al. (2007). For a closerexamination taking these issues into account, theauthor re-estimated using the same model, but one inwhich samples were restricted to a number of victimsless than 100.27 These results are shown in Table 4.Looking at columns (1) and (2) reveals, as regardsAVNDIS, and as reported in the second row, significantnegative signs and the value of the coefficient. Column(3) suggests insignificance and a smaller value. Turningto the effects of social capital as captured by PBATH,CENTE, and FFIGHT, with the exception ofPBATH, the coefficient signs become negative. Theseresults are almost the same when all samples are used,as discussed above. It follows from the results discussedso far that not only a learning effect, but also socialcapital are negatively associated with the number ofvictims resulting from natural disasters.
Switching attention to columns (4)–(12), where thecross terms of disaster experience and social capitalare reported, this sub-section now examines how thelearning effect reinforces social capital. Consistentwith the prediction, all signs of PBATH �AVNDIS,CENTE �AVNDIS, and FFIGHT�AVNDIS are nega-tive, and are equivalent to those presented in Table 3.In terms of the absolute values of the coefficientsshown in columns (4), (5), (7), (8), (10), and (11),AVDIS and its interaction terms are between 0.02 and
Interactions among Social Capital, Income and Learning from Experiences of Natural Disasters 1027
Dow
nloa
ded
by [
USM
Uni
vers
ity o
f So
uthe
rn M
issi
ssip
pi]
at 1
4:38
12
Sept
embe
r 20
14
0.06, suggesting they are almost at the same level asshown in Table 3. On the other hand, when AVNDIScalculated using data from the past five years was used,they are not statistically significant and the absolutevalues become pronouncedly smaller. Taken together,the impacts on disaster damage of learning, socialcapital, and their interaction do not disappear, evenwhen the scale of natural disasters is small, so long asthe focus is on disaster experiences limited to thosewithin a few years. Put another way, these effects arestable regardless of which samples are used and so arenot affected by the scale of a disaster. Hence, the esti-mation results concerning Hypotheses 1 and 2 arerobust under the different samples, indicating thatHypotheses 1 and 2 are strongly supported. Nevertheless,it is very interesting to observe that these effects diminishstrikingly when one takes more distant past events intoaccount. According to the CABINET OFFICE, GOVERN-
MENT OF JAPAN (2007), people in Japan are likely to takemeasures to cope with a natural disaster immediately afterthey experience a disaster, but cease doing so as timepasses. From this, the argument is derived that the pre-cautions against the risk of a disaster surge as anoutcome of a disaster experience, but then graduallydecrease over time. The findings presented thus far areconsidered to reflect the feature of human behaviourpointed out by the CABINET OFFICE, GOVERNMENT
OF JAPAN (2007).The author found it interesting that the coefficients
of INCOM shown in Table 4, contrary to expectations,take positive signs in all columns. Accordingly, withrespect to the per-capita income, there is remarkabledifference from those reported in Table 3 showing nega-tive significant signs. What is more, the coefficientvalues for INCOM are smaller than 1.00, far smallerthan those shown in Table 3. This was derived fromthe fact that economic conditions are not associatedwith disaster damage when disasters are small in scale.Combining the estimation results shown in Tables 3and 4 indicates that the effects of economic conditionson disaster damage are affected by the restriction ofsamples. The fact that higher incomes are more likelyto reduce the number of victims does not persistwhen samples are restricted to a small number ofvictims. These results are interpreted as follows.According to the theoretical model developed byANBARCI et al. (2005), the per-capita level of incomeincreases the provability of collective action in theform of the creation and enforcement of buildingcodes, appropriate professional licensing, and earth-quake-sensitive zoning.28 That is, areas where incomeis at a high level have a greater ability to cope withnatural disasters, mainly through the intensification ofphysical structures such as the provision of earth-quake-resistant buildings, fire-proof buildings, and/orfire-prevention equipment. Such measures seem to beeffective in alleviating the damage when inordinate-scale disasters strike buildings. In the case where the
magnitude of a disaster is, however, too modest todamage the physical structure, economic conditionssuch as per-capita income do not affect outcomes.
To sum the evidence presented so far; factors concern-ing disaster experience and social capital for reducing dis-aster damage persist even with the different samples.29
However, per-capita income has tremendous effects onany resulting damage, though this relationship disappearsbecause of the restriction of the samples. The evidencegiven above seems to indicate that informal cooperativeactivity promoted through the accumulation of socialcapital plays an important role in alleviating disasterdamage, especially in cases where the disaster is not of alarge scale, being one in which economic factors canmake no contribution to the reduction of damage.
CONCLUSION
It is impossible to control the occurrences of naturaldisasters, but it is possible to alleviate damage to someextent. An example is taking protective action against afuture natural disaster; indeed, this is an area where localgovernment is expected to assume an important rolein coping with disasters. Nevertheless, the case of theKobe earthquake in Japan shows what can go wrong; inthat event, the initial response system of the local govern-ment organs was delayed and, indeed, malfunctioned,whereas informal cooperative activity such as voluntarydisaster control organizations responded promptly, result-ing in a reduction of the damage arising from this naturaldisaster. To reduce damage, collective action is called forand voluntary organizations are important. Therefore,informal organizations are likely to decrease damagethrough their collective action in areas where there ishigh social cohesion and, therefore, people are moreinclined to participate in voluntary activities.
Through experiencing a natural disaster, individualsmay learn how to deal with a future natural disaster.In addition, this experience is apt to change the attitudeof individuals regarding disasters. As larger amounts ofinformation concerning natural disasters are obtained,individuals are more likely to perceive latent damageresulting from a lack of appropriate measures, and there-fore take steps to cope.
The main aim of this paper has been to examine howand to what extent the experience of a natural disaster,social capital, and their interaction are related withdamage resulting from natural disasters measured bythe number of victims. To this end, using prefecture-level data for Japan for the years between 1988 and2001, this paper ascertained the determinants of thenumber of victims of natural disasters. The majorfindings from this study were as follows. (1) Socialcapital reduces damage resulting from natural disasters.(2) Abundant information concerning natural disastersobtained through past experiences makes people moreapt to cooperate and, therefore, social capital becomes
1028 Eiji Yamamura
Dow
nloa
ded
by [
USM
Uni
vers
ity o
f So
uthe
rn M
issi
ssip
pi]
at 1
4:38
12
Sept
embe
r 20
14
more effective to prevent disasters. Nevertheless, itbecomes less effective as time passes after the experienceof a disaster. (3) A high level of income makes muchmore of a contribution than social capital to a reductionin the number of victims; nevertheless, the level ofincome hardly affects the number of victims insmall-scale disasters, hence social capital makes agreater contribution in this situation.
From the estimations here, the author made anargument that, in general, physical equipment andinfrastructure against disasters are more effective thancooperative behaviour, namely collective action,among people. By contrast, cooperative behaviourbecomes relatively more effective in small-scale disas-ters. What is more, thanks to a spillover of informationabout natural disasters, cooperative behaviour isthought to be more easily organized, thereby reducingthe damage resulting from such a disaster. The positiveeffect of the disaster experience on cooperative behav-iour deteriorates as time passes after people experiencea disaster because people decrease their precautionsagainst a future disaster. It follows from this that a gov-ernment should not only provide physical equipment,but also should make efforts to transmit more infor-mation about natural disasters to stimulate andpromote collective action by its citizens against disaster.
This study uses aggregated-level data at a prefecturelevel and so individual responses to natural disasterscannot be considered. Further, it considers the experi-ence of suffering disasters to be a proxy for the quantityof information about disasters obtained by people. Thisassumption, however, may not be sufficiently convin-cing. Accordingly, a more appropriate measure for theinformation acquired by people before disaster iscalled for. In addition, this paper did not capture theinfluence of the experience of disaster on improvementsof infrastructure and policy. For a better understandingof the findings in this paper, more purposefully con-structed individual-level data need to be obtained andthe various latent effects of the disaster experienceshould be controlled for. These are issues remaining tobe addressed in a future study.
Acknowledgements – The author benefited from the
useful comments by two anonymous referees on an earlier
version of the paper.
NOTES
1. In addition, a growing number of reports on Hurricane
Katrina (2005) have been published (for example,
CONGLETON, 2006; SHUGHART, 2006; SOBEL and
LEESON, 2006; EWING et al., 2007; LANDRY et al.,
2007; CHAPPELL et al., 2007; BOETTKE et al., 2007;
WHITT and WILSON, 2007; and ECKEL et al., 2007).
2. A natural disaster can be considered as an exogenous
shock since it is impossible to predict exactly the date
and place of its occurrence. Nevertheless, the extent of
damage from a natural disaster would be a function of
physical equipment and the prior attitude of residents
towards natural disasters.
3. A number of reports have attempted to investigate social
capital in modern society (for example, KNACK and
KEEFER, 1997; PUTNAM, 2000; O’BRIEN et al., 2005;
WESTERN et al., 2005; BERGGREN and JORDAHL,
2006; MILES and TULLY, 2007; and BIRCH and
WHITTAM, 2008).
4. Generalized trust profoundly associated with social
capital also depends on the features of the social structure
(LEIGH, 2006a, 2006b; BJØRNSKOV, 2006).
5. DYNES (2002) pointed out:
the reason people do not make an effort is because
they are unaware of the threat or because they lack
good information (knowledge) about the risks.
This, increasing awareness and information will
result in appropriate mitigative behavior.
(p. 38)
6. This paper mainly restricts its attention to the prior
attitude towards disaster; that is, preparation for a
natural disaster. However, it is also important to investi-
gate how a community recovers from disaster (BOLIN
and STANFORD, 1998; KANIASTY and NORRIS, 1995).
7. It should be noted that there is a possibility that experi-
ence of natural disasters has a detrimental effect on
resilience since those who have successfully weathered
an event do not feel they need to evacuate when faced
with another such one.
8. Japan incurred 13% of the total amount of damage resulting
from natural disasters worldwide during the past thirty years
(CABINET OFFICE, GOVERNMENT OF JAPAN, 2007).
9. YAMAMURA (2008b) indicated that the Hirfindahl-type
index used for the ethnic fragmentation of Japan is 0.02.
As suggested by ALESINA et al. (2003), the value of Japan
is smaller not only than that of the United States (0.49),
but also the United Kingdom (0.12) characterized by
the same island geography as Japan. A historical
feature of Japan that illustrates an important difference
from the UK should be considered to explain how the
homogeneous Japanese character was formed. It is
widely understood that between 1641 and 1858, the
rulers of Japan during the Edo (Tokugawa) period
adopted a closed-door policy (SUGIYAMA, 1987). The
policy of seclusion was initiated as a response to the
perceived threat posed by Christian coverts in Japan.
Such a policy, aided by Japan’s island geography, is
thought to have formed the fundamental homogeneous
feature of Japanese society, which has persisted even
after Japan opened up to world trade and to inter-
national exchanges.
10. In Japan, social capital enhances learning from others
such as from the diffusion of home computers
(YAMAMURA, 2008a), makes a contribution to collective
action such as responses to the Census (YAMAMURA,
2008b), and acts as informal deterrents against danger-
ously driving (YAMAMURA, 2008c).
11. Although governments and many businesses have been
ill-prepared for the disasters befalling them, it seems
that there is a limit to how prepared they can be in
Interactions among Social Capital, Income and Learning from Experiences of Natural Disasters 1029
Dow
nloa
ded
by [
USM
Uni
vers
ity o
f So
uthe
rn M
issi
ssip
pi]
at 1
4:38
12
Sept
embe
r 20
14
the face of an immense disaster, such as the Kobe
earthquake.
12. During the period of recovery from the Kobe earth-
quake, the city’s fire department built a new observation
and control centre, and its emergency management
process has been reorganized and enlarged (HORWICH,
2000).
13. After the Kobe earthquake, the creation of informal
support systems against disasters was considered
important (SHAW and GODA, 2004). Recently, a social
network service (SNS) was tested by the Japanese gov-
ernment with the aim of improving community building
and disaster management (SCHELLONG, 2007).
14. PUTNAM (2000) points out that social capital has not only
a positive effect, but also a detrimental one upon human
behaviour. DURLAUF (1999) asserts that social capital
facilitates intra-group coordination by enhancing group
identity, which, in turn, may promote inter-group hosti-
lity. PELLING (1998) found in a case study of Guyana that
marginalized groups continued to be excluded from local
participatory decision-making in environmental
management.
15. It also seemed reasonable that people could learn about
disaster-reduction measures from websites. If this were
the case, knowledge is not likely to increase social
capital. Hence, any link between previous knowledge
and social capital calls for careful attention.
16. It is also likely that social capital will make a community
more resilient; that is, the community is more likely to
recover quickly from a disaster. When Hurricane
Katrina occurred, the Catholic Church in New Orleans
helped organize crews of returning residents to assist
one another repairing homes (BOETTKE et al., 2007).
17. It should be noted that, besides the effects of social
capital, the experience of a disaster would have effects
on the damage from another natural disaster through
various channels. For instance, the disaster experience
might lead to better infrastructure and better state
policies, both of which are related to learning, but not
necessary to social capital.
18. Victims are defined here as injured persons who need
medical care.
19. It should be noted that whether or not an earthquake is a
disaster generally depends on the extent to which daily
life was disrupted and the damage. The ‘empirical’ defi-
nition in this paper is different.
20. The number of intense hurricanes and earthquakes
can be obtained from NATIONAL ASTRONOMICAL
OBSERVATORY JAPAN (2006). Similar results were pro-
vided when these data are used.
21. TOYA and SKIDMORE (2007) explored not only fatalities,
but also the index of economic damage measured by the
estimated damage in real US dollars when disasters
occurred.
22. Values of coefficients can be interpreted as the elasticity
of the number of victims with respect to the correspond-
ing independent variables, which are evaluated at the
sample mean values of the variables.
23. The CABINET OFFICE, GOVERNMENT OF JAPAN (2007)
reports that the past experience of disasters encourages
people to take precautions against future disasters,
whereas the effect of experience on cautious behaviour
diminishes as time passes. Therefore, this paper restricts
past experiences to those within three years.
24. The existing literature mainly concerns Western
countries; variables such as newspaper reading, volunteer
activity, and voter turnout are considered to capture
social capital. They also seem appropriate as surrogate
social capital in Japan (YAMAMURA, 2009); however,
these variables are not available for every year.
Therefore, they cannot be incorporated in this paper
since the data set used herein is a panel structure that
requires annual data.
25. It should be noted that users of bathhouses are not likely
to be evenly distributed across social classes.
26. Another possible reason for their unpredictability can be
found in the argument of LEDERMAN et al. (2002), that
the indicators of social capital they defined reflect both
group-specific and society-wide social capital, which
are expected to promote and reduce collective action,
respectively. Therefore, these opposite effects neutralize
each other.
27. While the estimation results shown in Table 3 are based
on the zero-inflated negative binomial model designed
to take into account the effect of outliers, it seems reason-
able to question whether the outliers matter since the
sample is skewed as mentioned previously.
28. The collective action required here is different from that
required for informal voluntary activity promoted by
social capital.
29. Various factors, such as policy-making and investment for
physical equipment, which are not considered in this
research, are, however, thought to have made a contri-
bution to the results. Thus, care is needed in interpreting
these results and the findings observed in this study will
require future scrutiny.
REFERENCES
ALBALA-BERTRAND J. (1993) Political Economy of Large Natural Disasters. Oxford University Press, New York, NY.
ALESINA A., DEVLEESCHAUWER A., KURLAT S. and WACZIAG R. (2003) Fractionalization, Journal of Economic Growth 8, 155–194.
ALESINA A. and LA FERRARA E. (2000) Participation in heterogeneous communities, Quarterly Journal of Economics 115, 847–904.
ALESINA A. and LA FERRARA E. (2002) Who trust others?, Journal of Public Economics 85, 207–234.
ANBARCI N., ESCALERAS M. and REGISTER C. (2005) Earthquake fatalities: the interaction of nature and political economy, Journal
of Public Economics 89, 1907–1933.
ASAHI NEWSPAPER (2004) Minryoku: Todofuken-betsu Minryoku Sokutei Shiryoshu [CD-ROM Edn], Asahi Newspaper (Tokyo).
BERGGREN N. and JORDAHL H. (2006) Free to trust: economic freedom and social capital, Kyklos 59, 141–169.
BIRCH K. and WHITTAM G. (2008) The third sector and the regional development of social capital, Regional Studies 42, 437–450.
BJØRNSKOV C. (2006) Determinants of generalized trust: a cross-country comparison, Public Choice 130, 1–21.
BOETTKE P., CHAMLEE-WRIGHT E., GORDON P., IKEDA S., LEESON P. and SOBEL R. (2007) The political, economic, and social
aspects of Katrina, Southern Economic Journal 74, 363–376.
1030 Eiji Yamamura
Dow
nloa
ded
by [
USM
Uni
vers
ity o
f So
uthe
rn M
issi
ssip
pi]
at 1
4:38
12
Sept
embe
r 20
14
BOLIN R. (1982) Long-Term Family Recovery from Disaster. University of Colorado, Boulder, CO.
BOLIN R. and STANFORD L. (1998) The Northridge earthquake: community-based approaches to unmet recovery needs, Disasters
22, 21–38.
BURTON K., KATES R. and WHITE G. (1993) The Environment as Hazard, 2nd Edn. Guilford, New York, NY.
CABINET OFFICE GOVERNMENT OF JAPAN (2007) A Disaster Prevention White Paper. Cabinet Office, Government of Japan, Tokyo
(available at: http://www.bousai.go.jp/hakusho/h19/index.htm). [in Japanese]
CALLOIS J. M. and AUBERT F. (2007) Towards indicators of social capital for regional development issues: the case of French rural
areas, Regional Studies 41, 809–921.
CHAPPELL W. F., FORGETTE R. G., SWANSON D. A. and VAN BOENING M. V. (2007) Determinants of government aid to Katrina
survivors: evidence from survey data, Southern Economic Journal 74, 344–362.
CONGLETON R. D. (2006) The story of Katrina: New Orleans and the political economy of catastrophe, Public Choice 127, 5–30.
COSTA D. and KAHN M. (2003) Civic engagement in heterogeneous communities, Perspectives on Politics 1, 103–112.
DURLAUF S. (1999) The case ‘against’ social capital, Focus 20, 1–5.
DYNES R. (2002) The Importance of Social Capital in Disaster Responses. Preliminary Paper Number 327. Disaster Research Center,
University of Delaware, Newark, DE.
ECKEL C., GROSSMAN P. J. and MILANO A. (2007) Is more information always better? An experimental study of charitable giving
and Hurricane Katrina, Southern Economic Journal 74, 388–411.
ERIKSON K. (1994) A New Species of Trouble: Explorations in Disaster, Trauma, and Community. W. W. Norton, New York, NY.
ESCALERAS M., ANBARCI N. and REGISTER C. (2007) Public sector corruption and major earthquakes: a potentially deadly inter-
action, Public Choice 132, 209–230.
EWING B. T., KRUSSE J. B. and SUTTER D. (2007) Hurricanes and economic research: an introduction to the Hurricane Katrina
Symposium, Southern Economic Journal 74, 315–325.
FUKUYAMA R. (2001) Social capital, civic society and development, Third World Quarterly 22, 7–20.
GARRET T. and SOBEL R. (2003) The political economy of FEMA disaster payments, Economic Inquiry 41, 496–509.
GOTO I. (2001) Shobo-dan no Genkryu o Tadoru: 21seki no Shobo-dan no Arikata [Tracing the Origin of the Communal Fire-fighting
Team: Communal Fire-fighting Teams in the 21st Century]. Kindaishobo-sha, Tokyo.
GROOTAERT C. (1998) Social Capital: The Missing Link, The World Bank, Social Development Family, Environmentally and Socially
Sustainable Development Network. Social Capital Initiative Working Paper 3. The World Bank, Washington, DC.
HAYAMI Y. (2001) Development Economics: From the Poverty to the Wealth of Nations. Oxford University Press, New York, NY.
HORWICH G. (2000) Economic lessons from the Kobe earthquake, Economic Development and Cultural Change 48, 521–542.
INDEX CORPORATION (2006) Chiiki toukei 2006 [CD-ROM Edn]. Index Corporation, Tokyo.
JOVANOVIC B. (1982) Selection and evolution of industry, Econometrica 50, 649–670.
JOVANOVIC B. and NYARKO Y. (1996) Leaning by doing and the choice of technology, Econometrica 64, 1299–1310.
KAHN M. (2005) The death toll from natural disasters: the role of income, geography, and institutions, Review of Economics and
Statistics 87, 271–284.
KANIASTY K. and NORRIS F. H. (1995) In search of altruistic community: patterns of social support mobilization following
Hurricane Hugo, American Journal of Community Psychology 23, 447–477.
KNACK S. and KEEFER P. (1997) Does social capital have an economic payoff?, Quarterly Journal of Economics 112, 1251–1288.
LANDRY C. E., BIN O., HINDSLEY P., WHITEHEAD J. C. and WILSON K. (2007) Going home: evacuation–migration decisions of
Hurricane Katrina survivors, Southern Economic Journal 74, 326–343.
LEDERMAN D., LOAYZA N. and MENENDES M. (2002) Violent crime: does social capital matter?, Economic Development and Cultural
Change 50, 509–539.
LEIGH A. (2006a) Does equality lead to fraternity?, Economics letters 93, 121–125.
LEIGH A. (2006b) Trust, inequality, and ethnic heterogeneity, Economic Record 82, 268–280.
LUCAS R. E. (1993) Making a miracle, Econometrica 61, 251–272.
MILES N. and TULLY J. (2007) Regional development agency policy to tackle economic exclusion? The role of social capital in
distressed communities, Regional Studies 41, 855–866.
NATIONAL ASTRONOMICAL OBSERVATORY JAPAN (2006) Rika Nenakan [Chronological Scientific Tables]. National Astronomical
Observatory, Tokyo.
O’BRIEN D. J., PHILLIPS J. L. and PATSIORKOVSKY V. (2005) Linking indigenous bonding and bridging social capital, Regional Studies
39, 1041–1051.
PELLING M. (1998) Participation, social capital and vulnerability to urban flooding in Guyana, Journal of International Development
10, 469–486.
PUTNAM R. (2000) Bowling Alone: The Collapse and Revival of American Community. Touchstone, New York, NY.
SAWADA Y. and SHIMIZUTANI S. (2007) Consumption insurance against natural disasters: evidence from the Great Hanshin-Awaji
(Kobe) earthquake, Applied Economics Letters 14, 303–306.
SCHELLONG A. (2007) Increasing Social Capital for Disaster Response through Social Networking Service (SNS) in Japanese Local
Governments. Working Paper Number 07-005. National Centre for Digital Government (NCDG), University of
Massachusetts – Amherst.
SHAW R. and GODA K. (2004) From disaster to sustainable civic society: the Kobe experience, Disasters 28, 16–40.
SHUGHART II W. G. (2006) Katrinanomics: the politics and economics of disaster relief, Public Choice 127, 31–53.
SKIDMORE M. and TOYA H. (2002) Do natural disasters promote long-run economic growth?, Economic Inquiry 40, 664–687.
Interactions among Social Capital, Income and Learning from Experiences of Natural Disasters 1031
Dow
nloa
ded
by [
USM
Uni
vers
ity o
f So
uthe
rn M
issi
ssip
pi]
at 1
4:38
12
Sept
embe
r 20
14
SOBEL R. S. and LEESON P. T. (2006) Government’s response to Hurricane Katrina: a public choice analysis, Public Choice 127,
55–73.
SUGIYAMA S. (1987) The impact of the opening of the ports on domestic Japanese industry: the case of silk and cotton, Economic
Studies Quarterly 38, 338–353.
TIERNEY K. and GOLTZ J. D. (1997) Emergency Response: Lessons Learned from The Kobe Earthquake. Preliminary Paper Number 260.
Disaster Research Center, University of Delaware, Newark, DE.
TOL R. and LEEK F. (1999) Economic analysis of natural disasters, in DOWNING T., OLSTHOORN A. and TOL R. (Eds) Climate
Change and Risk, pp. 308–327. Routledge, London.
TOYA H. and SKIDMORE M. (2007) Economic development and the impact of natural disasters, Economics Letters 94, 20–25.
VIGDOR J. L. (2004) Community composition and collective action: analyzing initial mail response to the 2000 Census, Review of
Economics and Statistics 86, 303–312.
WESTERN J., STIMSON R., BAUM S. and VAN GELLECUM Y. (2005) Measuring community strength and social capital, Regional Studies
39, 1095–1109.
WHITT S. and WILSON R. K. (2007) Public goods in the field: Katrina evacuees in Houston, Southern Economic Journal 74, 377–387.
WOOLCOOK M. (1998) Social capital and economic development: toward a theoretical synthesis and policy framework, Theory and
Society 27, 151–208.
YAMAMURA E. (2008a) Diffusion of home computers and social networks: a study using Japanese panel data, Applied Economics
Letters 15, 1231–1235.
YAMAMURA E. (2008b) The effects of inequality, fragmentation, and social capital on collective action in a homogeneous society:
analyzing responses to the 2005 Japan Census, Journal of Socio-economics 37, 2054–2058.
YAMAMURA E. (2008c) The impact of formal and informal deterrents on driving behavior, Journal of Socio-economics 37, 2505–2512.
YAMAMURA E. (Forthcoming 2009) Effects of social norms and fractionalization on voting behavior in Japan, Applied Economics.
1032 Eiji Yamamura
Dow
nloa
ded
by [
USM
Uni
vers
ity o
f So
uthe
rn M
issi
ssip
pi]
at 1
4:38
12
Sept
embe
r 20
14