effects of export product diversification on quality …0 effects of export product diversification...
TRANSCRIPT
0
Effects of Export Product Diversification on Quality Upgrading:
An Empirical Study
Muhlis Can, Ph.D.
Hakkari University, Department of Economics and Finance
Hakkari, Turkey
E–mail: [email protected]
Giray Gozgor, Ph.D.
Istanbul Medeniyet University, Faculty of Political Sciences
Istanbul, Turkey
E–mail: [email protected] &[email protected]
Abstract
This paper empirically examines the effects of export product diversification on overall export
quality in a panel data set of 115 countries from 1970 to 2010. It uses the data sets of the overall
export quality and three export diversification measures of the International Monetary Fund:
the extensive margin (variation in number of new products exported), the intensive margin
(variation in export values among existing exports), and the overall (Theil) index. It finds that
export quality has only been increasing with a higher variation in export values among existing
exports in low- and lower-middle-income countries. It also observes that export quality has
been increasing with both a higher variation in export values among existing exports and new
products exported in upper-middle- and high-income countries. The results are robust to the
changing measures of controls in the benchmark model, the inclusion of many other controls
(various measures of globalization, country size, factor endowments, macroeconomic stance,
etc.), and the exclusion of outliers.
Key Words: Export Performance; Quality Upgrading; Product Diversification; Export Prices;
Export Volume
JEL Classification Codes: F14; O11; L15; L25
Acknowledgements
We would like to thank Chris Papageorgiou for his valuable comments and suggestions on the
paper.
1
1. Introduction
It is well-known that a significant number of studies have empirically tested the effects of the
export volume on economic growth. However, the literature has recently shifted the focal point
to the quality of exports rather than volume, but a limited number of studies focus on the
importance of upgrading export quality,1 rather than the volume of exports, for economic
growth. Scholars have recently revealed that upgrading the quality of goods has positively
influenced key indicators of countries’ economic performance, boosting gross domestic product
(GDP) growth, employment, trade volume, and wages (Crino and Ogliari 2015). Indeed, export
quality upgrading yields not only an increase in export revenues, but also foster economic
growth. (International Monetary Fund, 2014a).
As a matter of fact, measuring export quality is quite difficult, and first-generation
studies simply define export quality as the unit price of export products (e.g., Hallak, 2006;
Hummels and Klenow, 2005; Schott, 2004).2 Second-generation studies evaluate export quality
in the context of adding trade costs to the demand-or-supply model (determining unit price)
within microeconomic foundations (e.g., Feenstra and Romalis, 2014; Hallak and Schott, 2011;
Khandelwal, 2010; Martin and Mejean, 2014). Although these studies have novel contributions
to the literature, their data sets are unfortunately limited in terms of number of countries and
time coverage. The recent studies conducted by Henn et al. (Henceforth HPS) (2013 and 2015)
differentiate from the previous ones, and their time and country coverages are more
comprehensive than those other seminal papers. HPS (2015) calculate the quality of the
products exported by different countries using a gravity model based on three factors: the
unobservable quality of the product, income level of the exporting country, and distance
between importing and exporting countries. The purpose of our paper is to further investigate
the determinants of the recent export quality data set by HPS (2013 and 2015) and specifically
examine the effects of the diversification of the export basket on upgrading quality.
It is also essential to explain that our measure for diversification of export products is
composed of the intensive margin (within a sector) and the extensive margin (across sectors).
The sum of the intensive and extensive margins is expressed as overall export diversification.
1 In the paper, export quality upgrading is defined as the increase in export product quality. Nevertheless, first-
generation studies synonymously use the concepts of sophistication and quality upgrading. However, according to
HPS (2015), while rich countries also tend to produce higher-quality varieties, the concepts of quality and
sophistication are quite different. Quality refers to the relative price of a country’s varieties within their respective
product lines. Product sophistication, as in Hausmann et al. (2007), is the composition of the aggregate export
basket (PRODY). Referring to HPS (2015), we use export quality upgrading in the context of export product
quality growth, while sophistication is the shift toward more value-added and complex products. 2 Export product quality is also evaluated in the context of unit price in some studies in the 2010s. (e.g., Amighini
ve Sanfilippo, 2014; Shi, 2011; Xu, 2010).
2
According to Cadot et al. (2011: 590), the intensive margin reflects variation in export values
among existing exports, whereas the extensive margin reflects variation in the number of new
products exported or in the number of new markets for existing exports". On the other hand,
Hummels and Klenow (2005) define the intensive margin as exporting the larger quantities of
each good and the extensive margin as a wider set of goods. Considering the close relationship
between a country’s product diversification and its knowledge, capabilities, infrastructure, and
human capital, it should be expected that the contributions of intensive and extensive margins
to export quality upgrading can depend on the level of development. The existence of the
aforementioned factors could help countries in their efforts to utilize from both intensive and
extensive margins with regard to the export quality. However, it is more likely that the intensive
margin significantly contributes to export quality in poor countries because manufactured
products readily more accessible as product quality increases. The impact of the extensive
margin (new products) on export quality also depends on the capabilities of the country. If such
capabilities are sufficient (as in rich economies), the new products are much easier to emerge.
Otherwise, if the country has limited know-how, the emergence of new products is then more
difficult (Hausmann and Hidalgo 2011), and this means that export quality upgrades will also
remain at a limited level.
To examine whether export basket diversification is a catalyst for quality upgrading, we
focus on 115 countries over the period 1970–2010. The main variable of interest in our paper
is the export quality index, which is recently proposed by the IMF (HPS 2015). Indeed, there is
only one paper in the literature that examines the determinants of the new export quality index,
and that is the original paper that introduced a data set for the quality of exports (HPS 2015).
This emerges from the fact that previous papers face a key challenge: the quality of exports
cannot be directly observed and needs to be estimated. In addition, the methodologies of
previous papers do not allow for calculation of a set of export quality estimates with large
country and time coverage, because of data limitations for unit export prices and trade costs
(HPS 2013 and 2015). However, HPS (2015) propose the directly observed data for the quality
of exports in 178 countries and employ 10-year averaged estimations. They find that income
level, human capital, institutional quality, foreign direct investment (FDI) inflows, and trade
openness (liberalization) enhance the quality of the export basket. The benchmark models in
our paper are somehow close to the empirical models in HPS (2015), and they test the
hypothesis of whether export product diversification has a significant impact on export quality.
For this purpose, we separately control for three measures of export diversification (the overall
3
Theil index, extensive margin, and intensive margin). In other words, the main hypothesis of
our paper is that at least one diversification measure boosts the quality of exports.
The main contribution of the paper is as follows. To the best of our knowledge, our
paper will be the first to examine the effects of the diversification of the export basket on quality
upgrading for countries at different stages of development. Our paper also improves the findings
of HPS (2015) on determinants of the quality of the export basket by providing various
robustness exercises. The paper finds that export quality has only been increasing with a higher
volume of existing exports (intensive margin) in low- and lower-middle-income countries. It
also observes that export quality has been increasing with a higher volume of both existing
exports (intensive margin) and new products exported (extensive margin) in upper-middle- and
high-income countries. The results are robust to the changing measures of controls in the
benchmark model, the inclusion of many other controls (various measures of globalization,
country size, factor endowments, macroeconomic stance, etc.), and the exclusion of outliers.
The paper also provides the implications of export performance for countries at different stages
of economic development.
The rest of the paper is organized as follows. Section 2 discusses the motivation behind
the research questions and reviews the previous literature. Section 3 explains the data and the
econometric methodology and sets the empirical model. Section 4 reports and discusses the
empirical results. Section 5 provides various robustness checks on the benchmark findings.
Section 6 concludes.
2. Motivation and Literature Review
2.1. Why Export Product Diversification Matters for Quality Upgrading
Export quality upgrading can be defined as the increase in the quality of existing export
products through structural transformation (HPS 2013). Quality upgrading is particularly rapid
during the early stages of development, with the process largely completed as a country reaches
the upper-middle-income status (real per capita GDP is $10,000). It should be expected that
export quality increases with income, particularly sharply during the early stages of
development (HPS 2015). However, the influence of export product quality on economic
growth is also closely related to the level of human capital, the quality of physical investment,
and knowledge and skills of workers (IMF, 2014a). For instance, electronic elements and
devices3 require more capital and qualified (engineering) knowledge and skills, when compared
3 These products are regarded as sophisticated or complex products in literature. Sophisticated (complex) products
meant to use knowledge- and skills-intense products (Hausmann et al. 2011). In other words, sophisticated does
4
in terms of natural resources (Lederman and Maloney 2012:70). From this point of view, many
developing countries try hard to increase the quality of their export basket.
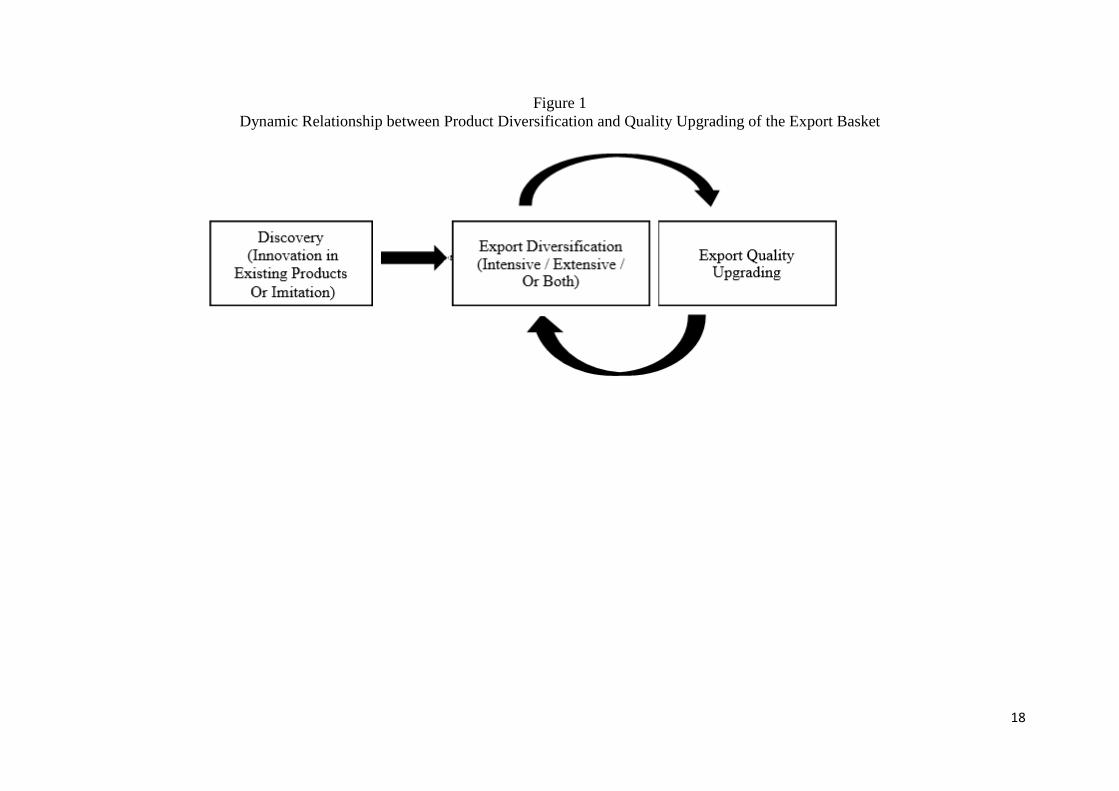
Improving export basket quality is also closely associated with a country’s
diversification of its export basket, and product discovery is required in the first place.
Discovery means here is the start of production of manufacturing products, which have not been
produced beforehand. This stage does not depend on the country’s income level. Therefore, no
matter what income level they are, countries initially discover a product and begin exporting it.
In other words, discovery is closely related to the purpose of exporting “new” product (Klinger
and Lederman 2004). Moreover, innovations in existing products or imitations of products
manufactured in other countries can also be defined as discovery (Klinger and Lederman 2006).
However, discovery takes place predominantly in nontraditional and dynamic industries
(Klinger and Lederman 2004). In the second stage (diversification), the product is added to the
export basket. At this point, it is important for countries to diversify their product baskets as
much as possible. The low levels of diversification lead to low technological spillovers.
Additionally, the limited diversification also limits the improvement of the quality of export
products (Papageorgiou and Spatafora 2012). The third stage is export quality upgrading. At
this stage, it is necessary for countries to add new products to their export baskets when they
reach the world frontier in the export quality of existing products (HPS 2013). In other words,
diversification and export quality upgrading processes complement each other (IMF 2014a).
Increasing export basket diversification is necessary when exported goods reach the world
frontier. Therefore, forming the export basket out of different products will reveal the
possibility of an increase in the quality of new products. Sutton and Trefler (2016) emphasize
that as low-income countries produce low-quality and low-value-added (primary) products,
their export quality does not significantly contribute to economic growth, and the most
important reason for this is that export product diversification in these countries has not reached
the desired level. In short, the success of export quality upgrading is strongly tied to the
diversification process. A summary of the process for these stages is also illustrated in Figure
1.
[Insert Figure 1 around here]
2.2. Previous Literature on Determinants of Quality
not mean specialization. Therefore, adding sophisticated products to the export basket can be regarded as an
increase of the quality of export products in the basket. For economic complexity, see Hausmann et al. (2011), and
Simoes and Hidalgo (2011).
5
Poor countries are at the low level of physical and human capital and also lack the incentives
for rapid accumulation of production factors, therefore perpetuating their low income levels.
Low growth rates of production factor accumulation are mainly explained by a lack of important
economic and political institutions such as a solid law system assuring property rights,
mechanisms for the efficient enforcement of contracts, and so on (Lederman and Maloney,
2012: 70). For these reasons, several scholars have underlined the different determinants of
export quality. For instance, Hallak and Schott (2011) emphasize the importance of the external
trade balance to identify export quality. Schott (2004) points out the roles of the capital-labor
ratio and skill per worker to determine the export quality. According to Sutton and Trefler
(2016), export quality is closely related to the capabilities of a country. In their recent paper,
HPS (2015) identified the determinants of export quality upgrading as the per capita GDP,
institutional quality, human capital level, trade openness (liberalization), and FDI inflows.
Additionally, Hausmann et al. (2007) point out the significance of country size and the terms-
of-trade shocks in the increase of knowledge- and skills-intense export products
(sophistication). Within this context, our paper controls for the effects of all these variables on
the new export quality data set of HPS (2013 and 2015), and the previous findings are improved
by using export diversification measures.
The effects of export diversification mainly focus on economic growth. Scholars have
empirically studied the effects of export product diversification on economic growth in different
countries/country group samples (e.g., Aditya and Acharyya, 2013; Al-Marhubi, 2000; De
Pineres and Ferrantino, 1997; Funke and Ruhwedel, 2005; Gozgor and Can, 2016; Herzer and
Nowak-Lehmann, 2006; Hesse, 2008; Mau, 2015). Most of these papers find that export
diversification positively affects economic growth. The empirical studies on export quality also
observe that upgrading the quality of the export basket enhances economic growth. (e.g., Anand
et al., 2015; Papageorgiou et al., 2015; Poncet and de Waldemar, 2013).
There are also different types of studies conducted on the various determinants of export
quality upgrading. 4 Scholars have tried to obtain more comprehensive evidence on the
determinants of export quality upgrading in different countries/country group samples. Through
different variables, Amighini and Sanfilippo (2014), Bas and Strauss-Kahn (2015), Chen and
Juvenal (2016), Crino and Ogliari (2015), Fan et al. (2015), Faruq (2011), Gnangnon and
Roberts (2015), Harding and Javorcik (2012), Oladi et al. (2008), Wang and Wei (2010), and
4 Effects of export sophistication (as PRODY in Hausmann et al., 2007) are explained in Lederman and Maloney
(2012), Schott (2008), and Sutton and Trefler (2016). See for instance, Anand et al. (2012), Hausmann et al. (2007),
and Mishra et al. (2011) for the positive effects of export sophistication on economic growth.
6
Zhu and Fu (2013) have identified the determinants of export quality upgrading. However,
despite providing important contributions to the literature, these studies have limitations on
both the number of countries and time coverage. In addition, these studies have totally neglected
the role of export product diversification, which can be considered as the requirement to achieve
export quality upgrades.5 In addition to the explanatory variables used in the empirical models
of HPS (2015), our paper uses additional controls and aims to contribute to the empirical
findings of previous papers.
3. Empirical Model, Data, and Econometric Methodology
Following HPS (2015), we consider the following empirical model to analyze the effects of
export product diversification on the growth of overall export quality:
0 1 2 3_ ln _ _
it it it it i t itGR QUA INT QUA INT EXPDIV CONTROL (1)
where _it
GR QUA is the annualized growth rate of (overall) export quality in country i at time
t, and it is calculated as the difference between the logarithms of quality levels in the initial and
the final years of the five-year non-overlapping period. 6 ln _it
INT QUA is the logarithm of the
initial product quality level in country i at time t, _it
INT EXPDIV is the initial level of product
diversification (the Theil index, intensive margin, and extensive margin) in country i at time t,
and it
CONTROL is the control variables in the benchmark model in country i at time t (initial
per capita GDP, initial human capital level, and initial institutional quality). All the explanatory
variables are defined as initial conditions and are observed in the first year of any five-year non-
overlapping period. The benchmark specifications also include the “fixed effects for time” (t
), and the “fixed effects for country” (i
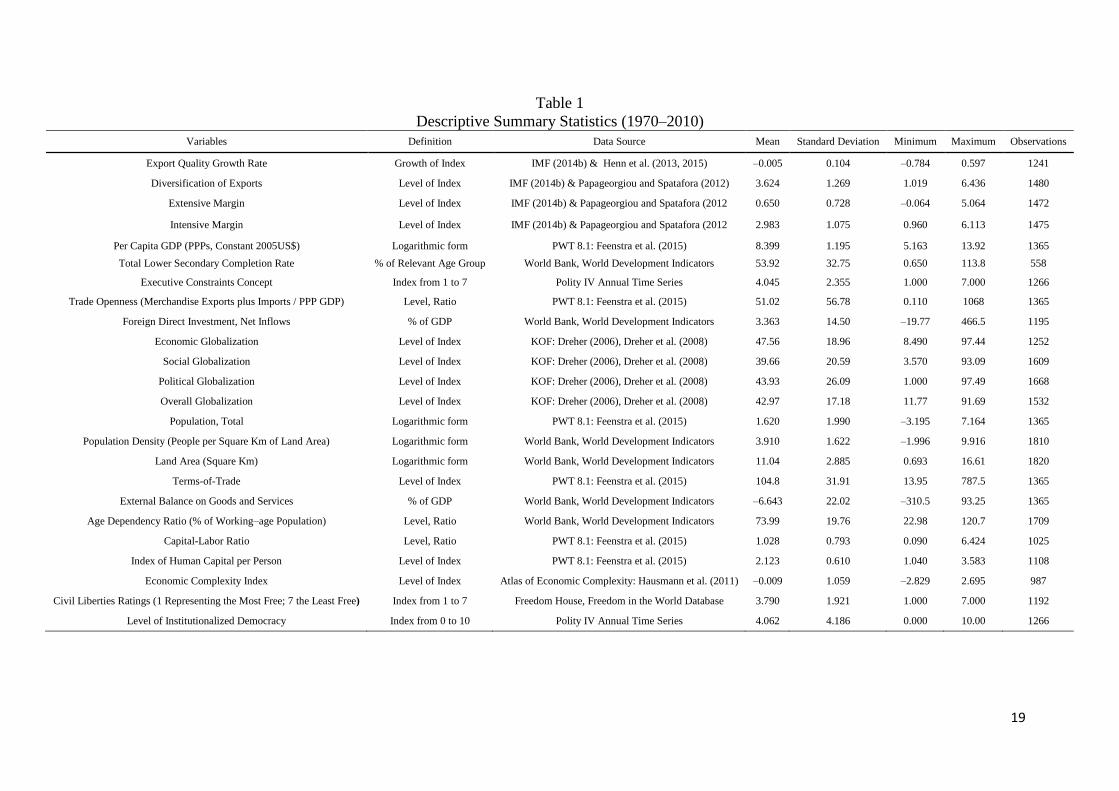
), and the “error term” is represented as,i t . See Table
1 for the sources of the data and a summary of the descriptive statistics.
[Insert Table 1 around here]
The paper uses three measures for export diversification, which is the product
diversification indexes of the export basket: the extensive margin (variation in the number of
new products exported), the intensive margin (variation in export values among existing
5 HPS (2013, 2015) have not used the export product diversification model in their empirical models as well. They
just mention the significance of the export product diversification process of export quality upgrading. 6 The panel data set covers the period from 1970 to 2010. The 5-year non-overlapping periods are 1970–1975,
1976–1980, 1981–1985, 1986–1990, 1991–1995, 1996–2000, 2001–2005, and 2006–2010.
7
exports), and the Theil (overall) index (sum of intensive margin and extensive margin).7 The
relevant data are obtained from the IMF (2014b). It is important to note that higher values of
the diversification indexes indicate a lower product diversification of exports (Papageorgiou
and Spatafora 2012), and therefore, the diversification of export indexes is expected to be
negatively associated with the growth rate of the export quality indexes.
Following HPS (2015), three control variables are used in the benchmark model
estimations: i) logarithm of per capita GDP (Purchasing Power Parities (PPPs), constant
2005US$ prices) as a benchmark indicator of the income level, and the data are obtained from
the Penn World Table (PWT) version 8.1 of Feenstra et al. (2015), ii) total lower secondary
completion rate (percent of relevant age group) as a benchmark indicator of the human capital
level, and the data are obtained from the World Development Indicators (WDI) of the World
Bank, iii) "executive constraints concept" (index from 1 to 7) as a benchmark indicator of the
institutional quality, and the data are obtained from the Polity IV annual time series data set. It
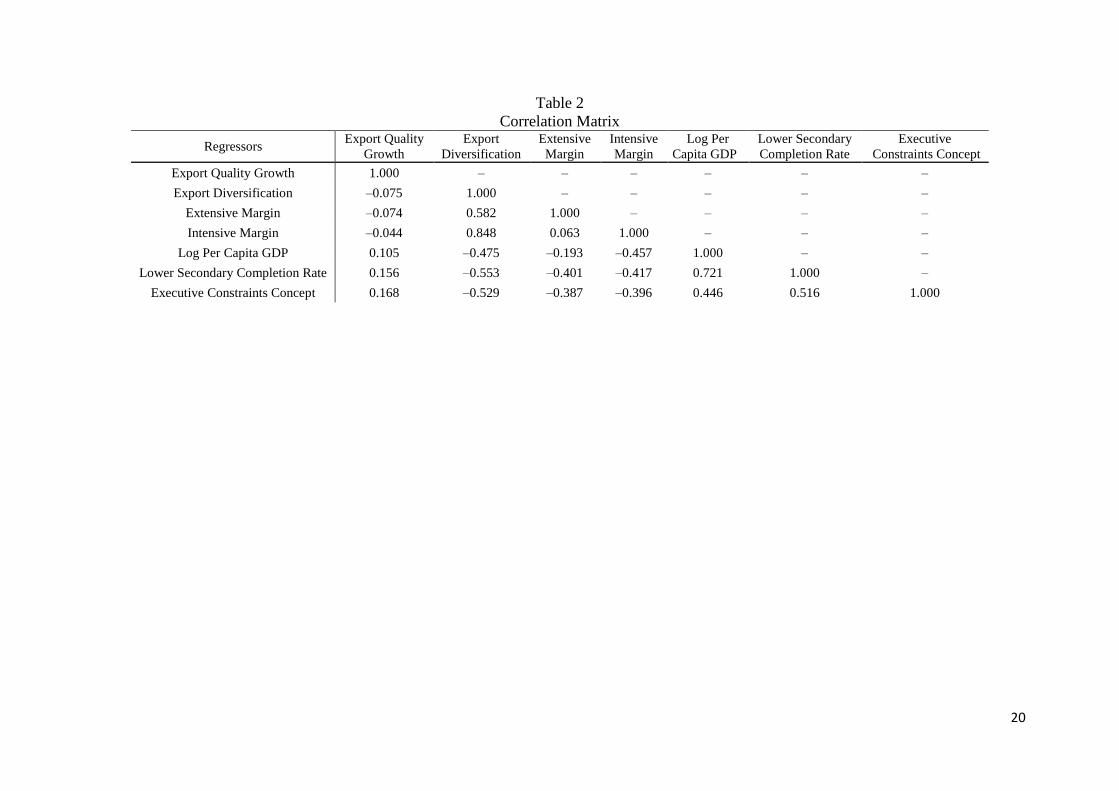
is also expected that the income level, human capital level, and institutional quality will be
positively related to the growth rate of the export quality. The expected signs are also observed
in the correlation matrix for the variables used in the benchmark regressions (see Table 2).
[Insert Table 2 around here]
The panel data set covers the period from 1970 to 2010 in 115 countries. The empirical
analysis also considers two subgroups of countries in terms of income levels, i.e., low and
lower-middle income (54 countries) as well as the upper-middle- and high-income countries
(61 countries). The income definition of countries is based on the classifications of the “country
and lending groups” data set by the World Bank. The details of countries in the data set are also
provided in Appendix I.
We run the feasible generalized least squares (FGLS) regressions, and this approach is
standard in the literature (e.g., Meinhard and Portrafke 2012). We also consider the
heteroskedastic and autocorrelation (HAC)–consistent Newey-West-type standard errors and
control for the country (cross section) fixed effects and the year (time) fixed effects in the
regressions.
7 According to the International Monetary Fund (IMF) data set, explanation of the export diversification toolkit
set as follows: "… the overall, intensive (within), and extensive (between) Theil indices following the definitions
and methods used in Cadot et al. (2011). We first create dummy variables to define each product as "traditional",
"new", or "non-traded". Traditional products are goods that were exported at the beginning of the sample, and
non-traded goods have zero exports for the entire sample. Thus, for each country and product, the dummy values
for traditional and non-traded remain constant across all years of our sample. For each country/year/product
group, products classified as "new" must have been non-traded in at least the two previous years and then exported
in the two following years. Thus, the dummy values for new products may change over time." (IMF, 2014b).
8
4. Empirical Results
4.1. Results from Benchmark Regressions
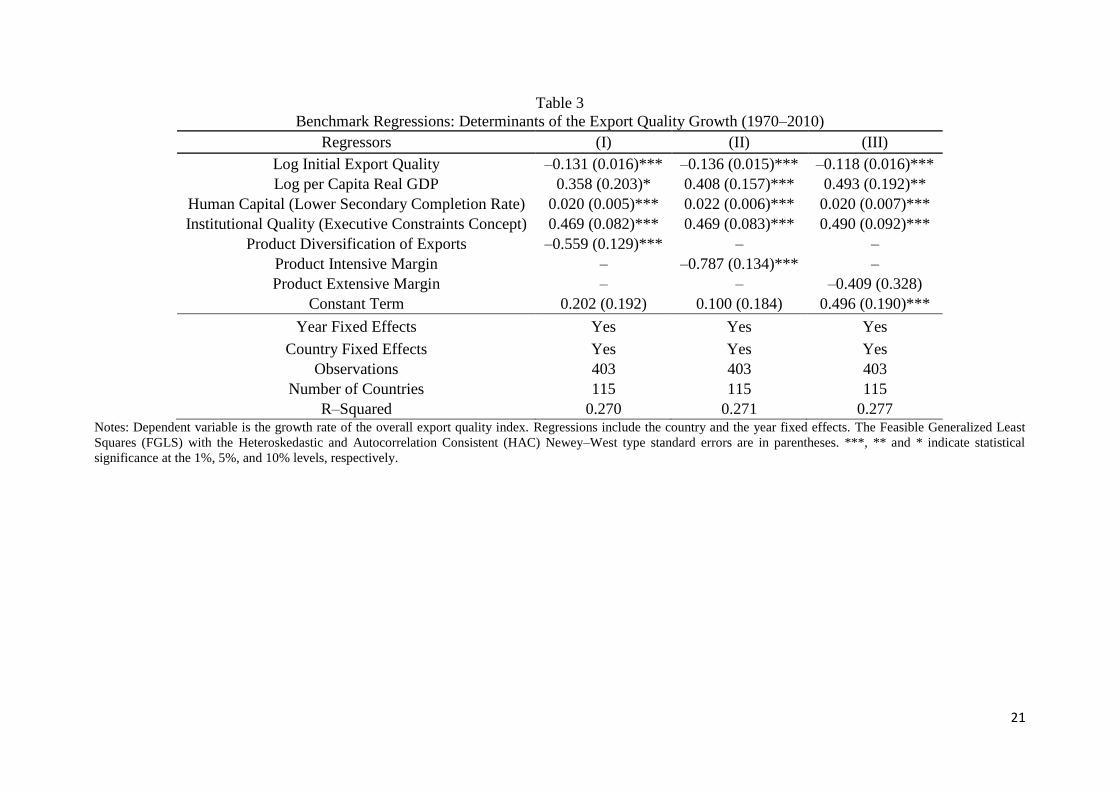
Table 3 provides the results of the benchmark regressions with the growth rate of the overall
export quality index as the dependent variable. The result of the product diversification of
exports (Theil index) is reported in Column 1, while the results for intensive margin and
extensive margin are in Columns 2 and 3, respectively.
[Insert Table 3 around here]
All measures of export diversification lead to a higher growth rate of export quality, but
the coefficient of extensive margin is not statistically significant. We also observe that an
increase of one standard deviation in the export product diversification (Theil index) implies a
0.71-point decrease (1.92 standard deviation) in the logarithm growth rate of the overall export
quality index. The effects of extensive margin and intensive margin are also in a similar order
of magnitude.
Among the controls, the per capita income, the human capital level, and institutional
quality are positively related to export quality in the benchmark regressions. The results on the
control variables are consistent with those of HPS (2015). Moreover, the growth rate of product
quality depends negatively on the initial quality level. This result implies that “new, low-quality
entrants” into a sector experience their “quality rise” over time, relative to other economies, and
therefore, there is a significant unconditional convergence toward the world quality frontier
(HPS 2015), which is also consistent with the results of HPS (2015). Nevertheless, the novel
finding of our paper is that export product diversification enhances the growth rate of export
quality in 115 countries.
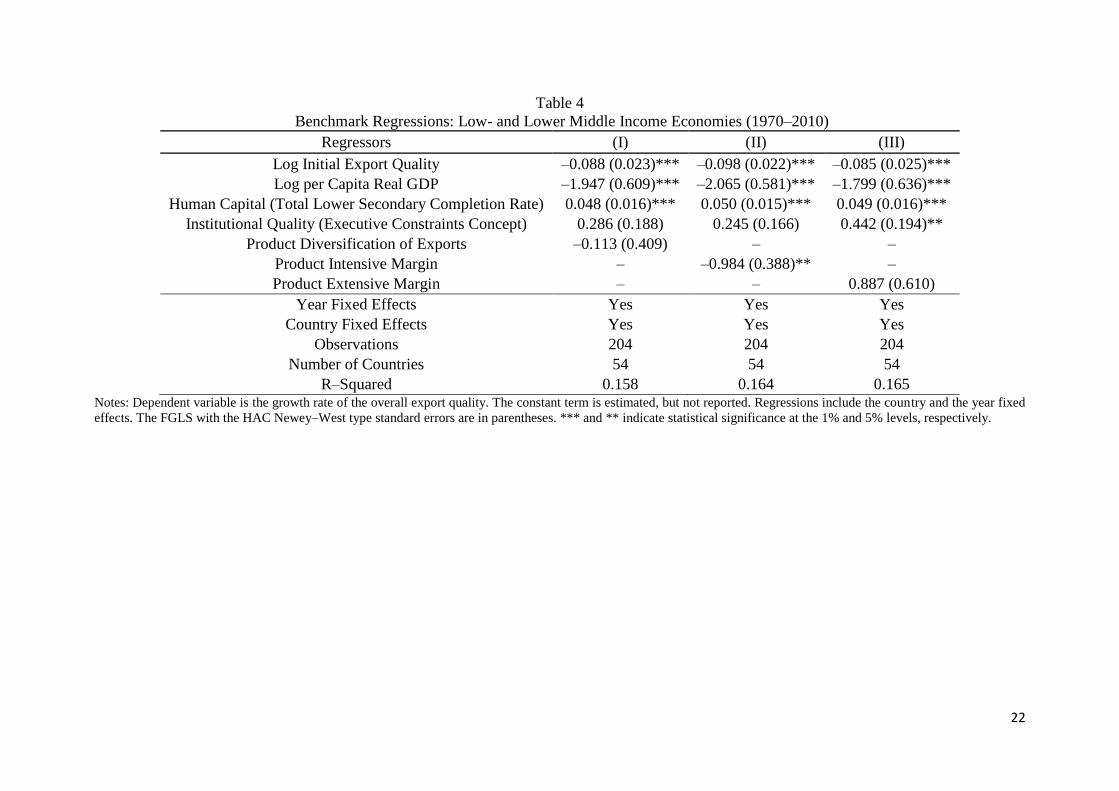
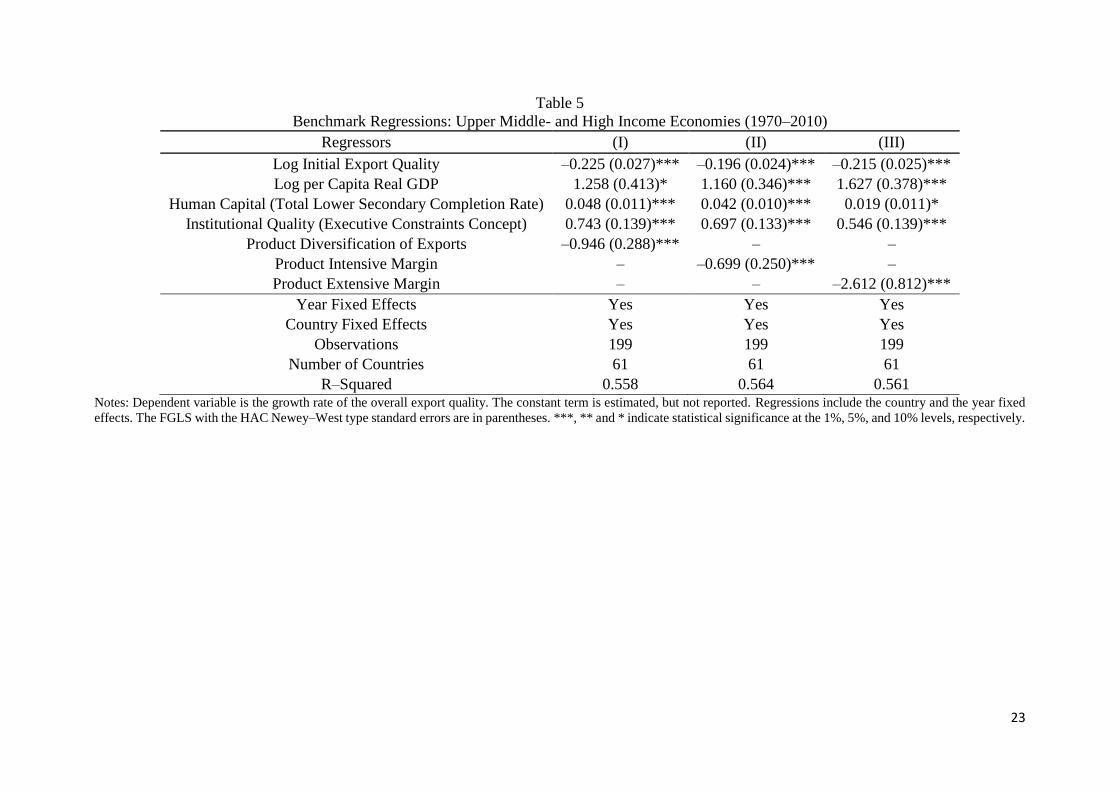
4.2. Results from Countries at Different Levels of Economic Development
At this stage, we aim to see whether our findings differ according to the countries’ level of
development. For this purpose, following previous empirical papers (e.g., Bergh and Nilsson,
2010; Gozgor and Ranjan, 2015), we divide our sample into two groups: (i) the low- and lower-
middle-income economies and (ii) the upper-middle- and high-income economies. We also
consider the World Bank classification of the country and lending groups according to which
the sample of the low and lower-middle economies includes countries with per capita income
smaller than $4,125 in 2015 (54 countries), while the upper-middle- and high-income
economies are those with per capita income above this level (61 countries). Table 4 reports
results for the low- and lower-middle-income countries, and Table 5 reports results for the
upper-middle- and high-income countries.
[Insert Table 4 around here]
9
[Insert Table 5 around here]
We observe that the negative relationship between the Theil index for export
diversification and the growth rate of export quality is primarily driven by the upper-middle-
and high-income countries. Even though the Theil index of export diversification is negatively
related to export quality in the low- and lower-middle-income countries, its coefficient is not
found as statistically significant. We also find that export quality has only been increasing with
a higher intensive margin (variation in export values among existing exports) in the low- and
lower-middle-income countries, while it has been increasing with both a higher intensive
margin and extensive margin (new products exported) in the upper-middle- and high-income
countries. We also provide various robustness exercises for our findings below.
5. Robustness Checks
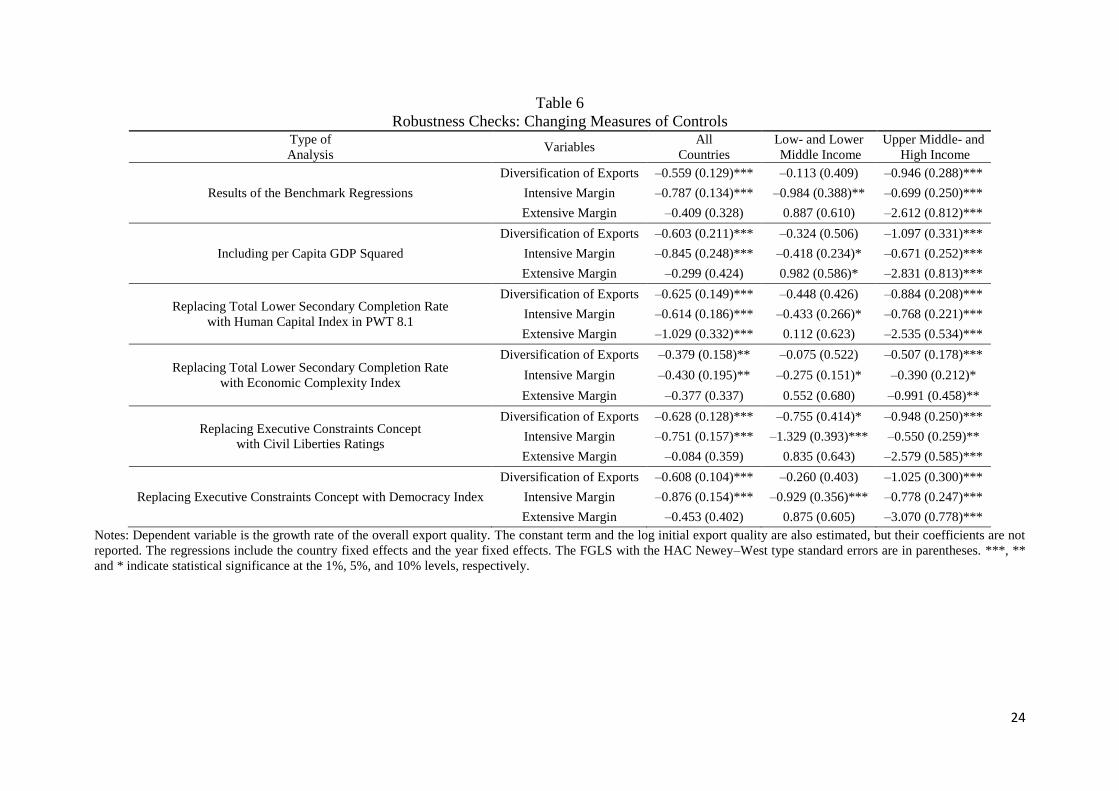
5.1. Robustness to the Changing Measures of Controls
Table 6 provides the results of the robustness of the changing measures of controls with the
growth rate of the overall export quality index as the dependent variable. The results for all
countries are reported in Column 1, while the results for the low- and lower-middle-income and
the upper-middle- and high-income countries are in Columns 2 and 3, respectively. All the
variables in the robustness checks are again defined as initial conditions and are observed in the
first year of any five-year non-overlapping period. The regressions in Table 6 also include the
log initial export quality, the country fixed effects, and the year fixed effects.
[Insert Table 6 around here]
First, when per capita GDP squared is added, the nonlinear effect of real income on the
growth rate of export quality is also included in the benchmark model.
Second, the benchmark indicator of human capital level (total lower secondary
completion rate) is replaced with (i) index of the human capital per person in the PWT 8.1,
which is based on the data set of Barro and Lee (2013), and (ii) index of the economic
complexity of Hausmann et al. (2011).
Third, the benchmark indicator of institutional quality (executive constraints concept)
is replaced with (i) the civil liberties ratings of Freedom House (index from 1 to 7) and (ii) the
level of institutionalized democracy (index from 1 to 10) in Polity IV annual time series. We
observe that the results for the diversification indexes of export products are similar to those
for the benchmark regressions.
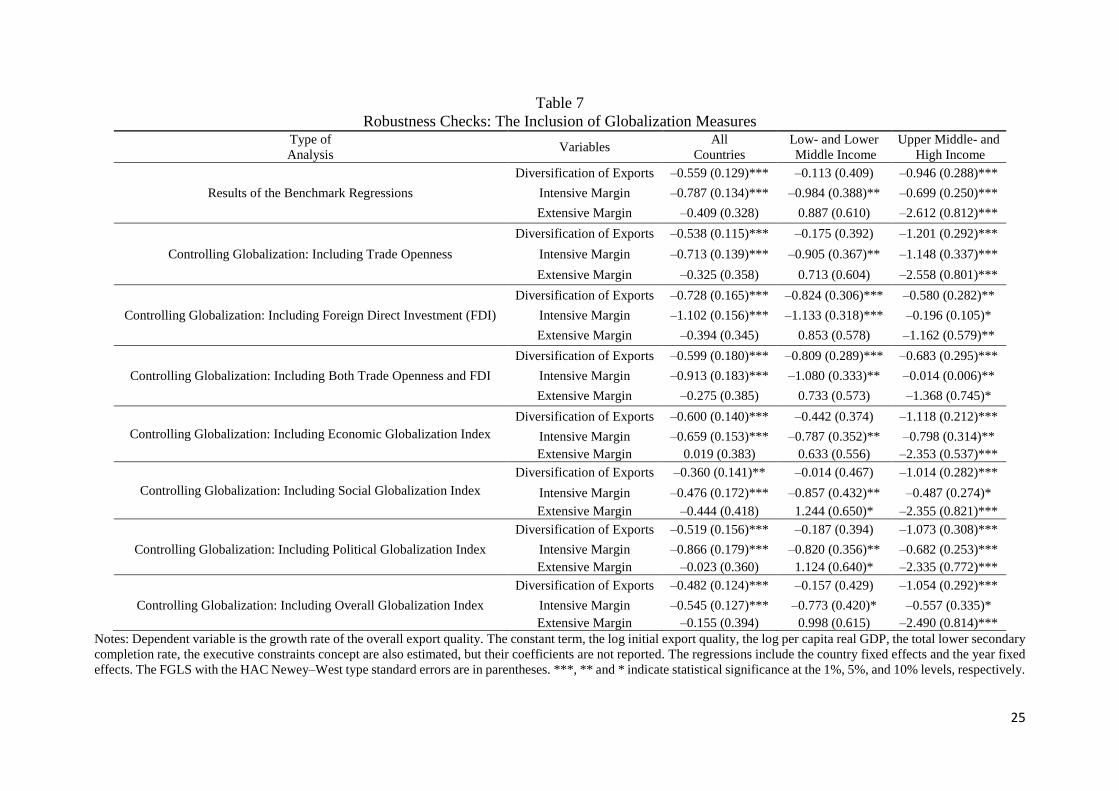
5.2. Robustness to the Inclusion of Globalization Measures
10
Table 7 provides the results of the robustness to the inclusion of controls for various
globalization measures with the growth rate of the overall export quality index as the dependent
variable. For example, HPS (2015) observe that both FDI inflows and trade openness
(liberalization) enhance the quality of the export basket. According to Bas and Strauss-Khan
(2015) and Fan et al. (2015), trade openness (liberalization) is positively associated with export
quality. In addition, Amighini and Sanfilippo (2014), Gnangnon and Roberts (2015), Harding
and Javorcik (2012), HPS (2015), and Iacovone et al. (2013) find that FDI inflows promote
export quality. Following these previous findings, we therefore also control for the effects of
globalization measures on the growth rate of export quality. The basic controls (log initial
export quality, log per capita GDP, total lower secondary completion rate, and executive
constraints concept) are also included in the regressions.
[Insert Table 7 around here]
First, we include the real trade openness measure in PWT 8.1 (share of the merchandise
exports plus imports relative to the PPP GDP that is defined by the constant (real) prices, due
to the significance of Harrod-Balassa-Samuelson (HBS) effects) (Alcala and Ciccone 2004).
Second, we add FDI net inflows (percent of GDP) to the benchmark regressions.
Third, we include both real trade openness and FDI net inflows in the benchmark
regressions.
Fourth, we control for the levels of the KOF index of globalization (economic, social,
political aspects of globalization, as well as their sum as overall globalization). The KOF index
of globalization in 2015 is used in the regressions, and the relevant data are obtained from the
database of the Swiss Federal Institute of Technology (ETH) in Zurich. Dreher (2006) first
introduces the KOF index of globalization, which is updated annually (Dreher et al. 2008).8 The
KOF index of globalization considers the economic, social, and political dimensions of
globalization (Potrafke, 2015).9 We again observe that the results for the diversification indexes
of export products are similar to those for the benchmark regressions.
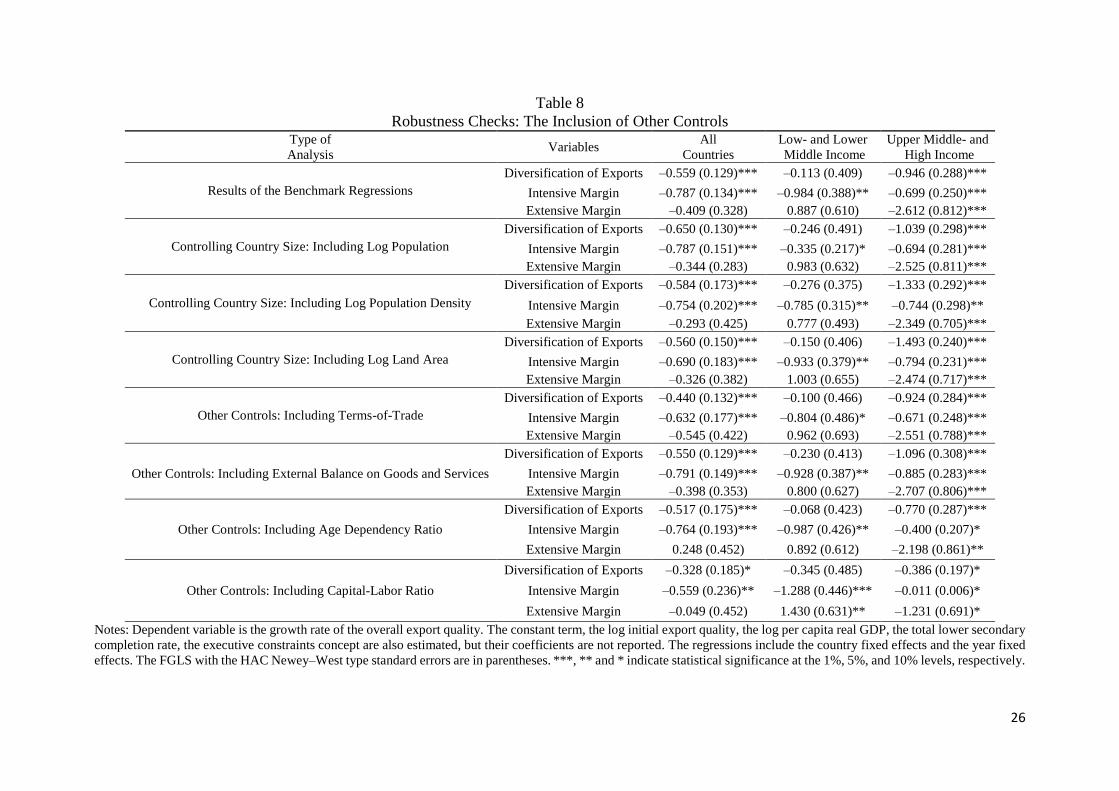
5.3. Robustness to the Inclusion of Other Controls
Table 8 provides the results of the robustness to the inclusion of several additional controls for
country size, structure of economy, and macroeconomic stance with the growth rate of the
overall export quality index as the dependent variable. For example, according to Hausmann et
al. (2007), IMF (2014a), and HPS (2015), countries with a small population have insufficient
capabilities, human capital, and fundamental factors of production (capital, labor, and land) for
8 The beginning date of the KOF index of globalization is also 1970. 9 See the website of KOF (http://globalization.kof.ethz.ch), for details on the KOF index of globalization.
11
producing high-quality (or sophisticated) export products. In other words, it should be expected
that smaller countries would have a lower growth rate of export quality.
Therefore, we first control for the effects of country size in the benchmark regressions.
Basic controls (log initial export quality, log per capita GDP, total lower secondary completion
rate, and the executive constraints concept) are also included in the regressions. For this
purpose, three benchmark measures of country size are used: (i) logarithm of the population
(the total population in millions), (ii) logarithm of the population density (people per square
kilometers of land area), and (iii) logarithm of the land area (square kilometers). When the
country size measures are included, the results for the diversification indexes of export products
are still similar to those for the benchmark regressions.
[Insert Table 8 around here]
Second, we control for the effects of terms-of-trade shocks on the growth rate of the
export quality and the terms-of-trade measure in PWT 8.1 (the price level of exports relative to
the price level of imports) is considered. Hausmann et al. (2007) point out the significance of
the terms-of-trade shocks on the measure of export sophistication (PRODY). Similarly, terms-
of-trade shocks can be the significant determinant of cross-country export quality differences,
and therefore, it is expected that there would be a positive relationship between the terms-of-
trade level and the growth rate of export quality.
Third, we control for the extremal (trade) balance on goods and services (percent of
GDP) in the benchmark regressions. According to Hallak and Schott (2011), export basket
quality is closely related to external trade balance, which can be seen as a strong indicator of
competitiveness in global markets. Therefore, a negative relationship between external trade
imbalances and the growth rate of the export quality should be expected.
Fourth, we control for the age-dependency ratio (percent of the working-age population)
in the benchmark regressions to capture the potential capabilities and skills of a country. For
instance, Sutton and Trefler (2016) emphasize that export quality is associated with the
capabilities of a country, and therefore, it is expected that the age-dependency ratio would be
negatively associated with the growth rate of export quality.
Fifth, we control for the capital-labor ratio, which is calculated from the PWT 8.1 data
set in the benchmark regressions. According to Schott (2004), the capital-labor ratio, as a
benchmark measure of productivity (physical capital per worker), is one of the significant
determinants of export quality. Therefore, it is expected that the capital-labor ratio is positively
related to the growth rate of export quality. After implementing this set of robustness exercises,
12
we once again observe that the results for the diversification indexes of export products are
quite similar to those for the benchmark regressions.
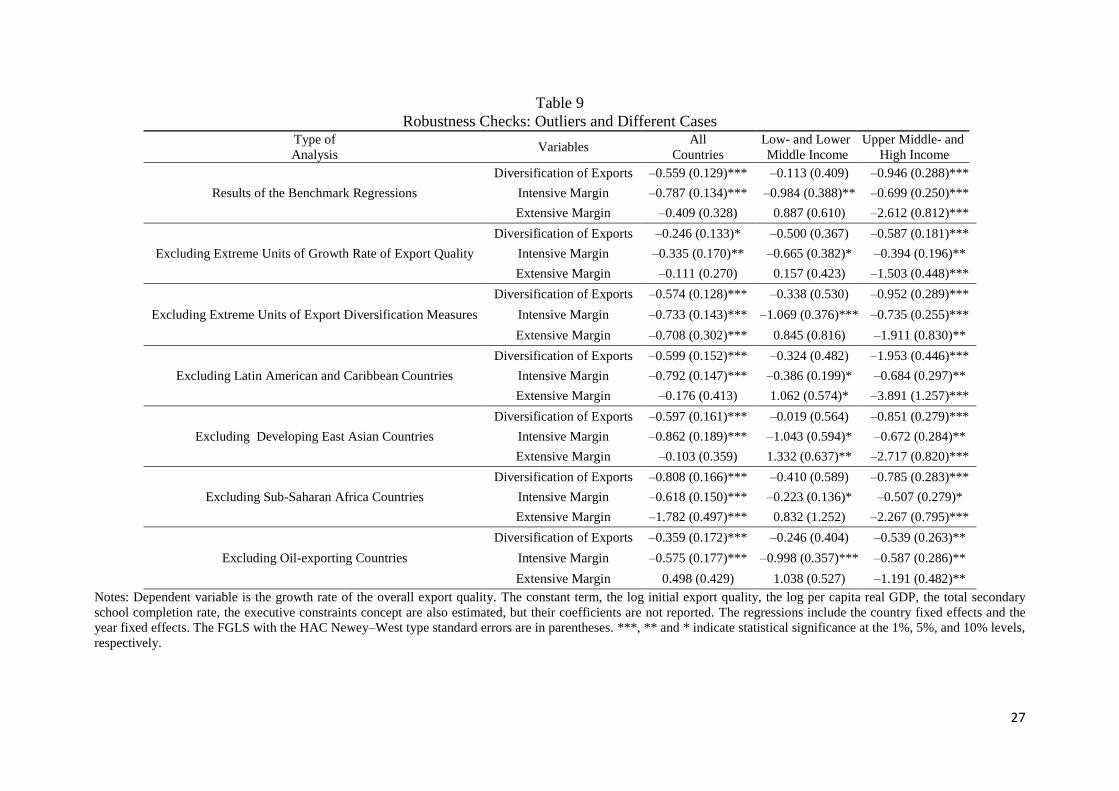
5.4. Robustness to Outliers and the Different Cases
Our next set of robustness exercises involves excluding the extreme observations for the growth
rate of export quality and the measures of export product diversification. Following previous
empirical papers (e.g., Bergh and Nilsson, 2010; Gozgor and Ranjan, 2015), we define extreme
observations as those which are more than two standard deviations away from the average. As
reported in Table 9, the results are robust, i.e., they are similar to those for the benchmark
regressions.
[Insert Table 9 around here]
We also analyze that the effect of export diversification on export quality can be region-
specific, and therefore, we separately exclude the observations for Latin America and the
Caribbean, the developing East Asia, and Sub-Saharan African countries to check the
robustness of their findings. Following many empirical papers (e.g., Bergh and Nilsson, 2010;
Gozgor and Ranjan, 2015), we re-estimate our benchmark regressions by excluding
observations from Latin America and the Caribbean, the developing East Asia, and Sub-
Saharan Africa, one region of time. The results are robust to the exclusion of these regions, i.e.,
the results in the benchmark regressions are not specifically driven by the presence of
observations from any one of these regions (see Table 9).
Finally, we separately exclude the observations for the oil-exporting countries.
Following the IMF (2014a) and HPS (2015), we define oil-exporting countries as those
countries with more than 50 percent of their total exports consisting of fuels, and the relevant
data are obtained from the WDI data set by the World Bank. Excluding the oil-exporting
countries can be noteworthy because of previous evidence known as the natural resource curse
(e.g., Sachs and Warner 2001). The natural resource curse leads to the Dutch disease and a lack
of strong institutions in the economy and therefore suppresses export quality upgrading. The
results are also robust to the exclusion of the oil-exporting countries (see Table 9).
Shortly, the various robustness exercises indicate that the indexes of export product
diversification are negatively related to the growth rate of export quality as is the case in the
benchmark results in Tables 3, 4, and 5.
6. Conclusion
In this paper, we empirically examined the effects of export product diversification on the
growth rate of export quality in a panel data set of 115 countries for the period 1970 to 2010.
13
We used the data sets of overall export quality and three export diversification measures of the
International Monetary Fund: the extensive margin (variation in number of new products
exported), the intensive margin (variation in export values among existing exports), and the
overall (Theil) index.
We observed that export quality has been increasing with a higher variation in export
values among existing exports in low- and lower-middle-income countries. We also found that
export quality has been increasing with both a higher variation in export values among the
existing exports and new products exported in the upper-middle- and high-income countries.
The results are robust to the changing measures of controls in the benchmark model, the
inclusion of many other controls (various measures of globalization, country size, factor
endowments, macroeconomic stance, etc.), and the exclusion of outliers.
To sum up, our paper shows that export diversification promotes the upgrading of export
baskets, but it mainly affects countries which are already exporting higher-value products. The
main implication of our findings is that in the absence of initial product diversification, the
achievement of a higher growth rate on the quality of the export basket, thus converging the
world frontier, will be difficult. This issue may lead to a possible middle-income trap in upper-
middle-income countries and a possible secular stagnation in high-income countries. However,
we need more studies on the drivers of export quality upgrading and their effect on the growth
rate of real income to infer such a conclusion.
References
Aditya, A., and Acharyya R. (2013). Export Diversification, Composition, and Economic
Growth: Evidence from Cross-Country Analysis. Journal of International Trade and
Economic Development, 22 (7), 959–992.
Alcala, F., and Ciccone, A. (2004). Trade and Productivity. Quarterly Journal of Economics,
119 (2), 613–646.
Al-Marhubi, F. (2000). Export Diversification and Growth: An Empirical Investigation.
Applied Economics Letters, 7 (9), 559–562.
Amighini, A., and Sanfilippo, M. (2014). Impact of South-South FDI and Trade on the Export
Upgrading of African Economies. World Development, 64, 1–17.
Anand, R., Kochhar, K., and Mishra, S. (2015). Make in India: Which Exports Can Drive the
Next Wave of Growth? IMF Working Paper Series, No. 15/119, Washington, D.C.:
International Monetary Fund.
Anand, R., Mishra, S., and Spatafora, N. (2012). Structural Transformation and the
Sophistication of Production. IMF Working Paper Series, No. 12/59, Washington, D.C.:
International Monetary Fund.
Barro, R.J., and Lee, J.W. (2013). A New Data Set of Educational Attainment in the World,
1950–2010. Journal of Development Economics, 104, 184–198.
14
Bas, M., and Strauss-Khan, V. (2015). Input-trade Liberalization, Export Price and Quality
Upgrading. Journal of International Economics, 95 (2), 250–262.
Bergh, A., and Nilsson, T. (2010). Do Liberalization and Globalization Increase Income
Inequality? European Journal of Political Economy, 26 (4), 488–505.
Cadot, O., Celine, C., Strauss–Kahn, V. (2011). Export Diversification: What's behind the
Hump? Review of Economics and Statistics, 93 (2), 590–605.
Chen, N., and Juvenal, L. (2016). Quality and the Great Trade Collapse. IMF Working Paper
Series, No. 16/30, Washington, D.C.: International Monetary Fund.
Crino, R., and Ogliari, L. (2015). Financial Frictions, Product Quality, and International Trade.
CEPR Discussion Paper, No. 10555, London: Centre for Economic Policy Research.
De Pineres, S.A.G., and Ferrantino, M. (1997). Export Diversification and Structural Dynamics
in the Growth Process: The Case of Chile. Journal of Development Economics, 52 (2), 375–
391.
Dreher, A. (2006). Does Globalization Affect Growth? Evidence from a New Index of
Globalization. Applied Economics, 38 (10), 1091–1110.
Dreher, A., Gaston, N., and Martens, P. (2008). Measuring Globalisation – Gauging its
Consequences. New York City, NY: Springer.
Fan, H., Li, Y.A., and Yeaple, S.R. (2015). Trade Liberalization, Quality, and Export Prices.
Review of Economics and Statistics, 97 (5), 1033–1051.
Faruq, H.A. (2011). How Institutions Affect Export Quality. Economic Systems, 35 (4), 586–
606.
Feenstra, R.C., and Romalis, J. (2014). International Prices and Endogenous Quality. Quarterly
Journal of Economics, 129 (2), 477–527.
Feenstra, R.C., Inklaar, R., and Timmer, M.P. (2015). The Next Generation of the Penn World
Table. American Economic Review, 105 (10), 3150–3182.
Funke, M., and Ruhwedel, R. (2005). Export Variety and Economic Growth in East European
Transition Economies. Economics of Transition, 13 (1), 25–50.
Gnangnon, S.K., and Roberts, M. (2015). Aid for Trade, Foreign Direct Investment and Export
Upgrading in Recipient Countries. WTO Staff Working Paper, No. ERSD-2015–10, Geneva:
World Trade Organization.
Gozgor, G., and Can, M. (2016). Effects of the Product Diversification of Exports on Income
at Different Stages of Economic Development. Eurasian Business Review, 6 (2), 215–235.
Gozgor, G., and Ranjan, P. (2015). Globalization, Inequality, and Redistribution: Theory and
Evidence. CESifo Working Paper Series, No. 5522, Munich: Center for Economic Studies
and Ifo Institute.
Hallak, J.C. (2006). Product Quality and the Direction of Trade. Journal of International
Economics, 68 (1), 238–265.
Hallak, J.C., and Schott, P.K. (2011). Estimating Cross-Country Differences in Product Quality.
Quarterly Journal of Economics, 126 (1), 417–474.
Harding, T., and Javorcik, B. (2012). Foreign Direct Investment and Export Upgrading. Review
of Economics and Statistics, 94 (4), 964–980.
Hausmann, R., and Hidalgo, C.A. (2011). The Network Structure of Economic Output. Journal
of Economic Growth, 16 (4), 309–342.
Hausmann, R., Hidalgo, C.A., Bustos, S., Coscia, M., Chung, S., Jimerez, J., Simoes, A.,
Yıldırım, M.A. (2011). The Atlas of Economic Complexity: Mapping Paths to Prosperity.
Cambridge, MA: Center for International Development at Harvard University and Macro
Connections MIT Media Lab.
Hausmann, R., Hwang, J., and Rodrik, D. (2007). What You Export Matters. Journal of
Economic Growth, 12 (1), 1–25.
15
Henn, C., Papageorgiou, C., and Spatafora, N. (2013). Export Quality in Developing Countries.
IMF Working Paper Series, No. WP/13/108. Washington, D.C.: International Monetary
Fund.
Henn, C., Papageorgiou, C., and Spatafora, N. (2015). Export Quality in Advanced and
Developing Economies: Evidence from a New Dataset. WTO Working Paper, No. ERSD-
2015–02, Geneva: World Trade Organization.
Herzer, D., and Nowak-Lehmann, F.D. (2006). What Does Export Diversification Do for
Growth? An Econometric Analysis. Applied Economics, 38 (15), 1825–1838.
Hesse, H. (2008). Export Diversification and Economic Growth. The International Bank for
Reconstruction and Development / the World Bank Commission on Growth and
Development Working Paper, No.21. Washington, D.C.: World Bank.
Hummels, D., and Klenow, P.J. (2005). The Variety and Quality of a Nation's Exports.
American Economic Review, 95 (3), 704–723.
Iacovone, L., Rauch, F., and Winters, L.A. (2013). Trade as an Engine of Creative Destruction:
Mexican experience with Chinese competition. Journal of International Economics, 89 (2),
379–392.
International Monetary Fund (IMF) (2014a). Sustaining Long–Run Growth and
Macroeconomic Stability in Low-Income Countries–the Role of Structural Transformation
and Diversification. IMF Policy Paper, March 2014, Washington, D.C.: International
Monetary Fund.
International Monetary Fund (IMF) (2014b). The Diversification Toolkit: Export
Diversification and Quality Databases (Spring 2014), Last Updated: May 28, 2014,
https://www.imf.org/external/np/res/dfidimf/diversification.htm
Khandelwal, A. (2010). The Long and Short (of) Quality Ladders. Review of Economic Studies,
77 (4), 1450–1476.
Klinger, B., and Lederman, D. (2004). Discovery and Development: An Empirical Exploration
of 'New' Products. World Bank Policy Research Working Paper, No. 3450, Washington,
D.C.: World Bank.
Klinger, B., and Lederman, D. (2006). Diversification, Innovation, and Imitation inside the
Global Technology Frontier. World Bank Policy Research Working Paper, No. 3872,
Washington, D.C.: World Bank.
Lederman, D., and Maloney, W.F. (2012). Does What You Export Matter? In Search of
Empirical Guidance for Industrial Policies. Washington, D.C.: World Bank.
Martin, J., and Mejean I. (2014). Low-Wage Country Competition, and the Quality Content of
High-wage Country Exports. Journal of International Economics, 93 (1), 140–152.
Mau, K. (2015). Export Diversification and Income Differences Reconsidered: The Extensive
Product Margin in Theory and Application. Review of World Economics, 152 (2), 351–381.
Meinhard, S., and Portrafke, N. (2012). The Globalization-Welfare State Nexus Reconsidered.
Review of International Economics, 20 (2), 271–287.
Mishra, S., Lundstrom, S., and Anand, R. (2011). Service Export Sophistication and Economic
Growth. World Bank Policy Research Working Paper, No. 5606, Washington, D.C.: World
Bank.
Oladi, R., Beladi, H., and Chau, N. (2008). Multinational Corporations and Export Quality.
Journal of Economic Behavior and Organization, 65 (1), 147–155.
Papageorgiou, C., Spatafora, N. (2012). Economic Diversification in LICs; Stylized Facts and
Macroeconomic Implication. IMF Staff Discussion Notes, 12/13, Washington, D.C.:
International Monetary Fund.
Papageorgiou, C., Spatafora, N., and Wang, K. (2015). Diversification, Growth, and Volatility
in Asia. World Bank Policy Research Working Paper, No. 7380, Washington, D.C.: World
Bank.
16
Poncet, S., and de Waldemar, F.S. (2013). Export Upgrading and Growth: The Prerequisite of
Domestic Embeddedness, World Development, 51, 104–118.
Potrafke, N. (2015). The Evidence on Globalisation. The World Economy, 38 (3), 509–552.
Sachs, J.D., and Warner, A.M. (2001). The Curse of Natural Resources. European Economic
Review, 45 (4), 827–883.
Schott, P.K. (2004). Across-Product versus Within-Product Specialization in International
Trade. Quarterly Journal of Economics, 119 (2), 647–678.
Schott, P.K. (2008). The Relative Sophistication of Chinese Exports. Economic Policy, 23 (53),
5–49.
Shi, B. (2011). Extensive Margin Quantity and Price in China's Export Growth. China
Economic Review, 22 (2), 233–243.
Simoes, A.J.G., and Hidalgo, C.A. (2011). The Economic Complexity Observatory: An
Analytical Tool for Understanding the Dynamics of Economic Development. Scalable
Integration of Analytics and Visualization: Papers from the 2011 AAAI Workshop, No. WS–
11–17, Menlo Park, CA: The AAAI Press.
Sutton, J., and Trefler, D. (2016). Capabilities, Wealth and Trade. Journal of Political Economy,
124 (3), 826–878.
Wang, Z., and Wei S–J. (2010). What Accounts for the Rising Sophistication of China's
Exports?, China's Growing Role in World Trade, R.C. Feenstra and S–J Wei (Eds.), (pp. 63–
104), Chicago, IL: University of Chicago Press.
Xu, B. (2010). The Sophistication of Exports: Is China Special? China Economic Review, 21
(3), 482–493.
Zhu, S., and Fu, X. (2013). Drivers of Export Upgrading. World Development, 51, 211–233.

18
Figure 1
Dynamic Relationship between Product Diversification and Quality Upgrading of the Export Basket
19
Table 1
Descriptive Summary Statistics (1970–2010)
Variables Definition Data Source Mean Standard Deviation Minimum Maximum Observations
Export Quality Growth Rate Growth of Index IMF (2014b) & Henn et al. (2013, 2015) –0.005 0.104 –0.784 0.597 1241
Diversification of Exports Level of Index IMF (2014b) & Papageorgiou and Spatafora (2012) 3.624 1.269 1.019 6.436 1480
Extensive Margin Level of Index IMF (2014b) & Papageorgiou and Spatafora (2012 0.650 0.728 –0.064 5.064 1472
Intensive Margin Level of Index IMF (2014b) & Papageorgiou and Spatafora (2012 2.983 1.075 0.960 6.113 1475
Per Capita GDP (PPPs, Constant 2005US$) Logarithmic form PWT 8.1: Feenstra et al. (2015) 8.399 1.195 5.163 13.92 1365
Total Lower Secondary Completion Rate % of Relevant Age Group World Bank, World Development Indicators 53.92 32.75 0.650 113.8 558
Executive Constraints Concept Index from 1 to 7 Polity IV Annual Time Series 4.045 2.355 1.000 7.000 1266
Trade Openness (Merchandise Exports plus Imports / PPP GDP) Level, Ratio PWT 8.1: Feenstra et al. (2015) 51.02 56.78 0.110 1068 1365
Foreign Direct Investment, Net Inflows % of GDP World Bank, World Development Indicators 3.363 14.50 –19.77 466.5 1195
Economic Globalization Level of Index KOF: Dreher (2006), Dreher et al. (2008) 47.56 18.96 8.490 97.44 1252
Social Globalization Level of Index KOF: Dreher (2006), Dreher et al. (2008) 39.66 20.59 3.570 93.09 1609
Political Globalization Level of Index KOF: Dreher (2006), Dreher et al. (2008) 43.93 26.09 1.000 97.49 1668
Overall Globalization Level of Index KOF: Dreher (2006), Dreher et al. (2008) 42.97 17.18 11.77 91.69 1532
Population, Total Logarithmic form PWT 8.1: Feenstra et al. (2015) 1.620 1.990 –3.195 7.164 1365
Population Density (People per Square Km of Land Area) Logarithmic form World Bank, World Development Indicators 3.910 1.622 –1.996 9.916 1810
Land Area (Square Km) Logarithmic form World Bank, World Development Indicators 11.04 2.885 0.693 16.61 1820
Terms-of-Trade Level of Index PWT 8.1: Feenstra et al. (2015) 104.8 31.91 13.95 787.5 1365
External Balance on Goods and Services % of GDP World Bank, World Development Indicators –6.643 22.02 –310.5 93.25 1365
Age Dependency Ratio (% of Working–age Population) Level, Ratio World Bank, World Development Indicators 73.99 19.76 22.98 120.7 1709
Capital-Labor Ratio Level, Ratio PWT 8.1: Feenstra et al. (2015) 1.028 0.793 0.090 6.424 1025
Index of Human Capital per Person Level of Index PWT 8.1: Feenstra et al. (2015) 2.123 0.610 1.040 3.583 1108
Economic Complexity Index Level of Index Atlas of Economic Complexity: Hausmann et al. (2011) –0.009 1.059 –2.829 2.695 987
Civil Liberties Ratings (1 Representing the Most Free; 7 the Least Free) Index from 1 to 7 Freedom House, Freedom in the World Database 3.790 1.921 1.000 7.000 1192
Level of Institutionalized Democracy Index from 0 to 10 Polity IV Annual Time Series 4.062 4.186 0.000 10.00 1266
20
Table 2
Correlation Matrix
Regressors Export Quality
Growth
Export
Diversification
Extensive
Margin
Intensive
Margin
Log Per
Capita GDP
Lower Secondary
Completion Rate
Executive
Constraints Concept
Export Quality Growth 1.000 – – – – – –
Export Diversification –0.075 1.000 – – – – –
Extensive Margin –0.074 0.582 1.000 – – – –
Intensive Margin –0.044 0.848 0.063 1.000 – – –
Log Per Capita GDP 0.105 –0.475 –0.193 –0.457 1.000 – –
Lower Secondary Completion Rate 0.156 –0.553 –0.401 –0.417 0.721 1.000 –
Executive Constraints Concept 0.168 –0.529 –0.387 –0.396 0.446 0.516 1.000
21
Table 3
Benchmark Regressions: Determinants of the Export Quality Growth (1970–2010)
Regressors (I) (II) (III)
Log Initial Export Quality –0.131 (0.016)*** –0.136 (0.015)*** –0.118 (0.016)***
Log per Capita Real GDP 0.358 (0.203)* 0.408 (0.157)*** 0.493 (0.192)**
Human Capital (Lower Secondary Completion Rate) 0.020 (0.005)*** 0.022 (0.006)*** 0.020 (0.007)***
Institutional Quality (Executive Constraints Concept) 0.469 (0.082)*** 0.469 (0.083)*** 0.490 (0.092)***
Product Diversification of Exports –0.559 (0.129)*** – –
Product Intensive Margin – –0.787 (0.134)*** –
Product Extensive Margin – – –0.409 (0.328)
Constant Term 0.202 (0.192) 0.100 (0.184) 0.496 (0.190)***
Year Fixed Effects Yes Yes Yes
Country Fixed Effects Yes Yes Yes
Observations 403 403 403
Number of Countries 115 115 115
R–Squared 0.270 0.271 0.277 Notes: Dependent variable is the growth rate of the overall export quality index. Regressions include the country and the year fixed effects. The Feasible Generalized Least
Squares (FGLS) with the Heteroskedastic and Autocorrelation Consistent (HAC) Newey–West type standard errors are in parentheses. ***, ** and * indicate statistical
significance at the 1%, 5%, and 10% levels, respectively.
22
Table 4
Benchmark Regressions: Low- and Lower Middle Income Economies (1970–2010)
Regressors (I) (II) (III)
Log Initial Export Quality –0.088 (0.023)*** –0.098 (0.022)*** –0.085 (0.025)***
Log per Capita Real GDP –1.947 (0.609)*** –2.065 (0.581)*** –1.799 (0.636)***
Human Capital (Total Lower Secondary Completion Rate) 0.048 (0.016)*** 0.050 (0.015)*** 0.049 (0.016)***
Institutional Quality (Executive Constraints Concept) 0.286 (0.188) 0.245 (0.166) 0.442 (0.194)**
Product Diversification of Exports –0.113 (0.409) – –
Product Intensive Margin – –0.984 (0.388)** –
Product Extensive Margin – – 0.887 (0.610)
Year Fixed Effects Yes Yes Yes
Country Fixed Effects Yes Yes Yes
Observations 204 204 204
Number of Countries 54 54 54
R–Squared 0.158 0.164 0.165 Notes: Dependent variable is the growth rate of the overall export quality. The constant term is estimated, but not reported. Regressions include the country and the year fixed
effects. The FGLS with the HAC Newey–West type standard errors are in parentheses. *** and ** indicate statistical significance at the 1% and 5% levels, respectively.
23
Table 5
Benchmark Regressions: Upper Middle- and High Income Economies (1970–2010)
Regressors (I) (II) (III)
Log Initial Export Quality –0.225 (0.027)*** –0.196 (0.024)*** –0.215 (0.025)***
Log per Capita Real GDP 1.258 (0.413)* 1.160 (0.346)*** 1.627 (0.378)***
Human Capital (Total Lower Secondary Completion Rate) 0.048 (0.011)*** 0.042 (0.010)*** 0.019 (0.011)*
Institutional Quality (Executive Constraints Concept) 0.743 (0.139)*** 0.697 (0.133)*** 0.546 (0.139)***
Product Diversification of Exports –0.946 (0.288)*** – –
Product Intensive Margin – –0.699 (0.250)*** –
Product Extensive Margin – – –2.612 (0.812)***
Year Fixed Effects Yes Yes Yes
Country Fixed Effects Yes Yes Yes
Observations 199 199 199
Number of Countries 61 61 61
R–Squared 0.558 0.564 0.561 Notes: Dependent variable is the growth rate of the overall export quality. The constant term is estimated, but not reported. Regressions include the country and the year fixed
effects. The FGLS with the HAC Newey–West type standard errors are in parentheses. ***, ** and * indicate statistical significance at the 1%, 5%, and 10% levels, respectively.
24
Table 6
Robustness Checks: Changing Measures of Controls Type of
Analysis Variables
All
Countries
Low- and Lower
Middle Income
Upper Middle- and
High Income
Results of the Benchmark Regressions
Diversification of Exports –0.559 (0.129)*** –0.113 (0.409) –0.946 (0.288)***
Intensive Margin –0.787 (0.134)*** –0.984 (0.388)** –0.699 (0.250)***
Extensive Margin –0.409 (0.328) 0.887 (0.610) –2.612 (0.812)***
Diversification of Exports –0.603 (0.211)*** –0.324 (0.506) –1.097 (0.331)***
Including per Capita GDP Squared Intensive Margin –0.845 (0.248)*** –0.418 (0.234)* –0.671 (0.252)***
Extensive Margin –0.299 (0.424) 0.982 (0.586)* –2.831 (0.813)***
Replacing Total Lower Secondary Completion Rate
with Human Capital Index in PWT 8.1
Diversification of Exports –0.625 (0.149)*** –0.448 (0.426) –0.884 (0.208)***
Intensive Margin –0.614 (0.186)*** –0.433 (0.266)* –0.768 (0.221)***
Extensive Margin –1.029 (0.332)*** 0.112 (0.623) –2.535 (0.534)***
Replacing Total Lower Secondary Completion Rate
with Economic Complexity Index
Diversification of Exports –0.379 (0.158)** –0.075 (0.522) –0.507 (0.178)***
Intensive Margin –0.430 (0.195)** –0.275 (0.151)* –0.390 (0.212)*
Extensive Margin –0.377 (0.337) 0.552 (0.680) –0.991 (0.458)**
Replacing Executive Constraints Concept
with Civil Liberties Ratings
Diversification of Exports –0.628 (0.128)*** –0.755 (0.414)* –0.948 (0.250)***
Intensive Margin –0.751 (0.157)*** –1.329 (0.393)*** –0.550 (0.259)**
Extensive Margin –0.084 (0.359) 0.835 (0.643) –2.579 (0.585)***
Diversification of Exports –0.608 (0.104)*** –0.260 (0.403) –1.025 (0.300)***
Replacing Executive Constraints Concept with Democracy Index Intensive Margin –0.876 (0.154)*** –0.929 (0.356)*** –0.778 (0.247)***
Extensive Margin –0.453 (0.402) 0.875 (0.605) –3.070 (0.778)***
Notes: Dependent variable is the growth rate of the overall export quality. The constant term and the log initial export quality are also estimated, but their coefficients are not
reported. The regressions include the country fixed effects and the year fixed effects. The FGLS with the HAC Newey–West type standard errors are in parentheses. ***, **
and * indicate statistical significance at the 1%, 5%, and 10% levels, respectively.
25
Table 7
Robustness Checks: The Inclusion of Globalization Measures Type of
Analysis Variables
All
Countries
Low- and Lower
Middle Income
Upper Middle- and
High Income
Results of the Benchmark Regressions
Diversification of Exports –0.559 (0.129)*** –0.113 (0.409) –0.946 (0.288)***
Intensive Margin –0.787 (0.134)*** –0.984 (0.388)** –0.699 (0.250)***
Extensive Margin –0.409 (0.328) 0.887 (0.610) –2.612 (0.812)***
Controlling Globalization: Including Trade Openness
Diversification of Exports –0.538 (0.115)*** –0.175 (0.392) –1.201 (0.292)***
Intensive Margin –0.713 (0.139)*** –0.905 (0.367)** –1.148 (0.337)***
Extensive Margin –0.325 (0.358) 0.713 (0.604) –2.558 (0.801)***
Controlling Globalization: Including Foreign Direct Investment (FDI)
Diversification of Exports –0.728 (0.165)*** –0.824 (0.306)*** –0.580 (0.282)**
Intensive Margin –1.102 (0.156)*** –1.133 (0.318)*** –0.196 (0.105)*
Extensive Margin –0.394 (0.345) 0.853 (0.578) –1.162 (0.579)**
Controlling Globalization: Including Both Trade Openness and FDI
Diversification of Exports –0.599 (0.180)*** –0.809 (0.289)*** –0.683 (0.295)***
Intensive Margin –0.913 (0.183)*** –1.080 (0.333)** –0.014 (0.006)**
Extensive Margin –0.275 (0.385) 0.733 (0.573) –1.368 (0.745)*
Controlling Globalization: Including Economic Globalization Index
Diversification of Exports –0.600 (0.140)*** –0.442 (0.374) –1.118 (0.212)***
Intensive Margin –0.659 (0.153)*** –0.787 (0.352)** –0.798 (0.314)**
Extensive Margin 0.019 (0.383) 0.633 (0.556) –2.353 (0.537)***
Controlling Globalization: Including Social Globalization Index
Diversification of Exports –0.360 (0.141)** –0.014 (0.467) –1.014 (0.282)***
Intensive Margin –0.476 (0.172)*** –0.857 (0.432)** –0.487 (0.274)*
Extensive Margin –0.444 (0.418) 1.244 (0.650)* –2.355 (0.821)***
Diversification of Exports –0.519 (0.156)*** –0.187 (0.394) –1.073 (0.308)***
Controlling Globalization: Including Political Globalization Index Intensive Margin –0.866 (0.179)*** –0.820 (0.356)** –0.682 (0.253)***
Extensive Margin –0.023 (0.360) 1.124 (0.640)* –2.335 (0.772)***
Diversification of Exports –0.482 (0.124)*** –0.157 (0.429) –1.054 (0.292)***
Controlling Globalization: Including Overall Globalization Index Intensive Margin –0.545 (0.127)*** –0.773 (0.420)* –0.557 (0.335)*
Extensive Margin –0.155 (0.394) 0.998 (0.615) –2.490 (0.814)***
Notes: Dependent variable is the growth rate of the overall export quality. The constant term, the log initial export quality, the log per capita real GDP, the total lower secondary
completion rate, the executive constraints concept are also estimated, but their coefficients are not reported. The regressions include the country fixed effects and the year fixed
effects. The FGLS with the HAC Newey–West type standard errors are in parentheses. ***, ** and * indicate statistical significance at the 1%, 5%, and 10% levels, respectively.
26
Table 8
Robustness Checks: The Inclusion of Other Controls Type of
Analysis Variables
All
Countries
Low- and Lower
Middle Income
Upper Middle- and
High Income
Results of the Benchmark Regressions
Diversification of Exports –0.559 (0.129)*** –0.113 (0.409) –0.946 (0.288)***
Intensive Margin –0.787 (0.134)*** –0.984 (0.388)** –0.699 (0.250)***
Extensive Margin –0.409 (0.328) 0.887 (0.610) –2.612 (0.812)***
Controlling Country Size: Including Log Population
Diversification of Exports –0.650 (0.130)*** –0.246 (0.491) –1.039 (0.298)***
Intensive Margin –0.787 (0.151)*** –0.335 (0.217)* –0.694 (0.281)***
Extensive Margin –0.344 (0.283) 0.983 (0.632) –2.525 (0.811)***
Controlling Country Size: Including Log Population Density
Diversification of Exports –0.584 (0.173)*** –0.276 (0.375) –1.333 (0.292)***
Intensive Margin –0.754 (0.202)*** –0.785 (0.315)** –0.744 (0.298)**
Extensive Margin –0.293 (0.425) 0.777 (0.493) –2.349 (0.705)***
Controlling Country Size: Including Log Land Area
Diversification of Exports –0.560 (0.150)*** –0.150 (0.406) –1.493 (0.240)***
Intensive Margin –0.690 (0.183)*** –0.933 (0.379)** –0.794 (0.231)***
Extensive Margin –0.326 (0.382) 1.003 (0.655) –2.474 (0.717)***
Other Controls: Including Terms-of-Trade
Diversification of Exports –0.440 (0.132)*** –0.100 (0.466) –0.924 (0.284)***
Intensive Margin –0.632 (0.177)*** –0.804 (0.486)* –0.671 (0.248)***
Extensive Margin –0.545 (0.422) 0.962 (0.693) –2.551 (0.788)***
Diversification of Exports –0.550 (0.129)*** –0.230 (0.413) –1.096 (0.308)***
Other Controls: Including External Balance on Goods and Services Intensive Margin –0.791 (0.149)*** –0.928 (0.387)** –0.885 (0.283)***
Extensive Margin –0.398 (0.353) 0.800 (0.627) –2.707 (0.806)***
Other Controls: Including Age Dependency Ratio
Diversification of Exports –0.517 (0.175)*** –0.068 (0.423) –0.770 (0.287)***
Intensive Margin –0.764 (0.193)*** –0.987 (0.426)** –0.400 (0.207)*
Extensive Margin 0.248 (0.452) 0.892 (0.612) –2.198 (0.861)**
Other Controls: Including Capital-Labor Ratio
Diversification of Exports –0.328 (0.185)* –0.345 (0.485) –0.386 (0.197)*
Intensive Margin –0.559 (0.236)** –1.288 (0.446)*** –0.011 (0.006)*
Extensive Margin –0.049 (0.452) 1.430 (0.631)** –1.231 (0.691)*
Notes: Dependent variable is the growth rate of the overall export quality. The constant term, the log initial export quality, the log per capita real GDP, the total lower secondary
completion rate, the executive constraints concept are also estimated, but their coefficients are not reported. The regressions include the country fixed effects and the year fixed
effects. The FGLS with the HAC Newey–West type standard errors are in parentheses. ***, ** and * indicate statistical significance at the 1%, 5%, and 10% levels, respectively.
27
Table 9
Robustness Checks: Outliers and Different Cases Type of
Analysis Variables
All
Countries
Low- and Lower
Middle Income
Upper Middle- and
High Income
Results of the Benchmark Regressions
Diversification of Exports –0.559 (0.129)*** –0.113 (0.409) –0.946 (0.288)***
Intensive Margin –0.787 (0.134)*** –0.984 (0.388)** –0.699 (0.250)***
Extensive Margin –0.409 (0.328) 0.887 (0.610) –2.612 (0.812)***
Excluding Extreme Units of Growth Rate of Export Quality
Diversification of Exports –0.246 (0.133)* –0.500 (0.367) –0.587 (0.181)***
Intensive Margin –0.335 (0.170)** –0.665 (0.382)* –0.394 (0.196)**
Extensive Margin –0.111 (0.270) 0.157 (0.423) –1.503 (0.448)***
Excluding Extreme Units of Export Diversification Measures
Diversification of Exports –0.574 (0.128)*** –0.338 (0.530) –0.952 (0.289)***
Intensive Margin –0.733 (0.143)*** –1.069 (0.376)*** –0.735 (0.255)***
Extensive Margin –0.708 (0.302)*** 0.845 (0.816) –1.911 (0.830)**
Excluding Latin American and Caribbean Countries
Diversification of Exports –0.599 (0.152)*** –0.324 (0.482) –1.953 (0.446)***
Intensive Margin –0.792 (0.147)*** –0.386 (0.199)* –0.684 (0.297)**
Extensive Margin –0.176 (0.413) 1.062 (0.574)* –3.891 (1.257)***
Excluding Developing East Asian Countries
Diversification of Exports –0.597 (0.161)*** –0.019 (0.564) –0.851 (0.279)***
Intensive Margin –0.862 (0.189)*** –1.043 (0.594)* –0.672 (0.284)**
Extensive Margin –0.103 (0.359) 1.332 (0.637)** –2.717 (0.820)***
Excluding Sub-Saharan Africa Countries
Diversification of Exports –0.808 (0.166)*** –0.410 (0.589) –0.785 (0.283)***
Intensive Margin –0.618 (0.150)*** –0.223 (0.136)* –0.507 (0.279)*
Extensive Margin –1.782 (0.497)*** 0.832 (1.252) –2.267 (0.795)***
Excluding Oil-exporting Countries
Diversification of Exports –0.359 (0.172)*** –0.246 (0.404) –0.539 (0.263)**
Intensive Margin –0.575 (0.177)*** –0.998 (0.357)*** –0.587 (0.286)**
Extensive Margin 0.498 (0.429) 1.038 (0.527) –1.191 (0.482)**
Notes: Dependent variable is the growth rate of the overall export quality. The constant term, the log initial export quality, the log per capita real GDP, the total secondary
school completion rate, the executive constraints concept are also estimated, but their coefficients are not reported. The regressions include the country fixed effects and the
year fixed effects. The FGLS with the HAC Newey–West type standard errors are in parentheses. ***, ** and * indicate statistical significance at the 1%, 5%, and 10% levels,
respectively.
28
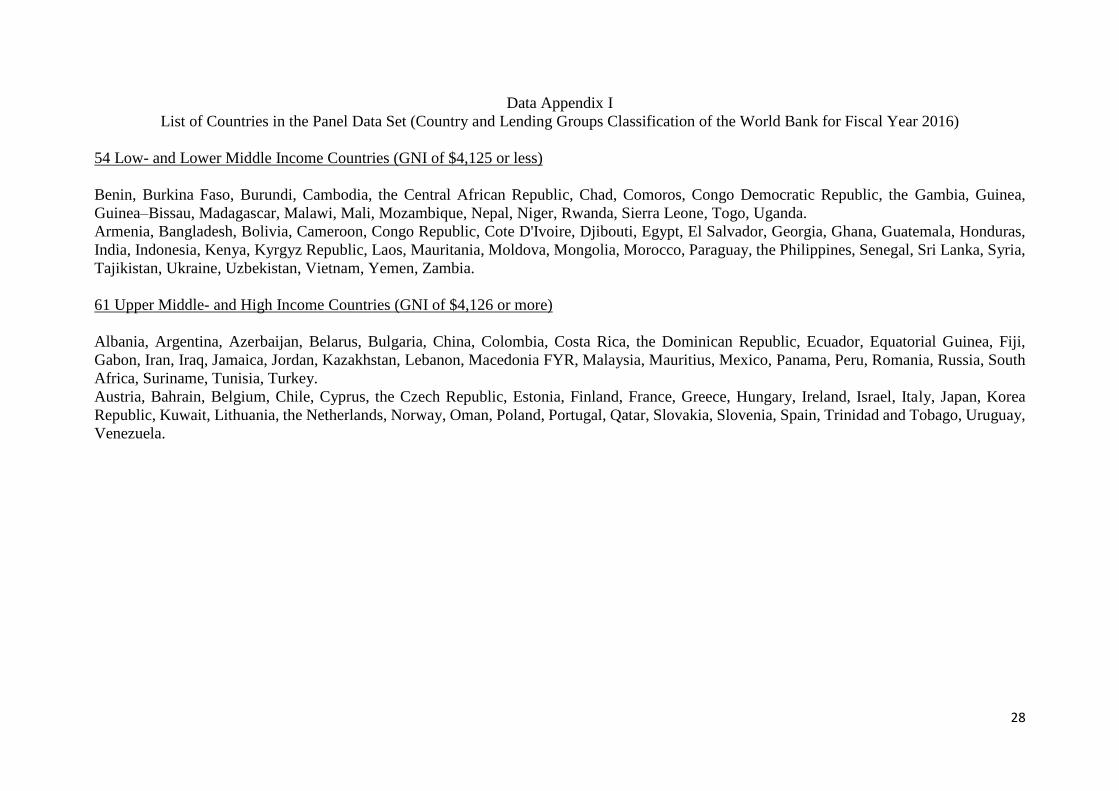
Data Appendix I
List of Countries in the Panel Data Set (Country and Lending Groups Classification of the World Bank for Fiscal Year 2016)
54 Low- and Lower Middle Income Countries (GNI of $4,125 or less)
Benin, Burkina Faso, Burundi, Cambodia, the Central African Republic, Chad, Comoros, Congo Democratic Republic, the Gambia, Guinea,
Guinea–Bissau, Madagascar, Malawi, Mali, Mozambique, Nepal, Niger, Rwanda, Sierra Leone, Togo, Uganda.
Armenia, Bangladesh, Bolivia, Cameroon, Congo Republic, Cote D'Ivoire, Djibouti, Egypt, El Salvador, Georgia, Ghana, Guatemala, Honduras,
India, Indonesia, Kenya, Kyrgyz Republic, Laos, Mauritania, Moldova, Mongolia, Morocco, Paraguay, the Philippines, Senegal, Sri Lanka, Syria,
Tajikistan, Ukraine, Uzbekistan, Vietnam, Yemen, Zambia.
61 Upper Middle- and High Income Countries (GNI of $4,126 or more)
Albania, Argentina, Azerbaijan, Belarus, Bulgaria, China, Colombia, Costa Rica, the Dominican Republic, Ecuador, Equatorial Guinea, Fiji,
Gabon, Iran, Iraq, Jamaica, Jordan, Kazakhstan, Lebanon, Macedonia FYR, Malaysia, Mauritius, Mexico, Panama, Peru, Romania, Russia, South
Africa, Suriname, Tunisia, Turkey.
Austria, Bahrain, Belgium, Chile, Cyprus, the Czech Republic, Estonia, Finland, France, Greece, Hungary, Ireland, Israel, Italy, Japan, Korea
Republic, Kuwait, Lithuania, the Netherlands, Norway, Oman, Poland, Portugal, Qatar, Slovakia, Slovenia, Spain, Trinidad and Tobago, Uruguay,
Venezuela.