effects of different metals on photosynthesis: cadmium and zinc … 1.pdf · the chosen...
TRANSCRIPT

International Journal of
Molecular Sciences
Article
Effects of Different Metals on Photosynthesis:Cadmium and Zinc Affect Chlorophyll Fluorescencein Durum Wheat
Momchil Paunov 1, Lyubka Koleva 2, Andon Vassilev 2,*, Jaco Vangronsveld 3 ID
and Vasilij Goltsev 1
1 Department of Biophysics and Radiobiology, Faculty of Biology, Sofia University, 1164 Sofia, Bulgaria;[email protected] (M.P.); [email protected] (V.G.)
2 Department of Plant Physiology and Biochemistry, Agricultural University, 4000 Plovdiv, Bulgaria;[email protected]
3 Centre for Environmental Sciences, Hasselt University, 3590 Diepenbeek, Belgium;[email protected]
* Correspondence: [email protected]
Received: 15 January 2018; Accepted: 7 March 2018; Published: 9 March 2018
Abstract: A comparative study of the effects of exposure to high Cd2+ (50 µM) and excess Zn2+
(600 µM) on photosynthetic performance of hydroponically-grown durum wheat seedlings wasperformed. At day 8, Cd and Zn were added to the nutrient solution. After 7-days exposure,the chosen concentrations of both metals resulted in similar relative growth rate (RGR) inhibitionsof about 50% and comparable retardations of the CO2 assimilation rates (about 30%) in the seconddeveloped leaf of wheat seedlings. Analysis of chlorophyll a fluorescence indicated that both metalsdisturbed photosynthetic electron transport processes which led to a 4- to 5-fold suppression ofthe efficiency of energy transformation in Photosystem II. Non-specific toxic effects of Cd andZn, which prevailed, were an inactivation of part of Photosystem II reaction centres and theirtransformation into excitation quenching forms as well as disturbed electron transport in theoxygen-evolving complex. The specificity of the Cd and Zn modes of action was mainly expressedin the intensity of the toxicity effects: despite the similar inhibitions of the CO2 assimilation rates,the wheat photochemistry showed much more sensitivity to Cd than to Zn exposure.
Keywords: photosynthesis; chlorophyll fluorescence; cadmium; zinc
1. Introduction
Metal contamination is one of the most important environmental problems. It is mostly dueto industrial and agricultural activities, such as smelter and incinerator emissions, traffic, dispersalof mining wastes, use of contaminated sewage sludges, manures, phosphate fertilizers, etc. [1,2].Cadmium (Cd) and zinc (Zn) are among the most problematic metals, creating potential risks for bothplant production and animal and human health.
Most studies on plant–metal interactions are focused on the processes involved in metal ionuptake and accumulation in the harvestable crop parts as well as on metal-induced phytotoxicity.Cadmium has no known biological functions, but is easily taken up by plants [3,4]. From plants,it may accumulate into food chains, where it may, for example, cause harmful effects on humanhealth. Yet there exist a few reports demonstrating a possible biological role of Cd in plants: as asubstitute for Zn in the Zn/Cd hyperaccumulator Sedum alfredii [5] as well as a feeding deterrentagainst Frankliniella occidentalis (thrips) in the hyperaccumulator Thlaspi caerulescens ([6] and referencestherein). Cadmium may also provoke significant phytotoxic effects even in relatively low tissue
Int. J. Mol. Sci. 2018, 19, 787; doi:10.3390/ijms19030787 www.mdpi.com/journal/ijms

Int. J. Mol. Sci. 2018, 19, 787 2 of 13
concentrations (micro-element range). Different from Cd, Zn is an essential element for all plants,but excess Zn induces functional disorders in plants. The phytotoxicity threshold for Zn concentrationsin plant tissues are in the range of 200–500 mg kg−1 [7,8].
The visible toxicity symptoms in Cd- and Zn-exposed plants are similar: inhibited germination,stunted growth, leaf chlorosis, necrotic spots, etc. [9,10]. The described toxic effects of both metals oncardinal physiological processes in plants, such as photosynthesis, water relations, mineral nutrition,dark respiration, etc. are also comparable [11–16]. For example, it has been shown that both metalscan induce similar or identical disturbances of photosynthesis at different structural-functional levels:pigments and light capture, thylakoid ultrastructure and photosynthetic electron transport, stomatalconductance and access of CO2, activities of Calvin cycle enzymes, etc. [11,17–19].
Cadmium and Zn-induced effects in the light-dependent photosynthetic processes have beenstudied in both in vitro and in vivo conditions [20–23]. In in vitro studies, it was established that bothmetals can significantly decrease the activities of photosystem II (PSII) and, to lesser extent, also ofphotosystem I (PSI) as well as the rate of photosynthetic electron transport [17,24]. However, in vivostudies obtained by chlorophyll a fluorescence (ChlF) techniques repeatedly reported that thephotochemical reactions are not so sensitive to Cd and Zn than Calvin’s cycle reactions [19,25,26].Partially, this inconsistency could be explained by the fact that in vitro studies are performed withoutsubstrate limitation and occurrence of feedback inhibition, while in vivo the metal-induced alterationsin primary C metabolism may lead to a down-regulation of PSII activity [21,25,27]. Hence, the effectsof high Cd and excess Zn concentrations on the light-dependent photosynthetic processes are still notfully understood.
The most common and widely used ChlF analyses are performed on dark- and light-adaptedleaf samples, and subsequently different parameters characterizing the steady-state status of thephotosynthetic apparatus are calculated [28]. More recently, the so-called JIP-test was introduced inchlorophyll fluorescence analyses [29]. The JIP-test is based on measurements of ChlF fast kineticsand on analysis of signals providing detailed information on the structure and function of thephotosynthetic apparatus (PSA), primarily PSII. The models underlying the JIP-test describe theprimary photosynthetic reactions by taking into account the structure of PSA in full consistency with thetheory of energy fluxes occurring in the thylakoid membrane between the complexes of photosyntheticpigments in PSII [30,31]. In the past few years, this test was widely used for plant performancetesting under stressful conditions [31–34]. For example, it has been applied for the evaluationof plant performance under conditions of light [35], chilling [36,37], high temperature [38–40],and drought [41–44] stress. More recently, the JIP test was also applied to evaluate the photosyntheticperformance of plants exposed to different metals [45–48]. Unfortunately, until now, the JIP-testinformation published for plants exposed to excess Zn is very scant. The available JIP-test informationfor Cd-exposed maize plants was obtained in conditions that did not induce growth inhibition [48].
Despite the relatively rich dataset concerning effects of high Cd and excess Zn concentrations onplant performance, it is obvious that there are still many open questions. For example, it is still notclear enough whether these metals may cause specific effects on photosynthesis or not. Consideringthe fact that the biological functions of these metals are completely different, it is reasonable to expecttheir impact on plant performance also to differ. Unfortunately, comparative studies on Cd- andZn-induced phytotoxicity effects are scarce. Considering the lack of sufficient and detailed informationconcerning in vivo measured effects of Cd and Zn on primary photosynthetic processes, we decided toperform a comparative study. To compare the phytotoxic effects of non-essential (Cd) and essential (Zn)elements, our experimental design consisted of exposing plants to external Cd and Zn concentrationsthat produced identical inhibition of plant growth.
2. Results
The wheat seedlings exposed to 50 µM Cd2+ and 600 µM Zn2+ in the medium manifested cleartoxicity symptoms, such as the appearance of chlorotic and necrotic leaf spots, weaker development of

Int. J. Mol. Sci. 2018, 19, 787 3 of 13
side roots, and root browning [2,10]. There were some differences in the visible toxicity symptomsin the leaves of Zn- and Cd-exposed plants. While Zn caused necrotic spots, Cd induced chlorosis.Exposure to Cd resulted in browning and a stronger inhibition of root length growth and branching,whereas Zn exposure lead to roots that were lighter in color and thinner in diameter.
Dry weight increase and RGR of Cd- and Zn-exposed wheat seedlings were inhibited byapproximately 50%, while their net photosynthetic rate (A) was about 35% lower (Table 1). The mineralanalysis revealed that both Cd and Zn concentrations in the roots of exposed plants (936 mg Cd kg−1
dry weight and 3029 mg Zn kg−1 dry weight) were several-fold higher than those in the leaves (150 mgCd kg−1 dry weight and 880 mg Zn kg−1 dry weight). Cadmium and Zn exposure strongly diminishedchlorophyll and carotenoid concentrations (Table 2). The decreases of chlorophyll a concentrations dueto Cd and Zn exposure were higher than 50%, while chlorophyll b was less affected. Cadmium tendedto inhibit the chlorophyll b concentration a bit more than Zn (although not significant). The totalcarotenoid concentration was more inhibited by Zn.
Table 1. Effects of Cd and Zn on growth parameters (DW—fresh weight, RGR—relative growth rate)and net photosynthetic rate (A) of durum wheat plants.
TreatmentsParameters
DW(mg plant−1) Inhibition %
RGR(mg g DW−1 day−1) Inhibition %
A(µmol CO2 m−2 s−1) Inhibition %
Control 484 a 0 140.6 a 0 6.02 a 0Cd 50 µM 271 b 55 68.8 b 51 3.94 b 35Zn 600 µM 252 b 58 64.1 b 53 4.02 b 33
Values followed by different letters (a, b) within a column are significantly different at p < 0.05.
Table 2. Effects of Cd and Zn on photosynthetic pigments content in durum wheat plants.
TreatmentsPhotosynthetic Pigments Content (mg g FW−1)
Chlorophyll a Inhibition % Chlorophyll b Inhibition % Carotenoids Inhibition %
Control 1.77 a 0 0.70 a 0 0.47 a 0Cd 50 µM 0.85 b 52 0.48 b 31 0.32 b 32Zn 600 µM 0.80 b 55 0.53 b 24 0.26 c 45
Values followed by different letters (a, b, c) within a column are significantly different at p < 0.05.
The similar inhibitions of both RGR and A in Cd- and Zn-exposed wheat seedlings provided agood opportunity to compare the toxic effects of these metals more in detail.
The state of the light-dependent photosynthetic processes in Cd- and Zn-exposed wheat plantswas analyzed applying the JIP test. This approach allows monitoring of molecular processes occurringat the level of the photosynthetic machinery during the light phase in leaves: energy migration betweenneighboring photosynthetic units and electron transfer reactions at donor and acceptor sites of bothPSII and PSI and between them [49,50]. The induction curves of chlorophyll fluorescence recorded for1 s in dark-adapted plants are shown in Figure 1A. The increase of the initial chlorophyll fluorescencelevel (FO), the decrease of the maximal level (FM), and the change of the transient’s shape are clearlyvisible in the exposed plants compared to the non-exposed control. All these effects show that thephotosynthetic process is strongly affected by metal exposure. The FO rise indicates decreased energytrapping efficiency of PSII. The reduced efficiency of the energy transfer from the antenna to the RCwas demonstrated by Havaux [51] and Yamane et al. [52] for heat-stressed photosynthesizing leaves.The former could be due to the metals disturbing the structure of the RC complexes and the latterbecause of swelling of the thylakoid membranes due to hygroscopic or charge shielding action ofthe divalent metal ions leading to a pulling apart of the complexes, lowering the energy transferefficiency. The measured maximal level of chlorophyll fluorescence (FM) is a complex parameterthat is dependent on the structural leaf tissue characteristics determining actinic light absorption,reflection, and reabsorption of emitted chlorophyll fluorescence including the chlorophyll content

Int. J. Mol. Sci. 2018, 19, 787 4 of 13
in the leaf (see [31] and the references therein). The FM decline could be partly related to a reducedchlorophyll a concentration which is observed in metal exposed plants (Table 2). The presence ofchlorophyll fluorescence quenchers could lower FM as well. Such molecules could be endogenouslike carotenoids or exogenous like oxygen. However, in exposed plants the carotenoid contentsdecreased. Although, it is well known that under strong stress the chlorophyll molecules become moreeasily accessible to oxygen and other exogenous quenchers. The assumptions made above are wellsupported by the values of the main JIP parameters (Figure 1B). Each parameter is explained in Table 3.There were statistically significant differences between Cd-exposed and non-exposed control plants forall parameters and for all but FM, N, RC/CS0, and φRo parameters in the case of Zn-exposed plants.
Int. J. Mol. Sci. 2018, 19, x 4 of 14
observed in metal exposed plants (Table 2). The presence of chlorophyll fluorescence quenchers could lower FM as well. Such molecules could be endogenous like carotenoids or exogenous like oxygen. However, in exposed plants the carotenoid contents decreased. Although, it is well known that under strong stress the chlorophyll molecules become more easily accessible to oxygen and other exogenous quenchers. The assumptions made above are well supported by the values of the main JIP parameters (Figure 1B). Each parameter is explained in Table 3. There were statistically significant differences between Cd-exposed and non-exposed control plants for all parameters and for all but FM, N, RC/CS0, and φRo parameters in the case of Zn-exposed plants.
(A) (B)
(C) (D)
Figure 1. (A) Induction transients of chlorophyll a fluorescence in leaves of wheat (Triticum durum Desf. (cv. Beloslava)) plants—control (black), exposed to 50 µM Cd (red) and 600 µM Zn (green). The whole plants were adapted to dark in room for 1 h and additionally the measured spots were kept in dark in the clip for 1 min just before measurement. Induction curves of ChlF were recorded for 1 s with 3000 µmol m−2 s−1 PPFD. Each point in the graph is an averaged value of 6 repetitions and the standard errors are shown. The characteristic levels (O, J, I, and P) of the induction transients are denoted with letters. (B) Parameters of the JIP test (described in Table 1) are calculated from the curves shown in A. The asterisks above each parameter indicate if there is statistical significance for the Cd (red) or Zn exposure (green) or for both treatments (black): 1 asterisk—p < 0.05, 2—p ≤ 0.01, and 3—p ≤ 0.001. (C) Induction curves of the relative variable chlorophyll fluorescence (Vt) resulting from double normalization of the values in (A) to the minimal (FO) and maximal (FM) levels. The characteristic levels (O, J, I, and P) of the induction curves are denoted as in (A). (D) Curves of differential values (ΔVt) resulting from subtracting the control from exposed Vt. The times of the induction curves characteristic levels (O, J, I, and P) are marked as well as the intermediary levels (L, K, H, and G) at which ΔVt peaks and shoulders occur.
Figure 1. (A) Induction transients of chlorophyll a fluorescence in leaves of wheat (Triticum durum Desf.(cv. Beloslava)) plants—control (black), exposed to 50 µM Cd (red) and 600 µM Zn (green). The wholeplants were adapted to dark in room for 1 h and additionally the measured spots were kept in darkin the clip for 1 min just before measurement. Induction curves of ChlF were recorded for 1 s with3000 µmol m−2 s−1 PPFD. Each point in the graph is an averaged value of 6 repetitions and the standarderrors are shown. The characteristic levels (O, J, I, and P) of the induction transients are denoted withletters. (B) Parameters of the JIP test (described in Table 1) are calculated from the curves shown in A.The asterisks above each parameter indicate if there is statistical significance for the Cd (red) or Znexposure (green) or for both treatments (black): 1 asterisk—p < 0.05, 2—p ≤ 0.01, and 3—p ≤ 0.001.(C) Induction curves of the relative variable chlorophyll fluorescence (Vt) resulting from doublenormalization of the values in (A) to the minimal (FO) and maximal (FM) levels. The characteristiclevels (O, J, I, and P) of the induction curves are denoted as in (A). (D) Curves of differential values(∆Vt) resulting from subtracting the control from exposed Vt. The times of the induction curvescharacteristic levels (O, J, I, and P) are marked as well as the intermediary levels (L, K, H, and G) atwhich ∆Vt peaks and shoulders occur.

Int. J. Mol. Sci. 2018, 19, 787 5 of 13
To better analyze the differences in the induction curve’s shape, the transients of the doublenormalized fluorescent signal (to FO and FM) are presented in Figure 1C. In this way, the deviations inthe intermediate induction phases of exposed plants with respect to the control become clear:
• steeper initial rise for both metals,• increase for Zn, decrease for Cd of the VJ (2 ms), and• decrease (very strong for Cd) of the VI (30 ms).
Noteworthy is the fact that not only are the VJ and VI levels are much lower for Cd-exposedseedlings, but that the rise before and after them is heavily slowed down with chlorophyll fluorescencestill rising 1 s after the start of induction, probably not reaching the real maximal level (FM).This observation could be explained by a high availability of efficient chlorophyll fluorescencequenchers or formation of inactive PSII reaction centers with destroyed oxygen-evolving complex(OEC), that are able to quench a large part of excitation in PSII antennae complexes.
Differential curves resulting from subtracting the control from the Zn- and Cd-exposed doublenormalized fluorescent values are presented in Figure 1D. Thus the 3 bullet points outlined above canbe visualized as:
• positive peak in FO-FJ,• shoulder in FJ-FI and• negative peak in FI-FP transient.
The differential curves constructed in the first and the second time intervals should be connectedwith excitation energy redistribution between neighboring PSII antenna complexes as well as with thebalance of electron transport reactions around PSII. The increased level at 0.3 ms, called the (positive)K-band, is a typical characteristic in the case of high temperature stress, indicating a reduced rate ofelectron donation to RC due to impaired OEC [53]. On the other side, a K-band could be connected toa higher rate of electron transport from RC to its acceptors. In conclusion, a positive K-band occurswhenever the balance of electron transport around PSII is causing electron deficit and formation of P680
+
that is an effective quencher of excited state of chlorophyll molecules [53,54]. That molecule is in facta powerful chlorophyll fluorescence quencher—absorbed light cannot be utilized in photochemistryand dissipates as heat. High levels of P680
+ may contribute to the striking quenching observed in Cdexposed seedlings.
The increased FJ level and the shoulder in the FJ-FI transient in the case of Zn exposure couldbe connected with a reduced rate of electron transfer from QA to QB at the acceptor side of PSII.These effects as well as the positive K-band should lower the photosynthetic electron flow from PSIIto PSI. The decreased FJ level, despite the positive peak in the initial rise of FO-FJ in the case of Cdexposure, suggests vast quantities of P680
+ and/or highly effective quenching by exogenous molecules.The decreased FI level and the negative peak in the FI-FP transient could be connected with a
bigger pool of intersystem (plastoquinone) and/or PSI end electron acceptors per active PSII RC in theexposed plants compared to the control.
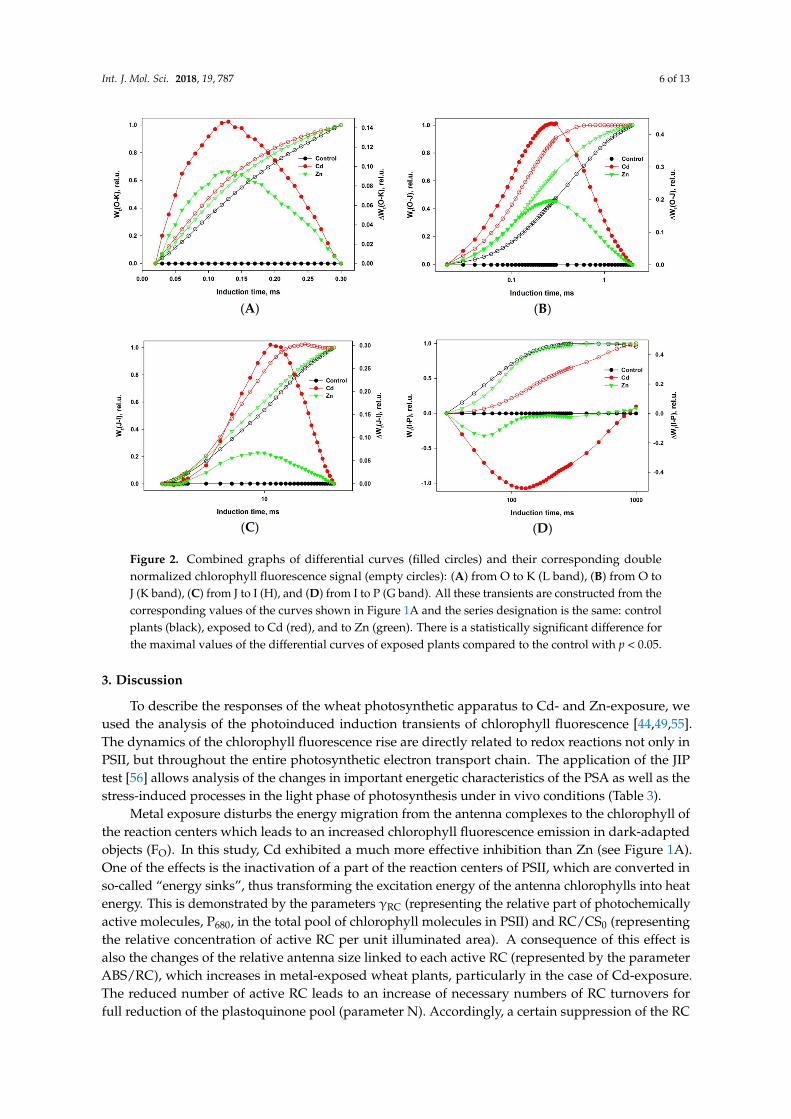
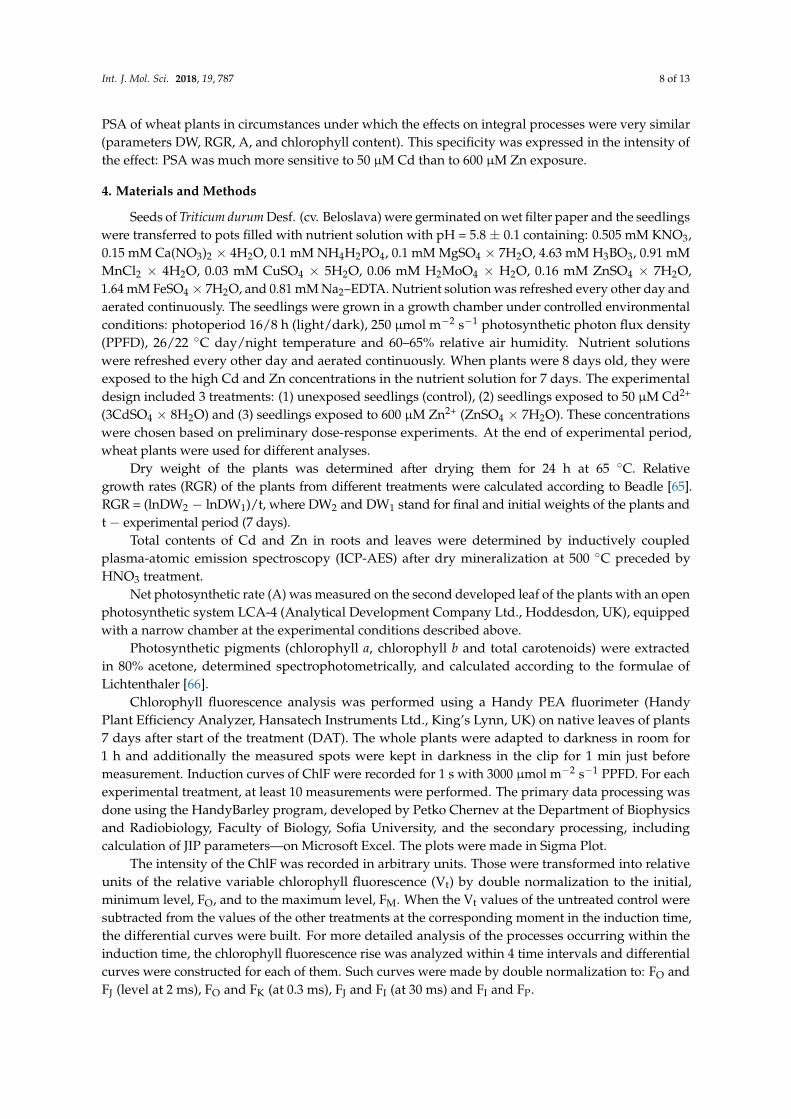
All the observations described above can be demonstrated more precisely by constructingdifferential curves within different parts of the induction. Such curves are plotted on Figure 2A–D for4 different time intervals, representing formation of bands: L (interval O-K), K (O-J), H (J-I), and G (I-P).
Positive L, K, and H bands are seen in Figure 2A–C as well as a negative G band (Figure 2D)for both metal exposures. However, the effects of Cd exposure are much more obvious in every case.Interestingly, the times for the extreme of each band are the same for both metals for L (120 µs) andK (250 µs) but they differ slightly for H (Zn—9 ms, Cd—11 ms) and significantly for G (Zn—60 ms,Cd—130 ms), demonstrating that the specificity of the Cd and Zn effects is exhibited in electrontransport after PSII.
Int. J. Mol. Sci. 2018, 19, 787 6 of 13Int. J. Mol. Sci. 2018, 19, x 6 of 14
(A) (B)
(C) (D)
Figure 2. Combined graphs of differential curves (filled circles) and their corresponding double normalized chlorophyll fluorescence signal (empty circles): (A) from O to K (L band), (B) from O to J (K band), (C) from J to I (H), and (D) from I to P (G band). All these transients are constructed from the corresponding values of the curves shown in Figure 1A and the series designation is the same: control plants (black), exposed to Cd (red), and to Zn (green). There is a statistically significant difference for the maximal values of the differential curves of exposed plants compared to the control with p < 0.05.
Positive L, K, and H bands are seen in Figure 2A–C as well as a negative G band (Figure 2D) for both metal exposures. However, the effects of Cd exposure are much more obvious in every case. Interestingly, the times for the extreme of each band are the same for both metals for L (120 µs) and K (250 µs) but they differ slightly for H (Zn—9 ms, Cd—11 ms) and significantly for G (Zn—60 ms, Cd—130 ms), demonstrating that the specificity of the Cd and Zn effects is exhibited in electron transport after PSII.
3. Discussion
To describe the responses of the wheat photosynthetic apparatus to Cd- and Zn-exposure, we used the analysis of the photoinduced induction transients of chlorophyll fluorescence [44,49,55]. The dynamics of the chlorophyll fluorescence rise are directly related to redox reactions not only in PSII, but throughout the entire photosynthetic electron transport chain. The application of the JIP test [56] allows analysis of the changes in important energetic characteristics of the PSA as well as the stress-induced processes in the light phase of photosynthesis under in vivo conditions (Table 3).
Metal exposure disturbs the energy migration from the antenna complexes to the chlorophyll of the reaction centers which leads to an increased chlorophyll fluorescence emission in dark-adapted objects (FO). In this study, Cd exhibited a much more effective inhibition than Zn (see Figure 1A). One of the effects is the inactivation of a part of the reaction centers of PSII, which are converted in so-called “energy sinks”, thus transforming the excitation energy of the antenna
Figure 2. Combined graphs of differential curves (filled circles) and their corresponding doublenormalized chlorophyll fluorescence signal (empty circles): (A) from O to K (L band), (B) from O toJ (K band), (C) from J to I (H), and (D) from I to P (G band). All these transients are constructed from thecorresponding values of the curves shown in Figure 1A and the series designation is the same: controlplants (black), exposed to Cd (red), and to Zn (green). There is a statistically significant difference forthe maximal values of the differential curves of exposed plants compared to the control with p < 0.05.
3. Discussion
To describe the responses of the wheat photosynthetic apparatus to Cd- and Zn-exposure, weused the analysis of the photoinduced induction transients of chlorophyll fluorescence [44,49,55].The dynamics of the chlorophyll fluorescence rise are directly related to redox reactions not only inPSII, but throughout the entire photosynthetic electron transport chain. The application of the JIPtest [56] allows analysis of the changes in important energetic characteristics of the PSA as well as thestress-induced processes in the light phase of photosynthesis under in vivo conditions (Table 3).
Metal exposure disturbs the energy migration from the antenna complexes to the chlorophyll ofthe reaction centers which leads to an increased chlorophyll fluorescence emission in dark-adaptedobjects (FO). In this study, Cd exhibited a much more effective inhibition than Zn (see Figure 1A).One of the effects is the inactivation of a part of the reaction centers of PSII, which are converted inso-called “energy sinks”, thus transforming the excitation energy of the antenna chlorophylls into heatenergy. This is demonstrated by the parameters γRC (representing the relative part of photochemicallyactive molecules, P680, in the total pool of chlorophyll molecules in PSII) and RC/CS0 (representingthe relative concentration of active RC per unit illuminated area). A consequence of this effect isalso the changes of the relative antenna size linked to each active RC (represented by the parameterABS/RC), which increases in metal-exposed wheat plants, particularly in the case of Cd-exposure.The reduced number of active RC leads to an increase of necessary numbers of RC turnovers forfull reduction of the plastoquinone pool (parameter N). Accordingly, a certain suppression of the RC

Int. J. Mol. Sci. 2018, 19, 787 7 of 13
photochemical efficiency is detected, presented by the quantum yield of the primary photochemicalreaction (φP0), while the re-oxidation reaction of the primary quinone acceptor QA
− is slightly reducedby Zn-exposure and even probably activated in case of Cd-exposure [57].
Generally, the dynamics of the induction transient may be successfully analyzed by plotting ofdifferential curves [56] (see Figure 1D). The stress factors strongly modify the shapes of the differentialcurves and the effects are manifested in different ways, forming bands of the induction transient.Strasser et al. [56] suggested nomenclature for the designation of different transient phases by theletters (bands) L, K, J, I, H, and G.
For a more detailed characterization of the impact of metal exposure on the PSA of the wheatseedlings, we analyzed the stress-induced changes of the shape of the fast chlorophyll fluorescencerise from the O to P phase (Figure 1D) as well as separate sections of the this integral transient in thetime course intervals: 20–300 µs, 20–2000 µs, 2–30 ms, and 30–300 ms.
The shape of the induction curve between 20 and 300 µs (usually called the L band) is influencedby the excitation energy transfer between PSII units, commonly denoted as “connectivity” or“grouping” [58,59].
The appearance of a positive L band (Figure 2A) indicates a weaker connectivity betweenadjacent PSIIs at the level of the antenna complexes. This means that Zn and Cd also affect thestructure of the thylakoid membranes, expressed by a decreased transfer of excitation energy betweenadjacent photosynthetic units [60]. The changes of the energetic interactions could be a result ofstacking/destacking of thylakoid membranes caused by electrostatic interaction at different ionconcentrations [61,62].
The K band occurring during the O-J transient (Figure 2B) is usually explained as a result of animbalance in electron transfer reactions at donor and acceptor sides of PSII [53]. The appearance of apositive K-band is usually explained as a consequence of a retardation of electron donation from theOEC to oxidized chlorophyll, leading at light to the formation of an increased P680+ concentration ableto effectively quench the excited antenna chlorophylls. The maximal chlorophyll fluorescence level ofthe induction curve, reflecting the state of PSA with fully closed PSII RCs, is significantly decreased inCd-exposed wheat seedlings as compared to the control and even to Zn-exposed ones (see point P inFigure 1A and FM in Figure 1B). The appearance of a K band was also observed at high temperatureexposure of PSA and may be due to dissociation of the PsbO protein (Mn stabilizing protein) fromthe OEC [63,64]. The strongly expressed K-band demonstrated that both metals, but especially Cd,disturbed the functioning of OEC in PSII.
The chlorophyll fluorescence rise within the thermal phase of the induction kinetics is rathercomplex and depends on different factors, which were described in detail in a comprehensivereview [50]. A more simplified model describes the induction transient phases by energy fluxesat different stages of the photosynthetic light phase [49]. In the frame of this model, the photoinducedtransient from phase J (2 ms) to I (30 ms) represents the dynamics of the plastoquinone pool reductionbetween both photosystems. Phase I is formed when a dynamic equilibrium (quasi-steady-statecondition) is reached between reduction of the plastoquinone pool by the electron flow originating fromPSII and its re-oxidation due to PSI activity. The comparison of the transient dynamics between control(non-exposed) and metal-exposed plants in that time interval indicates that Cd and Zn ions influencedboth redox reactions. The visible positive band (especially in case of Cd-exposure) (Figure 2C) couldreflect a decrease in the relative numbers of active plastoquinone molecules reduced by each active RCof PSII.
During the time interval for the induction transient from I to P, the dynamics are defined bythe reduction speed of the terminal electron acceptors in PSI. It could be suggested that the stronglyexpressed negative bands (see Figure 2D) indicate an increase of the pool of the potential electronacceptors and a general decrease of the linear electron flux through both photosystems.
In conclusion, both Cd and Zn had clear negative effects on the plant processes considered inthis experiment. However, we found that these metals exhibit specificity concerning their effects on
Int. J. Mol. Sci. 2018, 19, 787 8 of 13
PSA of wheat plants in circumstances under which the effects on integral processes were very similar(parameters DW, RGR, A, and chlorophyll content). This specificity was expressed in the intensity ofthe effect: PSA was much more sensitive to 50 µM Cd than to 600 µM Zn exposure.
4. Materials and Methods
Seeds of Triticum durum Desf. (cv. Beloslava) were germinated on wet filter paper and the seedlingswere transferred to pots filled with nutrient solution with pH = 5.8 ± 0.1 containing: 0.505 mM KNO3,0.15 mM Ca(NO3)2 × 4H2O, 0.1 mM NH4H2PO4, 0.1 mM MgSO4 × 7H2O, 4.63 mM H3BO3, 0.91 mMMnCl2 × 4H2O, 0.03 mM CuSO4 × 5H2O, 0.06 mM H2MoO4 × H2O, 0.16 mM ZnSO4 × 7H2O,1.64 mM FeSO4 × 7H2O, and 0.81 mM Na2–EDTA. Nutrient solution was refreshed every other day andaerated continuously. The seedlings were grown in a growth chamber under controlled environmentalconditions: photoperiod 16/8 h (light/dark), 250 µmol m−2 s−1 photosynthetic photon flux density(PPFD), 26/22 ◦C day/night temperature and 60–65% relative air humidity. Nutrient solutionswere refreshed every other day and aerated continuously. When plants were 8 days old, they wereexposed to the high Cd and Zn concentrations in the nutrient solution for 7 days. The experimentaldesign included 3 treatments: (1) unexposed seedlings (control), (2) seedlings exposed to 50 µM Cd2+
(3CdSO4 × 8H2O) and (3) seedlings exposed to 600 µM Zn2+ (ZnSO4 × 7H2O). These concentrationswere chosen based on preliminary dose-response experiments. At the end of experimental period,wheat plants were used for different analyses.
Dry weight of the plants was determined after drying them for 24 h at 65 ◦C. Relativegrowth rates (RGR) of the plants from different treatments were calculated according to Beadle [65].RGR = (lnDW2 − lnDW1)/t, where DW2 and DW1 stand for final and initial weights of the plants andt − experimental period (7 days).
Total contents of Cd and Zn in roots and leaves were determined by inductively coupledplasma-atomic emission spectroscopy (ICP-AES) after dry mineralization at 500 ◦C preceded byHNO3 treatment.
Net photosynthetic rate (A) was measured on the second developed leaf of the plants with an openphotosynthetic system LCA-4 (Analytical Development Company Ltd., Hoddesdon, UK), equippedwith a narrow chamber at the experimental conditions described above.
Photosynthetic pigments (chlorophyll a, chlorophyll b and total carotenoids) were extractedin 80% acetone, determined spectrophotometrically, and calculated according to the formulae ofLichtenthaler [66].
Chlorophyll fluorescence analysis was performed using a Handy PEA fluorimeter (HandyPlant Efficiency Analyzer, Hansatech Instruments Ltd., King’s Lynn, UK) on native leaves of plants7 days after start of the treatment (DAT). The whole plants were adapted to darkness in room for1 h and additionally the measured spots were kept in darkness in the clip for 1 min just beforemeasurement. Induction curves of ChlF were recorded for 1 s with 3000 µmol m−2 s−1 PPFD. For eachexperimental treatment, at least 10 measurements were performed. The primary data processing wasdone using the HandyBarley program, developed by Petko Chernev at the Department of Biophysicsand Radiobiology, Faculty of Biology, Sofia University, and the secondary processing, includingcalculation of JIP parameters—on Microsoft Excel. The plots were made in Sigma Plot.
The intensity of the ChlF was recorded in arbitrary units. Those were transformed into relativeunits of the relative variable chlorophyll fluorescence (Vt) by double normalization to the initial,minimum level, FO, and to the maximum level, FM. When the Vt values of the untreated control weresubtracted from the values of the other treatments at the corresponding moment in the induction time,the differential curves were built. For more detailed analysis of the processes occurring within theinduction time, the chlorophyll fluorescence rise was analyzed within 4 time intervals and differentialcurves were constructed for each of them. Such curves were made by double normalization to: FO andFJ (level at 2 ms), FO and FK (at 0.3 ms), FJ and FI (at 30 ms) and FI and FP.
Int. J. Mol. Sci. 2018, 19, 787 9 of 13
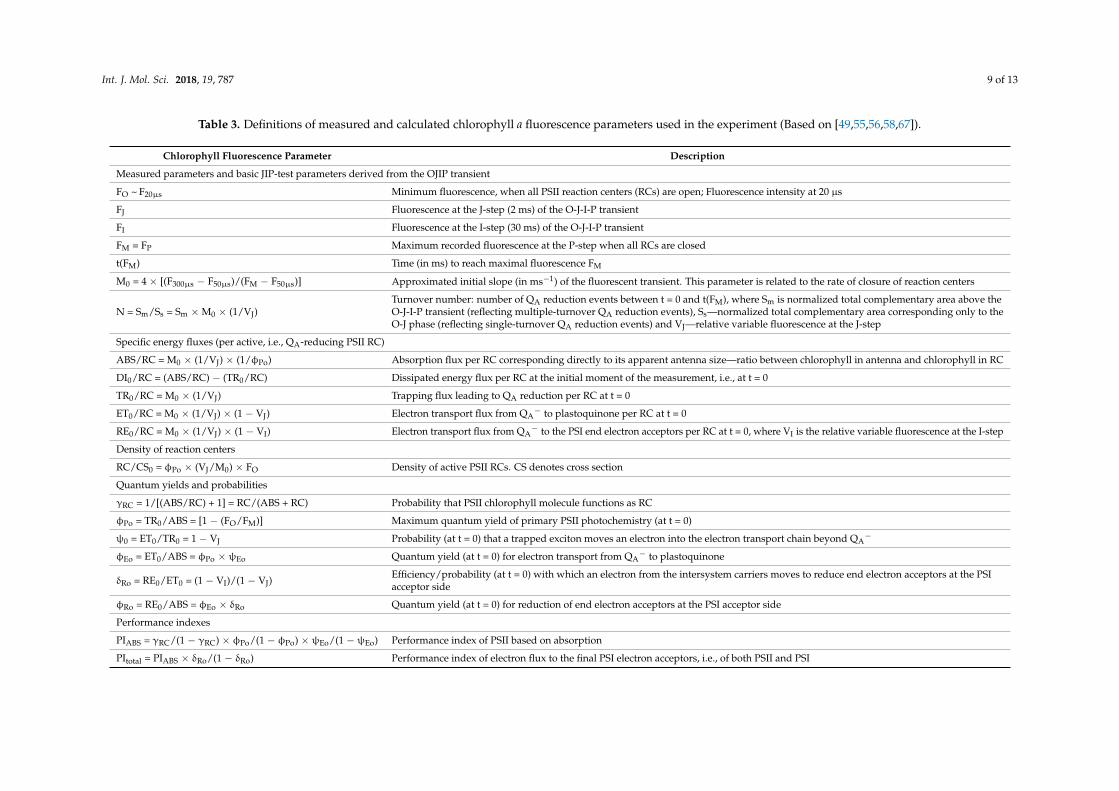
Table 3. Definitions of measured and calculated chlorophyll a fluorescence parameters used in the experiment (Based on [49,55,56,58,67]).
Chlorophyll Fluorescence Parameter Description
Measured parameters and basic JIP-test parameters derived from the OJIP transient
FO ~ F20µs Minimum fluorescence, when all PSII reaction centers (RCs) are open; Fluorescence intensity at 20 µs
FJ Fluorescence at the J-step (2 ms) of the O-J-I-P transient
FI Fluorescence at the I-step (30 ms) of the O-J-I-P transient
FM = FP Maximum recorded fluorescence at the P-step when all RCs are closed
t(FM) Time (in ms) to reach maximal fluorescence FM
M0 = 4 × [(F300µs − F50µs)/(FM − F50µs)] Approximated initial slope (in ms−1) of the fluorescent transient. This parameter is related to the rate of closure of reaction centers
N = Sm/Ss = Sm × M0 × (1/VJ)Turnover number: number of QA reduction events between t = 0 and t(FM), where Sm is normalized total complementary area above theO-J-I-P transient (reflecting multiple-turnover QA reduction events), Ss—normalized total complementary area corresponding only to theO-J phase (reflecting single-turnover QA reduction events) and VJ—relative variable fluorescence at the J-step
Specific energy fluxes (per active, i.e., QA-reducing PSII RC)
ABS/RC = M0 × (1/VJ) × (1/φPo) Absorption flux per RC corresponding directly to its apparent antenna size—ratio between chlorophyll in antenna and chlorophyll in RC
DI0/RC = (ABS/RC) − (TR0/RC) Dissipated energy flux per RC at the initial moment of the measurement, i.e., at t = 0
TR0/RC = M0 × (1/VJ) Trapping flux leading to QA reduction per RC at t = 0
ET0/RC = M0 × (1/VJ) × (1 − VJ) Electron transport flux from QA− to plastoquinone per RC at t = 0
RE0/RC = M0 × (1/VJ) × (1 − VI) Electron transport flux from QA− to the PSI end electron acceptors per RC at t = 0, where VI is the relative variable fluorescence at the I-step
Density of reaction centers
RC/CS0 = φPo × (VJ/M0) × FO Density of active PSII RCs. CS denotes cross section
Quantum yields and probabilities
γRC = 1/[(ABS/RC) + 1] = RC/(ABS + RC) Probability that PSII chlorophyll molecule functions as RC
φPo = TR0/ABS = [1 − (FO/FM)] Maximum quantum yield of primary PSII photochemistry (at t = 0)
ψ0 = ET0/TR0 = 1 − VJ Probability (at t = 0) that a trapped exciton moves an electron into the electron transport chain beyond QA−
φEo = ET0/ABS = φPo × ψEo Quantum yield (at t = 0) for electron transport from QA− to plastoquinone
δRo = RE0/ET0 = (1 − VI)/(1 − VJ)Efficiency/probability (at t = 0) with which an electron from the intersystem carriers moves to reduce end electron acceptors at the PSIacceptor side
φRo = RE0/ABS = φEo × δRo Quantum yield (at t = 0) for reduction of end electron acceptors at the PSI acceptor side
Performance indexes
PIABS = γRC/(1 − γRC) × φPo/(1 − φPo) × ψEo/(1 − ψEo) Performance index of PSII based on absorption
PItotal = PIABS × δRo/(1 − δRo) Performance index of electron flux to the final PSI electron acceptors, i.e., of both PSII and PSI
Int. J. Mol. Sci. 2018, 19, 787 10 of 13
The chlorophyll fluorescence intensity values determined at 50 µs, 100 µs, and 300 µs, along withFO, FJ, FI, and FM were used for the calculation of the OJIP test parameters [49,55,56,58,67], which arepresented in Table 3.
Statistical analysis of physiological parameters was performed using a one-way ANOVA(for p < 0.05). Based on ANOVA results, a Tukey’s test for main comparison at a 95% confidential levelwas applied. Statistical analysis for ChlF parameters was performed with the program Sigma Plotversion 11 using one-way ANOVA and the Holm–Sidak method for multiple comparisons with overallsignificance level of 0.05.
Author Contributions: Andon Vassilev, Jaco Vangronsveld and Vasilij Goltsev conceived and designed theexperiments. Lyubka Koleva and Momchil Paunov performed experiments and analyses. All authors contributedto the writing of the paper.
Conflicts of Interest: The authors declare no conflict of interest.
References
1. Vassilev, A.; Schwitzguébel, J.-P.; Thewys, T.; van der Lelie, D.; Vangronsveld, J. The use of plants forremediation of metal-contaminated soils. Sci. World J. 2004, 4, 9–34. [CrossRef] [PubMed]
2. Rout, G.R.; Das, P. Effect of Metal Toxicity on Plant Growth and Metabolism: I. Zinc. In Sustainable Agriculture;Lichtfouse, E., Navarrete, M., Debaeke, P., Véronique, S., Alberola, C., Eds.; Springer: Dordrecht, The Netherlands,2009; pp. 873–884.
3. Grant, C.A.; Buckley, W.T.; Bailey, L.D.; Selles, F. Cadmium accumulation in crops. Can. J. Plant Sci. 1998, 78,1–17. [CrossRef]
4. Koleva, L.; Staneva, D.; Yordanova, I.; Bineva, T.; Vassilev, A. Characterization of cadmum uptake by roots ofdurum wheat plants. JCEA 2008, 9, 533–538.
5. Tang, L.; Aijun, Y.; Ming, Y.; Yetao, T.; Xi, L.; Rongliang, Q. Transcriptional up-regulation of genes involved inphotosynthesis of the Zn/Cd hyperaccumulator Sedum alfredii in response to zinc and cadmium. Chemosphere2016, 164, 190–200. [CrossRef] [PubMed]
6. Poschenrieder, Ch.; Tolra, R.; Barcelo, J. Can metals defend plants against biotic stress? Trends Plant Sci. 2006,11, 288–295. [CrossRef] [PubMed]
7. Broadley, M.R.; White, P.J.; Hammond, J.P.; Zelko, I.; Lux, A. Zinc in plants. New Phytol. 2007, 173, 677–702.[CrossRef] [PubMed]
8. Vassilev, A.; Perez-Sanz, A.; Cuypers, A.; Vangronsveld, J. Tolerance of two hydroponically grown Salixgenotypes to excess Zn. J. Plant Nutr. 2007, 30, 1472–1482. [CrossRef]
9. Vangronsveld, J.; Clijsters, H. Toxic effects of metals. In Plants and the Chemical Elements. Biochemistry, Uptake,Tolerance and Toxicity; Farago, M.E., Ed.; VCH Publishers: Weinheim, Germany, 1994; pp. 150–177.
10. Vassilev, A.; Yordanov, I. Reductive analysis of factors limiting growth of cadmium-treated plants: A review.Bulg. J. Plant Physiol. 1997, 23, 114–133.
11. Clijsters, H.; Van Assche, F. Inhibition of photosynthesis by heavy metals. Photosynth. Res. 1985, 7, 31–40.[CrossRef] [PubMed]
12. Van Assche, F.; Clijsters, H. Effects of metals on enzyme activity in plants. Plant, Cell and Environment 1990,13, 195–206. [CrossRef]
13. Barceló, J.; Poschenrieder, C. Plant water relations as affected by heavy metal stress: A review. J. Plant Nutr.1990, 13, 1–37. [CrossRef]
14. Chaney, R. Zinc phytotoxicity. In Zinc in Soils and Plants; Robson, A.D., Ed.; Kluwer Academic Publisher:Dordrecht, The Netherlands, 1993; pp. 135–150.
15. Siedlecka, A. Some aspects of interactions between heavy metals and plant mineral nutrients. Acta Soc.Bot. Pol. 1995, 64, 265–272. [CrossRef]
16. Cuypers, A.; Smeets, K.; Vangronsveld, J. Heavy Metal Stress in Plants. In Plant Stress Biology: FromGenomics to Systems Biology; Hirt, H., Ed.; Wiley-VCH Verlag GmbH & Co. KGaA: Weinheim, Germany, 2009.[CrossRef]
17. Krupa, Z. Cadmium against Higher Plant Photosynthesis—A Variety of Effects and Where Do They PossiblyCome From? Z. Naturforsch. 1999, 54c, 723–729. [CrossRef]
Int. J. Mol. Sci. 2018, 19, 787 11 of 13
18. Cuypers, A.; Vangronsve, J.; Clijsters, H. The redox status of plant cells (AsA and GSH) is sensitive to zincimposed oxidative stress in roots and primary leaves of Phaseolus vulgaris. Plant Physiol. Biochem. 2001, 39,657–664. [CrossRef]
19. Vassilev, A.; Nikolova, A.; Koleva, L.; Lidon, F. Effects of Excess Zn on Growth and PhotosyntheticPerformance of Young Bean Plants. J. Phytol. 2011, 3, 58–62.
20. Van Assche, F.V.; Clijsters, H. Inhibition of photosynthesis by treatment of Phaseolus vulgaris with toxicconcentration of zinc: Effects on electron transport and photophosphorylation. Physiol. Plant. 1986, 66,717–721. [CrossRef]
21. Vassilev, A.; Manolov, P. Chlorophyll fluorescence of barley (H. vulgare L.) seedlings grown in excess of Cd.Bulg. J. Plant Physiol. 1999, 25, 67–76.
22. Kalaji, H.M.; Loboda, T. Photosystem II of barley seedlings under cadmium and lead stress. Soil Environ.2007, 53, 511–516. [CrossRef]
23. Sagardoy, R.; Morales, F.; López-Millán, A.F.; Abadía, A.; Abadía, J. Effects of zinc toxicity on sugar beet(Beta vulgaris L.) plants grown in hydroponic. Plant Biol. 2009, 11, 339–350. [CrossRef] [PubMed]
24. Vassilev, A.; Lidon, F.C.; Matos, M.D.; Ramalho, J.C.; Bareiro, M.G. Shoot cadmium accumulation andphotosynthetic performance of barley at high Cd treatments. J. Plant Nutr. 2004, 27, 773–793. [CrossRef]
25. Krupa, Z.; Öquist, G.; Huner, N.P.A. The effects of cadmium on photosynthesis of Phaseolus vulgaris—A fluorescence analysis. Physiol. Plant. 1993, 88, 626–630. [CrossRef] [PubMed]
26. Vassilev, A.; Lidon, F.C.; Scotti, P.; da Graca, M.; Yordanov, I. Cadmium-induced changes in chloroplast lipidsand photosystem activities of barley plants. Biol. Plant. 2004, 48, 153–156. [CrossRef]
27. Cuypers, A.; Remans, T.; Weyens, N.; Colpaert, J.; Vassilev, A.; Vangronsveld, J. Soil plant relationships ofmetals and metalloids (Chapter 6). In Heavy Metals in Soils: Trace Metals and Metalloids in Soils and TheirBioavailability, 3rd ed.; Environmental Pollution Series; Alloway, B., Ed.; Springer Verlag: Berlin, Germany,2012; pp. 161–195, ISBN 978-94-007-4469-1.
28. Lazár, D. Parameters of photosynthetic energy partitioning. J. Plant Physiol. 2015, 175, 131–147. [CrossRef][PubMed]
29. Strasser, R.J.; Srivastava, A.; Govindjee. Polyphasic chlorophyll a fluorescent transient in plants andcyanobacteria. Photochem. Photobiol. 1995, 61, 32–42. [CrossRef]
30. Goltsev, V.N.; Kalaji, H.M.; Paunov, M.; Baba, W.; Horaczek, T.; Mojski, J.; Kociel, H.; Allakhverdiev, S.I.Variable Chlorophyll Fluorescence and Its Use for Assessing Physiological Condition of Plant PhotosyntheticApparatus. Russ. J. Plant Physiol. 2017, 63, 869–893. [CrossRef]
31. Kalaji, M.H.; Goltsev, V.N.; Zuk-Gołaszewska, K.; Zivcak, M.; Brestic, M. Chlorophyll Fluorescence:Understanding Crop Performance—Basics and Applications; CRC Press, T&F Group: Abingdon, UK, 2017;p. 222, ISBN 9781498764490.
32. Kalaji, M.H.; Jajoo, A.; Oukarroum, A.; Brestic, M.; Zivcak, M.; Samborska, I.A.; Cetner, M.D.; Łukasik, I.;Goltsev, V.; Ladle, R.J. Chlorophyll a fluorescence as a tool to monitor physiological status of plants underabiotic stress conditions. Acta Physiol. Plant. 2016, 38, 1–11. [CrossRef]
33. Kalaji, M.H.; Schansker, G.; Brestic, M.; Bussotti, F.; Calatayud, A.; Ferroni, L.; Goltsev, V.; Guidi, L.; Jajoo, A.;Li, P.; et al. Frequently asked questions about chlorophyll fluorescence, the sequel. Photosynth. Res. 2017, 132,13–66. [CrossRef] [PubMed]
34. Stirbet, A.; Lazár, D.; Kromdijk, J. Chlorophyll a fluorescence induction: Can just a one-second measurementbe used to quantify abiotic stress responses? Photosynthetica 2018, 1–19. [CrossRef]
35. Luttge, U. Light-stress and crassulacean acid metabolism. Phyton 2000, 40, 65–82.36. Krause, G.H. Photoinhibition induced by low temperatures. In Photoinhibition of Photosynthesis. Environmental
Plant Biology; Baker, N.R., Bowyer, J.R., Eds.; BIOS Scientific Publishers Ltd.: Oxford, UK, 1994; pp. 331–348.37. Koscielniak, J.; Biesaga-Koscielniak, J. Effects of exposure to short periods of suboptimal temperature during
chili (5 degrees C) on gas exchange and chlorophyll fluorescence in maize seedlings (Zea mays L.). J. Agron.Crop. Sci. 1999, 183, 231–241. [CrossRef]
38. Georgieva, K.; Yordanov, I. Temperature dependence of chlorophyll fluorescence parameters of pea seedlings.J. Plant Physiol. 1993, 142, 151–155. [CrossRef]
39. Srivastava, A.; Strasser, R.J. Regulation of antenna structure and electron transport in Photosystem II of Pisumsativum under elevated temperature probed by the fast polyphasic chlorophyll a fluorescence transient:OKJIP. Biochim. Biophys. Acta 1997, 1320, 95–106. [CrossRef]
Int. J. Mol. Sci. 2018, 19, 787 12 of 13
40. Bukhov, N.; Carpentier, R. Heterogeneity of photosystem II reaction centers as influenced by heat treatmentof barley leaves. Physiol. Plant. 2000, 110, 279–285. [CrossRef]
41. Oukarroum, A.; Madidi, S.E.; Schansker, G.; Strasser, R.J. Probing the responses of barley cultivars(Hordeum vulgare L.) by chlorophyll a fluorescence OLKJIP under drought stress and re-watering. Environ. Exp. Bot.2007, 60, 438–446. [CrossRef]
42. Georgieva, K.; Maslenkova, L.; Peeva, V.; Markovska, Y.; Stefanov, D.; Tuba, Z. Comparative study on thechanges in photosynthetic activity of the homoiochlorophyllous desiccation-tolerant Haberlea rhodopensisand desiccation-sensitive spinach leaves during desiccation and rehydration. Photosynth. Res. 2005, 85,191–203. [CrossRef] [PubMed]
43. Georgieva, K.; Szigeti, Z.; Sarvari, E.; Gaspar, L.; Maslenkova, L.; Peeva, V.; Peli, E.; Tuba, Z. Photosyntheticactivity of homoiochlorophyllous desiccation tolerant plant Haberlea rhodopensis during dehydration andrehydration. Planta 2007, 225, 955–964. [CrossRef] [PubMed]
44. Goltsev, V.; Zaharieva, I.; Chernev, P.; Kouzmanova, M.; Kalaji, H.M.; Yordanov, I.; Krasteva, V.;Alexandrov, V.; Stefanov, D.; Allakhverdiev, S.I.; et al. Drought-induced modifications of photosyntheticelectron transport in intact leaves: Analysis and use of neural networks as a tool for a rapid non-invasiveestimation. Biochim. Biophys. Acta 2012, 1817, 1490–1498. [CrossRef] [PubMed]
45. Li, Q.; Chen, L.-S.; Jiang, H.-X.; Tang, N.; Yang, L.-T.; Lin, Z.-H.; Li, Y.; Yang, G.-H. Effects of manganese-excesson CO2 assimilation, ribulose-1,5-bisphosphate carboxylase/oxygenase, carbohydrates and photosyntheticelectron transport of leaves, and antioxidant systems of leaves and roots in Citrus grandis seedlings.BMC Plant Biol. 2010, 10, 42. [CrossRef] [PubMed]
46. Zurek, G.; Rybka, K.; Pogrzeba, M.; Krzyzak, J.; Prokopiuk, K. Chlorophyll a Fluorescence in Evaluation ofthe Effect of Heavy Metal Soil Contamination on Perennial Grasses. PLoS ONE 2014, 9, e91475. [CrossRef][PubMed]
47. Cuchiara, C.C.; Silva, I.M.C.; Martinazzo, E.G.; Braga, E.J.B.; Bacarin, M.A.; Peters, J.A. ChlorophyllFluorescence Transient Analysis in Alternanthera tenella Colla Plants Grown in Nutrient Solution withDifferent Concentrationsof Copper. J. Agric. Sci. 2013, 5, 8–16.
48. Franic, M.; Galic, V.; Mazur, M.; Šimic, D. Effects of excess cadmium in soil on JIP-test parameters, hydrogenperoxide content and antioxidant activity in two maize inbreds and their hybrid. Photosynthetica 2017, 55,1–10. [CrossRef]
49. Tsimilli-Michael, M.; Strasser, R.J. In vivo assessment of stress impact on plant’s vitality: Applications indetecting and evaluating the beneficial role of Mycorrhization on hostplants. In Mycorrhiza: State of the Art,Genetics and Molecular Biology, Eco-Function, Biotechnology, Eco-Physiology, Structure and Systematics, 3rd ed.;Varma, A., Ed.; Springer Verlag: Berlin/Heidelberg, Germany, 2008; pp. 679–703.
50. Lazár, D. The polyphasic chlorophyll a fluorescence rise measured under high intensity of exciting light.Funct. Plant Biol. 2006, 33, 9–30. [CrossRef]
51. Havaux, M. Characterization of thermal damage to the photosynthetic electron transport system in potatoleaves. Plant Sci. 1993, 94, 19–33. [CrossRef]
52. Yamane, Y.; Kashino, Y.; Koike, H.; Satoh, K. Effects of high temperatures on photosynthetic systems in higherplants. In Photosynthesis: From Light to Biosphere; Mathis, P., Ed.; Kluwer Academic Publishers: Dordrecht,The Netherlands, 1995; Volume 5, pp. 849–852.
53. Strasser, B. Donor side capacity of Photosystem II probed by chlorophyll a fluorescence transients. Photosynth. Res.1997, 52, 147–155. [CrossRef]
54. Steffen, R.; Eckert, H.-J.; Kelly, A.A.; Dörmann, P.; Renger, G. Investigations on the reaction pattern ofphotosystem II in leaves from Arabidopsis thaliana by time-resolved fluorometric analysis. Biochemistry-US2005, 44, 3123–3133. [CrossRef] [PubMed]
55. Strasser, R.J.; Tsimilli-Michael, M.; Qiang, S.; Goltsev, V. Simultaneous in vivo recording of prompt anddelayed fluorescence and 820-nm reflection changes during drying and after rehydration of the resurrectionplant Haberlea rhodopensis. Biochim. Biophys. Acta 2010, 1797, 1313–1326. [CrossRef] [PubMed]
56. Strasser, R.J.; Tsimilli-Michael, M.; Srivastava, A. Analysis of the chlorophyll a fluorescence transient. In Chlorophyll aFluorescence: A Signature of Photosynthesis. Advances in Photosynthesis and Respiration; Papageorgiou, G., Govindjee, Eds.;Springer: Dordrecht, The Netherlands, 2004; Volume 19, pp. 321–362.
57. Joliot, A.; Joliot, P. Etude cinetique de la reaction photochimique liberant loxygene au cours de la photosynthese.Comptes Rendus Acad. Sci. 1964, 258, 4622.

Int. J. Mol. Sci. 2018, 19, 787 13 of 13
58. Tsimilli-Michael, M.; Strasser, R. The energy flux theory 35 years later: Formulations and applications.Photosynth. Res. 2013, 117, 289–320. [CrossRef] [PubMed]
59. Strasser, R.J.; Stirbet, A. Heterogeneity of photosystem II probed by the numerically simulated chlorophyll afluorescence rise (O–J–I–P). Math. Comput. Simul. 1998, 48, 3–9. [CrossRef]
60. Lazár, D.; Pospíšil, P.; Nauš, J. Decrease of fluorescence intensity after the K step in chlorophyll a fluorescenceinduction is suppressed by electron acceptors and donors to photosystem 2. Photosynthetica 1999, 37, 255–265.[CrossRef]
61. Strasser, R.J.; Greppin, H. Primary reactions of photochemistry in higher plants. In Photosynthesis: Structureand Molecular Organisation of the Photosynthetic Apparatus; Akoyunoglou, G., Ed.; Balaban InternationalScience Services: Philiadelphia, PA, USA, 1981; Volume III, pp. 717–726.
62. Strasser, R.J. The grouping model of plant photosynthesis: Heterogeneity of photosynthetic units in thylakoids.In Photosynthesis: Structure and Molecular Organisation of the Photosynthetic Apparatus; Akoyunoglou, G., Ed.;Balaban International Science Services: Philiadelphia, PA, USA, 1981; Volume III, pp. 727–737.
63. Guisse, B.; Srivastava, A.; Strasser, R.J. Effects of high temperature and water stress on the polyphasicchlorophyll a fluorescence transient of potato leaves. In Photosynthesis: From Light to Biosphere; Mathis, P., Ed.;Kluwer Academic Publishers: Dordrecht, The Netherlands, 1995; pp. 913–916.
64. De Ronde, J.A.; Cress, W.A.; Krüger, G.H.J.; Strasser, R.J.; Van Staden, J. Photosynthetic response of transgenicsoybean plants, containing an Arabidopsis P5CR gene, during heat and drought stress. J. Plant Physiol. 2004,161, 1211–1224. [CrossRef] [PubMed]
65. Beadle, C.L. Growth analysis. In Photosynthesis and Production in a Changing Environment: A Field andLaboratory Manual; Scurlock, J.M.O., Bolhàr-Nordenkampf, H.R., Leegood, R.C., Long, S.P., Hall, D.O., Eds.;Springer Science & Business Media: Dordrecht, The Netherlands, 1993; pp. 36–46.
66. Lichtenthaler, H.K. Chlorophylls and carotenoids: Pigments of photosynthetic biomembrans. Methods Enzymol.1987, 148, 350–382.
67. Strasser, R.J.; Srivastava, A.; Tsimilli-Michael, M. The fluorescence transient as a tool to characterize andscreen photosynthetic samples. In Probing Photosynthesis: Mechanism, Regulation & Adaptation; Yunus, M.,Pathre, U., Eds.; Taylor & Francis: London, UK, 2000; pp. 443–480.
© 2018 by the authors. Licensee MDPI, Basel, Switzerland. This article is an open accessarticle distributed under the terms and conditions of the Creative Commons Attribution(CC BY) license (http://creativecommons.org/licenses/by/4.0/).