effects of corporate diversification: evidence from the
TRANSCRIPT

Effects of Corporate Diversification:
Evidence from the Property-Liability Insurance Industry
Andre P. Liebenberg*
Department of Finance College of Business and Public Administration 2124 Constant Hall, Old Dominion University
Norfolk, VA 23529-0236 [email protected]
David W. Sommer
Department of Insurance, Legal Studies, and Real Estate Brooks Hall 206, Terry College of Business
University of Georgia Athens, GA 30602-6255
Abstract
We investigate the effects of corporate diversification using a sample of property-liability (P/L) insurers over the period 1995 to 2002. The richness and consistency of our data set enables us to carefully test two alternative hypotheses regarding diversification’s effect on firm performance. The strategic focus hypothesis predicts a negative relation between diversification and performance while the conglomeration hypothesis predicts a positive relation. We develop and test a model that explains performance as a function of line-of-business diversification and other correlates. We consistently find that undiversified insurers outperform diversified insurers. Our results indicate that diversification is associated with a penalty of at least 1% of ROA or 2% of ROE. The diversification penalty is robust to corrections for potential endogeneity bias, alternative risk measures, and an alternative estimation technique. Our findings provide strong support for the strategic focus hypothesis. With respect to our control variables we find that insurance groups underperform unaffiliated insurers and that stock insurers outperform mutuals. *Corresponding author. Please do not cite without permission.
I. Introduction
This study investigates the performance effects of line-of-business diversification within the
US property-liability (P/L) insurance industry. We test two alternative hypotheses regarding
diversification’s effect on firm performance. According to the conglomeration hypothesis,
diversification enhances performance because it enables firms to benefit from risk-reduction
(Lewellen (1971)), scope economies (Teece (1980)), and larger internal capital markets. By
contrast, the strategic focus hypothesis contends that diversification reduces performance
because it exacerbates agency costs and leads to cross-subsidization of poorly performing
business lines (Berger and Ofek (1995)).
We examine these hypotheses by modeling performance as a function of a binary
diversification indicator and a range of other performance correlates. We consistently find that
undiversified insurers outperform diversified insurers. Our results indicate that diversification is
associated with a penalty of at least 1% of ROA or 2% of ROE. These findings are robust to
corrections for potential endogeneity bias, alternative risk measures, and an alternative
estimation technique. The existence of a diversification penalty provides strong support for the
strategic focus hypothesis.
Our study provides some of the first evidence on whether the diversification-performance
relation for P/L insurers is best explained by the conglomeration hypothesis or the strategic focus
hypothesis. It also contributes to the debate surrounding the relative efficiency of stock and
mutual insurers. Despite substantial research on the topic, there is no consensus on whether one
ownership structure outperforms the other. Our regression analysis provides evidence of the
relative risk-adjusted performance of stock and mutual insurers, holding other performance
determinants constant.
2

In addition to the abovementioned contributions to the insurance literature, the study
contributes to the general diversification-performance (D-P) literature. Unlike the majority of
studies in the finance, economics, and strategic management literature that have concentrated on
the effects of inter-industry diversification, we provide evidence on the effect of diversification
within a single industry.1 By studying line of business diversification in the P/L insurance
industry we are able to overcome many of the methodological challenges that are at least
partially responsible for the lack of consensus on the nature of the D-P relationship. Our findings
represent evidence of the D-P relation in a setting that eliminates, or reduces substantially, bias
introduced by unobservable industry effects, discretion in managerial segment reporting, and
diversification measurement error.
The study proceeds as follows. Section II reviews prior literature on line-of-business
diversification in the insurance industry. Section III develops our hypotheses. Section IV
describes our sample and data. Section V presents our empirical methodology. Section VI
discusses our results, and Section VII concludes.
II. Prior Literature
There is a paucity of studies on the effect of corporate diversification in the insurance
industry in general, and in the P/L insurance industry in particular.2 This is not surprising, due to
the exclusion of financial services firms in most finance studies on the topic and the focus on
conglomerates in much of the diversification literature. Studies that provide evidence on the
strategic focus and conglomeration hypotheses in the insurance industry include Hoyt and
1 Examples of intra-industry diversification studies include Davis, Robinson, Pearce and Park (1992) on the paper and pulp industry, Capozza and Seguin (1999) on the real estate investment trust industry, Stiroh (2004) on the community banking industry, and Laeven and Levine (2005) on financial conglomerates. 2 In the insurance industry, a distinction is usually made between the life-health insurance industry and the property-liability (also termed property-casualty) insurance industry. While some insurers choose to compete in both the life-health and the property-liability industries, the vast majority of insurers specialize in one or the other.
3

Trieschmann (1991); Tombs and Hoyt (1994); Meador, Ryan and Schellhorn (2000); Berger,
Cummins, Weiss and Zi (2000); Cummins and Nini (2002); and Cummins, Weiss and Zi
(2003).3
Hoyt and Trieschmann (1991) compare risk-return relationships between publicly traded
insurers that specialize in either P/L or L/H insurance, and those that diversify across both major
segments of the aggregate insurance industry. Using CAPM and mean-variance approaches to
measure risk-adjusted returns to shareholders, they find that specialized insurers performed better
over the sample period of 1973-1987. Tombs and Hoyt (1994) examine the relation between
stock returns and product-line focus for a panel of 26 insurers (operating in P/L and L/H) for the
period 1980-1990. They measure product-line focus in terms of a Herfindahl index of premiums
written across 10 business line groups. In their regression analysis of stock returns on focus and
several controls, they find that stock returns are positively related to focus. Thus, both Hoyt and
Trieschmann (1991) and Tombs and Hoyt (1994) provide evidence consistent with the strategic
focus hypothesis.
Berger, et al. (2000) compare the relative cost, revenue, and profit efficiency of diversified
and focused insurers over the period 1988-1992. Their classification of the degree of
diversification is similar to Hoyt and Trieschmann (1991) in that insurers that operate in either
the P/L or L/H industry are deemed to be specialists while those that are joint producers are
viewed as diversified. Their results suggest that neither hypothesis dominates for all firms. The
strategic focus hypothesis is more applicable to small insurers that specialize in commercial lines
while the conglomeration hypothesis holds more for large personal lines insurers.
3 In a somewhat related study, King (1975) finds significant differences in loss ratios between Ohio-licensed P/L insurers that have no affiliation to a group outside of the P/L industry, and P/L insurers that belong to non-insurance groups.
4

Cummins, et al. (2003) extend the work of Berger, et al. (2000) by using data envelopment
analysis to estimate the efficiency of specialists and diversified insurers. Their definition of
specialist and diversified insurers is the same as that used by Hoyt and Trieschmann (1991) and
Berger, et al. (2000). Using data on observed firm characteristics and estimated efficiency scores
for a sample of 817 firms over the period 1993-1997, they find general support for the strategic
focus hypothesis.
Meador, et al. (2000) focus exclusively on the L/H insurance industry. They use efficiency
analysis to examine the effects of product diversification for US life insurers. They compute
measures of X-efficiency that are regressed on a Herfindahl index of premiums written across the
six major L/H lines. Their results suggest that diversified life insurers are more X-efficient than
their more focused counterparts. They conclude that their results are “consistent with the
proposition that managers of multiproduct firms are able to achieve greater cost efficiencies by
sharing inputs and efficiently allocating resources across product lines in response to changing
industry conditions”.
Some evidence on the relation between diversification and accounting performance for P/L
insurers appears in a recent study on insurer capitalization by Cummins and Nini (2002). Their
empirical analysis includes a regression of performance (measured by ROE) on capitalization
and several controls, including line-of-business diversification. They measure line-of-business
diversification using a Herfindahl index of premiums written across all lines of business. They
find an inverse relation between diversification and ROE. This evidence is consistent with the
strategic focus hypothesis and contrary to the conglomeration hypothesis. It also invites a more
thorough analysis of the D-P relationship.
5

III. Hypotheses Development
Prior literature suggests that the relationship between diversification and performance may be
described as follows:
Performance = f (diversification | firm and industry characteristics)
Benefits to corporate diversification that suggest a positive D-P relation include scope
economies, larger internal capital markets, and risk reduction. Diversification provides firms
with the opportunity to benefit from cost and revenue scope economies. Cost scope economies
arise from the sharing of fixed production costs across several businesses within the firm (Teece
(1980)). Revenue scope economies may be realized due to the transfer of firm-specific
intangible assets such as brand reputation and customer loyalty (Markides (1992)).
Diversification also generates larger internal capital and labor markets. These internal markets
may be more efficient than external capital and labor markets due to information asymmetry
between the firm and the external markets (Myers and Majluf (1984)). Finally, diversification
reduces income volatility by combining revenue streams that are imperfectly correlated
(Lewellen (1971)). Given risk-sensitive customers, this risk-reduction should increase prices that
customers are willing to pay (Herring and Santomero (1990), Sommer (1996), Cummins and
Danzon (1997)).
Among the potential costs associated with diversification are exacerbated agency costs and
internal capital market inefficiencies. Agency costs are likely positively related to diversification
because managerial monitoring and bonding becomes more difficult as firms become more
complex. Furthermore, by creating larger internal capital markets, diversification enables
managers to avoid the market discipline that comes with external financing (Easterbrook (1984)).
Absent capital market discipline, managers are more inclined to engage in activities that
6

maximize their private benefits (e.g. increased perquisite consumption) and to subsidize failing
business segments (Berger and Ofek (1995)). Moreover, it is more difficult to align managerial
interests with those of owners in diversified firms because divisional performance may not be
observable.
The net effect of diversification is a function of firms’ ability to maximize the benefits while
minimizing the costs. In terms of the conglomeration hypothesis we should expect a positive
relation between diversification and performance because diversification’s benefits exceed its
costs. By contrast, the strategic focus hypothesis predicts that a negative relation should exist
because the costs of diversification outweigh the benefits.
Hypothesis 1 (Conglomeration): Diversification is positively related to performance.
Hypothesis 2 (Strategic Focus): Diversification is negatively related to performance.
Performance measure selection: Several measures of accounting performance have been
used in the insurance literature. The two most commonly used measures in the literature are
return on assets (ROA) and return on equity (ROE).4 These accounting performance measures
are also widely used in the diversification-performance literature (e.g. Hill, Hitt and Hoskisson
(1992), Hamilton and Shergill (1993), Mayer and Whittington (2003)). Consistent with Browne,
et al. (2001) and Greene and Segal (2004) we perform our empirical analysis on both
performance measures.
Because higher performance may simply be the result of higher risk, it is important to
consider the effect of diversification on risk-adjusted performance. While the majority of prior
D-P studies do not adjust for risk (Datta, Rajagopalan and Rasheed (1991)), there are two major
approaches that may be followed. The first approach is to divide the relevant performance
4 See for example, BarNiv and McDonald (1992); Pottier and Sommer (1999); Browne, Carson and Hoyt (2001); Lai and Limpaphayom (2003); Greene and Segal (2004).
7

measure by its variability over a given time period. For annual data, the time period used is
typically 5 years (Bettis and Hall (1982), Johnson and Thomas (1987)) or 10 years (Browne, et
al. (2001)). The second approach is to include a risk measure as a control variable in a linear
regression model where performance is the dependent variable. This approach has been followed
by Hamilton and Shergill (1993) and Lai and Limpaphayom (2003).5 The primary advantage of
the latter approach is that it allows for direct interpretation of the magnitude of the effect of
diversification on the dependent variable. Because our key results are unaffected by our risk-
adjustment method, we focus primarily on results of regression specifications using risk as a
control variable.
Diversification measure selection: The richness of our data enables us to identify the specific
insurance lines in which a firm operates.6 We follow the approach taken by diversification
discount researchers (e.g. Lang and Stulz (1994), Berger and Ofek (1995), Comment and Jarrell
(1995), Servaes (1996), Denis, Denis and Sarin (1997)), in using a discrete measure to
distinguish between undiversified firms operating in only one business line, and diversified firms
5 Grace (2004) uses the standard deviation of ROA for the past 5 years as a risk control in her analysis of executive compensation in the P/L insurance industry. 6 Consistent with Mayers and Smith (1988), we measure an insurer’s underwriting operations in terms of Direct Premiums Written (DPW). The most detailed source of these data is page 14 (Exhibit of Premiums and Losses (Grand Total)) of each insurer’s annual statutory filings. The following logical modifications are made to the statutory data.
i. Fire and Allied Lines is defined as the sum of “Fire” (line 1), “Allied lines” (line 2.1), “Multiple peril crop” (line 2.2), and “Federal flood” (line 2.3)
ii. Commercial multiple peril is defined as the sum of “Commercial multiple peril (non-liability portion)” (line 5.1) and “Commercial multiple peril (liability portion)” (line 5.2).
iii. Accident and Health is defined as the sum of “Group Accident and Health” (line 13), “Credit accident and health” (line 14), and several other types of accident and health (line 15.1 to 15.7)
iv. Personal Auto is defined as the sum of “Private passenger auto no-fault” (line19.1), “Other private passenger auto liability” (line 19.2), and “Private passenger auto physical damage” (line 21.1)
v. Commercial Auto is defined as the sum of “Commercial auto no-fault” (line 19.3), “Other commercial auto liability” (line 19.4), and “Commercial auto physical damage” (line 21.2)
The final list of 23 lines is as follows: Accident and Health, Aircraft, Boiler and Machinery, Burglary and Theft, Commercial Auto, Commercial Multi Peril, Credit, Earthquake, Farmowners’, Financial Guaranty, Fidelity, Fire and Allied lines, Homeowners’, Inland Marine, Medical Malpractice, Mortgage Guaranty, Ocean Marine, Other, Other Liability, Personal Auto, Products Liability, Surety, and Workers’ Compensation.
8

that operate in multiple business lines (MULTLINE). Variable definitions and descriptive
statistics are presented in Table 1.
<INSERT TABLE 1 HERE>
Table 2 compares medians and means of insurers that operate exclusively in one line of
business (undiversified) and those that operate in multiple lines (diversified). Notably, single-
line insurers earn higher ROA and ROE than multi-line insurers, but their performance volatility
(SDROA5 and SDROE5) is also higher than it is for diversified insurers. Looking at risk-
adjusted performance (RAROA and RAROE), single-line insurers still outperform multi-line
insurers. Thus, our univariate results provide evidence consistent with the strategic focus
hypothesis. Figure 1 compliments our descriptive statistics with the distribution of insurers and
ROA by number of lines written.
<INSERT TABLE 2 HERE>
<INSERT FIGURE 1 HERE>
Control variables
Datta, et al. (1991) emphasize the importance, in the analysis of the D-P relationship, of
controlling for the effect of both firm-specific and market factors that may explain performance
variation across firms. The following firm-specific control variables are used: size, capitalization,
ownership structure, geographic diversification, group status, publicly traded, and the percent of
premiums attributable to life-health insurance policies.
Firm Size: If larger firms have lower insolvency risk then they should be able to charge
higher prices than smaller insurers (Sommer (1996)), all else equal. Additionally, to the extent
that size conveys market power, we would expect larger firms to enjoy greater revenue
efficiencies than their smaller counterparts (Cummins and Nini (2002)). Cummins and Nini
9

(2002) find a positive relation between size and performance in the P/L industry. Browne,
Carson and Hoyt (1999) find that the positive size-performance relationship holds in the L/H
industry as well. We therefore expect size to be positively related to performance. Size is
measured as the natural logarithm of total assets.
Capitalization: Sommer (1996) finds that safer insurers are able to command higher prices.
Thus, we expect a positive relation between insurer capitalization and performance. We measure
capitalization as the ratio of policyholder surplus to total assets.
Ownership structure: The two forms of ownership structure included in our sample (stocks
and mutuals) have different inherent costs and benefits. It follows that the relation between
ownership structure and performance should reflect whether, on average, the costs of each
ownership structure are offset by the benefits. The advantages and disadvantages associated with
each ownership structure stem from each structure’s success in controlling incentive conflicts.
The two primary sets of incentives conflicts in insurance are owner-policyholder conflicts and
owner-manager conflicts (Mayers and Smith (1981)). Owner-policyholder conflicts are more
severe, and therefore imply greater costs, for stock companies than for mutuals. The mutual
form reduces the costs associated with divergent owner and policyholder interests (e.g. risk-
shifting) by merging the role of owner and customer. However, this reduction in owner-customer
agency costs may be offset by greater owner-manager agency costs that arise out of a less
effective market for corporate control.
Empirical evidence regarding the relative efficiency of stock and mutual insurers is mixed.
Cummins, Weiss and Zi (1999) examine the cost efficiency of stocks and mutuals in the P/L
industry and find support for the expense preference hypothesis, which predicts that mutuals will
have higher costs than stocks because control of managerial perquisite consumption is more
10
difficult in the mutual ownership form. By contrast, Greene and Segal (2004) find no significant
difference in cost efficiency, or accounting profitability, between mutual and stock life insurers.
These divergent empirical results suggest that the relation between ownership structure and
performance is ambiguous. We use a dummy variable (MUTUAL) to distinguish between
mutuals and stocks.
Geographic diversification: Pro-conglomeration arguments suggest that geographically
diversified firms are likely to have less volatile profits due to coinsurance effects. As a result of
their lower risk, geographically diversified insurers should be able to charge higher prices than
geographically focused insurers, all else equal. These arguments suggest a positive relation
between the degree of geographic diversification and risk-adjusted performance. By contrast,
pro-focus arguments suggest that geographically focused insurers are able to avoid costly
monitoring that is required when operating across different states (Winton (1999)) and achieve
efficiencies arising out of market specialization. Geographic diversification is measured as the
complement of the Herfindahl index of premiums written across all US states and protectorates
(GEODIV).
Industry concentration: The structure-conduct-performance paradigm suggests a positive
relation between industry concentration and prices. Chidambaran, Pugel and Saunders (1997)
find a positive relation between prices and market concentration in P/L insurance lines. We
therefore follow Montgomery (1985) in controlling for the concentration of industries in which a
firm participates. Montgomery argues that, ceteris paribus, firms operating in more concentrated
industries are likely to benefit from higher prices and higher profits. To capture the impact of the
competitiveness of firms’ markets on performance, we first calculate a Herfindahl concentration
11

index for each line of business (j=1 to 23) across all firms (i=1 to n) in each year (t=1995 to
2002):
2
1
n DPW ijtHHI jt
DPWi jt
⎛ ⎞⎜ ⎟= ∑⎜ ⎟= ⎝ ⎠
The larger the value of , the more concentrated is that line of business and the greater
is the potential for super-normal profits.
jtHHI
Next, we calculate each firm’s (i=1 to n) participation in each line of business (j=1 to 23) in
each year (t=1995 to 2002):
DPW ijt
wijt DPW it=
Using as weights we then calculate the weighted sum of firm exposure to industry
concentration across all of the lines in which it operates:
ijtw
23
1WCONC w HHI jtit ijt
j= ×∑
=
Firms with small values for WCONC are exposed to competitive business lines whereas
firms with large values for WCONC participate in business lines characterized by less
competitive market structures. Based on the predictions of the structure-conduct-performance
paradigm, we expect WCONC to be positively related to performance.
Group status: Our sample includes single-unaffiliated insurers as well as consolidated
insurance groups. Cummins and Sommer (1996) and Sommer (1996) suggest that customers
should be willing to pay more for insurance from unaffiliated insurers than those belonging to
insurance groups because groups have the option to let one of their members fail and
policyholders have difficulty in “piercing the corporate veil”. Thus, policyholders might view
12

consolidated groups as being more risky than identical single unaffiliated insurers. Group status
is measured in terms of a dummy variable (GROUP) equal to one if the unit of observation is a
group. We expect a negative relation between group status and performance.
Publicly Traded: Monitoring and scrutiny by shareholders and analysts implies a more
effective market for corporate control for publicly traded insurers than is present for private
insurers. Hence, we expect that publicly traded insurers should, on average, outperform
privately held insurers. We use a dummy variable, PUBLIC, to indicate whether an insurer is
publicly traded.
Life-Health: Although our sample firms all write primarily property-liability (P/L) insurance,
several firms in the sample also write life-health (L/H) business. We control for an insurer’s
participation in both industries by including a variable equal to the percentage of total premiums
(P/L plus L/H) attributable to operations in the life-health industry (PCTLH). To the extent that
this variable indicates greater diversification, we expect it to have the same relationship with
performance as our intra-industry diversification measure
In addition to the above firm-specific controls, we include controls for time-induced variation
in performance (year dummies). We also control for performance variation that is induced by
companies operating in different states that have different regulatory stringency and
demographics by including dummy variables indicating an insurer’s participation in any given
state or protectorate. Finally, to control for line-of-business effects, we include dummy variables
indicating an insurer’s participation in different lines.
IV. Sample and Data
Our initial sample includes all firms in the NAIC database for the years 1995 to 2002. This
period is chosen for two reasons. First, it is sufficiently long to include both positive and
13

negative market conditions. For the majority of the 1990s and latter part of the 1980s, the P/L
market was characterized by “soft” market conditions where prices were low and supply was
abundant. After 1999 the market began to harden as prices increased and availability decreased.7
Second, our empirical analysis includes historical risk measures that require up to 10 years of
prior data, and 1985 is the first year for which we are able to obtain insurer data from the NAIC.
Our first screen is to exclude firms that are under regulatory scrutiny. Next we exclude firms
that report negative direct premiums written or total admitted assets. We then aggregate affiliated
insurers, controlling for potential double counting of intra-group shareholding. This aggregation
is appropriate as diversification decisions are likely made at the group level (Berger, et al.
(2000)). Groups are assigned an organizational structure based on data collected from Best‘s
Insurance Reports. Next, we exclude groups with substantial premium income (at least 25% of
total premiums) from L/H insurance, since our focus is on P/L insurers. Because we use
historical risk measures requiring between 5 and 10 years of data we exclude firms with less than
5 years of historical data. Finally, we exclude firms with organizational structures other than
stock or mutual.
V. Regression Methodology
Our multivariate analysis is performed with a series of pooled, cross-sectional, time-series
OLS regressions. The first part of our regression analysis focuses on whether any diversification
is performance enhancing (or reducing). Following Berger and Ofek (1995), we use an indicator
variable MULTLINE to denote whether an insurer operates in one line (MULTLINE=0) or
multiple lines (MULTLINE=1) in any given year. Our basic regression model that is used to
measure the effect of diversification on performance is defined in equation (1).
7 Ceniceros and Hofmann (1999), Ruquet (2000), and Goch (2001).
14

Eq. (1) 0 1 2 3 4
5 6 7 8 9
10 11 17 18 40 41 965
it it it it it
it it it it i
it it it it it
ROA MULTLINE SIZE CAPASSET GEODIVWCONC PCTLH MUTUAL PUBLIC GROUPSDROA YEAR LINE STATE
β β β β ββ β β β ββ β β β ε− − −
= + + + ++ + + ++ + + +
++
Variable definitions appear in Table 1. We estimate equation (1) twice, first with year
dummies (OLS1) and then with year, line and state dummies (OLS2). For robustness, other
estimation techniques are used in addition to OLS. Recent research on the diversification
discount has attributed the observed discount in prior studies to endogeneity bias. If MULTLINE
is not exogenous (uncorrelated with the error term) then OLS estimates of its effect on ROA will
be biased and inconsistent. Endogeneity usually arises due to omitted variables, measurement
error, simultaneity bias, or a combination of these factors Wooldridge (2002). We use a
regression-based Hausman test for the exogeneity of MULTLINE and reject the null hypothesis
of exogeneity.8
Diversification discount researchers (e.g. Campa and Kedia (2002), Villalonga (2004), and
Laeven and Levine (2005)) have used three different techniques to control for endogeneity bias.
One approach used by these researchers is the fixed-effects regression estimation. The advantage
of this approach is that it enables the researcher to control for unobservable (or omitted) firm-
specific effects that may be correlated with other regressors in the model. A disadvantage of the
fixed-effects method is that its applicability is limited to settings where key explanatory variables
exhibit sufficient within-firm variation. If independent variables do not vary over time, they are
‘swept-away’ in the time-demeaning process that eliminates the time-invariant unobserved
effects. For independent variables that do not vary much over time, the fixed-effects estimation
8 We test for the exogeneity of MULTLINE using the procedure described in Wooldridge (2002, 118-124). First, we regress MULTLINE on an instrument set (discussed later) and all other independent variables listed in equation (1). We then include the residuals from the MULTLINE regression as an additional independent variable in a regression of ROA on MULTLINE and all other independent variables. The t-statistic (8.58) associated with our generated regressor is sufficiently large to reject the null hypothesis of exogeneity at the 1% level.
15

technique can lead to imprecise estimates Wooldridge (2002). Because our key explanatory
variable (MULTLINE) is almost entirely time-invariant9 we do not apply the fixed-effects
approach.10
Other approaches that have been used to deal with the potential endogeneity bias include
estimation of equation (1) using a two-stage least squares (2SLS) approach and a Heckman
(treatment effects) approach (Campa and Kedia (2002), Villalonga (2004), and Laeven and
Levine (2005)).11 The first stage of the 2SLS approach entails regressing MULTLINE on the
other independent variables in equation (1) and a set of instruments that do not appear in
equation (1). In the second stage, equation (1) is estimated using the predicted values for
MULTLINE obtained in the first stage regression. The Heckman approach follows the same
procedure as the 2SLS approach but also includes a self-selection parameter in the second stage
that is calculated using information obtained in the first-stage regression.
Both techniques require the selection of instruments for MULTLINE. Campa and Kedia
(2002) suggest an instrument set comprised of current, lagged, and historically averaged
measures of firm characteristics, industry growth, and general economic growth. Our initial set
of instrumental variable candidates consists of lagged values of firm characteristics included in
equation (1); five-year historical averages of firm characteristics included in equation (1); one-
year growth in direct premiums written for the P/L industry; one-year growth in U.S. gross
9 In our sample we have a total of 949 firms (5373 firm-year observations). Of these 949 firms, there are 248 firms (1377 firm-year observations) that operate in one line only, in at least one year. Of these 248 firms, 171 are single-line for the entire sample period. Thus, variation in MULTLINE occurs in only 77 firms, or 8% of all sample firms. 10 As an alternative to traditional fixed-effects estimation we use a Hausman-Taylor generalized instrumental variables estimator (Hausman and Taylor (1981)). We condition on the sub-sample of firms for which MULTLINE is time-invariant and obtain coefficient estimates for MULTLINE that are similar to those reported in Tables 3 and 4. 11 McCullough and Hoyt (2005) use these techniques in the context of insurance industry mergers and acquisitions.
16

domestic product; firm age; firm reinsurance use; and an index12 that captures the attractiveness
of a firm’s markets to single-line insurers.
Successful instrumental variable candidates must satisfy two conditions.13 The first
condition, instrument relevance, requires that the instruments have a high partial correlation with
MULTLINE. The second condition, instrument validity, requires that the instruments are
uncorrelated with the error term in equation (1). Instrument relevance is tested using a Wald test
for the joint significance of the excluded instruments. The null hypothesis under the Wald test is
that the instruments are jointly insignificant. Because multiple candidates pass the instrument
relevance test we are able to test for instrument validity using a Sargan test of overidentifying
restrictions. The null hypothesis under the Sargan test is that the instruments are uncorrelated
with the error term (i.e. exogenous). Three candidates (age, reinsurance use, and the index
reflecting the attractiveness of the insurer’s markets to single-line insurers) meet both the
relevance and validity conditions.
VI. Results
Results for the effect of diversification status on ROA using each of the estimation
techniques appear in Table 3.14 The coefficient estimates on MULTLINE are negative and
significant in all estimations, showing that ROA for diversified firms is between 1.2 and 6.8
percent lower than for single line firms. This negative relation between diversification and
performance supports the strategic focus hypothesis. Berger and Ofek (1995) present some
12 This index (W%SINGLE) is based on similar measures used by Campa and Kedia (2002) and Laeven and Levine (2005). First we calculate the percentage of single-line insurers in each business line (%SINGLE). For each insurer we then calculate the weighted sum of that insurer’s participation in each line (wijt) and %SINGLE for that line.
Thus, W%SINGLE = 23
%1
w SINGLEijt jtj
×∑=
13 The discussion that follows is based on Wooldridge (2002, 85-92). 14 To conserve space, coefficient estimates for year, line and state dummies are not reported.
17

evidence on the size of the “diversification penalty” using accounting data for a large cross-
section of non-financial firms for the period 1986-1991. They compare industry-adjusted ROA
between single-segment firms and diversified firms and report a mean penalty of 1.5%. Thus,
our estimates of the diversification penalty, for a sub-sample of financial firms, are similar to
their estimates based on a broad cross-section of non-financial firms.15
<INSERT TABLE 3 HERE>
It is important to note that the Berger and Ofek (1995) definition of single-segment firms is
far broader than ours. They define single segment firms as those operating in one 4-digit SIC
code. Thus, almost all of the firms in our sample (with the exception of insurer groups that
participate in the L-H insurance industry and insurers that are owned by diversified
conglomerates) would be classified as single-segment firms by Berger and Ofek and by other
diversification discount researchers (e.g. Lang and Stulz (1994)), Servaes (1996)). This implies
that diversification discount studies that compare the performance of multi-segment firms to
broadly defined single segment firms are actually underestimating the size of the diversification
discount.16
The pattern of our results on MULTLINE across the various models differs from what has
been found by Campa and Kedia (2002) and Villalonga (2004) in their studies of the
diversification discount. They find that the discount is reduced when accounting for self-
selection bias. Hence, their findings are consistent with the hypothesis that firms that choose to
15 To make our results more comparable to their sample we also perform our analysis on the sub-sample of firms whose assets exceed $20 million. Our univariate and multivariate results presented later hold for this sample as well. 16 We acknowledge that the diversification discount literature relates diversification status to market-based performance measures (such as excess-value and Tobin’s Q) while our study considers accounting performance. Evidence supporting a reasonably strong positive correlation between Q and accounting profit suggests that our results may be generalized to market-based situations. For example, Demsetz and Villalonga (2001) report a correlation of .61 between accounting profit (ROA) and Tobin’s Q. Furthermore, studies such as Berger and Ofek (1995) and Laeven and Levine (2005) find that their market-based diversification discount results are robust to the use of accounting-based performance measures.
18

diversify would trade at a discount irrespective of their diversification status. However, our
results are consistent with those of Laeven and Levine (2005) in their study of the diversification
discount in the banking industry. Similar to our findings, they show that the discount persists
after controlling for potential endogeneity of the diversification decision. In several of their
instrumental variables and treatment effects regressions they report larger discounts than they
find using OLS, as do we.17
SIZE is positively and significantly related to performance across all models, consistent with
larger firms having economies of scale and lower insolvency risk. The coefficient on
CAPASSET is positive and significant, consistent with the hypothesis that higher prices paid by
risk-averse policyholders to safer insurers will translate into higher risk-adjusted performance.
The negative sign on GEODIV, and its significance in three of the four regressions, implies that
potential benefits from risk-reduction are offset by the costs associated with greater managerial
discretion. The coefficients on WCONC are positive and significant in three of the models. We
therefore find some support for the hypothesis that firms operating in more concentrated business
lines are able to charge higher prices and earn higher profits than firms in less concentrated lines.
Our control for the percentage of premiums from L-H insurance (PCTLH) is significant in the
OLS regressions but not significant in the instrumental variables and treatment effects
regressions.
MUTUAL is significantly negatively related to performance across all models. Thus, it
appears that higher owner-manager agency costs outweigh any benefits associated with the
17 Graham, Lemmon and Wolf (2002) find evidence suggesting that the diversification discount observed in firms diversifying via acquisitions is due to the tendency of acquirers to purchase weak targets. To investigate whether the diversification penalty is simply due to the acquisition of weak insurers by insurer groups we perform our analysis on the sub-sample of single-unaffiliated insurers. These firms are not members of insurance groups and are therefore not affected by any effects of merger and acquisition activity. The coefficient on MULTLINE is -0.012 in the ROA regression and -0.021 in the ROE regression. All other independent variables, with the exception of SDROA5 (which is positive and significant) are of the same sign as in the full-sample analysis.
19

reduction in owner-customer agency costs. Our finding is consistent with Cummins, et al.
(1999). The coefficient on PUBLIC is generally insignificant. GROUP enters as negative and
significant in all models. This negative relation may be due to lower prices induced by the
option to let a member fail, costs of managerial discretion, or other costs associated with
conglomeration. Surprisingly, our risk measure (SDROA5) is not significant in any of the
models.18
Robustness of diversification status results
Alternative performance measure: To investigate whether our results are robust to a different
performance measure, we repeat our regression analysis using return on equity (ROE) as the
dependent variable. Results are reported in Table 4. Consistent with our ROA results, the
coefficient on MULTLINE is negative and significant across all model specifications. The size
of the penalty is roughly double that observed for ROA. This difference is not surprising given
that the univariate size of the performance difference between single-line and multi-line insurers
is almost 2 times larger when measuring performance in terms of ROE than when performance is
measured by ROA.19 The results for our other regressors generally follow those reported for
Table 3.
<INSERT TABLE 4 HERE>
Alternative risk measures: We investigate the robustness of our results to alternative risk
measures by replacing SDROA5 with three alternative risk measures. First, we extend the time
18 As explained below, alternative risk measures were also used and only the 10-year risk measures were ever significant. Consistent with our expectations, the 10-year measures were positive and significant. We use the 5-year measures rather than the 10-year measures because the latter reduce sample size by over 15%, and do not affect the magnitude or significance of any of the other independent variables, It is worth noting that all of these risk measures, including SDROA5, are positive and significant in the sub-sample of firms with assets exceeding $10 million (as per the sample selection criterion of Cummins et al. (2003)). Applying this sample selection criterion to our sample reduces the number of firms by 25% and does not affect the sign or significance of our other independent variables. Accordingly, we continue our analysis on the full sample. 19 See Table 2.
20

period over which we calculate the standard deviation of ROA, from 5 to 10 years (SDROA10).
Second, we follow Klein, Phillips and Shiu (2002) and use the standard deviation of the residual
from a regression of ROA for the past 10 years on a linear time trend (KLEIN10). We also
compute this measure over a 5-year period (KLEIN5). Third, we use a measure of total firm risk
(FIRMRISK), based on the option pricing model of the insurance firm, introduced by Cummins
and Sommer (1996).20 Results, reported in Table 5, indicate that the coefficient for MULTLINE
using any of these alternative risk measures is very similar to that obtained using SDROA5 as a
risk measure.
<INSERT TABLE 5 HERE>
Alternative estimation method: A common method of measuring the diversification discount
is the “excess value” approach applied by Lang and Stulz (1994) and others. In terms of this
approach, conglomerates are broken-down into businesses segments and the observed value of
the conglomerate is compared to an estimate of what it would be if the conglomerate were a
portfolio of specialists. The excess value is the difference between the actual value of the
conglomerate and an imputed value of the sum of its parts. A diversification discount is implied
by negative excess values.
Laeven and Levine (2005) apply this approach to the banking industry. They distinguish
between two distinct activities – lending and non-lending services – and compare the Tobin’s Q
of banks that perform both activities to what it would be if the multi-activity bank were broken
down into two specialist banks that specialize in each of the activities. They also extend the
excess value methodology to a comparison of operating performance (return on assets) between
multi-activity and specialist banks.
20 See Cummins and Sommer (1996) or Sommer (1996) for details on the calculation of this risk measure.
21

To test the robustness of our results to an alternative discount/penalty estimation technique,
we apply the Laeven and Levine (2005) approach to our sample of insurance companies. In
order to have a sufficient number of “specialist” firms we broaden our definition of a
specialist/undiversified insurer from one that operates in only one line to one that operates in
only one group of similar insurance lines. Thus, the first step in applying the excess value
approach is to aggregate the 23 lines of business into homogeneous groups.21
There are at least two approaches that can be followed. One approach is for the researcher to
determine groups based on what appears most sensible (e.g. McCullough and Hoyt (2005),
Tombs and Hoyt (1994)). An alternative approach is to “allow the data to speak” and use a
mathematical aggregation method that does not require prior restrictions on either the
composition or structure of the aggregated groups. We follow both approaches but concentrate
our discussion on the latter approach.
Following Mayers and Smith (1988), we use a variant of principal components analysis to
define the groups, or bundles, of similar business lines. Specifically, we use cluster analysis to
aggregate the 23 distinct lines of business into a number of clusters using the VARCLUS
procedure in SAS. We apply the VARCLUS procedure to the matrix of DPW per line for all
firms in our sample to identify groups of business lines that tend to be written together, and are
therefore assumed to be relatively homogeneous.
VARCLUS initially assigns all of the lines to one cluster and then iteratively splits the
cluster/s until the intra-cluster correlation for all cluster members cannot be improved by further
splitting the remaining clusters. The final number of clusters and membership of each cluster is
determined by an algorithm that maximizes the sum across clusters of the variation accounted for
21 There is precedent for grouping lines into a smaller number of groups. McCullough and Hoyt (2005) group similar lines together to form 14 distinct bundles. Mayers and Smith (1988) use factor analysis to arrive at 9 groups of lines.
22

by the cluster components.22 Cluster analysis of the full data set yields five clusters of insurance
lines.23 We then aggregate premiums for each insurer into these five clusters and treat each
cluster as a separate activity.24 Specialist insurers are defined as those insurers writing all of their
premiums in one cluster. The intuition of the excess value approach is to compare the
performance of a multi-cluster insurer to what it would be if it were broken down into a number
of specialist (single-cluster) insurers. The excess value approach, applied to insurer ROA, can be
expressed as follows:
Excess = - Activity-Adjusted
5Activity-Adjusted ,
15
such that 1,1
is the total direct premium written by insurer in year ,
i
ROA ROA ROAit it it
ROA ROAit ict ctcDPWictict ictDPW cit
whereDPW i titDPWict
α
αα
= ∑=
= =∑=
s the total direct premium written by insurer in cluster in year ,
is the average ROA for all single-cluster firms that operate in cluster in year
i c t
ROA c tct
We apply this technique to our sample of insurers to obtain Excess ROA values for all firms,
for each sample year. The mean Excess ROA for multi-cluster firms is -0.011 and is statistically
significant at the 1% level. To control for other factors that affect Excess ROA we regress it on a
22 For more detailed information on the VARCLUS procedure see SAS Institute (1999), Chapter 68. 23 The clusters are as follows:
i. Aircraft, Fire and Allied Lines, Boiler and Machinery, Burglary and Theft, Commercial Multi-Peril, Inland Marine, Medical Malpractice, Other Liability, Surety, Workers’ Compensation
ii. Commercial Auto, Farmowners’, Other, Products Liability iii. Earthquake, Homeowners’, Personal Auto iv. Accident and Health, Credit, Fidelity, Ocean Marine v. Financial Guaranty, Mortgage Guaranty 24 We recognize that the composition of these clusters is less than ideal. For example, one would expect Surety and Fidelity to be in the same group. Accordingly we repeat our analysis using the more intuitive McCullough and Hoyt (2005) groups as separate activities as well as a simple split between personal and commercial lines. Our results from these analyses are consistent with what is reported in Table 6.
23

dummy variable that indicates firm participation in either one, or several clusters (MULTCLUS),
and other control variables from equation (1). Our multivariate results, reported in Table 6,
provide further support for the strategic focus hypothesis and demonstrate that our earlier results
are robust to an alternative estimation technique.
<INSERT TABLE 6 HERE>
Persistence of the diversification penalty
Having established that single-line insurers outperform multi-line insurers, on average, we
examine whether the negative D-P relation persists across different levels of diversification.
Following Lang and Stulz (1994) and Servaes (1996), we replace MULTLINE in equation (1)
with a series of dummy variables to capture the effect on performance of operating in n or more
business lines, where n goes from 2 to 10.25 The coefficient on the first dummy variable,
“operates in 2 or more business lines”, is interpreted as the difference between the ROA of firms
that write two lines of business and the ROA of single-line insurers. The sum of the coefficients
on the first and second dummy variables is the difference between the ROA of firms that write
three lines and single-line insurers. Thus, the coefficient on each dummy variable represents the
marginal contribution to ROA of the nth line. Regression results appear in Table 7.
Only the first dummy variable, “operates in 2 or more business lines”, is negative and
significant and none of the other dummy variables enter as significant. Coefficient estimates on
the other explanatory variables are similar to those reported for our regressions of performance
on MULTLINE. Consistent with studies on inter-industry diversification (e.g. Lang and Stulz
(1994), Servaes (1996)) we find no evidence of persistence in the diversification-performance
25 Almost 80% of our sample firms operate in fewer than 10 lines of business.
24

relation at the intra-industry level.26 Thus, the key distinction seems to be whether a firm is
diversified or not, while the level of diversification appears to be unimportant.
<INSERT TABLE 7 HERE>
VII. Conclusion
Our study provides some of the first evidence on the relation between line-of-business
diversification and performance for property-liability insurers. We investigate two aspects of the
diversification-performance relationship. First, we consider the relation between diversification
status and performance. We model performance as a function of a binary diversification indicator
and a range of other performance correlates. We consistently find that undiversified insurers
outperform diversified insurers. Our results indicate that diversification is associated with a
penalty of at least 1% of ROA or 2% of ROE. These finding are robust to corrections for
potential endogeneity bias, alternative risk measures, and an alternative estimation technique.
The existence of a diversification penalty provides strong support for the strategic focus
hypothesis.
Next, we explore the possibility that the diversification penalty persists. We model
performance as a function of a series of dummy variables that capture the marginal contribution
to performance of each additional line of business. Consistent with studies on non-financial
conglomerates we find no evidence supporting persistence of the diversification penalty. We also
find some interesting results with respect to several of our control variables. In every regression
specification we find that both size and capitalization are positively related to accounting
performance. These results support the hypothesis that customers are willing to pay more for
26 We also use a continuous measure of diversification (the Herfindahl of premiums of written across 23 lines) to investigate whether the penalty persists. We replace MULTLINE with this measure and run the model on the sub-sample of diversified firms. The measure is insignificant and supports our results reported in Table 7.
25

insurance from insurers that have lower insolvency risk. The relation between size and
performance may also be explained in terms of scale economies.
We present new evidence on the relative profitability of mutual and stock insurers. In every
model we find that mutual insurers are significantly less profitable than stock insurers. We also
find some support for the hypothesis that firms operating in more concentrated business lines are
able to charge higher prices and earn higher profits than firms in less concentrated lines. Finally,
we find that unaffiliated insurers consistently outperform aggregated insurer groups. This
negative relation between insurer groups and profitability may be due to lower prices induced by
the option to let a member fail, costs of managerial discretion, or other costs associated with
conglomeration.
26

References
BarNiv, Ran, and James B. McDonald, 1992, Identifying Financial Distress in the Insurance Industry: A Synthesis of Methodological and Empirical Issues, Journal of Risk and Insurance 59, 543-574.
Berger, Allen N., J. David Cummins, Mary A. Weiss, and Hongmin Zi, 2000, Conglomeration versus Strategic Focus: Evidence from the Insurance Industry, Journal of Financial Intermediation 9, 323-362.
Berger, Philip G., and Eli Ofek, 1995, Diversification's Effect on Firm Value, Journal of Financial Economics 37, 39-65.
Bettis, Richard A., and William K. Hall, 1982, Diversification Strategy, Accounting Determined Risk, and Accounting Determined Return, Academy of Management Journal 25, 254-264.
Browne, Mark J., James M. Carson, and Robert E. Hoyt, 1999, Economic and Market Predictors of Insolvencies in the Life-Health Insurance Industry, Journal of Risk and Insurance 66, 643-659.
Browne, Mark J., James M. Carson, and Robert E. Hoyt, 2001, Dynamic Financial Models of Life Insurers, North American Actuarial Journal 5, 11-26.
Campa, Jose Manuel, and Simi Kedia, 2002, Explaining the Diversification Discount, Journal of Finance 57, 1731-62.
Capozza, Dennis R., and Paul J. Seguin, 1999, Focus, Transparency and Value: The REIT Evidence, Real Estate Economics 27, 587-619.
Ceniceros, Roberto, and Mark A. Hofmann, 1999, Insurers rejoice at first few signs of firmer pricing, Business Insurance, July 5, 3.
Chidambaran, N.K., T.A. Pugel, and A. Saunders, 1997, An Investigation of the Performance of the U.S. Property-Liability Insurance Industry, Journal of Risk and Insurance 64, 371-381.
Comment, Robert, and Gregg A. Jarrell, 1995, Corporate Focus and Stock Returns, Journal of Financial Economics 37, 67-87.
Cummins, J. David, and David W. Sommer, 1996, Capital and Risk in Property-Liability Insurance Markets, Journal of Banking and Finance 20, 1069-1092.
Cummins, J. David, and Patricia M. Danzon, 1997, Price, Financial Quality, and Capital Flows in Insurance Markets, Journal of Financial Intermediation 6, 3-38.
Cummins, J. David, Mary A. Weiss, and Hongmin Zi, 1999, Organizational Form and Efficiency: The Coexistence of Stock and Mutual Property-Liability Insurers, Management Science 45, 1254-1269.
27

Cummins, J. David, and Gregory Nini, 2002, Optimal Capital Utilization by Financial Firms: Evidence From the Property-Liability Insurance Industry, Journal of Financial Services Research 21, 15-53.
Cummins, J. David, Mary A. Weiss, and Hongmin Zi, 2003, Economies of Scope in Financial Services: A DEA Bootstrapping Analysis of the US Insurance Industry, working paper, Wharton Financial Institutions Center (Philadelphia, PA).
Datta, Deepak K., Nandini Rajagopalan, and Abdul M.A. Rasheed, 1991, Diversification and Performance: Critical Review and Future Directions, Journal of Management Studies 28, 529-558.
Davis, Peter S., Richard B. Robinson, Jr., John A. Pearce, II, and Seung Ho Park, 1992, Business Unit Relatedness and Performance: A Look at the Pulp and Paper Industry, Strategic Management Journal 13, 349-361.
Demsetz, Harold, and Belén Villalonga, 2001, Ownership structure and corporate performance, Journal of Corporate Finance 7, 209-233.
Denis, David J., Diane K. Denis, and Atulya Sarin, 1997, Agency Problems, Equity Ownership, and Corporate Diversification, Journal of Finance 52, 135-160.
Easterbrook, Frank H., 1984, Two Agency-Cost Explanations of Dividends, American Economic Review 74, 650-59.
Goch, Lynn, 2001, Market Hardening, Best's Review, September, 1.
Grace, Elizabeth, 2004, Contracting Incentives and Compensation for Property-Liability Insurer Executives, Journal of Risk and Insurance 71, 285-307.
Graham, John R., Michael L. Lemmon, and Jack G. Wolf, 2002, Does Corporate Diversification Destroy Value?, Journal of Finance 57, 695-720.
Greene, W.H., and D. Segal, 2004, Profitability and Efficiency in the U.S. Life Insurance Industry, Journal of Productivity Analysis 21, 229-247.
Hamilton, R. T., and G. S. Shergill, 1993, Extent of Diversification and Company Performance: The New Zealand Evidence, Managerial and Decision Economics 14, 47-52.
Hausman, Jerry A., and William E. Taylor, 1981, Panel Data and Unobservable Individual Effects, Econometrica 49, 1377-1398.
Herring, Richard J., and Anthony M. Santomero, 1990, The Corporate Structure of Financial Conglomerates, Journal of Financial Services Research 4, 471-497.
Hill, Charles W. L., Michael A. Hitt, and Robert E. Hoskisson, 1992, Cooperative versus Competitive Structures in Related and Unrelated Diversified Firms, Organization Science 3, 501-521.
28

Hoyt, Robert E., and James S. Trieschmann, 1991, Risk/Return Relationships for Life-Health, Property-Liability, and Diversified Insurers, Journal of Risk and Insurance 58, 322-330.
Johnson, G., and H. Thomas, 1987, The Industry Context of Strategy, Structure and Performance: The U.K. Brewing Industry, Strategic Management Journal 8, 343-361.
King, Alan L., 1975, The Market Performance of Diversified and Non-Diversified Organizations within the P-L Insurance Industry, Journal of Risk and Insurance 42, 471-493.
Klein, Robert W., Richard D. Phillips, and Wenyan Shiu, 2002, The Capital Structure of Firms Subject to Price Regulation: Evidence from the Insurance Industry, Journal of Financial Services Research 21, 79-100.
Laeven, Luc, and Ross Levine, 2005, Is There a Diversification Discount in Financial Conglomerates?, Journal of Financial Economics forthcoming.
Lai, Gene C., and Piman Limpaphayom, 2003, Organizational Structure and Performance: Evidence From the Nonlife Insurance Industry in Japan, Journal of Risk and Insurance 70, 735-758.
Lang, Larry H. P., and Rene M. Stulz, 1994, Tobin's q, Corporate Diversification, and Firm Performance, Journal of Political Economy 102, 1248-1280.
Lewellen, Wilbur G., 1971, A Pure Financial Rationale for the Conglomerate Merger, Journal of Finance 26, 521-37.
Markides, Constantinos C., 1992, Consequences of Corporate Refocusing: Ex Ante Evidence, Academy of Management Journal 35, 398-412.
Mayer, M., and R. Whittington, 2003, Diversification in Context: a Cross National and Cross Temporal Extension, Strategic Management Journal 24, 773-781.
Mayers, David, and Clifford W. Smith, Jr., 1981, Contractual Provisions, Organizational Structure, and Conflict Control in Insurance Markets, Journal of Business 54, 407-434.
Mayers, David, and Clifford W. Smith, Jr., 1988, Ownership Structure across Lines of Property-Casualty Insurance, Journal of Law and Economics 31, 351-78.
McCullough, Kathleen A., and Robert E. Hoyt, 2005, Characteristics of Property-Liability Insurance Acquisition Targets, Journal of Insurance Issues 28, 61-87.
Meador, Joseph W., Harley E. Ryan, Jr., and Carolin D. Schellhorn, 2000, Product Focus versus Diversification: Estimates of X-Efficiency for the US Life Insurance Industry, in Patrick T. Harker, and Stavros A. Zenios, eds.: Performance of financial institutions : efficiency, innovation, regulation (Cambridge University Press, New York).
Montgomery, Cynthia A., 1985, Product-Market Diversification and Market Power, Academy of Management Journal 28, 789-798.
29

Myers, Stewart C., and Nicholas S. Majluf, 1984, Corporate Financing and Investment Decisions When Firms Have Information That Investors Do Not Have, Journal of Financial Economics 13, 187-221.
Pottier, Steven W., and David W. Sommer, 1999, Property-liability insurer financial strength ratings: differences across rating agencies, Journal of Risk and Insurance 66, 621-642.
Ruquet, Mark E., 2000, Market Hardening, Survey Says, National Underwriter: Property & Casualty, August 28, 1.
SAS Institute, Inc., 1999, SAS/STAT User's Guide, (Cary N.C.).
Servaes, Henri, 1996, The Value of Diversification During the Conglomerate Merger Wave, Journal of Finance 51, 1201-1225.
Sommer, David W., 1996, The Impact of Firm Risk on Property-Liability Insurance Prices, Journal of Risk and Insurance 63, 501-514.
Stiroh, Kevin H., 2004, Do Community Banks Benefit from Diversification?, Journal of Financial Services Research 25, 135-160.
Teece, David J., 1980, Economies of scope and the scope of the enterprise, Journal of Economic Behavior and Organization 1, 223-247.
Tombs, Joseph W., and Robert E. Hoyt, 1994, The Effect of Product Line Focus on Insurer Stock Returns, Proceedings of the International Insurance Association Annual Meeting 331-337.
Villalonga, Belén, 2004, Does diversification cause the ‘diversification discount’?, Financial Management 33, 5-27.
Winton, Andrew, 1999, Don't Put All Your Eggs in One Basket? Diversification and Specialization in Lending, Working Paper, University of Minnesota - Twin Cities.
Wooldridge, Jeffrey M., 2002. Econometric analysis of cross section and panel data (MIT Press, Cambridge, Massachusetts).
30

Figure 1. Distribution and performance of sample insurers by number of lines
0.00%
5.00%
10.00%
15.00%
20.00%
25.00%
1 2 3 4 5 6 7 8 9 10 11 12 13 ormore
Number of lines in which insurer has Direct Premiums Written > 0
% o
f sam
ple
0.0%
0.5%
1.0%
1.5%
2.0%
2.5%
3.0%
3.5%
4.0%
Ret
urn
on A
sset
s
% of sample Return on Assets
31
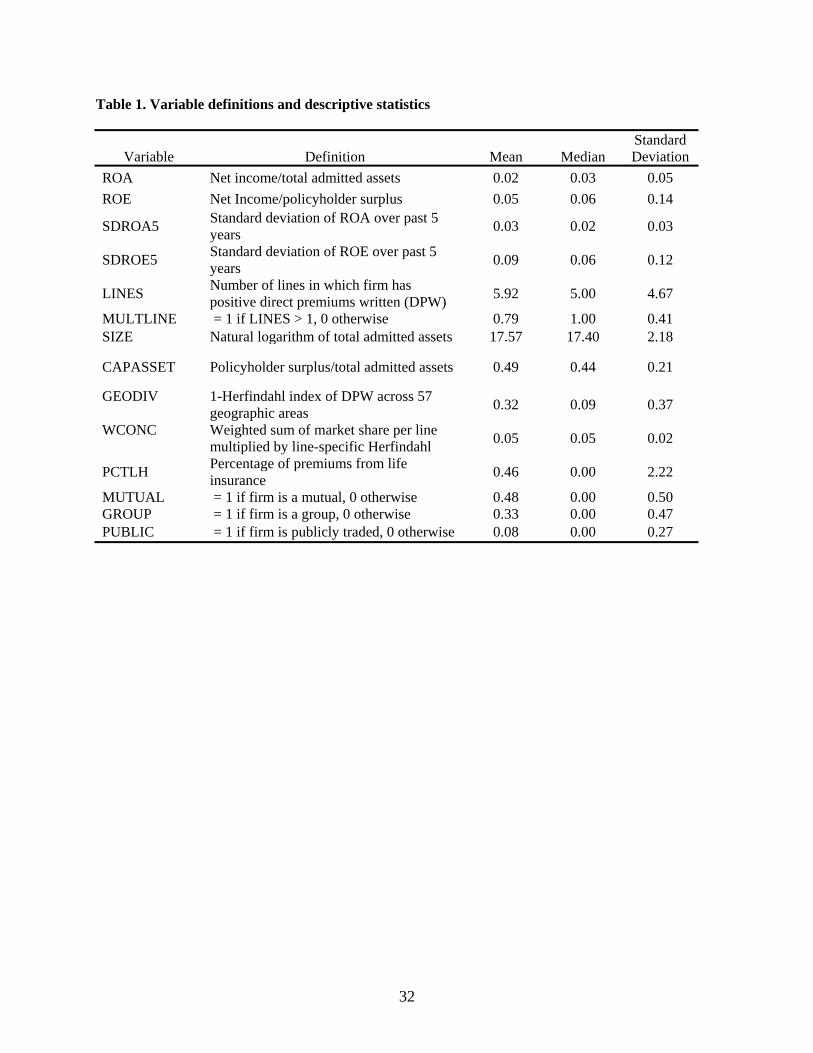
Table 1. Variable definitions and descriptive statistics
Variable Definition Mean Median Standard Deviation
ROA Net income/total admitted assets 0.02 0.03 0.05 ROE Net Income/policyholder surplus 0.05 0.06 0.14
SDROA5 Standard deviation of ROA over past 5 years 0.03 0.02 0.03
SDROE5 Standard deviation of ROE over past 5 years 0.09 0.06 0.12
LINES Number of lines in which firm has positive direct premiums written (DPW) 5.92 5.00 4.67
MULTLINE = 1 if LINES > 1, 0 otherwise 0.79 1.00 0.41 SIZE Natural logarithm of total admitted assets 17.57 17.40 2.18
CAPASSET Policyholder surplus/total admitted assets 0.49 0.44 0.21
GEODIV 1-Herfindahl index of DPW across 57 geographic areas 0.32 0.09 0.37
WCONC Weighted sum of market share per line multiplied by line-specific Herfindahl 0.05 0.05 0.02
PCTLH Percentage of premiums from life insurance 0.46 0.00 2.22
MUTUAL = 1 if firm is a mutual, 0 otherwise 0.48 0.00 0.50 GROUP = 1 if firm is a group, 0 otherwise 0.33 0.00 0.47 PUBLIC = 1 if firm is publicly traded, 0 otherwise 0.08 0.00 0.27
32

Table 2. Univariate comparison between diversified and single-line insurers
Single-line insurers Diversified insurers (1132 firms) (4241 firms)
Single-line minus Diversified
Variable Mean Median Mean Median Mean Median ROA 0.039 0.038 0.021 0.025 0.018*** 0.013*** ROE 0.065 0.065 0.040 0.054 0.025*** 0.011*** SDROA5 0.039 0.027 0.031 0.024 0.008*** 0.003*** SDROE5 0.104 0.059 0.081 0.055 0.023*** 0.004** RAROA 1.911 1.319 1.471 1.012 0.440*** 0.306*** RAROE 1.692 1.223 1.264 0.945 0.428*** 0.278*** SIZE 16.50 16.33 17.86 17.73 -1.36*** -1.40*** CAPASSET 0.563 0.517 0.470 0.430 0.093*** 0.088*** GEODIV 0.187 0.000 0.359 0.239 -0.172*** -0.239*** WCONC 0.054 0.047 0.050 0.050 0.004*** -0.003*** PCTLH 0.046 0.000 0.565 0.000 -0.520*** 0.000*** MUTUAL 0.368 0.000 0.503 1.000 -0.135*** -1.000*** GROUP 0.123 0.000 0.391 0.000 -0.268*** 0.000*** PUBLIC 0.033 0.000 0.095 0.000 -0.062*** 0.000***
Note: Single-line insurers are those firms where MULTLINE=0, Diversified insurers are those where MULTLINE=1, ROA (Return on assets) is net income/total admitted assets, ROE (Return on Equity) is calculated as net income/policyholder surplus, SDROA5 is the standard deviation of ROA over past 5 years, SDROE5 is the standard deviation of ROE over past 5 years, RAROA is calculated as ROA/SDROA5 and reflects risk-adjusted return of assets, RAROE is calculated as ROE/SDROE5 and reflects risk-adjusted return on equity, SIZE is the natural logarithm of total admitted assets, CAPASSET is the ratio of policyholder surplus to total admitted assets, GEODIV is the complement of the Herfindahl index of premiums written across 57 geographic areas, WCONC reflects the competitiveness of a firm's markets and is calculated as the weighted sum of firm market share per line multiplied by each line's Herfindahl across all firms, PCTLH is the percentage of premiums attributable to life-health insurance, MUTUAL=1 if mutual, 0 if stock, GROUP=1 if firm is an aggregated group, 0 otherwise, PUBLIC=1 if publicly traded, 0 otherwise. P-values for difference of means are based on a t-test. P-values for difference of medians are based on a Wilcoxon rank sum test. Statistical significance at the 1, 5, and 10 percent levels is denoted by ***, **, and * respectively.
33
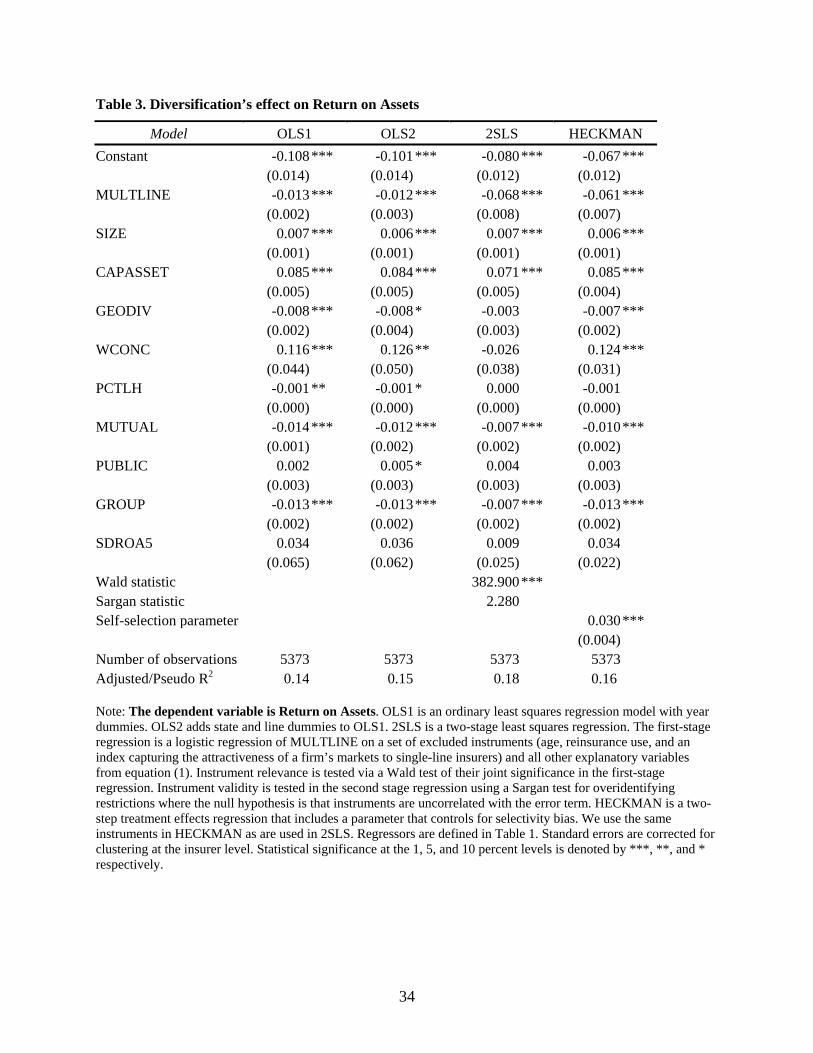
Table 3. Diversification’s effect on Return on Assets
Model OLS1 OLS2 2SLS HECKMAN Constant -0.108 *** -0.101*** -0.080*** -0.067 *** (0.014) (0.014) (0.012) (0.012) MULTLINE -0.013 *** -0.012*** -0.068*** -0.061 *** (0.002) (0.003) (0.008) (0.007) SIZE 0.007 *** 0.006*** 0.007*** 0.006 *** (0.001) (0.001) (0.001) (0.001) CAPASSET 0.085 *** 0.084*** 0.071*** 0.085 *** (0.005) (0.005) (0.005) (0.004) GEODIV -0.008 *** -0.008* -0.003 -0.007 *** (0.002) (0.004) (0.003) (0.002) WCONC 0.116 *** 0.126** -0.026 0.124 *** (0.044) (0.050) (0.038) (0.031) PCTLH -0.001 ** -0.001* 0.000 -0.001 (0.000) (0.000) (0.000) (0.000) MUTUAL -0.014 *** -0.012*** -0.007*** -0.010 *** (0.001) (0.002) (0.002) (0.002) PUBLIC 0.002 0.005* 0.004 0.003 (0.003) (0.003) (0.003) (0.003) GROUP -0.013 *** -0.013*** -0.007*** -0.013 *** (0.002) (0.002) (0.002) (0.002) SDROA5 0.034 0.036 0.009 0.034 (0.065) (0.062) (0.025) (0.022) Wald statistic 382.900 *** Sargan statistic 2.280 Self-selection parameter 0.030 *** (0.004) Number of observations 5373 5373 5373 5373 Adjusted/Pseudo R2 0.14 0.15 0.18 0.16 Note: The dependent variable is Return on Assets. OLS1 is an ordinary least squares regression model with year dummies. OLS2 adds state and line dummies to OLS1. 2SLS is a two-stage least squares regression. The first-stage regression is a logistic regression of MULTLINE on a set of excluded instruments (age, reinsurance use, and an index capturing the attractiveness of a firm’s markets to single-line insurers) and all other explanatory variables from equation (1). Instrument relevance is tested via a Wald test of their joint significance in the first-stage regression. Instrument validity is tested in the second stage regression using a Sargan test for overidentifying restrictions where the null hypothesis is that instruments are uncorrelated with the error term. HECKMAN is a two-step treatment effects regression that includes a parameter that controls for selectivity bias. We use the same instruments in HECKMAN as are used in 2SLS. Regressors are defined in Table 1. Standard errors are corrected for clustering at the insurer level. Statistical significance at the 1, 5, and 10 percent levels is denoted by ***, **, and * respectively.
34
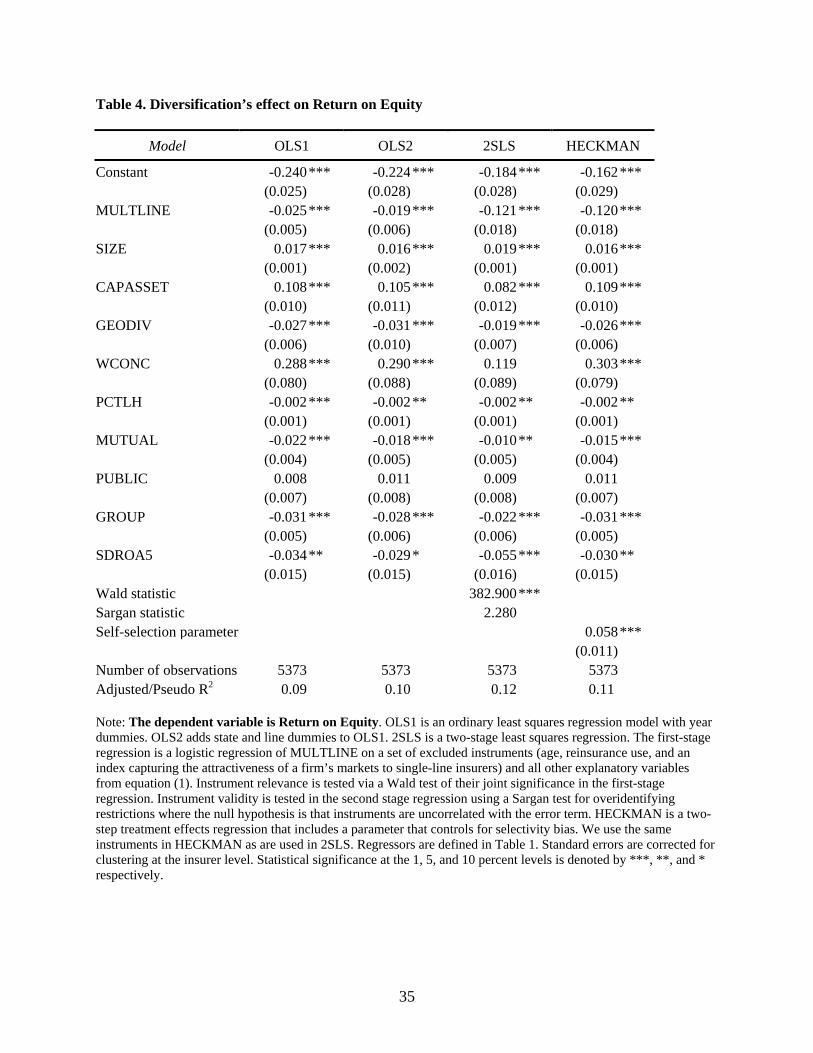
Table 4. Diversification’s effect on Return on Equity
Model OLS1 OLS2 2SLS HECKMAN
Constant -0.240 *** -0.224*** -0.184*** -0.162 *** (0.025) (0.028) (0.028) (0.029) MULTLINE -0.025 *** -0.019*** -0.121*** -0.120 *** (0.005) (0.006) (0.018) (0.018) SIZE 0.017 *** 0.016*** 0.019*** 0.016 *** (0.001) (0.002) (0.001) (0.001) CAPASSET 0.108 *** 0.105*** 0.082*** 0.109 *** (0.010) (0.011) (0.012) (0.010) GEODIV -0.027 *** -0.031*** -0.019*** -0.026 *** (0.006) (0.010) (0.007) (0.006) WCONC 0.288 *** 0.290*** 0.119 0.303 *** (0.080) (0.088) (0.089) (0.079) PCTLH -0.002 *** -0.002** -0.002** -0.002 ** (0.001) (0.001) (0.001) (0.001) MUTUAL -0.022 *** -0.018*** -0.010** -0.015 *** (0.004) (0.005) (0.005) (0.004) PUBLIC 0.008 0.011 0.009 0.011 (0.007) (0.008) (0.008) (0.007) GROUP -0.031 *** -0.028*** -0.022*** -0.031 *** (0.005) (0.006) (0.006) (0.005) SDROA5 -0.034 ** -0.029* -0.055*** -0.030 ** (0.015) (0.015) (0.016) (0.015) Wald statistic 382.900 *** Sargan statistic 2.280 Self-selection parameter 0.058 *** (0.011) Number of observations 5373 5373 5373 5373 Adjusted/Pseudo R2 0.09 0.10 0.12 0.11 Note: The dependent variable is Return on Equity. OLS1 is an ordinary least squares regression model with year dummies. OLS2 adds state and line dummies to OLS1. 2SLS is a two-stage least squares regression. The first-stage regression is a logistic regression of MULTLINE on a set of excluded instruments (age, reinsurance use, and an index capturing the attractiveness of a firm’s markets to single-line insurers) and all other explanatory variables from equation (1). Instrument relevance is tested via a Wald test of their joint significance in the first-stage regression. Instrument validity is tested in the second stage regression using a Sargan test for overidentifying restrictions where the null hypothesis is that instruments are uncorrelated with the error term. HECKMAN is a two-step treatment effects regression that includes a parameter that controls for selectivity bias. We use the same instruments in HECKMAN as are used in 2SLS. Regressors are defined in Table 1. Standard errors are corrected for clustering at the insurer level. Statistical significance at the 1, 5, and 10 percent levels is denoted by ***, **, and * respectively.
35

Table 5. Robustness of the diversification penalty to alternative risk measures Constant -0.100 *** -0.120*** -0.119*** -0.099 *** (0.011) (0.012) (0.012) (0.012) MULTLINE -0.012 *** -0.010*** -0.010*** -0.012 *** (0.002) (0.003) (0.003) (0.002) SIZE 0.006 *** 0.007*** 0.007*** 0.006 *** (0.001) (0.001) (0.001) (0.001) CAPASSET 0.084 *** 0.081*** 0.081*** 0.081 *** (0.004) (0.004) (0.004) (0.004) GEODIV -0.008 ** -0.008** -0.008* -0.008 * (0.004) (0.004) (0.004) (0.004) WCONC 0.126 *** 0.132*** 0.132*** 0.096 ** (0.035) (0.036) (0.036) (0.037) PCTLH -0.001 * -0.001* -0.001* -0.001 (0.000) (0.000) (0.000) (0.000) MUTUAL -0.012 *** -0.009*** -0.009*** -0.013 *** (0.002) (0.002) (0.002) (0.002) PUBLIC 0.005 * 0.007** 0.007** 0.005 (0.003) (0.003) (0.003) (0.003) GROUP -0.013 *** -0.012*** -0.012*** -0.011 *** (0.002) (0.002) (0.002) (0.002) KLEIN5 0.038 (0.027) KLEIN10 0.062** (0.025) SDROA10 0.051** (0.023) FIRMRISK 0.008 (0.008) Number of observations 5373 4450 4450 4646 Adjusted R-squared 0.15 0.15 0.16 0.14 Note: The dependent variable is Return on Assets. All regression models are OLS with year, state, and line dummies. KLEIN5 and KLEIN10 are risk measures based on the method used by Klein, Phillips, and Shiu (2002) to calculate earnings volatility. The measures are equal to the standard deviation of the error term from an OLS regression of ROA over the past 5 or 10 years on a linear time trend. SDROA10 is the standard deviation of ROA over past 10 years. FIRMRISK is a measure of total firm risk based on the option pricing model of the firm (see Sommer (1996) and Cummins and Sommer (1996) for details). All other regressors are defined in Table 1. Standard errors are corrected for clustering at the insurer level. Statistical significance at the 1, 5, and 10 percent levels is denoted by ***, **, and * respectively.
36

Table 6. Robustness of the diversification penalty to the excess value methodology
Model OLS 2SLS
Constant -0.156 *** -0.139*** (0.010) (0.014) MULTCLUS -0.004 ** -0.040*** (0.002) (0.006) SIZE 0.006 *** 0.007*** (0.001) (0.001) CAPASSET 0.082 *** 0.073*** (0.004) (0.005) GEODIV -0.014 *** -0.010*** (0.002) (0.003) WCONC 0.087 *** 0.079* (0.032) (0.046) PCTLH 0.000 0.000 (0.000) (0.000) MUTUAL -0.010 *** -0.004** (0.002) (0.002) PUBLIC 0.001 0.002 (0.003) (0.003) GROUP -0.009 *** -0.004* (0.002) (0.002) SDROA5 0.028 0.016 (0.023) (0.058) Wald statistic 390.180 *** Sargan statistic 0.668 Number of observations 5373 5373 Adjusted R-squared 0.11 0.12 Note: The dependent variable is Excess Return on Assets which is calculated as Actual ROA minus Activity-Adjusted ROA, where
5Activity-Adjusted , and
5such that 1
1.
ictcα =∑
=1
DPWictROA ROA ictit ict ct DPWc it
α α= =∑=
is the total direct premium written by insurer in year , is the total direct premium written by insurer in cluster in year , is the average ROA for all single-cluster firms thDPW i t DPW
it icti c t ROA
ctat operate in cluster in year c t
OLS is an ordinary least squares regression model with year dummies. 2SLS is a two-stage least squares regression. The first-stage regression is a logistic regression of MULTLINE on a set of excluded instruments (age, reinsurance use, and an index capturing the attractiveness of a firm’s markets to single-line insurers) and all other explanatory variables from equation (1). Instrument relevance is tested via a Wald test of their joint significance in the first-stage regression. Instrument validity is tested in the second-stage regression using a Sargan test for overidentifying restrictions where the null hypothesis is that instruments are uncorrelated with the error term. MULTCLUS is a binary variable equal to one if the insurer operates in more than one business line cluster, zero otherwise. All other regressors are defined in Table 1. Standard errors are corrected for clustering at the insurer level. Statistical significance at the 1, 5, and 10 percent levels is denoted by ***, **, and * respectively.
37

Table 7. Investigation of the persistence of the diversification penalty Intercept -0.120*** (0.012) Operates in 2 or more lines -0.011*** (0.003) Operates in 3 or more lines 0.003 (0.003) Operates in 4 or more lines 0.000 (0.004) Operates in 5 or more lines 0.003 (0.004) Operates in 6 or more lines 0.002 (0.004) Operates in 7 or more lines 0.004 (0.004) Operates in 8 or more lines 0.004 (0.005) Operates in 9 or more lines -0.001 (0.004) Operates in 10 or more lines -0.002 (0.004) SIZE 0.006*** (0.001) CAPASSET 0.085*** (0.004) GEODIV -0.009** (0.004) WCONC 0.119*** (0.035) PCTLH -0.001 (0.000) MUTUAL -0.011*** (0.002) PUBLIC 0.006* (0.003) GROUP -0.013*** (0.002) SDROA5 0.039* (0.023) Number of observations 5373 Adjusted R-square 0.15
Note: The dependent variable is Return on Assets. The regression model is OLS with year dummies. “Operates in n or more lines” is a dummy variable=1 if the insurer has direct premiums written in n or more lines, 0 otherwise. Standard errors are corrected for clustering at the insurer level. Statistical significance at the 1, 5, and 10 percent levels is denoted by ***, **, and * respectively.
38