effects of climate change on agriculture particularly in semi 2008
TRANSCRIPT
1
“Effects of Climate Change on Agriculture Particularly in Semi-
Arid Tropics of the World with Some Examples of selected areas of
Ethiopia”
Almaz Demessie
Meteorological Research and Studies Team Leader, National Meteorological Agency, Addis Ababa Ethiopia,
2008
Abstract
Today climate change is a burning issue all over the world because of its global nature. Fears have
arisen that; climate may be changing for the worse and its impact on agricultural production,
which will reduce the supply of food to growing population, especially in developing countries.
Climate change would affect various human activities. Agriculture is one of the activities, which
can e seriously affected by climate change. Due to high inter-annual variability and uneven
distribution of rainfall during the rainy season, recurrent droughts have observed in semi-arid
tropics of the world over the last three decades. As White, (cited in Climate Variability and
Agriculture by Y.P Abrol, S. Gadgil and G. B.Pant 1996) pointed out rain fed agriculture in the
semi-arid tropics is limited mostly by high climatic variability with principal limiting factor being
rainfall. The main crops of traditional rain fed agriculture are sorghum, millet, maize, cowpea,
pulses, and sesame. Adverse climatic conditions are the bottleneck of Ethiopia’s rain fed
agriculture development. Besides, agricultural production suffers from periodic outbreak of pests
2
and diseases, both pre- and post harvests, in most parts of Ethiopia. Some pests are becoming a
serious problem in some areas where the rainfall condition is erratic. For instance, Sorghum
Chafer becomes a chronic problem since 1993 over northeastern highlands of Ethiopia including
Afar regions.
The objective of the research study is to identify and characterize the effect of climate change on
agriculture by assessing the climatic condition of the selected areas and its effect on agriculture.
1. Introduction
Climate is the average weather parameters, usually 30 years of a given locality. The
measures of climate include mainly the estimates of average values of weather
parameters and measures of variability near to the average value. As Biswas, (cited
in Climate Variability and Agriculture by Y.P Abrol, S. Gadgil and G. B.Pant 1996)
has stated in most cases, some deviation of average values between two reference
periods is mainly due to large weather variability. There may be real shifts of the
average or changes in variability between two periods. These deviations from the
mean value constitute climate variation or change. Adverse climatic conditions are
the bottleneck of Ethiopia’s rain fed agriculture development. As a result,
particularly in drought prone regions of Ethiopia agriculture production is
determined by climate variability. The rainfall variability in the rainy seasons is the
most serious problem encountered by Ethiopian farmers. Therefore, it is very
important to clearly understand the characteristics of weather parameters together
with the triggering factors that exert significant impacts. The main crops of
traditional rain fed agriculture are sorghum, millet, maize, cowpea, pulses and
3
sesame. There is a suggestion that increased CO2 will benefit temperate and humid
tropical agriculture more than that in the semi-arid tropics. During the process of
photosynthesis plant species with the C3 photosynthetic pathway tend to respond
positively to increase CO2 while the C4 have a poor response. Since C4 plants are
mostly tropical crops, the situation will be worst over the areas (Parry, 1990).
Besides, agricultural production suffers from periodic outbreak of pests and diseases,
both pre- and post harvests, in most parts of Ethiopia. The factors involved here are
principally wind, precipitation and temperature. Some pests are becoming a serious
problem in some areas of Ethiopia where the rainfall condition is erratic. For
instance, Sorghum Chafer becomes a chronic problem since 1993 over northeastern
highlands of Ethiopia including Afar regions. Climate change will alter the nature of
occurrence of agricultural pests in terms of area. Warmer temperatures shorten the
generation time; increase the development rate of epidemic.
Many research studies have stated that meteorological parameters like rainfall,
temperature and wind play an important role in changing agricultural production
more than other parameters. Any deviation from the mean climatic condition would
affect agricultural activities negatively. Agriculture can show little sensitivity to
moderate variations around those means. If the condition persisted a bit longer it
could affect the overall physiological activities of the plants and result in crop
damage and final yield reduction. The examples presented in this paper are selected
randomly from pastoral and crop producing areas just to indicate the situation of
climate change in some areas of Ethiopia.
4
Length of Growing Period (LGP) is describing the period during which crop growth
is not affected by climatic constraints, i.e. the period of the year when water
availability allows crop growth and when the temperature is not limiting crop
growth. As many studies have indicated, the duration of the period in which rainfall
exceeds selected levels of evapotranspiration is the most useful index of agricultural
potential. This period refers to the length of time during which water and
temperature permit crop growth. As FAO (1991) stated, three specific values are
identified for climatic classification, namely: arid, with LGP of less than 75 days;
Seasonally dry, with LGP of between 75 and 270 days; and humid with LGP of more
than 270 days. Annual or seasonal rainfall is traditionally used to describe the supply
of water to crops, because it is the primary measurement particularly for rain fed
agriculture. Nevertheless they should be supplemented by the information in which
the availability of water, now more easily obtainable by the concept of reference
evapotranspiration (ETo). Where sufficient water is available, crops need specific
periods to accumulate the energy necessary to complete their growth and
development. In this study, in addition to the above methodology, Nieuwolt’s (1981)
approach of an agricultural rainfall index (ARI) will apply. In this approach instead
of mean monthly rainfall 80% probability of exceedance (dependable rainfall) is
important to determine LGP in which periods with ARI value greater than 100
considered as growing season. Many researchers agree that 80% probability of
rainfall is dependable for the continuation of vegetative growth if the rainfall amount
at that level of probability is sufficient for plant growth. Consideration of 80%
5
probability level is important to identify a specific area in terms of moisture
availability, because it covers a longer period (i.e. 8 out of 10 years). In this study,
both approaches will test. From the analysis, I try to figure out the shift in mean
values, LGP and ARI for the selected stations, which is the major indicator of
climate change.
2. Materials and Methods
The purpose of this study is to analyse the effect of climate change on agriculture by
using different meteorological parameters and different types of crop models and
statistical analysis in order to investigate the influence of climate change on crop
performance in terms of crop production and protection aspect of Ethiopia.
a. Meteorological Data
More than 30 years data used for the analysis of climate change. All elements are
used which are important for the calculation of ETo such as maximum temperature,
minimum temperature, Relative Humidity, Sunshine hours and wind speed mm/sec.
b. Crop yield data
Yield data taken from different Ethiopian Central Statistics Authority year Books.
Cumulative yield amount of major cereal crops like maize, sorghum, tef, barley,
wheat and millet was taken to assess the change in crop yield. Thirty years data was
available; however, there is a gap in some years.
6
c. Statistical Methods
Excel used for simple statistical analysis like for the calculation of mean and mean
deviation including trend analysis. The percent probability analysis was done for the
cropping season. The statistical analysis used to indicate variability is percent
deviation from the mean:
((Actual-Mean)/Mean)*100) (c.1)
In addition, to indicate percent probability of rainfall the methodology that was
developed by Dorenbos and Pruitt (1977: cited in Technical Note 179) was used. It is
the ranking order method; each record is assigned a ranking number (m). The
ranking numbers are then given probability levels Fa (m), which is calculated as
follows:
Fa (m) =100m/ (n+1) (c.2)
d. FAO CROPWAT (Version 4.3) Model
The FAO Penman Monteith as modified by FAO (1994), which is described in
http://www.FAO.ORG/AG/AGLW/WCROP.HTM for the calculation of reference
evapotranspiration (ETo). The definition of reference evapotranspiration is “the
rate of water loss from a short green crop fully covering the ground and fully
supplied with water”. As FAO in many studies has pointed out Penman Monteith
7
method overcomes shortcomings of the previous FAO Penman method and provides
values more consistent with actual crop water use.
The data used for the calculation of ETo is on a monthly basis i.e. monthly maximum
and minimum temperature (ºC), mean relative humidity (RH%), wind speed (m/s),
sunshine hours. Other data like elevation, latitude, longitude and Julian day i.e. day
of the year from January.
The other statistical method to calculate ten daily ETo values (Figure 10) is Instat
Version 3.22
e. FAO Methodology to calculate Length of Growing Period (LGP)
LGP is expressing the period during which crop growth is not affected by climatic
constraints or it characterizes the period of the year when water availability allows
crop growth and when the temperature is not limiting crop growth. The method to
calculate LGP is FAO methodology by Frere and Popov (1979). “The growing
period (GP) is defined as the time (days) during a year when precipitation exceeds
half the potential evapotranspiration (PET) plus the time (days) necessary to
evapotranspire 100mm of water (or less if 100 mm is not available) from excess
precipitation stored in the soil profile. The period during which the daily mean
temperature value is less than 6.5°C is subtracted from the length of the period
during which water is available”. However, in this study, daily values of temperature
were not available. As a result, ten-day mean temperature is considered in place of
8
daily mean. Besides, Nieuwolt (1981, cited in Technical Note 179) methodology that
was introduced as an Agricultural Rainfall Index:
ARI = 100* P/ETo (e.1)
Where P is 80% probability of exceedance of rainfall. In this case, 80% probability
of exceedance for the rainfall season will be applied instead of mean annual rainfall.
According to his concept-growing period is considered when ARI is over 100.
4. The Effect of Climate Change on Agriculture
Climate affects agriculture in many ways. Effects due to increased atmospheric CO2
concentration, CO2 induced changes of climate and rises in sea level are the major
ones. Many research studies have stated that meteorological parameters like rainfall,
temperature and wind play an important role in changing agricultural production
more than other parameters. Rising emission of carbon-dioxide, methane, nitrous
oxide and other radioactive gases (Greenhouse Gases) will lead not only to an
increase of surface temperature of the earth but also a change of precipitation (Parry
et al, 1990). Thus, this condition could have a significant negative impact on
agriculture.
Any deviation from the mean climatic condition would affect agricultural activities
negatively. Agriculture can show little sensitivity to moderate variations around
those means. If the condition persisted a bit longer it could affect the overall
9
physiological activities of the plants and result in crop damage and final yield
reduction. As a result agriculture becomes particularly sensitive to climate change.
For example, weak monsoon rain in 1987 caused significant decreases in crop
production in India, Bangladesh, and Pakistan (World Food Institute, 1988).
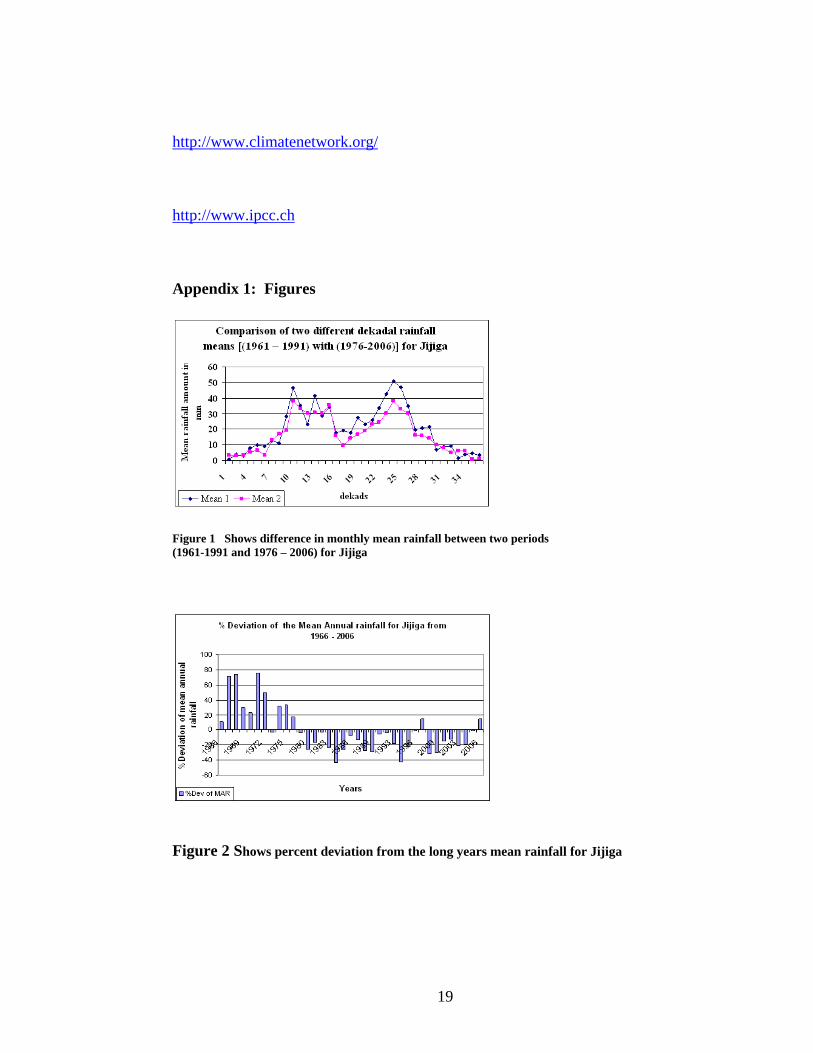
As Fig. 1 indicates, there is a shift in mean values and decease in mean amount of
rainfall during the second period mainly. Thus, this condition can clearly shows the
effect of climate change in the area.
As can be seen from figures 1 and 2 there is a decreasing trending in mean decadal
rainfall amount during 1976 - 2006 in most cases. Besides, the percent deviation of
mean annual rainfall shows negative deviation in most cases as of 1979.
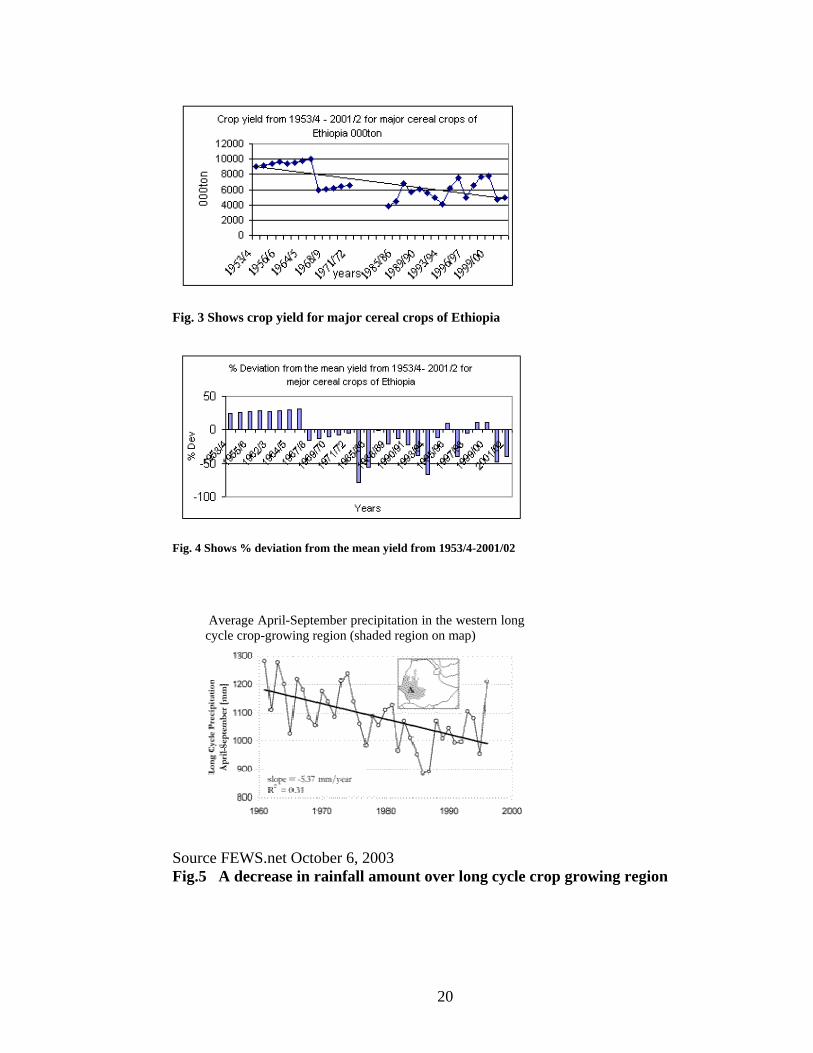
As the FEWS NET report (October 6, 2003) indicates(Figure 5), the precipitation in
the long cycle region (areas mainly grown long cycle crops like maize and sorghum)
shows a negative trend by 5.4 mm per year. Thus, this situation can have negative
impact on agriculture, thereby decreasing yield production year to year significantly,
since the Ethiopian agriculture mainly depend on rainfall amount and distribution.
If we see the overall rainfall condition over the country, it shows a decreasing trend
(Fig 5), thereby the crop yield showing decreasing trend year to year (Fig. 3).
10
5. Crop Water Requirement of Plants
Climate variability can have significant affect on the availability of water to semi-
arid ecosystems. As Parry (1990) pointed out a doubling of ambient CO2
concentration causes about 40% decrease in stomata openings in both C3 and C4
plants, which may reduce transpiration by 23-46%. This condition would favour
areas where water is a limiting factor, such as in semi-arid regions. Nevertheless,
there are many uncertainties, like how much the greater leaf area of plants as a result
of increased CO2 will balance the reduced transpiration of each plant will increase
in case of irrigated crops. Besides, increased CO2 can induce abnormal and erratic
rainfall distribution, which would affect the normal process of water requirements of
crops, and this situation leads to poor crop performance.
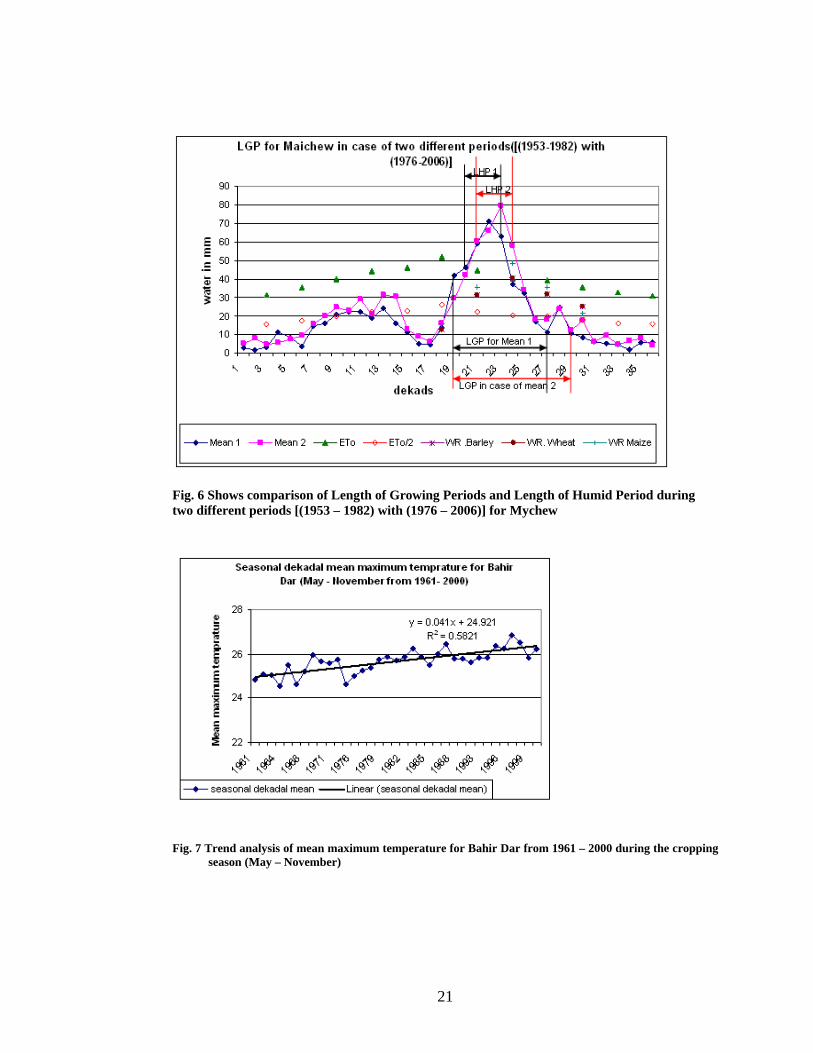
When we see figure 6 there is a shift in Length of Humid Period (LHP). With regard
to LGP we can see a better length of LGP in case of Mean 2 (the extension is about a
month). Thus, better crop performance could be possible in LGP 2.
Some researches pointed out that a doubling of atmospheric CO2 concentrations
from 330 to 660 ppmv cause 10 to 50% increase in growth and yield of C3 crops
(such as wheat, soybean and rice) and a 0 to 10% increase for C4 crops (ibid).
11
6. Crop Growth Rates
Temperature is the dominant climatic factor in the development of plants and animal
growth. Any variation beyond the optimum level has a negative impact on the
normal growth and development of plant. As Parry (1990) pointed out recent studies
indicated that an increase in temperature resulted in lower yields in cereals and the
reverse was true for root crops and grassland. However, due to higher rate of
evaporation and reduced moisture availability, which could be created by the global
warming, the overall yield will be less.
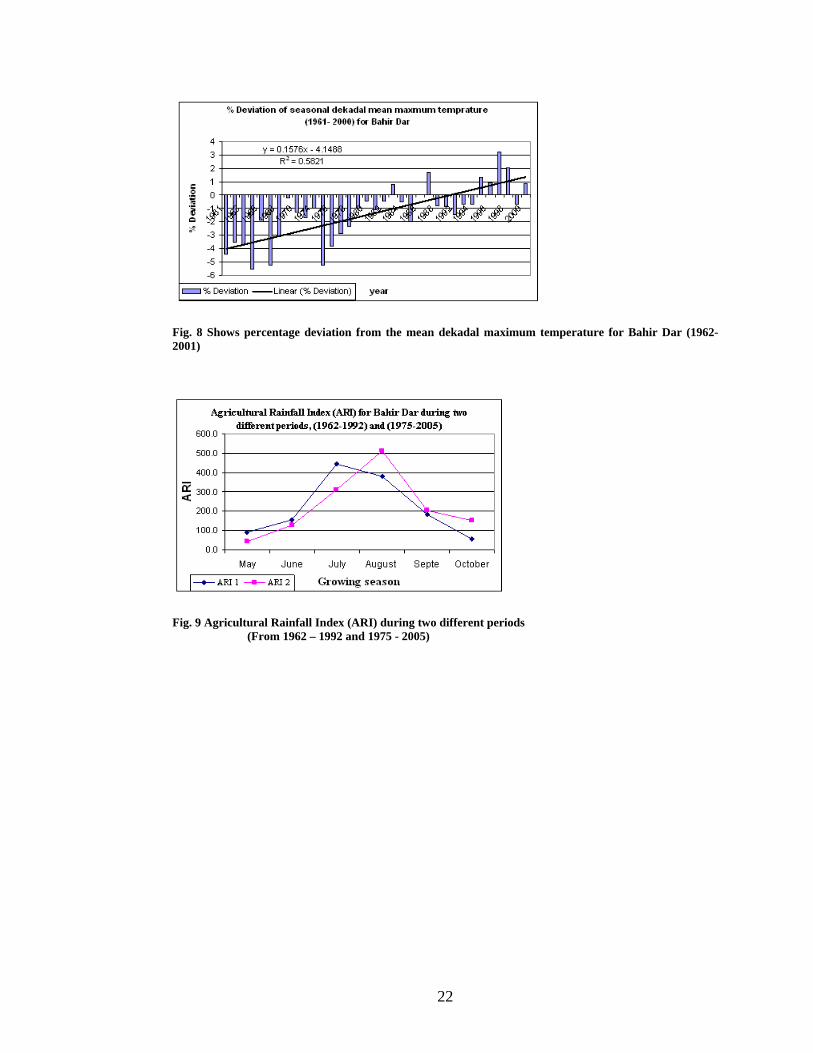
As can be seen from figure 7 there is a rise in mean maximum temperature
continuously and from figure 8 the percent deviation moves towards positive value
year by year that means the maximum temperature shows increasing trend year by
year thereby shows changing temperature. This is obvious that the increased
temperature amount has a great contribution for the rise of reference
evapotranspiration (ETo). Thus, a rise of ETo together with a decrease in rainfall
amount over the area would have negative impact on LGP; thereby decreasing crop
yield is inevitable since the agricultural activities mainly dependent on rainfall in
Ethiopia.
7. Growing Seasons
As Parry (1990) has stated, the effect of warming on length of growing season and
growing period will vary from region to region and from crop to crop. In tropical
climates, in which there are less seasonal temperature changes, the amount of
12
available moisture often determines the periods of plant growth; in the rainy season,
growth is luxuriant and in the dry season, many plants become dormant. As a result
in this case the variation in temperature amount is more serious in mid and high
latitude regions. For instance, it is estimated that the growing season of wheat will
extend by ten days per °C in Europe and in central Japan by about 8 days pre °C. In
general the conclusion is that increased mean annual temperatures, if limited to two
or three degrees, could generally be expected to extend growing seasons in mid-
latitude and high-latitude regions. Increases of more than this could increase
evaporation rate, which leads to reduced soil moisture and limit the growing season.
For the analysis of Agricultural Rainfall Index (ARI), 80% probability of exceedance
taken for the rainfall season instead of mean monthly rainfall and mean monthly
Reference evapotranspiration (ETo) is the other component to analyze ARI.
According to this concept the growing period is considered when ARI is greater than
100. Thus, from this analysis we can see sift in Length of Growing Period (LGP) as
we compare ARI 1 to that of ARI 2. There is an extension of LGP in case of ARI 2.
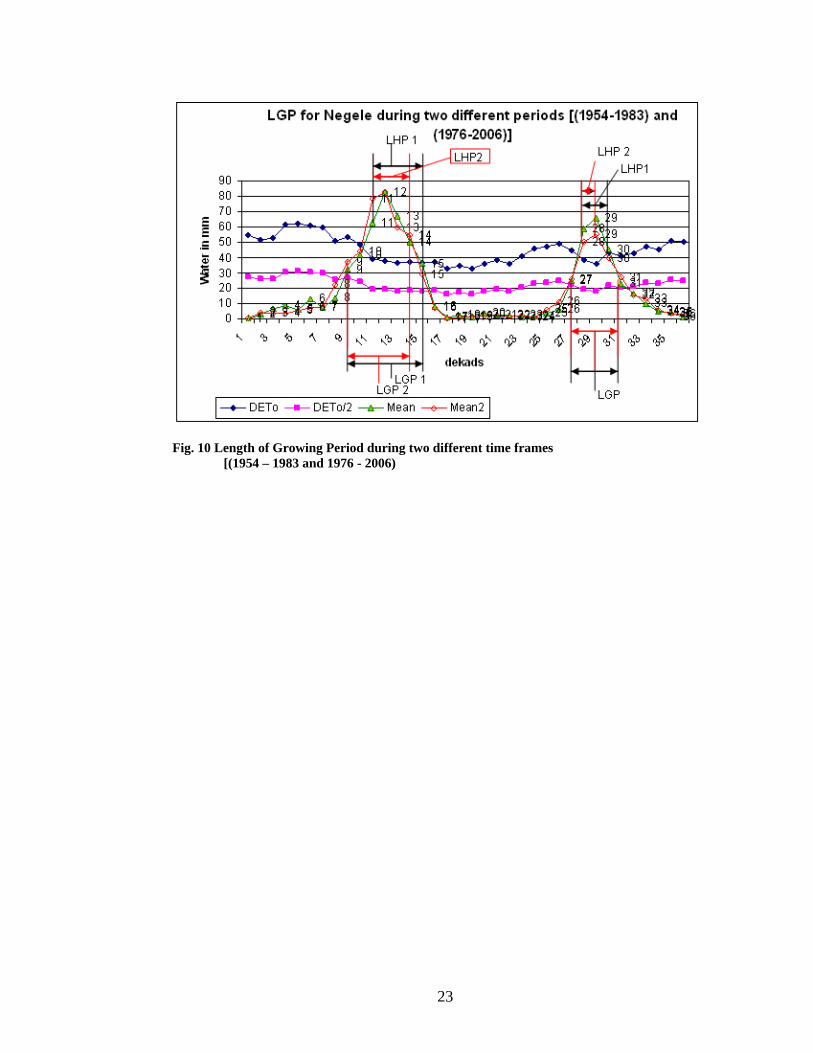
When we see the LGP analysis of Negele (figure 10), during the first rainy season
there is a decrease in Length of Humid Period (LHP) as well as LGP. In case of the
second rainy season there is a decrease in LHP and amount of rainfall during the
first, second and third dekad of October ranging from 6-11 mm as well whereas we
can see similar condition in case of LGP in both periods.
13
Various phenological models have predicted that generally the length of growing
period of the crop plants would be reduced as a result of higher temperature caused
by GHG (Alocilja and Ritchie, 1991; Roberts et al, 1993; Gangadhar Rao and Sinha,
1994 cited in Climate Variability and Agriculture by Y.P Abrol, S. Gadgil and G.
B.Pant 1996). Due to this condition, the total dry matter accumulation period also
will be reduced. Moreover, as Kroff et al (cited in Climate Variability and
Agriculture by Y.P Abrol, S. Gadgil and G. B.Pant 1996) have pointed out that, an
increase in temperature will reduce not only the total duration, but the dry matter
production also.
8. Pest and Disease
Global warming leads to a change in the nature, habit, and distribution of pests.
Studies suggest that temperature increases may extend the geographic range of some
insect pests currently limited by temperature.
The effect of climate warming plays an important role on the distribution of pests.
In Ethiopia, the most susceptible areas for insect out breaks are apparently the
highland regions below 2000 meters and parts of lowlands. However, plant pests
occur everywhere during the rainy season particularly at the time of drought when
erratic rainfall is a common phenomenon over drought prone areas of the country.
Pests at present limited to tropical countries may spread into the temperate regions
causing serious economic losses. For instance, Sorghum Chafer becomes a
chronic problem since 1993 over northeastern highlands of Ethiopia including
14
Afar regions. Climate change will alter the nature of occurrence of agricultural
pests in terms of area. Warmer temperatures shorten the generation time; increase
the development rate of epidemic. Most agricultural diseases have greater
potential to reach severe levels under warmer conditions. Higher precipitation and
warmer air temperature would increase the spread of fungal and bacterial
pathogens in given areas. Cereal crops are more susceptible to pest and diseases
under warmer and humid conditions.
9. Adaptation
Adaptation has the potential to reduce adverse impacts of climate change and to
enhance beneficial impacts. The capacity of human nature to adapt to and cope with
climate change depends on such factors as wealth, technology, education,
information skills, infrastructure, access to resources, and management capabilities.
Thus, the adaptation capacity of developing countries will be limited due to their low
level of technological advancement. Therefore, intergovernmental activities are
important in order to perform sound adaptation measures.
e. Possible Adaptation Measures
Applying improved knowledge to develop better techniques and to
resist the effect of climate change in a given locality.
15
Cultural practices that can precondition for the plant need to be
further explored and implemented to mitigate the effect of stress
factors.
Change in land use by using deferent techniques such as changing
farm area, change to crops with higher thermal requirements and
drought-tolerant crop, a switch to crops with lower moisture
requirements and changes in crop location.
Change in management in terms of the use of irrigation, fertilizer, in
the control of pests, in soil drainage, in farm infrastructure.
Create awareness among people about the causes of climate changes
so that farmers could change their wrong management practices such
as deforestation, over grazing, etc. which are the main causes for
desertification and climate change at large.
10. Conclusion
Climate change induced by increasing greenhouse gases is likely to affect crop yields
differently from region to region across the globe. Decreases in potential crop yields
are likely to be caused by shortening of the crop-growing period, decrease in water
availability due to higher rates of evaporation. As many studies suggested, the
tropical regions appear to be more vulnerable to climate change than the temperate
16
regions for several reasons. Temperate C3 cops are likely to be more responsive to
increasing levels of CO2 than C4 cops. Besides, insects and diseases, already much
more prevalent in warmer and more humid regions may become even more
widespread. Tropical regions may also be more vulnerable to climate change because
of economic and social constraints. Greater economic and individual dependence on
agriculture, widespread poverty, and inadequate technologies are likely to exacerbate
the impacts of climate change in tropical regions. Thus, plant breeders should give
more emphasis on development of heat and drought-resistance crops. Research is
needed to define the current limits to these resistances and the feasibility of
manipulation through modern genetic techniques. In some regions, it may be
appropriate to take a second look at traditional technologies and crops as ways of
coping with climate change. Better management techniques in crop and livestock
production should be developed in order to mitigate the effect of climate change. In
order to avoid mismanagement of natural resources like deforestation, overgrazing,
and cleaning farmland by using fire, etc creating awareness among farmers has great
importance.
As can be mentioned in the above statement, those with the least resources have least
capacity to adapt and are the most vulnerable. Thus, since the effect of Global
Worming affects both developing and developed countries intergovernmental
economic support is very important to tackle the problem and to achieve sound
solution for climate change. In many cases, reducing vulnerability to current climate
variability should also serve to mitigate the impact of global warming.
17
References
Richard G. Allen, Luis S. Pereira, Dirk Raes and Martin Smith (1998). Crop
evapotranspiration - Guidelines for computing crop water requirements.
FAO Irrigation and drainage paper 56. Rome: Food and Agriculture
Organization of the United Nations
America Society of Agronomy 1995. Climate Change and Agriculture: Analysis of
Potential International Impact, USA, American Society of Agronomy.
Carter, T. R., Konijn, N. T. & Parry, M. L. (1988), The Impact of Climate Variations
on Agriculture. The Netherlands: Kluwer Academic Publishers.
Doorenbos, J. & Kassam, A. H. (1979). Yield Response to water. FAO Irrigation and
Drainage paper No 33. Rome: Food and Agriculture Organization of the
United Nations.
FAO (1990) ftp://ftp.fao.org/agl/aglw/climwat/africa.zip
FAO (1994), http://www.FAO.ORG/AG/AGLW/WCROP.HTM
18
Frere, M. & Popov, G. F. (1986). Early Agro meteorological Crop Yield Assessment
FAO Plant Production Paper No 73. Rome: Food and Agriculture
Organization of the United Nations.
Griffiths, J. F., (1994). Handbook of Agricultural Meteorology. New York: Oxford
University Press.
Indian Council of Agriculture and For Eastern Regional Research Office of the
United States Department of Agriculture 1991. Global Climate Changes
on Photosynthesis and Plant Productivity, India, Asia Publishing House
Ltd.
M. Parry 1990. Climate Change and World Agriculture, London, Long dun Press,
Bristol.
M. L. Parry et al 1988. The Impact of Climate Variation on Agriculture, Netherlands,
Kluwer Academic Publishers.
Y.P. Abrol, S. Gadgil and G.B. Pant 1996. Climate Variability and Agriculture,
India, N.K. Mehara for Narosa Publishing House, 6 Coounity Centers.
http://www.gcrio.org/CSP/webpage.html
19
http://www.climatenetwork.org/
http://www.ipcc.ch
Appendix 1: Figures
Figure 1 Shows difference in monthly mean rainfall between two periods (1961-1991 and 1976 – 2006) for Jijiga
Figure 2 Shows percent deviation from the long years mean rainfall for Jijiga
20
Fig. 3 Shows crop yield for major cereal crops of Ethiopia
Fig. 4 Shows % deviation from the mean yield from 1953/4-2001/02 Source FEWS.net October 6, 2003 Fig.5 A decrease in rainfall amount over long cycle crop growing region
Average April-September precipitation in the western long cycle crop-growing region (shaded region on map)
21
Fig. 6 Shows comparison of Length of Growing Periods and Length of Humid Period during two different periods [(1953 – 1982) with (1976 – 2006)] for Mychew
Fig. 7 Trend analysis of mean maximum temperature for Bahir Dar from 1961 – 2000 during the cropping
season (May – November)
22
Fig. 8 Shows percentage deviation from the mean dekadal maximum temperature for Bahir Dar (1962-2001)
Fig. 9 Agricultural Rainfall Index (ARI) during two different periods
(From 1962 – 1992 and 1975 - 2005)
23
Fig. 10 Length of Growing Period during two different time frames
[(1954 – 1983 and 1976 - 2006)