effects of brain evolution on human nutrition and · pdf fileeffects of brain evolution on...
TRANSCRIPT
ANRV318-NU27-17 ARI 9 April 2007 14:31
RE V I E W
S
IN
AD V A
NC
E
Effects of Brain Evolutionon Human Nutrition andMetabolismWilliam R. Leonard,1 J. Josh Snodgrass,2
and Marcia L. Robertson1
1Department of Anthropology, Northwestern University, Evanston, Illinois 60208,2Department of Anthropology, University of Oregon, Eugene, Oregon 97403;email: [email protected]
Annu. Rev. Nutr. 2007. 27:311–27
The Annual Review of Nutrition is online athttp://nutr.annualreviews.org
This article’s doi:10.1146/annurev.nutr.27.061406.093659
Copyright c© 2007 by Annual Reviews.All rights reserved
0199-9885/07/0821-0311$20.00
Key Words
encephalization, hominin, diet quality, body composition, Homoerectus
AbstractThe evolution of large human brain size has had important implica-tions for the nutritional biology of our species. Large brains are ener-getically expensive, and humans expend a larger proportion of theirenergy budget on brain metabolism than other primates. The highcosts of large human brains are supported, in part, by our energy- andnutrient-rich diets. Among primates, relative brain size is positivelycorrelated with dietary quality, and humans fall at the positive endof this relationship. Consistent with an adaptation to a high-qualitydiet, humans have relatively small gastrointestinal tracts. In addition,humans are relatively “undermuscled” and “over fat” compared withother primates, features that help to offset the high energy demandsof our brains. Paleontological evidence indicates that rapid brainevolution occurred with the emergence of Homo erectus 1.8 millionyears ago and was associated with important changes in diet, bodysize, and foraging behavior.
311
First published online as a Review in Advance on April 17, 2007
Ann
u. R
ev. N
utr.
200
7.27
. Dow
nloa
ded
from
arj
ourn
als.
annu
alre
view
s.or
gby
Uni
vers
ity o
f O
rego
n on
08/
07/0
7. F
or p
erso
nal u
se o
nly.
ANRV318-NU27-17 ARI 9 April 2007 14:31
Encephalization:brain size in relationto body size. Ingeneral, primates aremore encephalizedthan other mammals
RMR: restingmetabolic rate
GI: gastrointestinal
Contents
INTRODUCTION. . . . . . . . . . . . . . . . . 312COMPARATIVE PERSPECTIVES
ON BRAIN SIZE, BODY SIZE,DIET, AND METABOLICRATE . . . . . . . . . . . . . . . . . . . . . . . . . . . 312
EVOLUTIONARY CHANGES INBRAIN SIZE AND DIET . . . . . . . . 315Trends in the Hominin Brain Size,
Body Size, and Tooth Size . . . . . 315Dietary Changes Associated with
Brain Evolution in EarlyHomo . . . . . . . . . . . . . . . . . . . . . . . . . 317
BRAIN EVOLUTION ANDHUMAN BODYCOMPOSITION . . . . . . . . . . . . . . . . 319
CONCLUSIONS. . . . . . . . . . . . . . . . . . . 321
INTRODUCTION
Over the past 20 years, the evolution of hu-man nutritional requirements has receivedever greater attention among both anthropol-ogists and nutritional scientists (3, 21, 28, 29,35, 48, 49, 86). Increasingly, we have come tounderstand that many of the key features thatdistinguish humans from other primates (e.g.,our bipedal form of locomotion and largebrain sizes) have important implications forour distinctive nutritional needs (3, 47, 50).The most important of these is our high lev-els of encephalization (large brain:body mass).The energy demands (kcal/g/min) of brainand other neural tissues are extremely high—approximately 16 times that of skeletal muscle(37, 43). Consequently, the evolution of largebrain size in the human lineage came at a veryhigh metabolic cost.
Despite the fact that humans have muchlarger brains per body weight in comparisonwith other primates or terrestrial mammals,the resting energy demands for the humanbody are no more than for any other mammalof the same size (48, 49). The consequenceof this paradox is that humans allocate a
much larger share of their daily energy budgetto “feed their brains.” Brain metabolism ac-counts for ∼20% to 25% of resting metabolicrate (RMR) in an adult human body. This is farmore than the 8% to 10% observed in otherprimate species and still more than the 3% to5% allocated to the brain by other (nonpri-mate) mammals (49).
The disproportionately large allocation ofour energy budget to brain metabolism hasimportant implications for our dietary needs.This review draws on both analyses of livingprimate species and the human fossil recordto examine the avenues through which hu-mans have adapted to the metabolic demandsof greater encephalization. We begin by con-sidering the energy demands associated withlarge brain size in modern humans relativeto other primates and nonprimate mammals.Next we examine comparative dietary datafor modern human groups and other primatespecies to evaluate the influence that variationin relative brain size has on dietary patternsamong modern primates. We then turn to anexamination of the human fossil record to ex-amine when and under what conditions in ourevolutionary past key changes in brain sizeand diet likely took place. Finally, we explorehow the evolution of large human brains waslikely accommodated by differential changesin the relative sizes of other organs [e.g., mus-cle, fat, and gastrointestinal (GI) tract]. Thehigh metabolic costs of our large brains appearto play a strong hand in shaping distinctive as-pects of human growth and development.
COMPARATIVE PERSPECTIVESON BRAIN SIZE, BODY SIZE,DIET, AND METABOLIC RATE
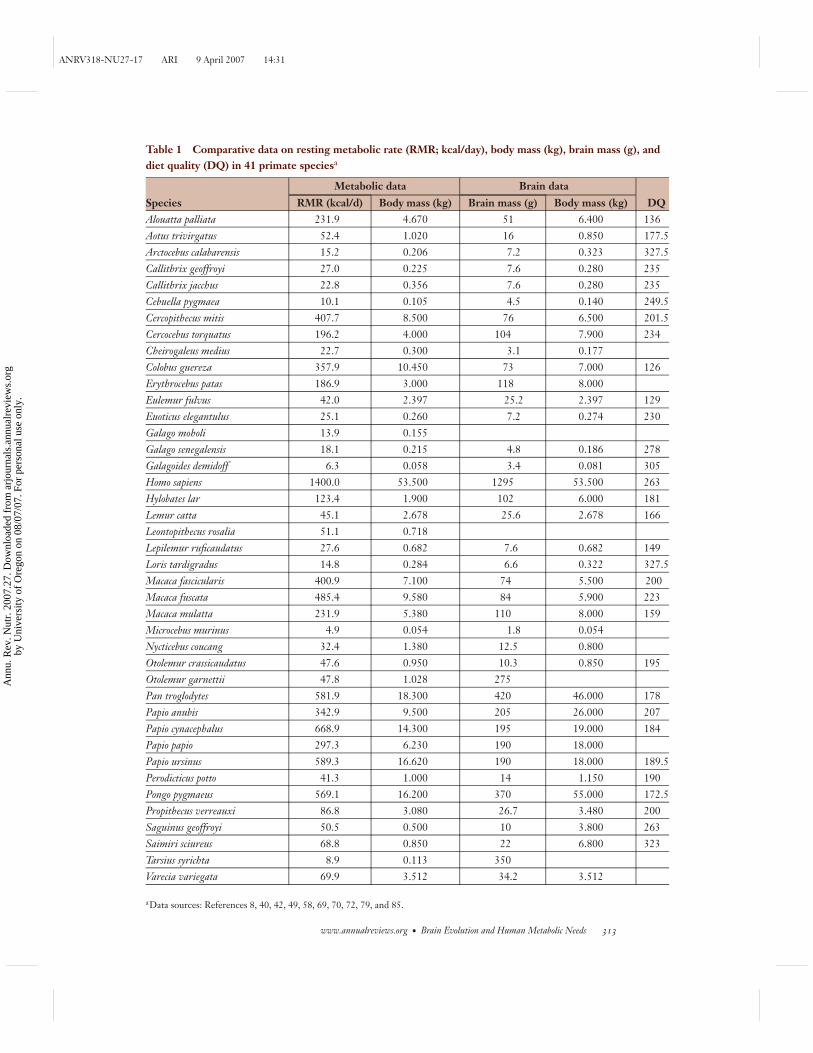
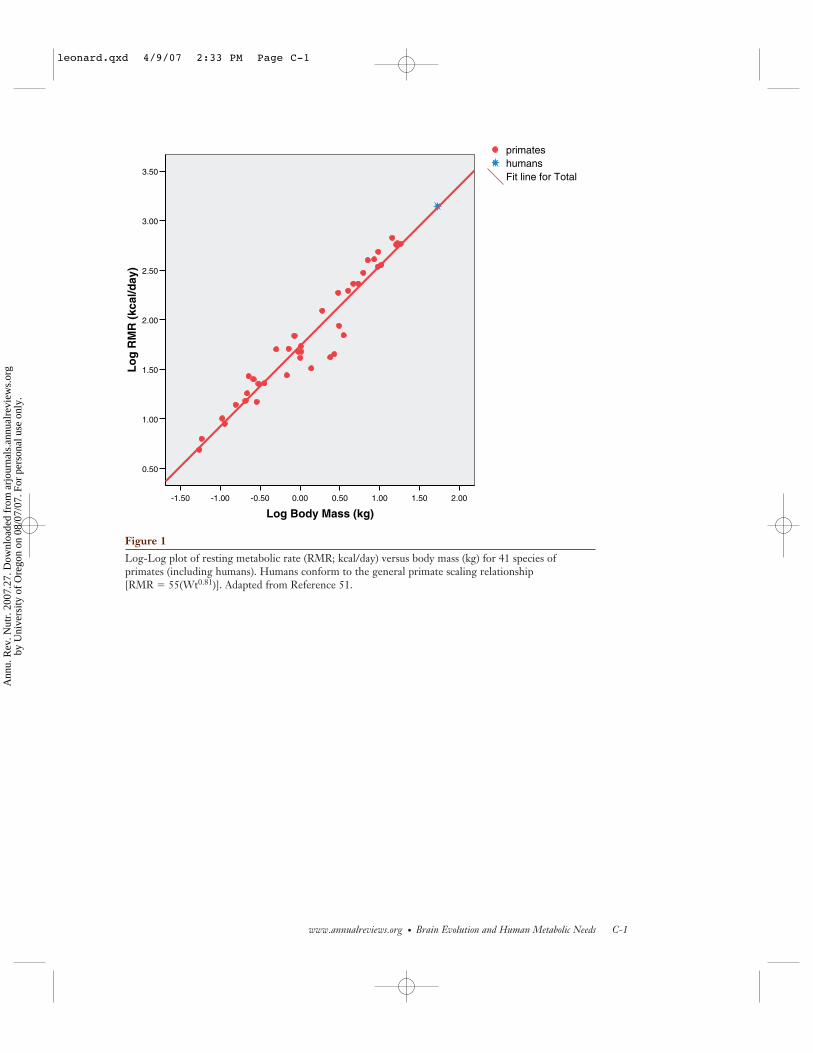
Table 1 presents comparative data on RMR,brain size, body size, and diet for livinghumans and nonhuman primates (from 51).Primates, as a group, are similar to othermammals in having RMRs that scale to ap-proximately three-fourths power of body mass(see 44). Figure 1 (see color insert) presentsthe relationship RMR (kcal/day) and body
312 Leonard · Snodgrass · Robertson
Ann
u. R
ev. N
utr.
200
7.27
. Dow
nloa
ded
from
arj
ourn
als.
annu
alre
view
s.or
gby
Uni
vers
ity o
f O
rego
n on
08/
07/0
7. F
or p
erso
nal u
se o
nly.
ANRV318-NU27-17 ARI 9 April 2007 14:31
Table 1 Comparative data on resting metabolic rate (RMR; kcal/day), body mass (kg), brain mass (g), anddiet quality (DQ) in 41 primate speciesa
Metabolic data Brain data
Species RMR (kcal/d) Body mass (kg) Brain mass (g) Body mass (kg) DQAlouatta palliata 231.9 4.670 51 6.400 136Aotus trivirgatus 52.4 1.020 16 0.850 177.5Arctocebus calabarensis 15.2 0.206 7.2 0.323 327.5Callithrix geoffroyi 27.0 0.225 7.6 0.280 235Callithrix jacchus 22.8 0.356 7.6 0.280 235Cebuella pygmaea 10.1 0.105 4.5 0.140 249.5Cercopithecus mitis 407.7 8.500 76 6.500 201.5Cercocebus torquatus 196.2 4.000 104 7.900 234Cheirogaleus medius 22.7 0.300 3.1 0.177Colobus guereza 357.9 10.450 73 7.000 126Erythrocebus patas 186.9 3.000 118 8.000Eulemur fulvus 42.0 2.397 25.2 2.397 129Euoticus elegantulus 25.1 0.260 7.2 0.274 230Galago moholi 13.9 0.155Galago senegalensis 18.1 0.215 4.8 0.186 278Galagoides demidoff 6.3 0.058 3.4 0.081 305Homo sapiens 1400.0 53.500 1295 53.500 263Hylobates lar 123.4 1.900 102 6.000 181Lemur catta 45.1 2.678 25.6 2.678 166Leontopithecus rosalia 51.1 0.718Lepilemur ruficaudatus 27.6 0.682 7.6 0.682 149Loris tardigradus 14.8 0.284 6.6 0.322 327.5Macaca fascicularis 400.9 7.100 74 5.500 200Macaca fuscata 485.4 9.580 84 5.900 223Macaca mulatta 231.9 5.380 110 8.000 159Microcebus murinus 4.9 0.054 1.8 0.054Nycticebus coucang 32.4 1.380 12.5 0.800Otolemur crassicaudatus 47.6 0.950 10.3 0.850 195Otolemur garnettii 47.8 1.028 275Pan troglodytes 581.9 18.300 420 46.000 178Papio anubis 342.9 9.500 205 26.000 207Papio cynacephalus 668.9 14.300 195 19.000 184Papio papio 297.3 6.230 190 18.000Papio ursinus 589.3 16.620 190 18.000 189.5Perodicticus potto 41.3 1.000 14 1.150 190Pongo pygmaeus 569.1 16.200 370 55.000 172.5Propithecus verreauxi 86.8 3.080 26.7 3.480 200Saguinus geoffroyi 50.5 0.500 10 3.800 263Saimiri sciureus 68.8 0.850 22 6.800 323Tarsius syrichta 8.9 0.113 350Varecia variegata 69.9 3.512 34.2 3.512
aData sources: References 8, 40, 42, 49, 58, 69, 70, 72, 79, and 85.
www.annualreviews.org • Brain Evolution and Human Metabolic Needs 313
Ann
u. R
ev. N
utr.
200
7.27
. Dow
nloa
ded
from
arj
ourn
als.
annu
alre
view
s.or
gby
Uni
vers
ity o
f O
rego
n on
08/
07/0
7. F
or p
erso
nal u
se o
nly.
ANRV318-NU27-17 ARI 9 April 2007 14:31
Scaling (allometry):the change in size onbiological measurewith respect toanother biologicalmeasure (often bodysize)
DQ: diet quality
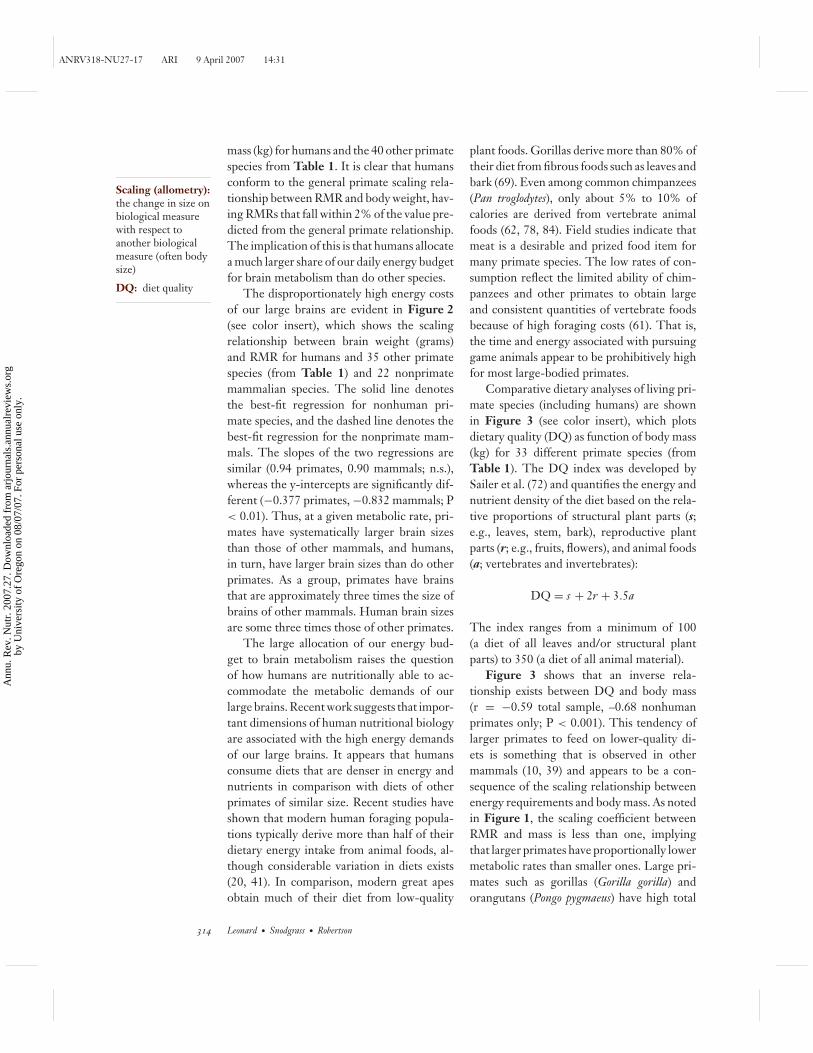
mass (kg) for humans and the 40 other primatespecies from Table 1. It is clear that humansconform to the general primate scaling rela-tionship between RMR and body weight, hav-ing RMRs that fall within 2% of the value pre-dicted from the general primate relationship.The implication of this is that humans allocatea much larger share of our daily energy budgetfor brain metabolism than do other species.
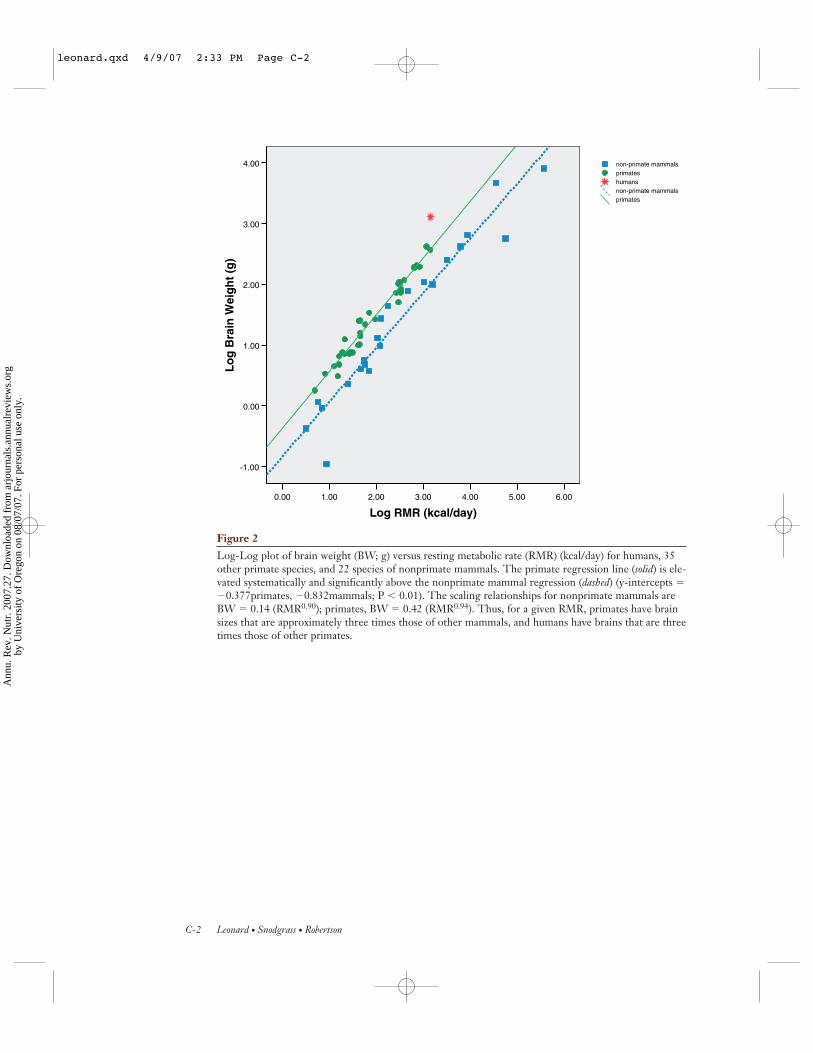
The disproportionately high energy costsof our large brains are evident in Figure 2(see color insert), which shows the scalingrelationship between brain weight (grams)and RMR for humans and 35 other primatespecies (from Table 1) and 22 nonprimatemammalian species. The solid line denotesthe best-fit regression for nonhuman pri-mate species, and the dashed line denotes thebest-fit regression for the nonprimate mam-mals. The slopes of the two regressions aresimilar (0.94 primates, 0.90 mammals; n.s.),whereas the y-intercepts are significantly dif-ferent (−0.377 primates, −0.832 mammals; P< 0.01). Thus, at a given metabolic rate, pri-mates have systematically larger brain sizesthan those of other mammals, and humans,in turn, have larger brain sizes than do otherprimates. As a group, primates have brainsthat are approximately three times the size ofbrains of other mammals. Human brain sizesare some three times those of other primates.
The large allocation of our energy bud-get to brain metabolism raises the questionof how humans are nutritionally able to ac-commodate the metabolic demands of ourlarge brains. Recent work suggests that impor-tant dimensions of human nutritional biologyare associated with the high energy demandsof our large brains. It appears that humansconsume diets that are denser in energy andnutrients in comparison with diets of otherprimates of similar size. Recent studies haveshown that modern human foraging popula-tions typically derive more than half of theirdietary energy intake from animal foods, al-though considerable variation in diets exists(20, 41). In comparison, modern great apesobtain much of their diet from low-quality
plant foods. Gorillas derive more than 80% oftheir diet from fibrous foods such as leaves andbark (69). Even among common chimpanzees(Pan troglodytes), only about 5% to 10% ofcalories are derived from vertebrate animalfoods (62, 78, 84). Field studies indicate thatmeat is a desirable and prized food item formany primate species. The low rates of con-sumption reflect the limited ability of chim-panzees and other primates to obtain largeand consistent quantities of vertebrate foodsbecause of high foraging costs (61). That is,the time and energy associated with pursuinggame animals appear to be prohibitively highfor most large-bodied primates.
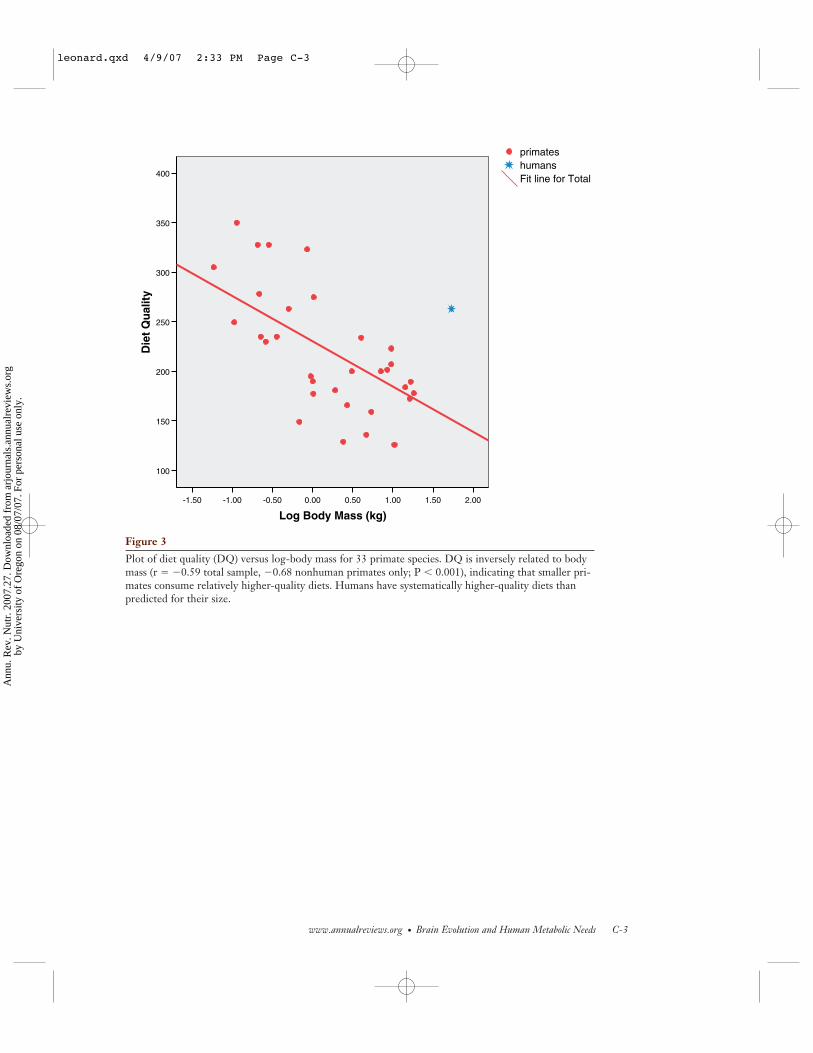
Comparative dietary analyses of living pri-mate species (including humans) are shownin Figure 3 (see color insert), which plotsdietary quality (DQ) as function of body mass(kg) for 33 different primate species (fromTable 1). The DQ index was developed bySailer et al. (72) and quantifies the energy andnutrient density of the diet based on the rela-tive proportions of structural plant parts (s;e.g., leaves, stem, bark), reproductive plantparts (r; e.g., fruits, flowers), and animal foods(a; vertebrates and invertebrates):
DQ = s + 2r + 3.5a
The index ranges from a minimum of 100(a diet of all leaves and/or structural plantparts) to 350 (a diet of all animal material).
Figure 3 shows that an inverse rela-tionship exists between DQ and body mass(r = −0.59 total sample, –0.68 nonhumanprimates only; P < 0.001). This tendency oflarger primates to feed on lower-quality di-ets is something that is observed in othermammals (10, 39) and appears to be a con-sequence of the scaling relationship betweenenergy requirements and body mass. As notedin Figure 1, the scaling coefficient betweenRMR and mass is less than one, implyingthat larger primates have proportionally lowermetabolic rates than smaller ones. Large pri-mates such as gorillas (Gorilla gorilla) andorangutans (Pongo pygmaeus) have high total
314 Leonard · Snodgrass · Robertson
Ann
u. R
ev. N
utr.
200
7.27
. Dow
nloa
ded
from
arj
ourn
als.
annu
alre
view
s.or
gby
Uni
vers
ity o
f O
rego
n on
08/
07/0
7. F
or p
erso
nal u
se o
nly.
ANRV318-NU27-17 ARI 9 April 2007 14:31
energy requirements but relatively low mass-specific needs (e.g., kcal/kg/day). They fulfilltheir energy needs by feeding on foods thatare abundant but low in quality (e.g., leavesand foliage). Conversely, small animals [e.g.,the pygmy marmoset (Cebuella pygmaea)] havelow total energy requirements but very highmass-specific needs. They typically subsist onfoods that are rich in calories and nutrientsbut relatively limited in abundance (e.g., saps,gums, and insects).
Humans, however, have substantiallyhigher-quality diets than would be expectedfor a primate of our size. Note that the av-erage diet for modern human foragers (basedon dietary data from five modern human for-aging populations; see 49) falls substantiallyabove the regression line. Overall, the staplefoods for all human societies are much morenutritionally dense than those of other large-bodied primates. This higher-quality diet forhumans relative to other large-bodied pri-mates means that we need to eat a smaller vol-ume of food to get the energy and nutrientswe require.
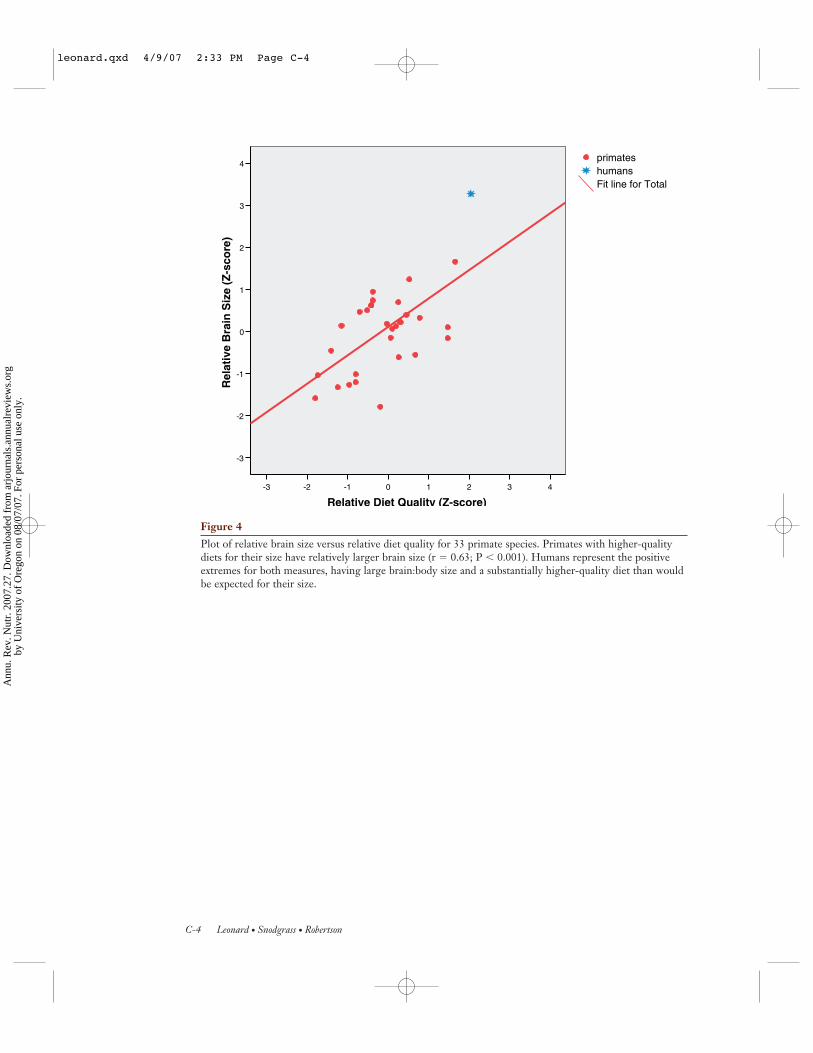
Figure 4 (see color insert) shows relativebrain size versus relative dietary quality for the33 different primate species from Figure 3.Relative brain size for each species is measuredas the standardized residual (z-score) from theprimate brain versus body mass regression,and relative DQ is measured as the residualfrom the DQ versus body mass regression.There is a strong positive relationship (r =0.63; P < 0.001) between the amount of en-ergy allocated to the brain and the caloric andnutrient density of the diet. Across all pri-mates, larger brains require higher-quality di-ets. Humans fall at the positive extremes forboth parameters, having the largest relativebrain size (z = +3.27) and the highest qualitydiet (z = +2.05). Thus, the large, metabol-ically expensive human brain is partially off-set by the consumption of an energy-denseand nutrient-rich diet. This relationship im-plies that the evolution of larger homininbrains would have necessitated the adoptionof a sufficiently high-quality diet (includ-
Hominin: livinghumans and ourfossil ancestors thatlived after the lastcommon ancestorbetween humans andapes
ing meat and energy-rich fruits) to supportthe increased metabolic demands of greaterencephalization.
The relative size and morphology of thehuman GI tract also reflect our high-qualitydiet. Most large-bodied primates have ex-panded large intestines (colons), an adaptationto fibrous, low-quality diets (59). Humans, onthe other hand, have small gut volumes for oursize, with relatively enlarged small intestinesand a smaller colon (3, 53, 75).
The enlarged colons of most large-bodiedprimates permits fermentation of low-qualityplant fibers, allowing for extraction of addi-tional energy in the form of volatile fatty acids(60, 63). In contrast, the GI morphology ofhumans (small colon and relatively enlargedsmall intestine) is more similar to a carnivoreand reflects an adaptation to an easily digested,nutrient-rich diet (52, 53, 81).
Together, these comparative data suggestthat the dramatic expansion of brain size overthe course of human evolution likely wouldhave required the consumption of a diet thatwas more concentrated in energy and nu-trients than is typically the case for mostlarge primates. This does not imply that di-etary change was the driving force behindmajor brain expansion during human evolu-tion. Rather, the available evidence indicatesthat a sufficiently high-quality diet was prob-ably a necessary condition for supporting themetabolic demands associated with evolvinglarger hominin brains.
EVOLUTIONARY CHANGESIN BRAIN SIZE AND DIET
Trends in the Hominin Brain Size,Body Size, and Tooth Size
Over the past four million years, averagebrain size in the hominin lineage has morethan tripled, increasing from approximately400 cm3 in the earliest australopithecines to1300–1400 cm3 in modern humans (57).However, the rates of evolutionary change inbrain size have been highly variable over this
www.annualreviews.org • Brain Evolution and Human Metabolic Needs 315
Ann
u. R
ev. N
utr.
200
7.27
. Dow
nloa
ded
from
arj
ourn
als.
annu
alre
view
s.or
gby
Uni
vers
ity o
f O
rego
n on
08/
07/0
7. F
or p
erso
nal u
se o
nly.
ANRV318-NU27-17 ARI 9 April 2007 14:31
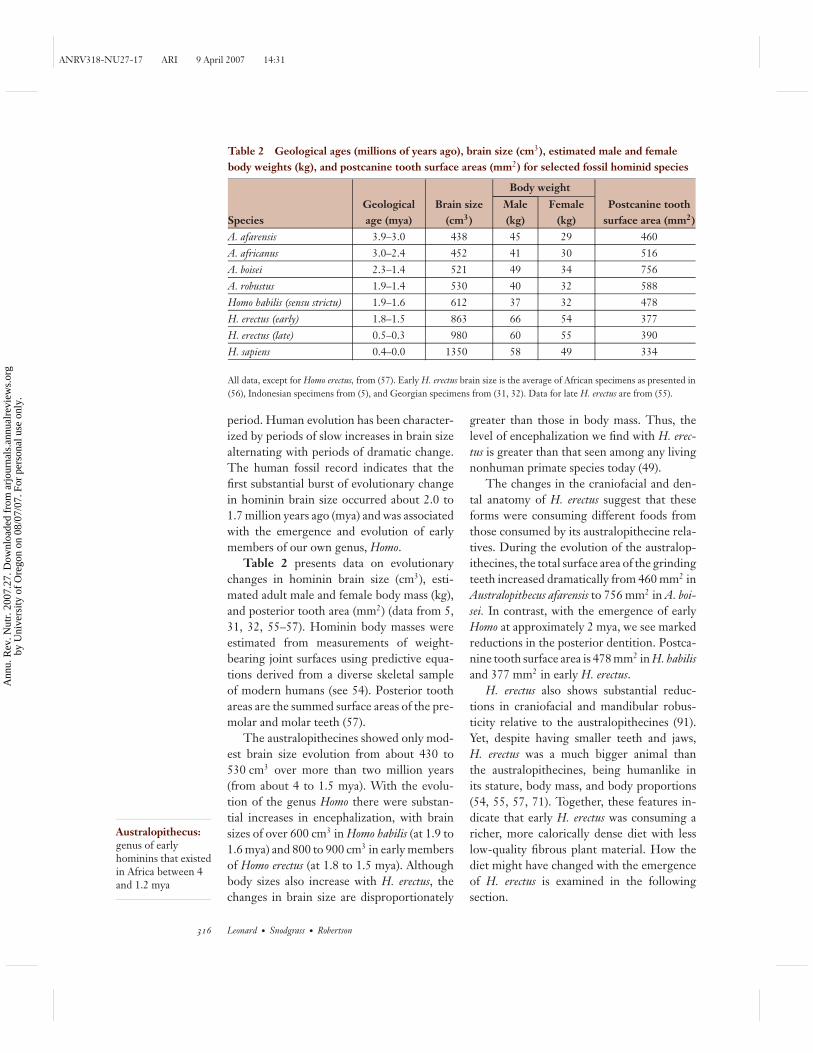
Table 2 Geological ages (millions of years ago), brain size (cm3), estimated male and femalebody weights (kg), and postcanine tooth surface areas (mm2) for selected fossil hominid species
Body weight
SpeciesGeologicalage (mya)
Brain size(cm3)
Male(kg)
Female(kg)
Postcanine toothsurface area (mm2)
A. afarensis 3.9–3.0 438 45 29 460A. africanus 3.0–2.4 452 41 30 516A. boisei 2.3–1.4 521 49 34 756A. robustus 1.9–1.4 530 40 32 588Homo habilis (sensu strictu) 1.9–1.6 612 37 32 478H. erectus (early) 1.8–1.5 863 66 54 377H. erectus (late) 0.5–0.3 980 60 55 390H. sapiens 0.4–0.0 1350 58 49 334
All data, except for Homo erectus, from (57). Early H. erectus brain size is the average of African specimens as presented in(56), Indonesian specimens from (5), and Georgian specimens from (31, 32). Data for late H. erectus are from (55).
Australopithecus:genus of earlyhominins that existedin Africa between 4and 1.2 mya
period. Human evolution has been character-ized by periods of slow increases in brain sizealternating with periods of dramatic change.The human fossil record indicates that thefirst substantial burst of evolutionary changein hominin brain size occurred about 2.0 to1.7 million years ago (mya) and was associatedwith the emergence and evolution of earlymembers of our own genus, Homo.
Table 2 presents data on evolutionarychanges in hominin brain size (cm3), esti-mated adult male and female body mass (kg),and posterior tooth area (mm2) (data from 5,31, 32, 55–57). Hominin body masses wereestimated from measurements of weight-bearing joint surfaces using predictive equa-tions derived from a diverse skeletal sampleof modern humans (see 54). Posterior toothareas are the summed surface areas of the pre-molar and molar teeth (57).
The australopithecines showed only mod-est brain size evolution from about 430 to530 cm3 over more than two million years(from about 4 to 1.5 mya). With the evolu-tion of the genus Homo there were substan-tial increases in encephalization, with brainsizes of over 600 cm3 in Homo habilis (at 1.9 to1.6 mya) and 800 to 900 cm3 in early membersof Homo erectus (at 1.8 to 1.5 mya). Althoughbody sizes also increase with H. erectus, thechanges in brain size are disproportionately
greater than those in body mass. Thus, thelevel of encephalization we find with H. erec-tus is greater than that seen among any livingnonhuman primate species today (49).
The changes in the craniofacial and den-tal anatomy of H. erectus suggest that theseforms were consuming different foods fromthose consumed by its australopithecine rela-tives. During the evolution of the australop-ithecines, the total surface area of the grindingteeth increased dramatically from 460 mm2 inAustralopithecus afarensis to 756 mm2 in A. boi-sei. In contrast, with the emergence of earlyHomo at approximately 2 mya, we see markedreductions in the posterior dentition. Postca-nine tooth surface area is 478 mm2 in H. habilisand 377 mm2 in early H. erectus.
H. erectus also shows substantial reduc-tions in craniofacial and mandibular robus-ticity relative to the australopithecines (91).Yet, despite having smaller teeth and jaws,H. erectus was a much bigger animal thanthe australopithecines, being humanlike inits stature, body mass, and body proportions(54, 55, 57, 71). Together, these features in-dicate that early H. erectus was consuming aricher, more calorically dense diet with lesslow-quality fibrous plant material. How thediet might have changed with the emergenceof H. erectus is examined in the followingsection.
316 Leonard · Snodgrass · Robertson
Ann
u. R
ev. N
utr.
200
7.27
. Dow
nloa
ded
from
arj
ourn
als.
annu
alre
view
s.or
gby
Uni
vers
ity o
f O
rego
n on
08/
07/0
7. F
or p
erso
nal u
se o
nly.
ANRV318-NU27-17 ARI 9 April 2007 14:31
Dietary Changes Associated withBrain Evolution in Early Homo
Increasing evidence suggests that the evolu-tion of early Homo, particularly H. erectus, wasassociated with important changes in forag-ing patterns and dietary consumption com-pared with earlier hominin species. Recentanalyses of dental microwear and stable car-bon isotope levels of tooth enamel indicatethat the australopithecines consumed a sea-sonally variable diet composed of both plant(e.g., fruits, seeds, grasses, and tubers) andsome animal foods (76, 77, 83). Earlier inter-pretations of the so-called “robust” australop-ithecines (A. robustus and A. boisei)—with theirmassive jaws, robust faces, and large molarteeth—viewed these species as being dietaryspecialists that subsisted largely on seeds, nuts,and other hard objects common to the Africansavanna. However, the isotopic analyses nowshow that their diets were likely broader andmore varied than previously thought (76, 77,87). The consumption by australopithecinesof limited quantities of animal foods (includ-ing invertebrates) is suggested by analogieswith living primates (especially chimpanzees)and supported by stable isotope studies and as-sociation with putative bone tools likely usedfor termite extraction (7).
Paleontological and archaeological evi-dence indicates modest dietary change in ear-liest Homo (i.e., H. habilis); this species likelyincorporated more animal foods in its diet, al-though the relative amounts obtained throughhunting compared with scavenging is debated(12, 13, 36, 65). Evidence for dietary changein this species can be seen in the reducedmasticatory functional complex (e.g., poste-rior tooth size); dental reduction in H. ha-bilis reversed successive increases in cheektooth size among the australopithecines (57).Technological advancements, such as the de-velopment of Oldowan industry tools, al-lowed easier processing of vertebrate car-casses and increased access to meat as well asenergy- and nutrient-rich marrow and brains(74).
Oldowan: the firststone tooltechnology in thehuman fossil record,characterized bysimple flakes andchoppers. Firstevidentapproximately2.5 mya
The evolution of H. erectus appears to be amajor adaptive shift in human evolution. Withthe emergence of H. erectus in East Africa1.8 mya we find (a) marked increases in brainand body size, (b) reductions of posterior toothsize and craniofacial robusticity, (c) the evo-lution of humanlike limb proportions, and(d ) important changes in foraging/subsistencebehavior (2, 4, 91, 92). These changes oc-curred within the context of large-scale cli-matic shifts (88, 95). The environment wasbecoming much drier, resulting in declines inforested areas and an expansion of open wood-lands and grasslands (14, 26, 68, 95). Sucha transformation of the African landscapewould have strongly influenced the distribu-tion of food resources for our hominin ances-tors, making animal foods more abundant andthus an increasingly attractive food resource(9, 65). Using modern tropical ecosystems asour reference, we have found that althoughsavanna/grasslands have much lower net pri-mary (energetic) productivity than woodlands(4050 versus 7200 kcal/m2/yr), the level ofherbivore productivity in savannas is almostthree times that of the woodlands (10.2 ver-sus 3.6 kcal/m2/yr) (50). Thus, fundamentalchanges in ecosystem structure 2.0 to 1.8 myaappear to have resulted in a net increase inthe energetic abundance of grazing mammals(e.g., ungulates) on the E. African landscape.Such an increase would have offered an oppor-tunity for hominins with sufficient behavioraland technological capability to exploit thoseresources.
The archeological record provides evi-dence that this occurred with H. erectus, asthis species is associated with stone toolsand the development of the first rudimen-tary hunting and gathering economy. Meatdoes appear to have been more commonin the diet of H. erectus than it was in theaustralopithecines. H. erectus likely acquiredmammalian carcasses through both huntingand confrontational scavenging (i.e., allow-ing other animal hunters to make the kill andthen chasing them away from the carcass) (18,65). In addition, the archaeological evidence
www.annualreviews.org • Brain Evolution and Human Metabolic Needs 317
Ann
u. R
ev. N
utr.
200
7.27
. Dow
nloa
ded
from
arj
ourn
als.
annu
alre
view
s.or
gby
Uni
vers
ity o
f O
rego
n on
08/
07/0
7. F
or p
erso
nal u
se o
nly.
ANRV318-NU27-17 ARI 9 April 2007 14:31
Acheulean: stonetool industry of theearly and middlePleistocenecharacterized byhand axes andcleavers. Firstevident 1.6 to1.4 mya, associatedwith early Homo
DHA:docosahexaenoic acid
AA: arachidonic acid
indicates that butchered animals were trans-ported back to a central location (home base)where the resources were shared within for-aging groups (18, 36, 66, 67). Increasinglysophisticated stone tools (i.e., the Acheuleanindustry) emerged approximately 1.6 to1.4 mya, improving the ability of these ho-minins to process animal and plant materials(6). These changes in diet and foraging behav-ior would not have turned our hominin ances-tors into carnivores; however, the addition ofeven modest amounts of meat to the diet (10%to 20% of dietary energy) combined with thesharing of resources that is typical of hunter-gatherer groups would have significantly in-creased the quality and stability of the diet ofH. erectus.
Cordain and colleagues (22) have notedthat beyond the energetic benefits, greaterconsumption of animal foods would have pro-vided increased levels of key fatty acids thatwould have been necessary for supporting therapid hominin brain evolution. Mammalianbrain growth is dependent upon sufficientamounts of two long-chain polyunsaturatedfatty acids: docosahexaenoic acid (DHA) andarachidonic acid (AA) (22, 24). Because thecomposition of all mammalian brain tissue issimilar with respect to these two fatty acids,species with higher levels of encephalizationhave greater requirements for DHA and AA(24). It also appears that mammals have a lim-ited capacity to synthesize these fatty acidsfrom dietary precursors. Consequently, di-etary sources of DHA and AA were likely lim-iting nutrients that constrained the evolution
of larger brain size in many mammalian lin-eages (23, 24).
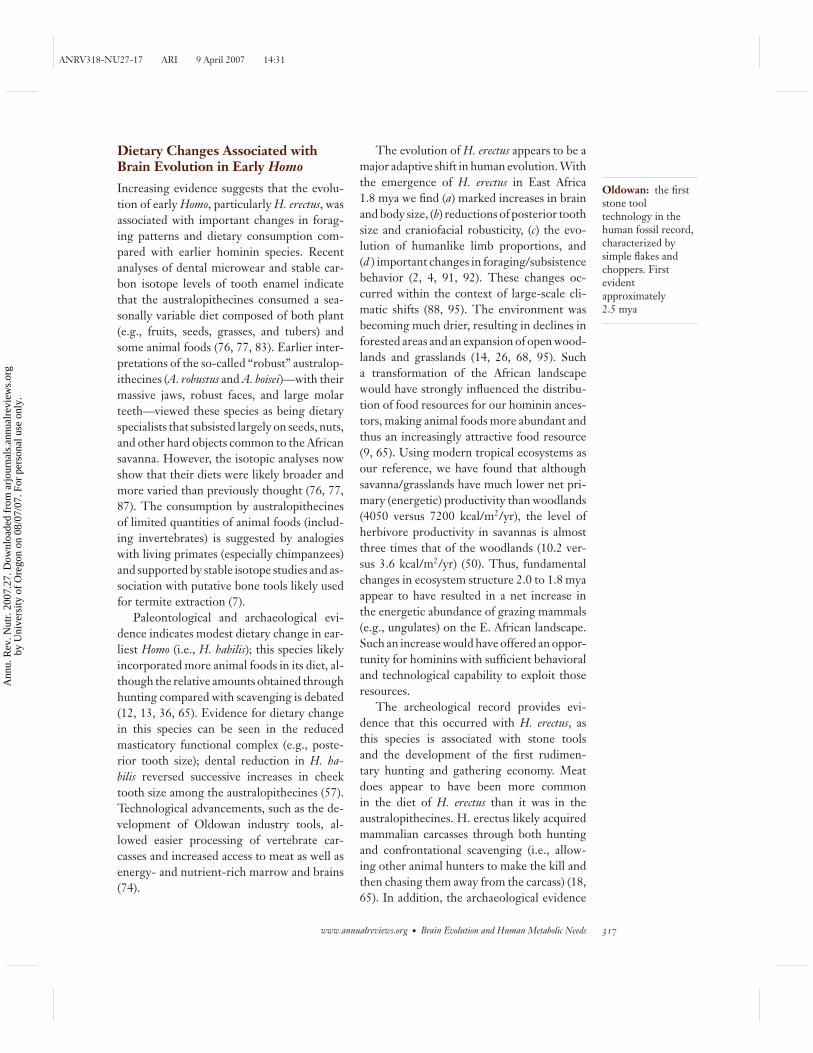
Cordain and colleagues (22) have demon-strated that wild plant foods available on theAfrican savanna (e.g., tubers, nuts) contain, atmost, trace amounts of AA and DHA, whereasmuscle tissue and organ meat of wild Africanruminants provide moderate to high levels ofthese key fatty acids. As shown in Table 3,brain tissue is a rich source of both AA andDHA, whereas liver and muscle tissues aregood sources of AA and moderate sources ofDHA. Other good sources of AA and DHAare freshwater fish and shellfish (17, 22, 24).Cunnane and colleagues (17, 25) have sug-gested that the major increases in hominin en-cephalization were associated with systematicuse of aquatic (marine, riverine, or lacustrian)resources. However, there is little archeolog-ical evidence for the systematic use of aquaticresources until much later in human evolution(45).
An alternative strategy for increasing di-etary quality in early Homo has been pro-posed by Wrangham and colleagues (93,94). These authors argue that the controlleduse of fire for cooking allowed early Homoto improve the nutritional density of theirdiet. They note that the cooking of savannatubers and other plant foods would haveserved to both soften them and increase theirenergy/nutrient bioavailability. In their rawform, the starch in roots and tubers is notabsorbed in the small intestine and is passedthrough the body as nondigestible carbohy-drate (30, 82). However, when heated, the
Table 3 Energy (kcal), fat (g), protein (g), arachidonic acid (AA), and docosahexaenoic acid (DHA)contents of African ruminant, fish, and wild plant foods per 100 grams. Data derived from (22)
Food item Energy (kcal) Fat (g) Protein (g) AA (mg) DHA (mg)African ruminant (brain) 126 9.3 9.8 533 861African ruminant (liver) 159 7.1 22.6 192 41African ruminant (muscle) 113 2.1 22.7 152 10African ruminant (fat) 745 82.3 1.0 20–180 traceAfrican fish 119 4.5 18.8 270 549Wild tuber/roots 96 0.5 2.0 0 0Mixed wild plants 129 2.8 4.1 0 0
318 Leonard · Snodgrass · Robertson
Ann
u. R
ev. N
utr.
200
7.27
. Dow
nloa
ded
from
arj
ourn
als.
annu
alre
view
s.or
gby
Uni
vers
ity o
f O
rego
n on
08/
07/0
7. F
or p
erso
nal u
se o
nly.
ANRV318-NU27-17 ARI 9 April 2007 14:31
starch granules swell and are disrupted fromthe cell walls. This process, known as gela-tinization, makes the starch much more ac-cessible to breakdown by digestive enzymes(34). Thus, cooking increases the nutritionalquality of tubers by making more of thecarbohydrate energy available for biologicalprocesses.
Although cooking, which served to in-crease dietary digestibility and quality, isclearly an important innovation in homininevolution, there is very limited evidence forthe controlled use of fire by hominins before1.5 mya (11, 15, 64). The more widely heldview is that the use of fire and cooking didnot occur until later in human evolution, at200,000 to 250,000 years ago (80, 90). More-over, nutritional analyses of wild tubers usedby modern foraging populations (e.g., 16, 73,89) suggest that the energy content of theseresources is markedly lower than that of ani-mal foods, even after cooking (22). Unlike ani-mal foods, tubers are also devoid of both DHAand AA (22; see Table 3). Consequently, ma-jor questions remain about whether cookingand the heavy reliance on roots and tuberswere important forces for promoting rapidbrain evolution with the emergence of earlyHomo.
Overall, the available evidence seems tobest support a mixed dietary strategy in earlyHomo that involved the consumption of largeramounts of animal foods in comparison withthe australopithecines. Ungar and colleagues(87) recently suggested that early Homo likelypursued a flexible and versatile subsistencestrategy that would have allowed them toadapt to the patchy and seasonally variabledistribution of food resources on the Africansavanna. They note that such a model is moreplausible than are ones proposing heavy re-liance on one particular type of resource (e.g.,meat or tubers). This is indeed true; how-ever, what appears to be happening with earlyHomo—especially with H. erectus—is the de-velopment of a more stable and effective wayof extracting resources from the environment.The increase in dietary quality and stability
was likely achieved partly through changes indiet composition (22, 49) and partly throughsocial and behavioral changes like food shar-ing and perhaps division of foraging tasks (36,38, 41). This greater nutritional stability pro-vided a critical foundation for fueling the en-ergy demands of larger brain sizes.
BRAIN EVOLUTION ANDHUMAN BODY COMPOSITION
In addition to improvements in dietary qual-ity, the increased metabolic cost of largerbrain size in human evolution also appearsto have been supported by changes in bodycomposition. Humans allocate a substantiallylarger share of their daily energy budgetto their brains than do other primates orother mammals, which implies that the sizeand metabolic demands of certain other or-gans/organ systems may be relatively reducedin humans compared with other species.Thus, the critical question is, which organshave been reduced or altered in their rel-ative size over the course of human evolu-tion to compensate for the expansion of brainsize?
Analyses of human and primate body com-position offer possible answers to this ques-tion. Aiello (1) and Aiello & Wheeler (3) haveargued that the increased energy demands ofthe human brain were accommodated by thereduction in size of the GI tract. Since theintestines are similar to the brain in havingvery high energy demands (so-called expen-sive tissues), the reduction in size of the largeintestines of humans relative to other primatesis thought to provide the necessary energy“savings” required to support elevated brainmetabolism. Aiello & Wheeler (3) have shownthat among a sample of 18 primate species (in-cluding humans), increased brain size was as-sociated with reduced gut size. However, re-cent analyses by Snodgrass et al. (75) havefailed to demonstrate significant differencesin GI size between primates and nonprimatemammals that are predicted from the expen-sive tissue hypothesis. Thus, while it is clear
www.annualreviews.org • Brain Evolution and Human Metabolic Needs 319
Ann
u. R
ev. N
utr.
200
7.27
. Dow
nloa
ded
from
arj
ourn
als.
annu
alre
view
s.or
gby
Uni
vers
ity o
f O
rego
n on
08/
07/0
7. F
or p
erso
nal u
se o
nly.
ANRV318-NU27-17 ARI 9 April 2007 14:31
that humans have relatively small GI sizes fortheir body mass, questions remain about theextent to which reductions in GI size helpedto balance the increased metabolic costs as-sociated with expansion of brain size duringthe course of human evolution. The reducedGI size in humans instead may be the directconsequence of improvements in DQ over thecourse of human evolution.
Leonard and colleagues (51) and Kuzawa(46) have suggested that differences in mus-cle and fat mass between humans and otherprimates may also account for variation inthe budgeting of metabolic energy. Relativeto other primates and other mammals, hu-mans have lower levels of muscle mass andhigher levels of body fatness (46, 51, 65). Therelatively high levels of adiposity in humanshave two important metabolic implicationsfor brain metabolism. First, because fat haslower energy requirements than that of mus-cle tissue, replacing muscle mass with fat massresults in energy savings that can be allocatedto the brain. Additionally, fat provides a readysource of stored energy that can be drawnupon during periods of limited food availabil-ity. Consequently, the higher levels of bodyfat in humans may also help to support largerbrain size by providing stored energy to bufferagainst environmental fluctuations in nutri-tional resources.
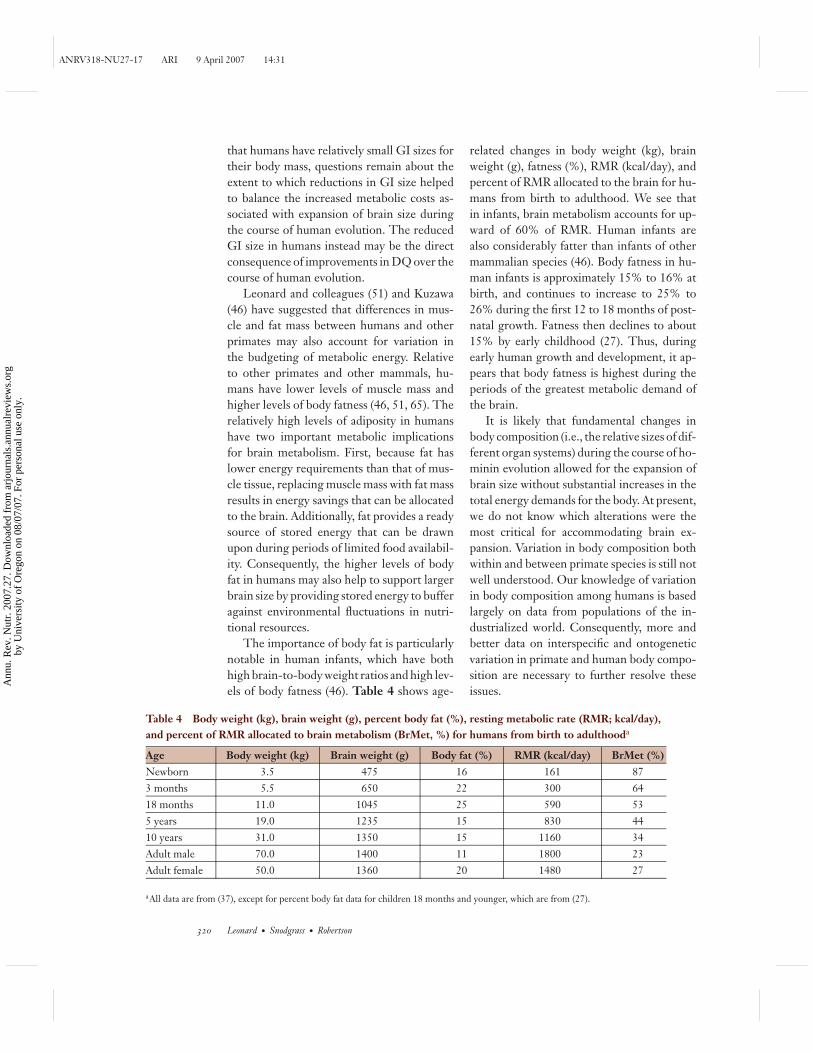
The importance of body fat is particularlynotable in human infants, which have bothhigh brain-to-body weight ratios and high lev-els of body fatness (46). Table 4 shows age-
related changes in body weight (kg), brainweight (g), fatness (%), RMR (kcal/day), andpercent of RMR allocated to the brain for hu-mans from birth to adulthood. We see thatin infants, brain metabolism accounts for up-ward of 60% of RMR. Human infants arealso considerably fatter than infants of othermammalian species (46). Body fatness in hu-man infants is approximately 15% to 16% atbirth, and continues to increase to 25% to26% during the first 12 to 18 months of post-natal growth. Fatness then declines to about15% by early childhood (27). Thus, duringearly human growth and development, it ap-pears that body fatness is highest during theperiods of the greatest metabolic demand ofthe brain.
It is likely that fundamental changes inbody composition (i.e., the relative sizes of dif-ferent organ systems) during the course of ho-minin evolution allowed for the expansion ofbrain size without substantial increases in thetotal energy demands for the body. At present,we do not know which alterations were themost critical for accommodating brain ex-pansion. Variation in body composition bothwithin and between primate species is still notwell understood. Our knowledge of variationin body composition among humans is basedlargely on data from populations of the in-dustrialized world. Consequently, more andbetter data on interspecific and ontogeneticvariation in primate and human body compo-sition are necessary to further resolve theseissues.
Table 4 Body weight (kg), brain weight (g), percent body fat (%), resting metabolic rate (RMR; kcal/day),and percent of RMR allocated to brain metabolism (BrMet, %) for humans from birth to adulthooda
Age Body weight (kg) Brain weight (g) Body fat (%) RMR (kcal/day) BrMet (%)Newborn 3.5 475 16 161 873 months 5.5 650 22 300 6418 months 11.0 1045 25 590 535 years 19.0 1235 15 830 4410 years 31.0 1350 15 1160 34Adult male 70.0 1400 11 1800 23Adult female 50.0 1360 20 1480 27
aAll data are from (37), except for percent body fat data for children 18 months and younger, which are from (27).
320 Leonard · Snodgrass · Robertson
Ann
u. R
ev. N
utr.
200
7.27
. Dow
nloa
ded
from
arj
ourn
als.
annu
alre
view
s.or
gby
Uni
vers
ity o
f O
rego
n on
08/
07/0
7. F
or p
erso
nal u
se o
nly.
ANRV318-NU27-17 ARI 9 April 2007 14:31
New imaging techniques such as mag-netic resonance imaging and positron emis-sion tomography scans offer the potential todirectly explore variation in organ weight andorgan-specific energy demands in living hu-mans and primates. For example, Gallagheret al. (33) recently used magnetic resonanceimaging technology to measure how differ-ences in organ weights contribute to eth-nic differences in RMRs among living hu-mans. These authors demonstrated that thesignificant differences in RMR between theirAfrican American and Euro-American sam-ples could be accounted for by differences inthe summed weight of the most metabolicallyexpensive organs (liver, heart, spleen, kidneys,and brain). Similarly, Chugani (19) utilizedpositron emission tomography scans to quan-tify changes in glucose utilization in the hu-man brain from birth to adulthood. His find-ings suggest that the extremely high metaboliccosts of brain metabolism characteristic ofearly human life (as outlined in Table 4) mayextend further into childhood than previouslyrealized. Together, these studies highlight thepotential use of new imaging techniques forbetter understanding how interspecific varia-tion in body composition contributes to dif-ferences in metabolic rate.
CONCLUSIONS
The evolution of large human brain size hashad important implications for the nutritionalbiology of our species. Our large brains are en-ergetically expensive, yet, paradoxically, ouroverall metabolic requirements are similar tothose of any comparably sized mammal. Asa consequence, humans expend a relativelylarger proportion of their resting energy bud-get on brain metabolism than do other pri-mates or nonprimate mammals.
Comparative analyses of primate dietarypatterns indicate that the high costs of largehuman brains are supported, in part, by di-ets that are relatively rich in energy and othernutrients. Among living primates, the relativeproportion of metabolic energy allocated to
the brain is positively correlated with dietaryquality. Humans fall at the positive end of thisrelationship, having both a very high-qualitydiet and a large brain.
Greater encephalization also appears tohave consequences for other aspects of bodycomposition, most notably the GI mass, mus-cularity, and adiposity. Relative to other pri-mates, human have smaller GI tracts and arelatively reduced colon. This type of gut isconsistent with adaptation to a diet that is rel-atively high in energy and nutrients and is easyto digest.
In addition, humans appear to be relativelyundermuscled (i.e., less skeletal muscle) andover fat compared with other primates of sim-ilar size. The relatively high levels of adipos-ity in humans are particularly notable in in-fancy. These greater levels of body fatness andreduced levels of muscle mass allow humaninfants to accommodate the growth of theirlarge brains in two important ways: (a) by hav-ing a ready supply of stored energy to feed thebrain and (b) by reducing the total energy costsof the rest of the body.
The human fossil record indicates that ma-jor changes in both brain size and diet oc-curred in association with the emergence ofearly members of the genus Homo between2.0 and 1.7 mya in Africa. With the evolutionof early H. erectus 1.8 mya, we find evidenceof an important adaptive shift—the evolu-tion of the first hunting and gathering econ-omy, characterized by greater consumption ofanimal foods, transport of food resources tohome bases, and sharing of food within socialgroups. H. erectus was humanlike in body sizeand proportions and had a brain size beyondthat seen in nonhuman primates, approach-ing the range of modern humans. In addition,the reduced size of the face and grinding teethof H. erectus, coupled with its more sophisti-cated tool technology, suggest that these ho-minins were consuming a higher quality andmore stable diet that would have helped to fuelthe increases in brain size. Consequently, al-though dietary change was not the prime forceresponsible for the evolution of large human
www.annualreviews.org • Brain Evolution and Human Metabolic Needs 321
Ann
u. R
ev. N
utr.
200
7.27
. Dow
nloa
ded
from
arj
ourn
als.
annu
alre
view
s.or
gby
Uni
vers
ity o
f O
rego
n on
08/
07/0
7. F
or p
erso
nal u
se o
nly.
ANRV318-NU27-17 ARI 9 April 2007 14:31
brain size, improvements in dietary qualityappear to have been a necessary conditionfor promoting encephalization in the humanlineage.
Further research is needed to better under-stand the nature of the dietary changes that
took place with emergence of Homo. In addi-tion, the application of new biomedical imag-ing techniques offers the potential to directlyexplore how intra- and interspecific variationin body composition may contribute to varia-tion in metabolic rates.
SUMMARY POINTS
1. Our large brains are energetically expensive, yet paradoxically our overall metabolicrequirements are similar to those of any comparably sized mammal. Consequently,humans expend a relatively larger proportion of their resting energy budget on brainmetabolism than do other primates or nonprimate mammals.
2. Comparative analyses of living primate species show that the relative proportion ofmetabolic energy allocated to the brain is positively correlated with dietary quality.Humans fall at the positive end of this relationship, having both a very high-qualitydiet and a large brain. This suggests that large human brains are supported, in part,by diets that are relatively rich in energy and other nutrients.
3. Compared with other primates, humans have smaller overall gastrointestinal tractswith a relatively reduced colon. This type of gut is consistent with adaptation to a dietthat is relatively high in energy and nutrients and is easy to digest.
4. Humans have relatively lower levels of muscularity and higher levels of adiposity thando other primates of similar size. High levels of adiposity in humans are particularlynotable in infancy. Greater body fatness and lower muscle mass allow human infantsto accommodate the growth of their large brains by having a ready supply of storedenergy, reducing the total energy costs of the rest of the body.
5. The human fossil record indicates that major changes in both brain size and dietoccurred in association with the emergence of early members of the genus Homo be-tween 2.0 and 1.7 mya in Africa. With the evolution of early H. erectus 1.8 mya, wefind evidence of an important adaptive shift—the evolution of the first hunting andgathering economy, characterized by greater consumption of animal foods, transportof food resources to home bases, and sharing of food within social groups. Improve-ments in diet quality with H. erectus appear to have been important for fueling rapidsrates of encephalization.
6. Consumption of more animal foods with early Homo was likely important for providinghigh levels of key long-chain polyunsaturated fatty acids (docosahexaenoic acid andarachidonic acid) that are necessary for brain growth.
ACKNOWLEDGMENTS
We are grateful to S.C. Anton and C.W. Kuzawa for discussions about this research.
LITERATURE CITED
1. Posits that thehigh metaboliccosts of largehuman brains havebeen partially offsetby the reductionsin the size of ourgastrointestinaltracts.
1. Aiello LC. 1997. Brains and guts in human evolution: the expensive tissue hypoth-esis. Braz. J. Genet. 20:141–48
322 Leonard · Snodgrass · Robertson
Ann
u. R
ev. N
utr.
200
7.27
. Dow
nloa
ded
from
arj
ourn
als.
annu
alre
view
s.or
gby
Uni
vers
ity o
f O
rego
n on
08/
07/0
7. F
or p
erso
nal u
se o
nly.
ANRV318-NU27-17 ARI 9 April 2007 14:31
2. Aiello LC, Key C. 2002. Energetic consequences of being a Homo erectus female. Am. J.Hum. Biol. 14:551–65
3. Aiello LC, Wheeler P. 1995. The expensive-tissue hypothesis: the brain and the digestivesystem in human and primate evolution. Curr. Anthropol. 36:199–221
4. Anton SC. 2003. A natural history of Homo erectus. Yrbk. Phys. Anthropol. 46:126–705. Anton SC, Swisher CC III. 2001. Evolution of cranial capacity in Asian Homo erectus.
In A Scientific Life: Papers in Honor of Dr. T. Jacob, ed. E Indriati, pp. 25–39. Yogyakarta,Indonesia: Bigraf
6. Asfaw B, Beyene Y, Suwa G, Walter RC, White TD, et al. 1992. The earliest Acheuleanfrom Konso-Gardula. Nature 360:732–35
7. Backwell LR, d’Errico F. 2001. Evidence of termite foraging by Swartkrans early hominids.Proc. Nat. Acad. Sci. USA 98:1358–63
8. Bauchot R, Stefan H. 1969. Encephalisation et niveau evolutif ches les simiens. Mammalia33:225–75
9. Behrensmeyer K, Todd NE, Potts R, McBrinn GE. 1997. Late Pliocene faunal turnoverin the Turkana basin, Kenya and Ethiopia. Science 278:1589–94
10. Bell RH. 1971. A grazing ecosystem in the Serengeti. Sci. Am. 225(1):86–9311. Bellomo RV. 1994. Methods of determining early hominid behavioral activities associated
with the controlled use of fire at FxJj 20 Main, Koobi Fora. J. Hum. Evol. 27:173–9512. Blumenschine RJ. 1987. Characteristics of the early hominid scavenging niche. Curr. An-
thropol. 28:383–40713. Blumenschine RJ, Cavallo JA, Capaldo SD. 1994. Competition for carcasses and early
hominid behavioral ecology: a case study and conceptual framework. J. Hum. Evol. 27:197–213
14. Bobe R, Behrensmeyer AK. 2002. Faunal change, environmental variability and latePliocene hominin evolution. J. Hum. Evol. 42:475–97
15. Brain CK, Sillen A. 1988. Evidence from the Swartkrans cave for the ealiest use of fire.Nature 336:464–66
16. Brand-Miller JC, Holt SHA. 1998. Australian aboriginal plant foods: a consideration oftheir nutritional composition and health implications. Nutr. Res. Rev. 11:5–23
17. Broadhurst CL, Cunnane SC, Crawford MA. 1998. Rift Valley lake fish and shellfishprovided brain-specific nutrition for early Homo. Br. J. Nutr. 79:3–21
18. Bunn HT. 2006. Meat made us human. In Evolution of the Human Diet: The Known, theUnknown, and the Unknowable, ed. PS Unger, pp. 191–211. New York: Oxford Univ. Press
19. Chugani HT. 1998. A critical period of brain development: studies of cerebral glucoseutilization with PET. Prevent. Med. 27:184–88
20. Cordain L, Brand-Miller J, Eaton SB, Mann N, Holt SHA, Speth JD. 2000. Plant to animalsubsistence ratios and macronutrient energy estimations in world-wide hunter-gathererdiets. Am. J. Clin. Nutr. 71:682–92
21. Cordain L, Eaton SB, Sebastian A, Mann N, Lindberg S, et al. 2005. Origins and evolutionof the Western diet: health implications for the 21st century. Am. J. Clin. Nutr. 81:341–54
22. Cordain L, Watkins BA, Mann NJ. 2001. Fatty acid composition and energy density offoods available to African hominids. World Rev. Nutr. Diet. 90:144–61
23. Crawford MA. 1992. The role of dietary fatty acids in biology: their place in the evolutionof the human brain. Nutr. Rev. 50:3–11
24. Crawford MA, Bloom M, Broadhurst CL, Schmidt WF, Cunnane SC, et al. 1999. Evidencefor unique function of docosahexaenoic acid during the evolution of the modern humanbrain. Lipids 34:S39–47
www.annualreviews.org • Brain Evolution and Human Metabolic Needs 323
Ann
u. R
ev. N
utr.
200
7.27
. Dow
nloa
ded
from
arj
ourn
als.
annu
alre
view
s.or
gby
Uni
vers
ity o
f O
rego
n on
08/
07/0
7. F
or p
erso
nal u
se o
nly.
ANRV318-NU27-17 ARI 9 April 2007 14:31
25. Cunnane SC, Crawford MA. 2003. Survival of the fattest: fat babies were the key toevolution of the large human brain. Comp. Biochem. Physiol. A 136:17–26
26. deMenocal PB. 2004. African climate change and faunal evolution during the Pliocene-Pleistocene. Earth Planet. Sci. Lett. 220:3–24
27. Dewey KG, Heinig MJ, Nommsen LA, Peerson JM, Lonnerdal B. 1993. Breast-fed infantsare leaner than formula-fed infants at 1 year of age: the Darling Study. Am. J. Clin. Nutr.52:140–45
28. Eaton SB. 2006. The ancestral human diet: What was it and should it be a paradigm forcontemporary nutrition? Proc. Nutr. Soc. 65:1–6
29. One of the firstpapers to considerhuman nutritionfrom anevolutionaryperspective. Arguesthat many oftoday’s commondiseases stem fromdiets that differfrom those of ourprehistoricancestors.
29. Eaton SB, Konner MJ. 1985. Paleolithic nutrition: a consideration of its nature andcurrent implications. New Engl. J. Med. 312:283–89
30. Englyst KN, Englyst HN. 2005. Carbohydrate bioavailability. Br. J. Nutr. 94:1–1131. Gabunia L, Vekua A, Lordkipanidze D, Swisher CC, Ferring R, et al. 2000. Earliest Pleis-
tocene cranial remains from Dmanisi, Republic of Georgia: taxonomy, geological setting,and age. Science 288:1019–25
32. Gabunia L, Anton SC, Lordkipanidze D, Vekua A, Justus A, Swisher CC III. 2001. Dmanisiand dispersal. Evol. Anthropol. 10:158–70
33. Gallagher D, Albu J, He Q, Heshka S, Boxt L, et al. 2006. Small organs with a highmetabolic rate explain lower resting energy expenditure in African American than in whiteadults. Am. J. Clin. Nutr. 83:1062–67
34. Garcıa-Alonso A, Goni I. 2000. Effect of processing on potato starch: in vitro availabilityand glycemic index. Nahrung 44:19–22
35. Garn SM, Leonard WR. 1989. What did our ancestors eat? Nutr. Rev. 47:337–4536. Harris JWK, Capaldo S. 1993. The earliest stone tools: their implications for an un-
derstanding of the activities and behavior of late Pliocene hominids. In The Use of Toolsby Human and Nonhuman Primates, ed. A Berthelet, J Chavaillon, pp. 196–220. Oxford:Oxford Sci.
37. Holliday MA. 1986. Body composition and energy needs during growth. In Human Growth:A Comprehensive Treatise, Volume 2, ed. F. Falkner, JM Tanner, pp. 101–17, New York:Plenum. 2nd ed.
38. Isaac GL. 1978. Food sharing and human evolution: archaeological evidence from thePlio-Pleistocene of East Africa. J. Anthropol. Res. 34:311–25
39. Jarman PJ. 1974. The social organization of antelope in relation to their ecology. Behaviour58:215–67
40. Jerison HJ. 1973. The Evolution of the Brain and Intelligence. New York: Academic41. Kaplan H, Hill K, Lancaster J, Hurtado AM. 2000. A theory of life history evolution: diet,
intelligence and longevity. Evol. Anthropol. 9:156–8542. Kappeler PM. 1996. Causes and consequences of life-history variation among strepsirhine
primates. Am. Nat. 148:868–9143. Kety SS. 1957. The general metabolism of the brain in vivo. In Metabolism of the Central
Nervous System, ed. D Richter, pp. 221–37. New York: Pergammon44. Kleiber M. 1961. The Fire of Life. New York: Wiley45. Klein RG. 1999. The Human Career: Human Biological and Cultural Origins. Chicago: Univ.
Chicago Press. 2nd ed.
46. Demonstratesthe adaptive valueof body fat inhuman infants forbuffering againstdisease andsupporting thehigh energeticcosts of large,growing brains.
46. Kuzawa CW. 1998. Adipose tissue in human infancy and childhood: an evolutionaryperspective. Yrbk. Phys. Anthropol. 41:177–209
47. Uses anenergeticsapproach forunderstandingmajor trends inhuman evolution,such as bipedality,encephalization,and the expansionof hominins fromAfrica.
47. Leonard WR. 2002. Food for thought: dietary change was a driving force in humanevolution. Sci. Am. 287(6):106–15
324 Leonard · Snodgrass · Robertson
Ann
u. R
ev. N
utr.
200
7.27
. Dow
nloa
ded
from
arj
ourn
als.
annu
alre
view
s.or
gby
Uni
vers
ity o
f O
rego
n on
08/
07/0
7. F
or p
erso
nal u
se o
nly.
ANRV318-NU27-17 ARI 9 April 2007 14:31
48. Leonard WR, Robertson ML. 1992. Nutritional requirements and human evolution: abioenergetics model. Am. J. Hum. Biol. 4:179–95
49. Leonard WR, Robertson ML. 1994. Evolutionary perspectives on human nutrition: theinfluence of brain and body size on diet and metabolism. Am. J. Hum. Biol. 6:77–88
50. Leonard WR, Robertson ML. 1997. Comparative primate energetics and hominid evolu-tion. Am. J. Phys. Anthropol. 102:265–81
51. Leonard WR, Robertson ML, Snodgrass JJ, Kuzawa CW. 2003. Metabolic correlates ofhominid brain evolution. Comp. Biochem. Physiol. A 135:5–15
52. Synthesizesresearch onprimate and humanevolution, drawingon a rich body ofcomparative dataon primate biology.
52. Martin RD. 1989. Primate Origins and Evolution: A Phylogenetic Reconstruction.Princeton, NJ: Princeton Univ. Press
53. Martin RD, Chivers DJ, MacLarnon AM, Hladik CM. 1985. Gastrointestinal allometryin primates and other mammals. In Size and Scaling in Primate Biology, ed. WL Jungers,pp. 61–89. New York: Plenum
54. McHenry HM. 1992. Body size and proportions in early hominids. Am. J. Phys. Anthropol.87:407–31
55. McHenry HM. 1994a. Tempo and mode in human evolution. Proc. Natl. Acad. Sci. USA91:6780–86
56. McHenry HM. 1994b. Behavioral ecological implications of early hominid body size.J. Hum. Evol. 27:77–87
57. McHenry HM, Coffing K. 2000. Australopithecus to Homo: transformations in body andmind. Annu. Rev. Anthropol. 29:125–46
58. McNab BK, Wright PC. 1987. Temperature regulation and oxygen consumption in thePhilippine tarsier Tarsius syrichta. Physiol. Zoo. 60:596–600
59. Milton K. 1987. Primate diets and gut morphology: implications for hominid evolution.In Food and Evolution: Toward a Theory of Human Food Habits, ed. M Harris, EB Ross,pp. 93–115. Philadelphia, PA: Temple Univ. Press
60. Examines theevolution ofprimate and humandiets, drawing oncomparativestudies of primateecology.
60. Milton K. 1993. Diet and primate evolution. Sci. Am. 269(2):86–9361. Milton K. 1999. A hypothesis to explain the role of meat-eating in human evolution. Evol.
Anthropol. 8:11–2162. Milton K. 2003. The critical role played by animal source foods in human (Homo) evolution.
J. Nutr. 133:3886–92S63. Milton K, Demment MW. 1988. Digestion and passage kinetics of chimpanzees fed high-
and low-fiber diets and comparison with human data. J. Nutr. 118:1082–8864. Pennisi E. 1999. Did cooked tubers spur the evolution of big brains?Science 283:2004–
565. Plummer T. 2004. Flaked stones and old bones: biological and cultural evolution at the
dawn of technology. Yrbk. Phys. Anthropol. 47:118–6466. Potts R. 1988. Early Hominid Activities at Olduvai. New York: Aldine67. Potts R. 1998. Environmental hypotheses of hominin evolution. Yrbk. Phys. Anthropol.
41:93–13668. Reed K. 1997. Early hominid evolution and ecological change through the African Plio-
Pleistocene. J. Hum. Evol. 32:289–32269. Richard AF. 1985. Primates in Nature. New York: Freeman70. Rowe N. 1996. The Pictorial Guide to Living Primates. New York: Pogonias71. Ruff CB, Trinkaus E, Holliday TW. 1997. Body mass and encephalization in Pleistocene
Homo. Nature 387:173–7672. Sailer LD, Gaulin SJC, Boster JS, Kurland JA. 1985. Measuring the relationship between
dietary quality and body size in primates. Primates 26:14–27
www.annualreviews.org • Brain Evolution and Human Metabolic Needs 325
Ann
u. R
ev. N
utr.
200
7.27
. Dow
nloa
ded
from
arj
ourn
als.
annu
alre
view
s.or
gby
Uni
vers
ity o
f O
rego
n on
08/
07/0
7. F
or p
erso
nal u
se o
nly.
ANRV318-NU27-17 ARI 9 April 2007 14:31
73. Schoeninger MJ, Bunn HT, Murray SS, Marlett JA. 2001. Nutritional composition ofsome wild plant foods and honey used by Hadza foragers of Tanzania. J. Food Comp. Anal.14:3–13
74. Semaw S, Rogers MJ, Quade J, Renne PR, Butler RF, et al. 2003. 2.6-million-year-oldstone tools and associated bones from OGS-6 and OGS-7, Gona, Afar, Ethiopia. J. Hum.Evol. 45:169–77
75. Snodgrass JJ, Leonard WR, Robertson ML. 2007. Energetics of encephalization in earlyhominids. In The Evolution of Hominid Diets: Integrating Approaches to the Study of PalaeolithicSubsistence, ed. M Richards, JJ Hublin. New York: Springer. In press
76. Sponheimer M, Lee-Thorp J, de Ruiter DJ, Codron D, Codron J, et al. 2005. Hominins,sedges, and termites: new carbon isotope data from Sterkfontein valley and Kruger Na-tional Park. J. Hum. Evol. 48:301–12
77. Sponheimer M, Passey BH, de Ruiter DJ, Guatelli-Steinberg D, Cerling TE, Lee-ThorpJA. 2006. Isotopic evidence for dietary variability in the early hominin Paranthropus robustus.Science 314:980–82
78. Stanford CB. 1996. The hunting ecology of wild chimpanzees: implications for the evo-lutionary ecology of Pliocene hominids. Am. Anthropol. 98:96–113
79. Stephan H, Frahm H, Baron G. 1981. New and revised data on volumes of brain structuresin insectivores and primates. Folia Primatol. 35:1–29
80. Straus LG. 1989. On early hominid use of fire. Curr. Anthropol. 30:488–9181. Sussman RW. 1987. Species-specific dietary patterns in primates and human dietary adap-
tations. In Evolution of Human Behavior: Primate Models, ed. W Kinzey, pp. 151–79. Albany,NY: SUNY Press
82. Tagliabue A, Raben A, Heijnen ML, Duerenberg P, Pasquali E, Astrup A. 1995. Theeffect of raw potato starch on energy expenditure and substrate oxidation. Am. J. Clin.Nutr. 61:1070–75
83. Teaford MF, Ungar PS. 2000. Diet and the evolution of the earliest human ancestors. Proc.Natl. Acad. Sci. USA 97:13506–11
84. Teleki G. 1981. The omnivorous diet and eclectic feeding habits of the chimpanzees ofGombe National Park. In Omnivorous Primates, ed. RSO Harding, G Teleki, pp. 303–43.New York: Columbia Univ. Press
85. Thompson SD, Power ML, Rutledge CE, Kleiman DG. 1994. Energy metabolism andthermoregulation in the golden lion tamarin (Leontopithecus rosalia). Folia Primatol. 63:131–43
86. Provides anauthoritativeoverview ofresearch on humannutritionalevolution from thefields ofpaleontology,archaeology,primatology andcomparative humanbiology.
86. Ungar PS, ed. 2007. Evolution of the Human Diet: The Known, the Unknown, and the
Unknowable. New York: Oxford Univ. Press87. Ungar PS, Grine FE, Teaford MF. 2006. Diet in early Homo: a review of the evidence and
a new model of adaptive versatility. Annu. Rev. Anthropol. 35:209–2888. Vrba ES. 1995. The fossil record of African antelopes relative to human evolution. In
Paleoclimate and Evolution, With Emphasis on Human Origins, ed. ES Vrba, GH Denton,TC Partridge, LH Burkle, pp. 385–424. New Haven, CT: Yale Univ. Press
89. Wehmeyer AS, Lee RB, Whiting M. 1969. The nutrient composition and dietary im-portance of some vegetable foods eaten by the !Kung bushmen. S. Afr. Med. J. 95:1529–30
90. Weiner S, Qunqu X, Goldberg P, Liu J, Bar-Yosef O. 1998. Evidence for the use of fire atZhoukoudian, China. Science 281:251–53
91. Wolpoff MH. 1999. Paleoanthropology. Boston: McGraw-Hill. 2nd ed.92. Wood B, Collard M. 1999. The human genus. Science 284:65–71
326 Leonard · Snodgrass · Robertson
Ann
u. R
ev. N
utr.
200
7.27
. Dow
nloa
ded
from
arj
ourn
als.
annu
alre
view
s.or
gby
Uni
vers
ity o
f O
rego
n on
08/
07/0
7. F
or p
erso
nal u
se o
nly.
ANRV318-NU27-17 ARI 9 April 2007 14:31
93. Wrangham RW, Conklin-Brittain NL. 2003. Cooking as a biological trait. Comp. Biochem.Physiol. A Mol. Integr. Physiol. 136:35–46
94. Wrangham RW, Jones JH, Laden G, Pilbeam D, Conklin-Brittain NL. 1999. The rawand the stolen: cooking and the ecology of human origins. Curr. Anthropol. 40:567–94
95. Wynn JG. 2004. Influence of Plio-Pleistocene aridification on human evolution: evidencefrom paleosols from the Turkana Basin, Kenya. Am. J. Phys. Anthropol. 123:106–18
www.annualreviews.org • Brain Evolution and Human Metabolic Needs 327
Ann
u. R
ev. N
utr.
200
7.27
. Dow
nloa
ded
from
arj
ourn
als.
annu
alre
view
s.or
gby
Uni
vers
ity o
f O
rego
n on
08/
07/0
7. F
or p
erso
nal u
se o
nly.
www.annualreviews.org ● Brain Evolution and Human Metabolic Needs C-1
2.001.501.000.500.00-0.50-1.00-1.50
Log Body Mass (kg)
3.50
3.00
2.50
2.00
1.50
1.00
0.50
Lo
g R
MR
(kc
al/d
ay)
Fit line for Totalhumansprimates
Figure 1
Log-Log plot of resting metabolic rate (RMR; kcal/day) versus body mass (kg) for 41 species ofprimates (including humans). Humans conform to the general primate scaling relationship [RMR � 55(Wt0.81)]. Adapted from Reference 51.
leonard.qxd 4/9/07 2:33 PM Page C-1
Ann
u. R
ev. N
utr.
200
7.27
. Dow
nloa
ded
from
arj
ourn
als.
annu
alre
view
s.or
gby
Uni
vers
ity o
f O
rego
n on
08/
07/0
7. F
or p
erso
nal u
se o
nly.
C-2 Leonard ● Snodgrass ● Robertson
6.005.004.003.002.001.000.00
Log RMR (kcal/day)
4.00
3.00
2.00
1.00
0.00
-1.00
Lo
g B
rain
Wei
gh
t (g
)
primatesnon-primate mammalshumansprimatesnon-primate mammals
Figure 2
Log-Log plot of brain weight (BW; g) versus resting metabolic rate (RMR) (kcal/day) for humans, 35other primate species, and 22 species of nonprimate mammals. The primate regression line (solid) is ele-vated systematically and significantly above the nonprimate mammal regression (dashed) (y-intercepts ��0.377primates, �0.832mammals; P � 0.01). The scaling relationships for nonprimate mammals areBW � 0.14 (RMR0.90); primates, BW � 0.42 (RMR0.94). Thus, for a given RMR, primates have brainsizes that are approximately three times those of other mammals, and humans have brains that are threetimes those of other primates.
leonard.qxd 4/9/07 2:33 PM Page C-2
Ann
u. R
ev. N
utr.
200
7.27
. Dow
nloa
ded
from
arj
ourn
als.
annu
alre
view
s.or
gby
Uni
vers
ity o
f O
rego
n on
08/
07/0
7. F
or p
erso
nal u
se o
nly.
www.annualreviews.org ● Brain Evolution and Human Metabolic Needs C-3
2.001.501.000.500.00-0.50-1.00-1.50
Log Body Mass (kg)
400
350
300
250
200
150
100
Die
t Q
ual
ity
Fit line for Totalhumansprimates
Figure 3
Plot of diet quality (DQ) versus log-body mass for 33 primate species. DQ is inversely related to bodymass (r � �0.59 total sample, �0.68 nonhuman primates only; P � 0.001), indicating that smaller pri-mates consume relatively higher-quality diets. Humans have systematically higher-quality diets thanpredicted for their size.
leonard.qxd 4/9/07 2:33 PM Page C-3
Ann
u. R
ev. N
utr.
200
7.27
. Dow
nloa
ded
from
arj
ourn
als.
annu
alre
view
s.or
gby
Uni
vers
ity o
f O
rego
n on
08/
07/0
7. F
or p
erso
nal u
se o
nly.
C-4 Leonard ● Snodgrass ● Robertson
43210-1-2-3
Relative Diet Quality (Z-score)
4
3
2
1
0
-1
-2
-3
Rel
ativ
eB
rain
Siz
e (Z
-sco
re)
Fit line for Totalhumansprimates
Figure 4
Plot of relative brain size versus relative diet quality for 33 primate species. Primates with higher-qualitydiets for their size have relatively larger brain size (r � 0.63; P � 0.001). Humans represent the positiveextremes for both measures, having large brain:body size and a substantially higher-quality diet than wouldbe expected for their size.
leonard.qxd 4/9/07 2:33 PM Page C-4
Ann
u. R
ev. N
utr.
200
7.27
. Dow
nloa
ded
from
arj
ourn
als.
annu
alre
view
s.or
gby
Uni
vers
ity o
f O
rego
n on
08/
07/0
7. F
or p
erso
nal u
se o
nly.